Article

Aid, Multidimensional Poverty and Growth: Reversing the Micro-Macro Paradox in Guinea, Liberia and Sierra Leone

by
José María Larrú
1,* and
Carlos Quesada González
2,3
1
Faculty of Economics and Business, Universidad San Pablo-CEU, 28003 Madrid, Spain
2
ImFINE Research Group, Health and Human Department, Universidad Politécnica de Madrid, 28040 Madrid, Spain
3
Departamento de Matemática Aplicada a las Tecnologías de la Información y la Comunicación, Universidad Politécnica de Madrid, 28031 Madrid, Spain
*
Author to whom correspondence should be addressed.
Land 2022, 11(1), 10; https://doi.org/10.3390/land11010010
Submission received: 19 November 2021 / Revised: 16 December 2021 / Accepted: 17 December 2021 / Published: 21 December 2021

Abstract

:
This article analyses whether Official Development Assistance (ODA) is linked to multidimensional poverty indicators in the context of the 2030 Agenda for Sustainable Development, the Sustainable Development Indictors and the principles stated by the Global Partnership for Effective Development Co-operation. Focused on three western Sub-Saharan Africa and least developing countries such as Guinea, Liberia and Sierra Leone, this article uses Error Correction Vector Model to estimate if ODA and economic growth are cointegrated and a sectoral and spatial analysis to check if ODA are linked to Multidimensional Poverty Indicators in the sample countries. Despite the 2014 Ebola outbreak, the three countries have achieved noticeable good results in poverty alleviation. Results shows a certain macro-micro paradox because, despite a common trend between aid and growth identified at the macro level, we cannot find any sign of ODA contributions to the multidimensional poverty indicators when the micro level analysis is carried out. Our results may serve to increase the level of implementation of the ownership principle for effective development co-operation and achieve a significant improvement of several goals and targets included on the 2030 Agenda.

1. Introduction

The aim of this article is to shed light on the effectiveness of Official Development Assistance (ODA) to reduce poverty. The 2030 Agenda for Sustainable Development has emphasized that people, prosperity, peace, planet, and partnerships are the “5 Ps” that summarize the framework under the Sustainable Development Goals, which should be reached for our world to be transformed. The opposite of prosperity is poverty (another “P”). The preamble of the Agenda clearly states: “We recognize that eradicating poverty in all its forms and dimensions, including extreme poverty, is the greatest global challenge and an indispensable requirement for sustainable development”. There are many ways and financial resources to reach this goal. Among others, economic growth and external flows such as ODA (or foreign aid) from donor countries to the most needy developing countries may be one of the more effective. However, are donors considering poverty “under its all forms and dimensions” as the real and main reason for allocating their ODA funds?
This knowledge gap deals with the following problems. First, multidimensional poverty data are only collected in the years in which each country conducts a household survey. This prevents a quantitative treatment through time series or balanced panel data, and cross-sectional comparison does not provide causal results1.
Second, aid amounts are not usually geolocated and the sector classification offered by OECD_DAC does not allow for subnational spatial allocation of ODA. Nor does it allow for the allocation of ODA from each sector to the areas of the country that suffer the highest rates of multidimensional poverty.
Third, donors do not make aid allocations taking into account only the poverty of the country, as it coexists with other motivations such as the commercial and geostrategic [1,2,3,4,5,6]. With the current data, there is no way to know how much aid has the real objective of reducing the different dimensions of poverty that affect each country.
Fourth, it seems more appropriate to study country cases of special relevance compared to a global analysis of all foreign aid in all recipient countries. Studies that have attempted to capture the effect of aid on economic development continue to offer mixed results ([7,8,9,10,11], for an updated review of the literature). Donors select their ODA allocation country by country or region, but not jointly to all candidate countries. In addition, it is convenient to select the most successful cases in multidimensional poverty reduction to try to know to what extent these achievements are the result of aid or not [12,13].
In this article we explore the question analyzing if ODA to Guinea, Liberia and Sierra Leone (three western Sub-Saharan and least developing countries) are linked. If this were not the case, it would suggest that statements and principles, such as those that appeared after the High Level Fora on Aid Effectiveness (Rome 2003, Paris 2005, Accra 2008 and Busan 2008),2 show a high level of rhetoric. After those Fora, a Global Partnership for Effective Development Co-operation was created. The aim of the partnership is to be a multi-stakeholder vehicle for driving development effectiveness, to “maximize the effectiveness of all forms of co-operation for development for the shared benefits of people, planet, prosperity and peace.” It brings together governments, bilateral and multilateral organizations, civil society, the private sector and representatives from parliaments and trade unions among others, who are committed to strengthening the effectiveness of their partnerships for development and the 2030 Agenda”. What are their results? Beyond their good statements on intents such as the Busan Partnership Agreement (2008), the Mexico Communique (2014), the Nairobi Outcome Document (2016) and the Co-Chair’s Statement on the Senior-Level Meeting (2019), is ODA really contributing to poverty eradication?
The 2030 Agenda for Sustainable Development emphasized the “catalytic” role of ODA to reach SGDs and their targets3. In this article we examine to what extent ODA can be linked to some SDGs that are associated with multidimensional poverty indicators.
We carry out our research in two levels. Firstly, in a macro level, we explore if ODA flows are cointegrated with total GDP and its components (private and government consumption, investments, exports and imports) in Guinea, Liberia and Sierra Leone. Secondly, in a micro level, we analyze if sectoral and more disaggregated ODA flows can explain why these countries have reached some of the most remarkable results in multidimensional poverty index (MPI) and in its ten components. The advantage of using these poverty measures is that its three dimensions (education, health and standard of living) and ten indicators are linked to SDGs 2 (zero hunger), SDG 3 (good health and well-being), SDG 4 (quality education), SDG 7 (renewable, affordable and clean energy), SDG 11 (sustainable cities and communities) and SDG 1 (no poverty).
We consider Guinea, Liberia and Sierra Leone for various reasons. Firstly, because they are underrepresented in the literature. Secondly, because they are least developing countries; 50% of the financial resources for development are ODA (Inter-Agency Task Force on Financing for Sustainable Development 2019 [14])4. Thirdly, despite suffering from the Ebola outbreak, they show remarkably positive results in poverty reduction.
According to UNDP’s report “Global Poverty Index 2020” [15], Sierra Leone was the country where multidimensional poverty was cut down the most between 2013 and 2017, even during the Ebola epidemic. The poverty headcount reached 74% in 2013 and was only 58% in 2017 [16]. The reductions in poverty components of cooking fuel and access to electricity were the main indicators that explain Sierra Leone’s success. Even more, Sierra Leone ranked first among the all countries that could reduce poverty in the cooking fuel component (−16%) and child mortality (−86%). Liberia ranked first in the access to assets indicator (−26.5% between 2007–2013) and Guinea in the living conditions of housing (−17.5% between 2012–2016) (UNDP & OPHI 2020:12[15], Figure 8). For all these reasons, we believe that these three countries deserve an in-depth analysis (Figure 1).
The hypothesis of this paper is that, conversely to the micro-macro paradox identified by Mosley (1986) [17], a macro-micro paradox might be detected, at least in these three Sub-Saharan countries. Mosley found that ODA flows might show positive results when the goals of the ODA projects were evaluated, but there was not any positive macro result when aid and growth were analysed. We believe that a positive cointegration may be detected between ODA and GDP (macro effect), but this result is not enough to show that ODA was an effective financial instrument to reduce multidimensional poverty when a sectorial and spatial analysis were carried out (meso or micro effect). In fact, the main findings of the paper are that, although a positive cointegration between ODA and GDP may be identified, ODA flows were not focused on the sectors that are more related to multidimensional poverty indicators and -at least in the case of Sierra Leone- neither on the districts where multidimensional poverty were higher.
It is worth bearing in mind that a macro predictive model between aid and growth is not our main interest. We do not want to offer policy measures based on past data, on how aid can increase economic growth. We are more interested in show how ODA flows and poverty indicators are linked, in the vein of the 2030 Agenda and Sustainable Development Goal 1 and target 1.2. “By 2030, reduce at least by half the proportion of men, women and children of all ages living in poverty in all its dimensions according to national definitions”. If poverty is multidimensional and ODA flows try to reduce poverty, how are they linked? Our results show that ODA is not been able to help reduce multidimensional poverty because it is not focused on it, neither geographically nor sectorally. The first principle of the Global Partnership for Effective Development Co-operation, ownership, is still rhetorical.
The paper is connected not only to the aid and growth literature in Sub-Saharan countries -either in a cross-countries framework [18,19,20] or case-studies [21,22]- but also, to the link between aid and multidimensional poverty [23,24] and to the methodological dialogue from micro to macro development [25].
The novelty of the paper is threefold. To our knowledge, this is the first time that (macro) Vector Error Correction Model (VECM) and cointegration analysis are carried out between ODA and GDP and its components for the three Sub-Saharan case studies. Second, a deep analysis for ODA flows and poverty indicators are carried out. Third, two different databases for ODA are used: the classical OECD-DAC (OECD 2021 [26]) and the AidData [27,28].

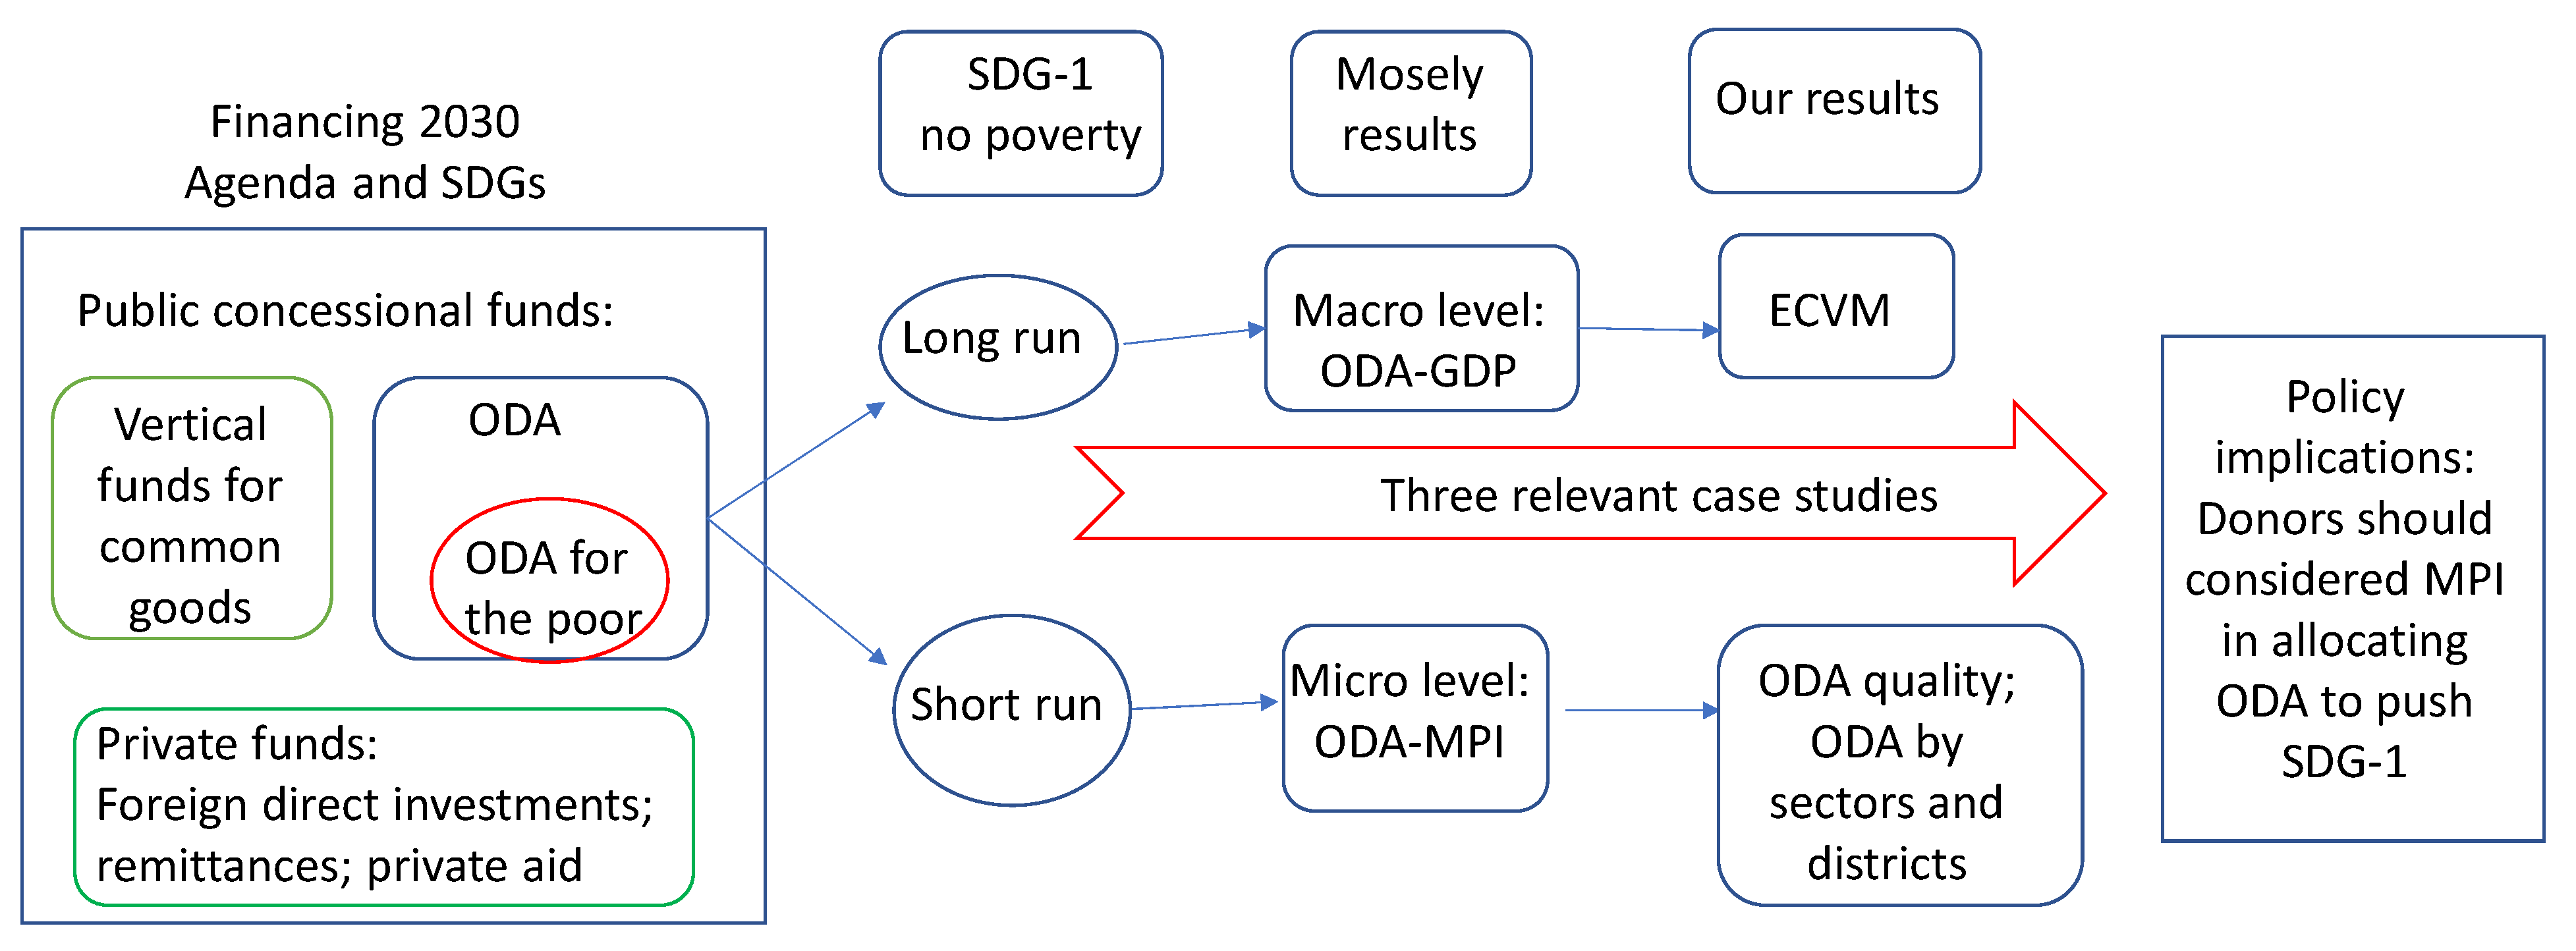
2. Materials and Methods

Our research strategy can be seen in Figure 2.

2.1. Brief Countries Features

Guinea, Liberia and Sierra Leone are remarkably underrepresented among the research carried out for African countries5. All of them are Least Developed Countries6, they rank very low in the human development index7 and they shared the Ebola’s outbreak in the recent past (2013–2017). They share frontiers and they belong to the African Union since 2001, the Economic Community of West African States (ECOWAS) economic agreement8 since 1975, but trade among them is quite low. They are countries rich in natural resources. Guinea possesses the world’s largest reserves of bauxite and largest untapped high-grade iron ore reserves, as well as gold and diamonds. Liberia main exports are iron ore, rubber, diamonds and gold. Sierra Leone is rich in diamond mining, iron ore, rutile and bauxite. These countries also have high levels of ethnic and linguistic fragmentation. The three of them have shown remarkable economic growth rates since the beginning of the 21st Century.
However, they are very different in some features: Guinea has 245,717 square kilometers and 12.5 million inhabitants, compared to 96,320 km2 of Liberia with 5.07 million population and 71,620 km2 of Sierra Leone with 6.6 million inhabitants. They also differ in their GDP per capita: USD 1532 in Liberia; USD 1702 Sierra Leone and USD 2557 in Guinea in 2018 (current PPP US Dollars).
Their economic structure is different as well (Table 1).
Sierra Leone’s main trade partners in 2017 were China (17% of total imports), India and Turkey (7% in both cases) whilst its main exports went to Netherlands (23%), China (13%) and Cote d’Ivoire (12%)9. Liberia and Guinea stand for less than 2% of Sierra Leone’s imports and exports10.
Guinea’s trade partners in 2015 were Ghana (22%), India (16%), the United Arab Emirates (10%), China (15%), the Netherlands (13%) and India (11%).
Their GDP growth has been unstable and remarkably dependent on the international prices of commodities (Figure 3).

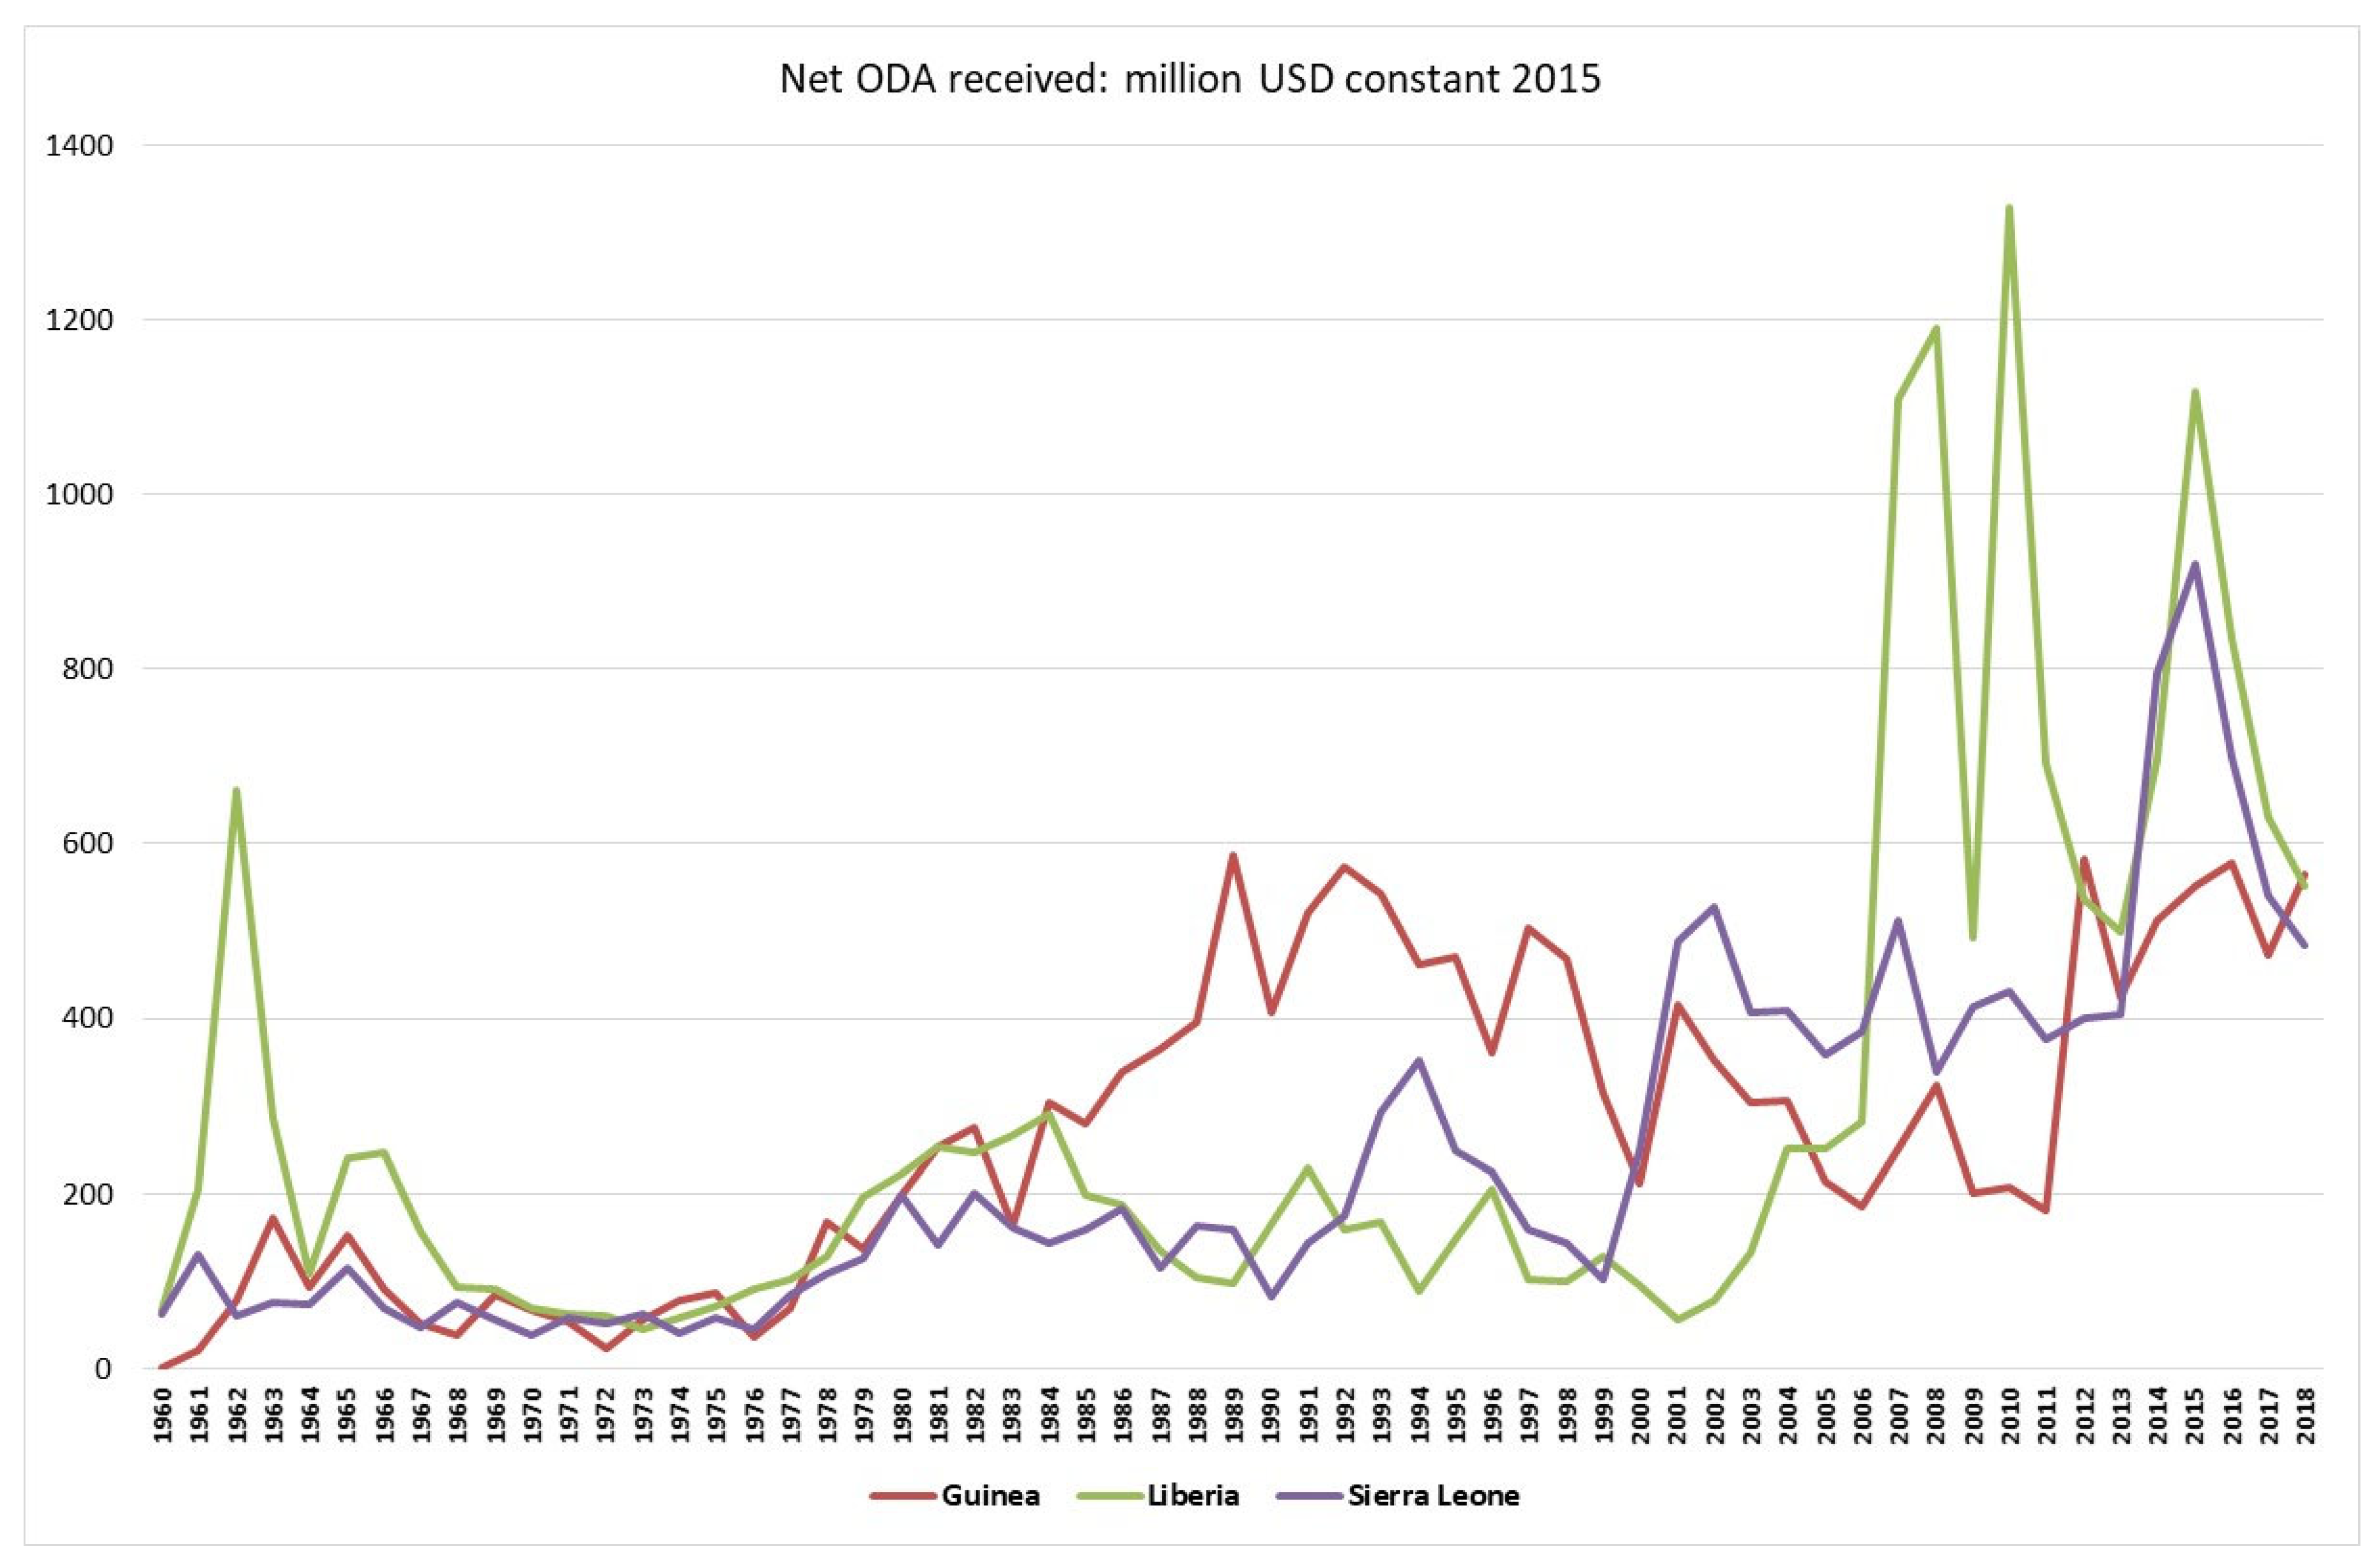
2.2. ODA to Guinea, Liberia and Sierra Leone

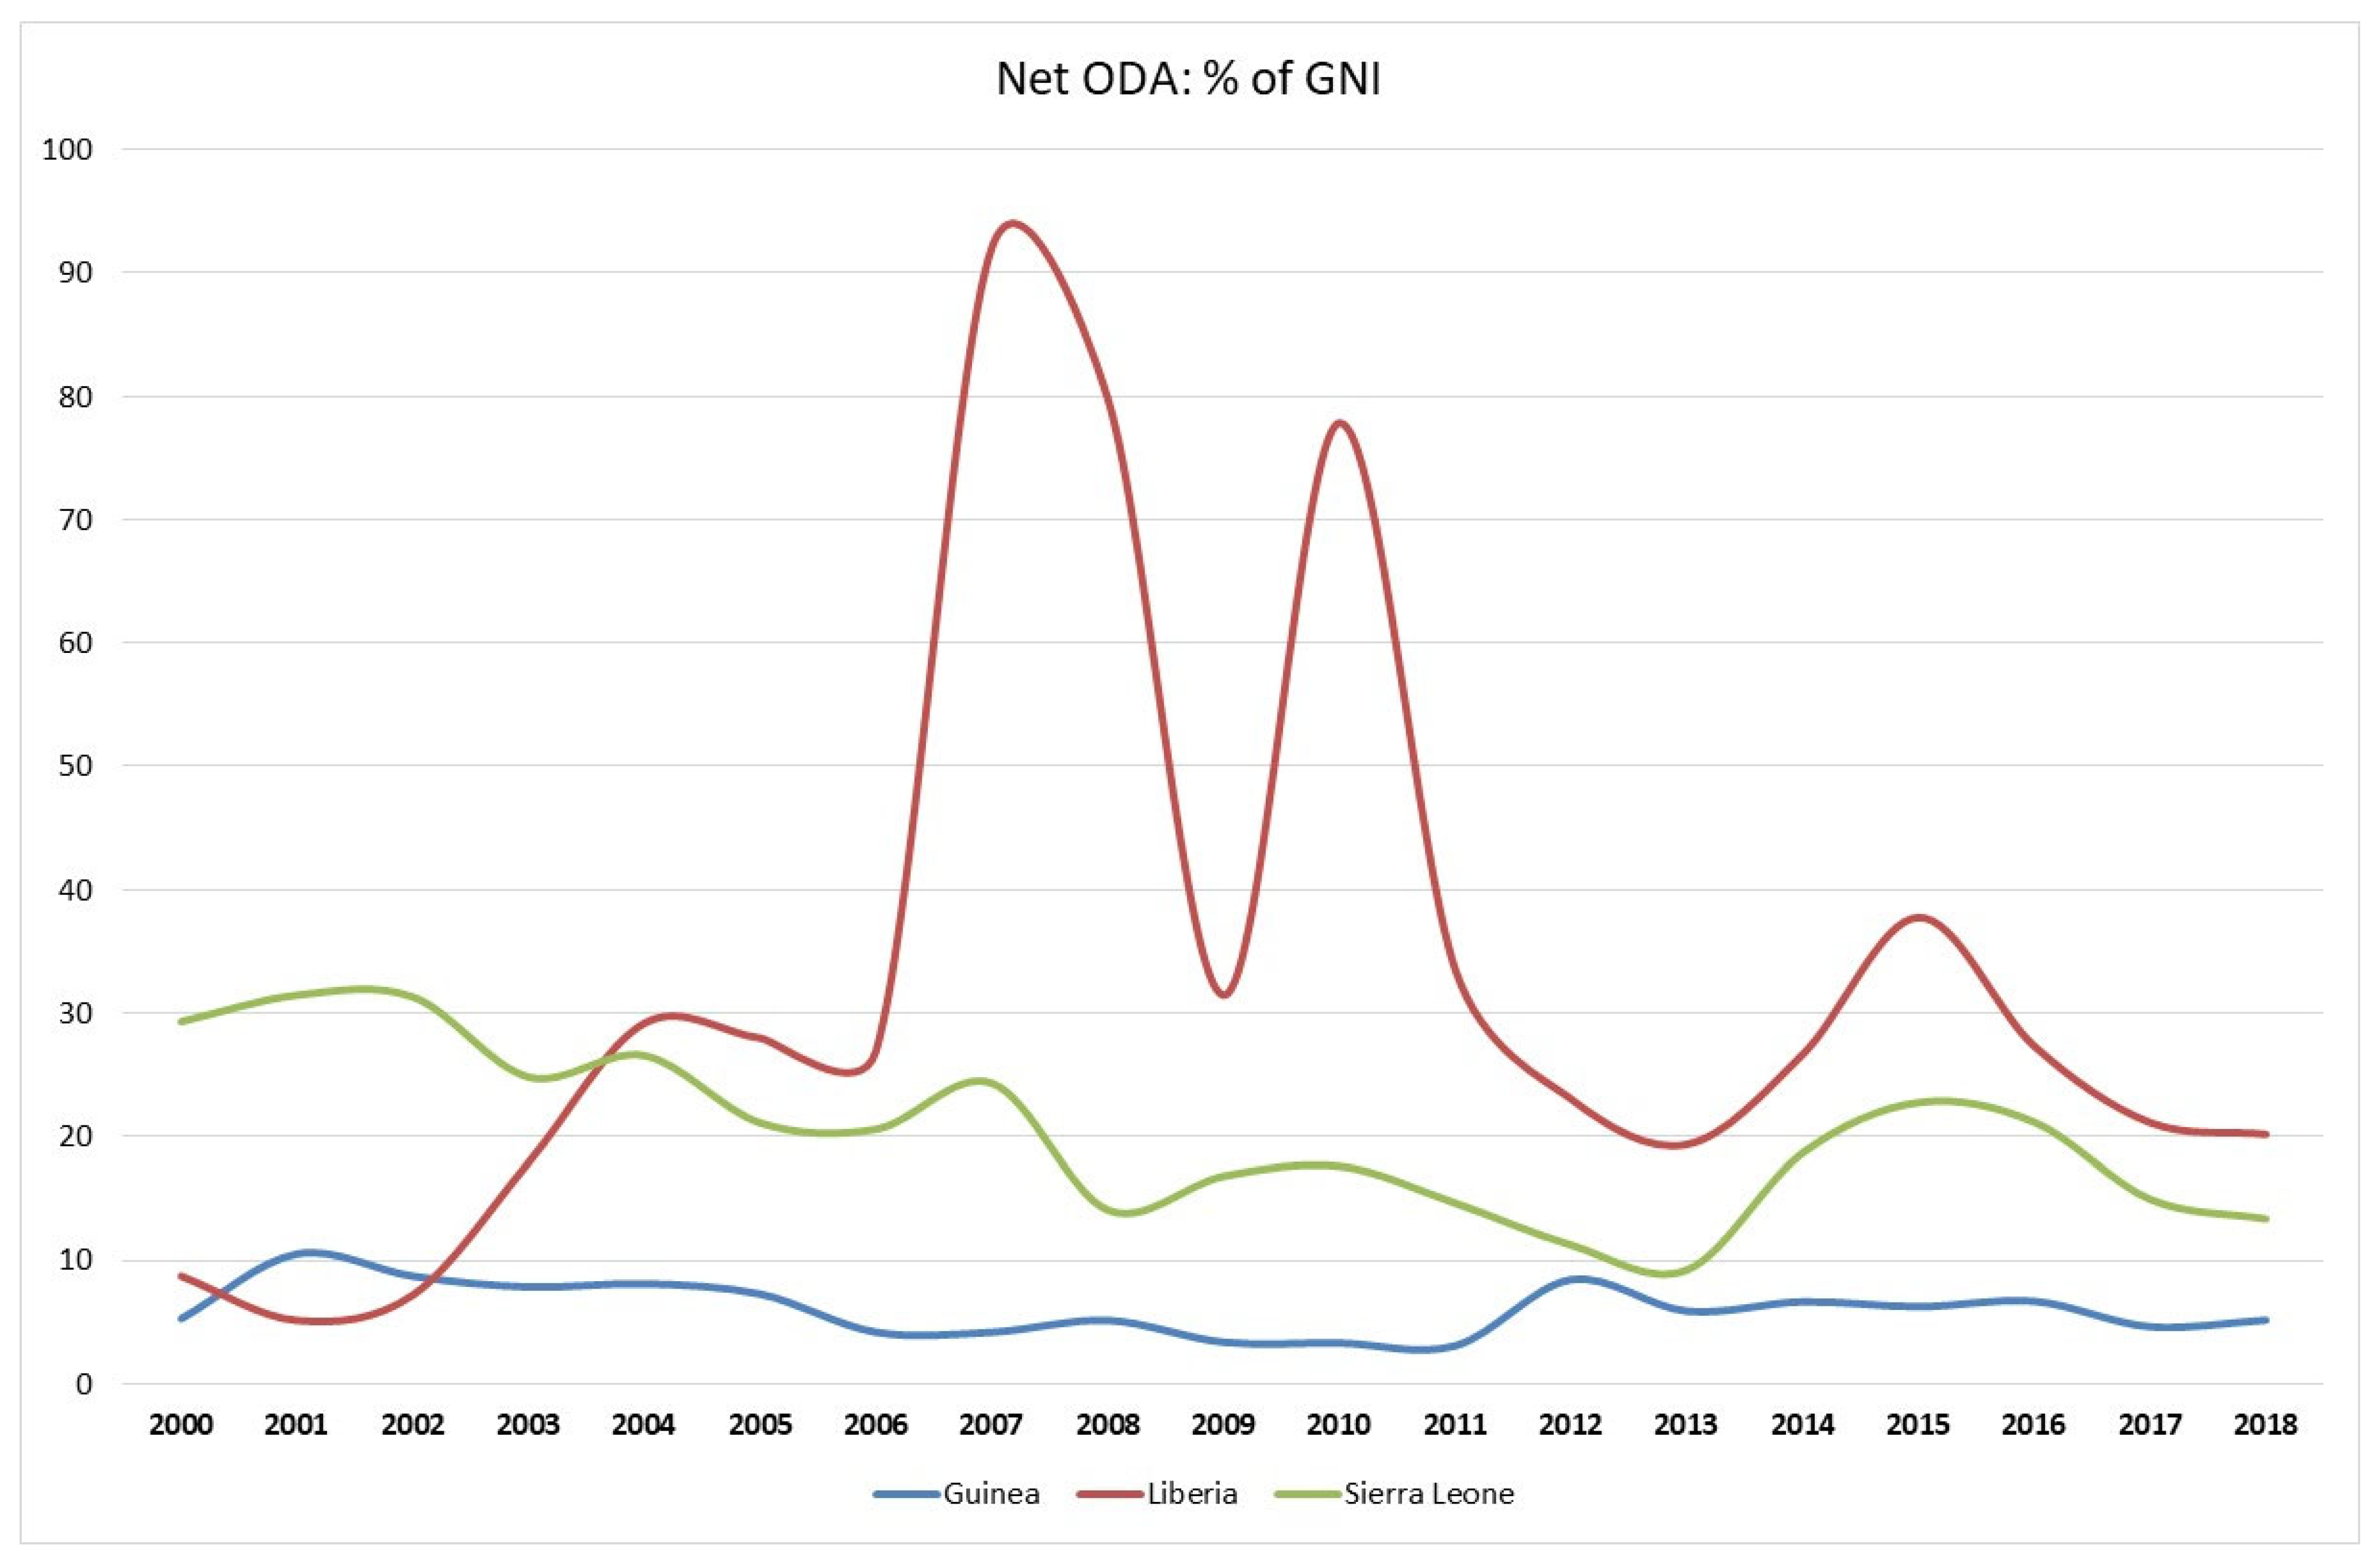
2.2.1. Net ODA Trends

As Figure 4 shows, ODA flows have diminished in recent decades and in relative terms (ODA to Liberia was 20.2% of GNI in 2018; and 13.3% to Sierra Leone, and 5.1% to Guinea).
Net ODA in constant dollars shows low levels until 1976 and a remarkable erratic trend since then (Figure 5).
The aim of this paper is to analyse if Official Development Assistance (ODA) is associated with these erratic trends of economic growth and, secondly, if ODA flows are associated with the reduction of the multidimensional poverty indicators recently experienced by these countries.

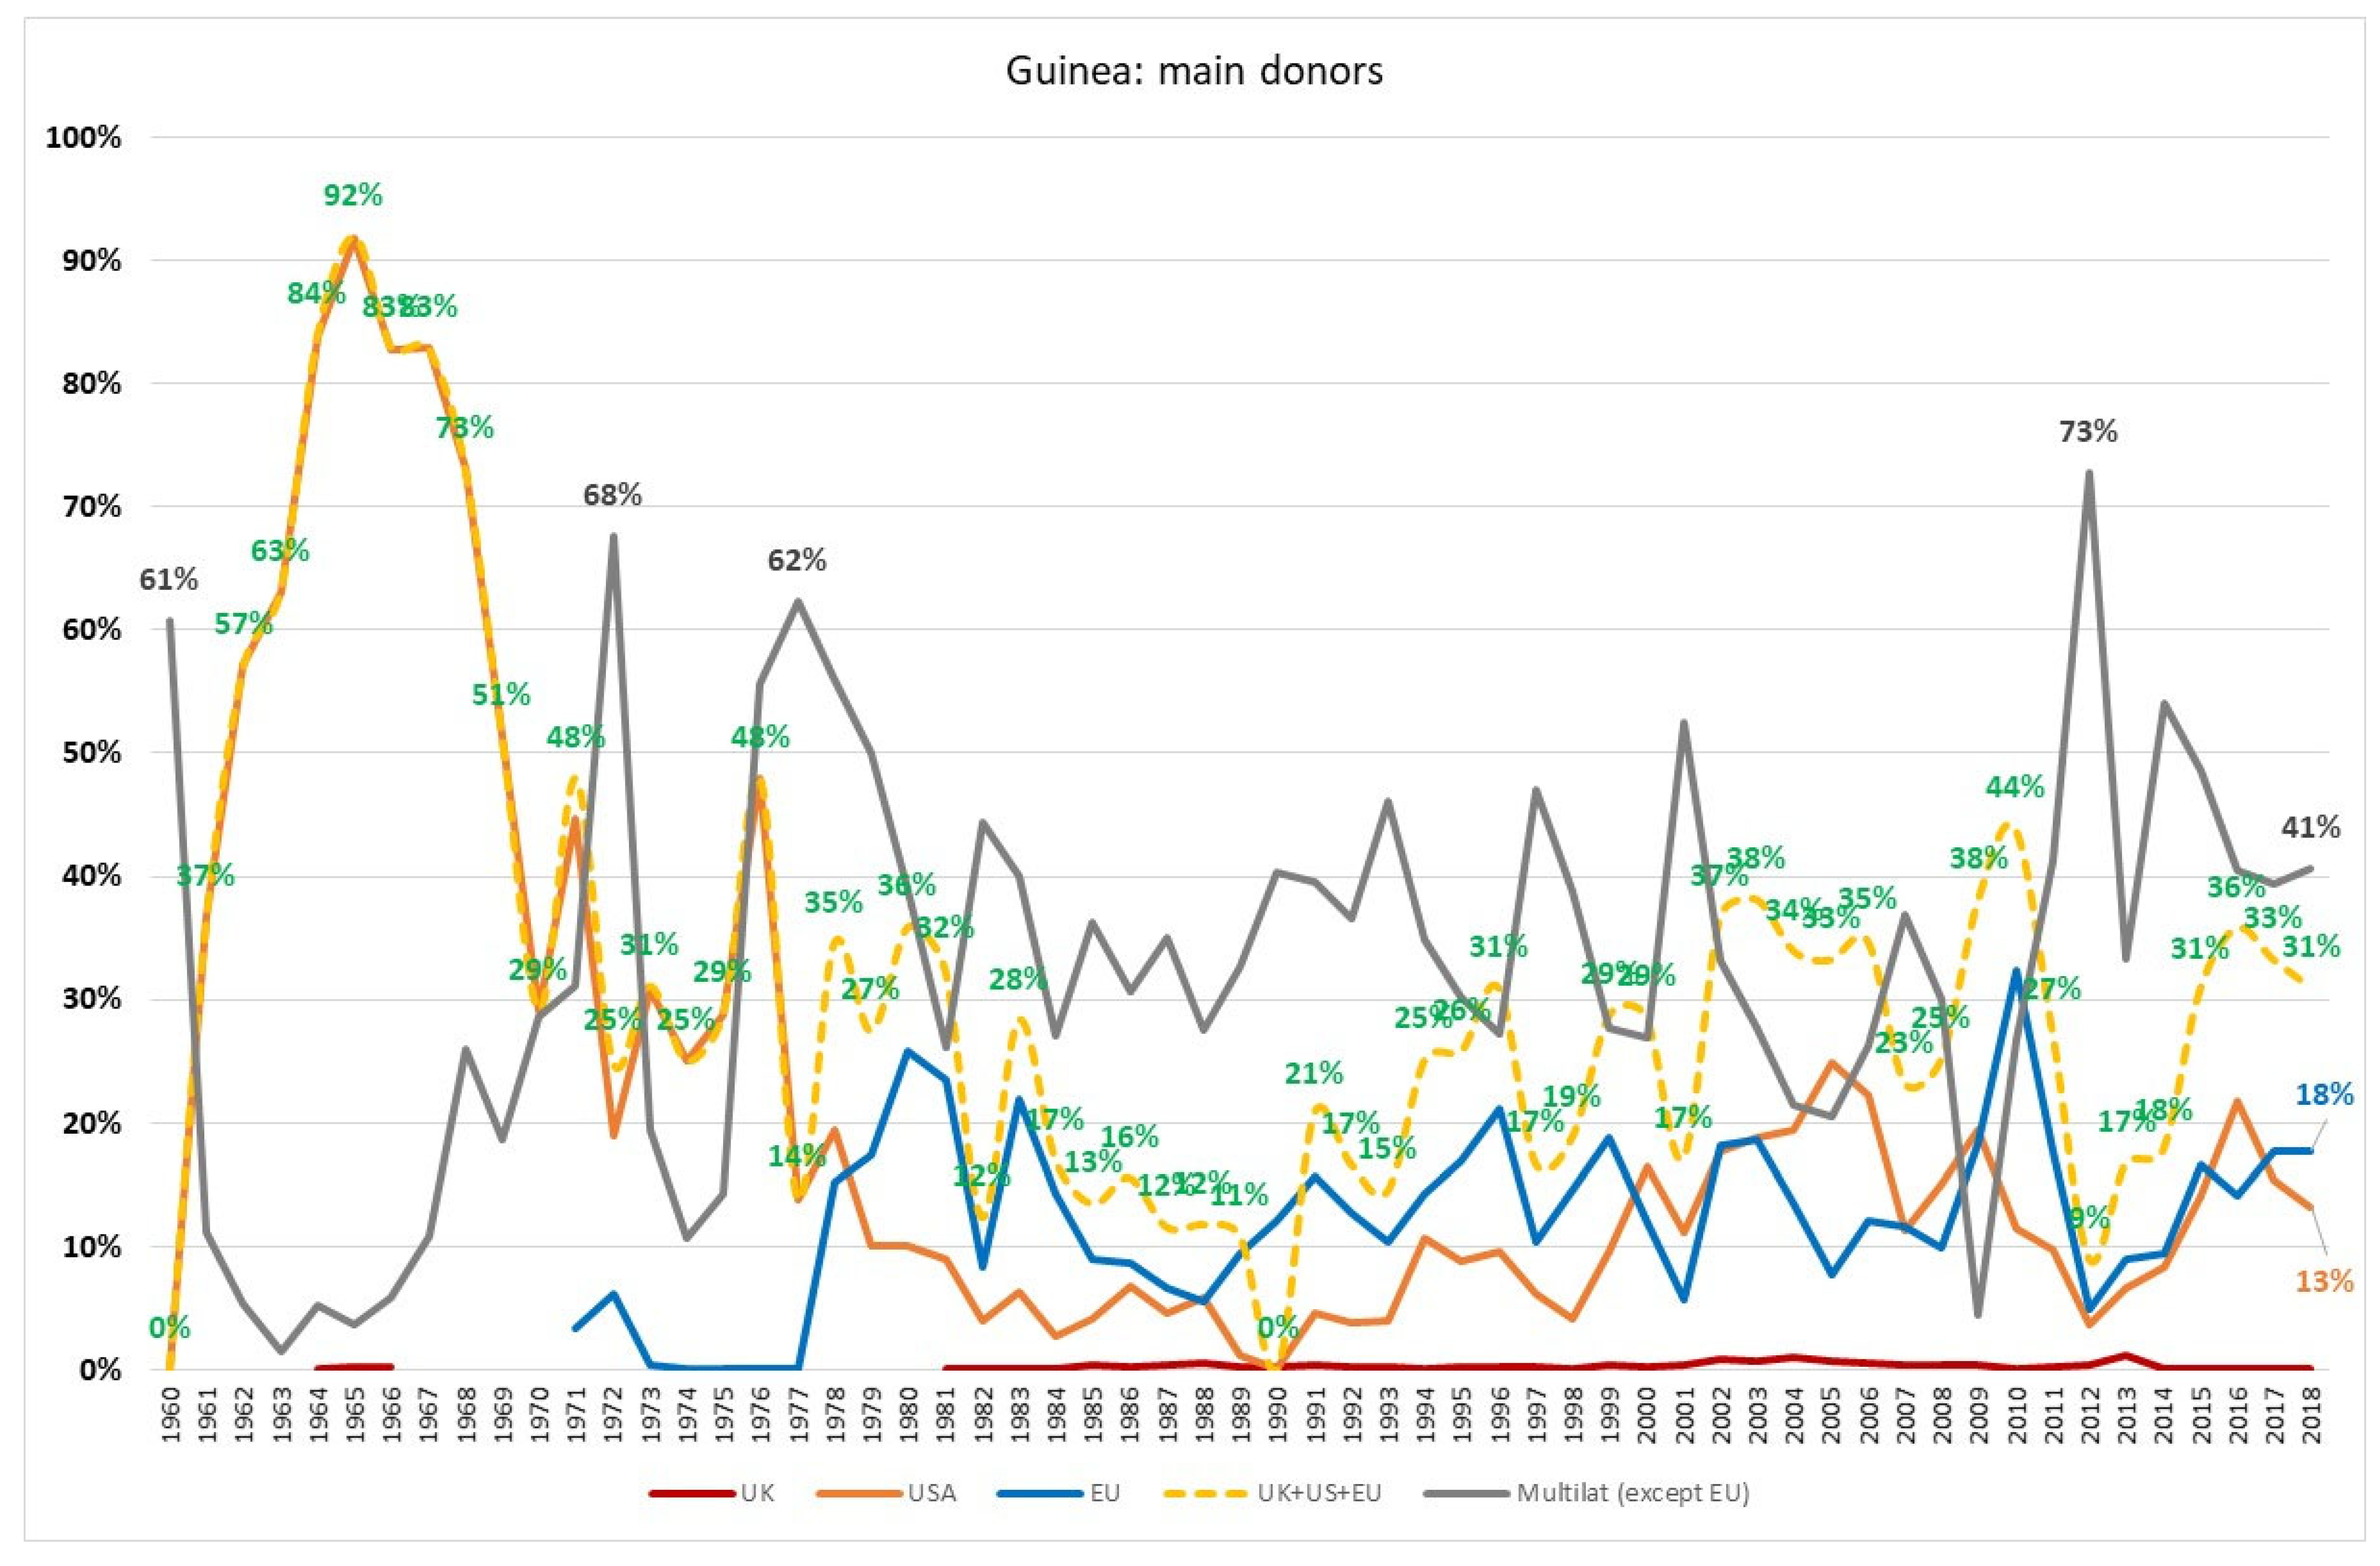
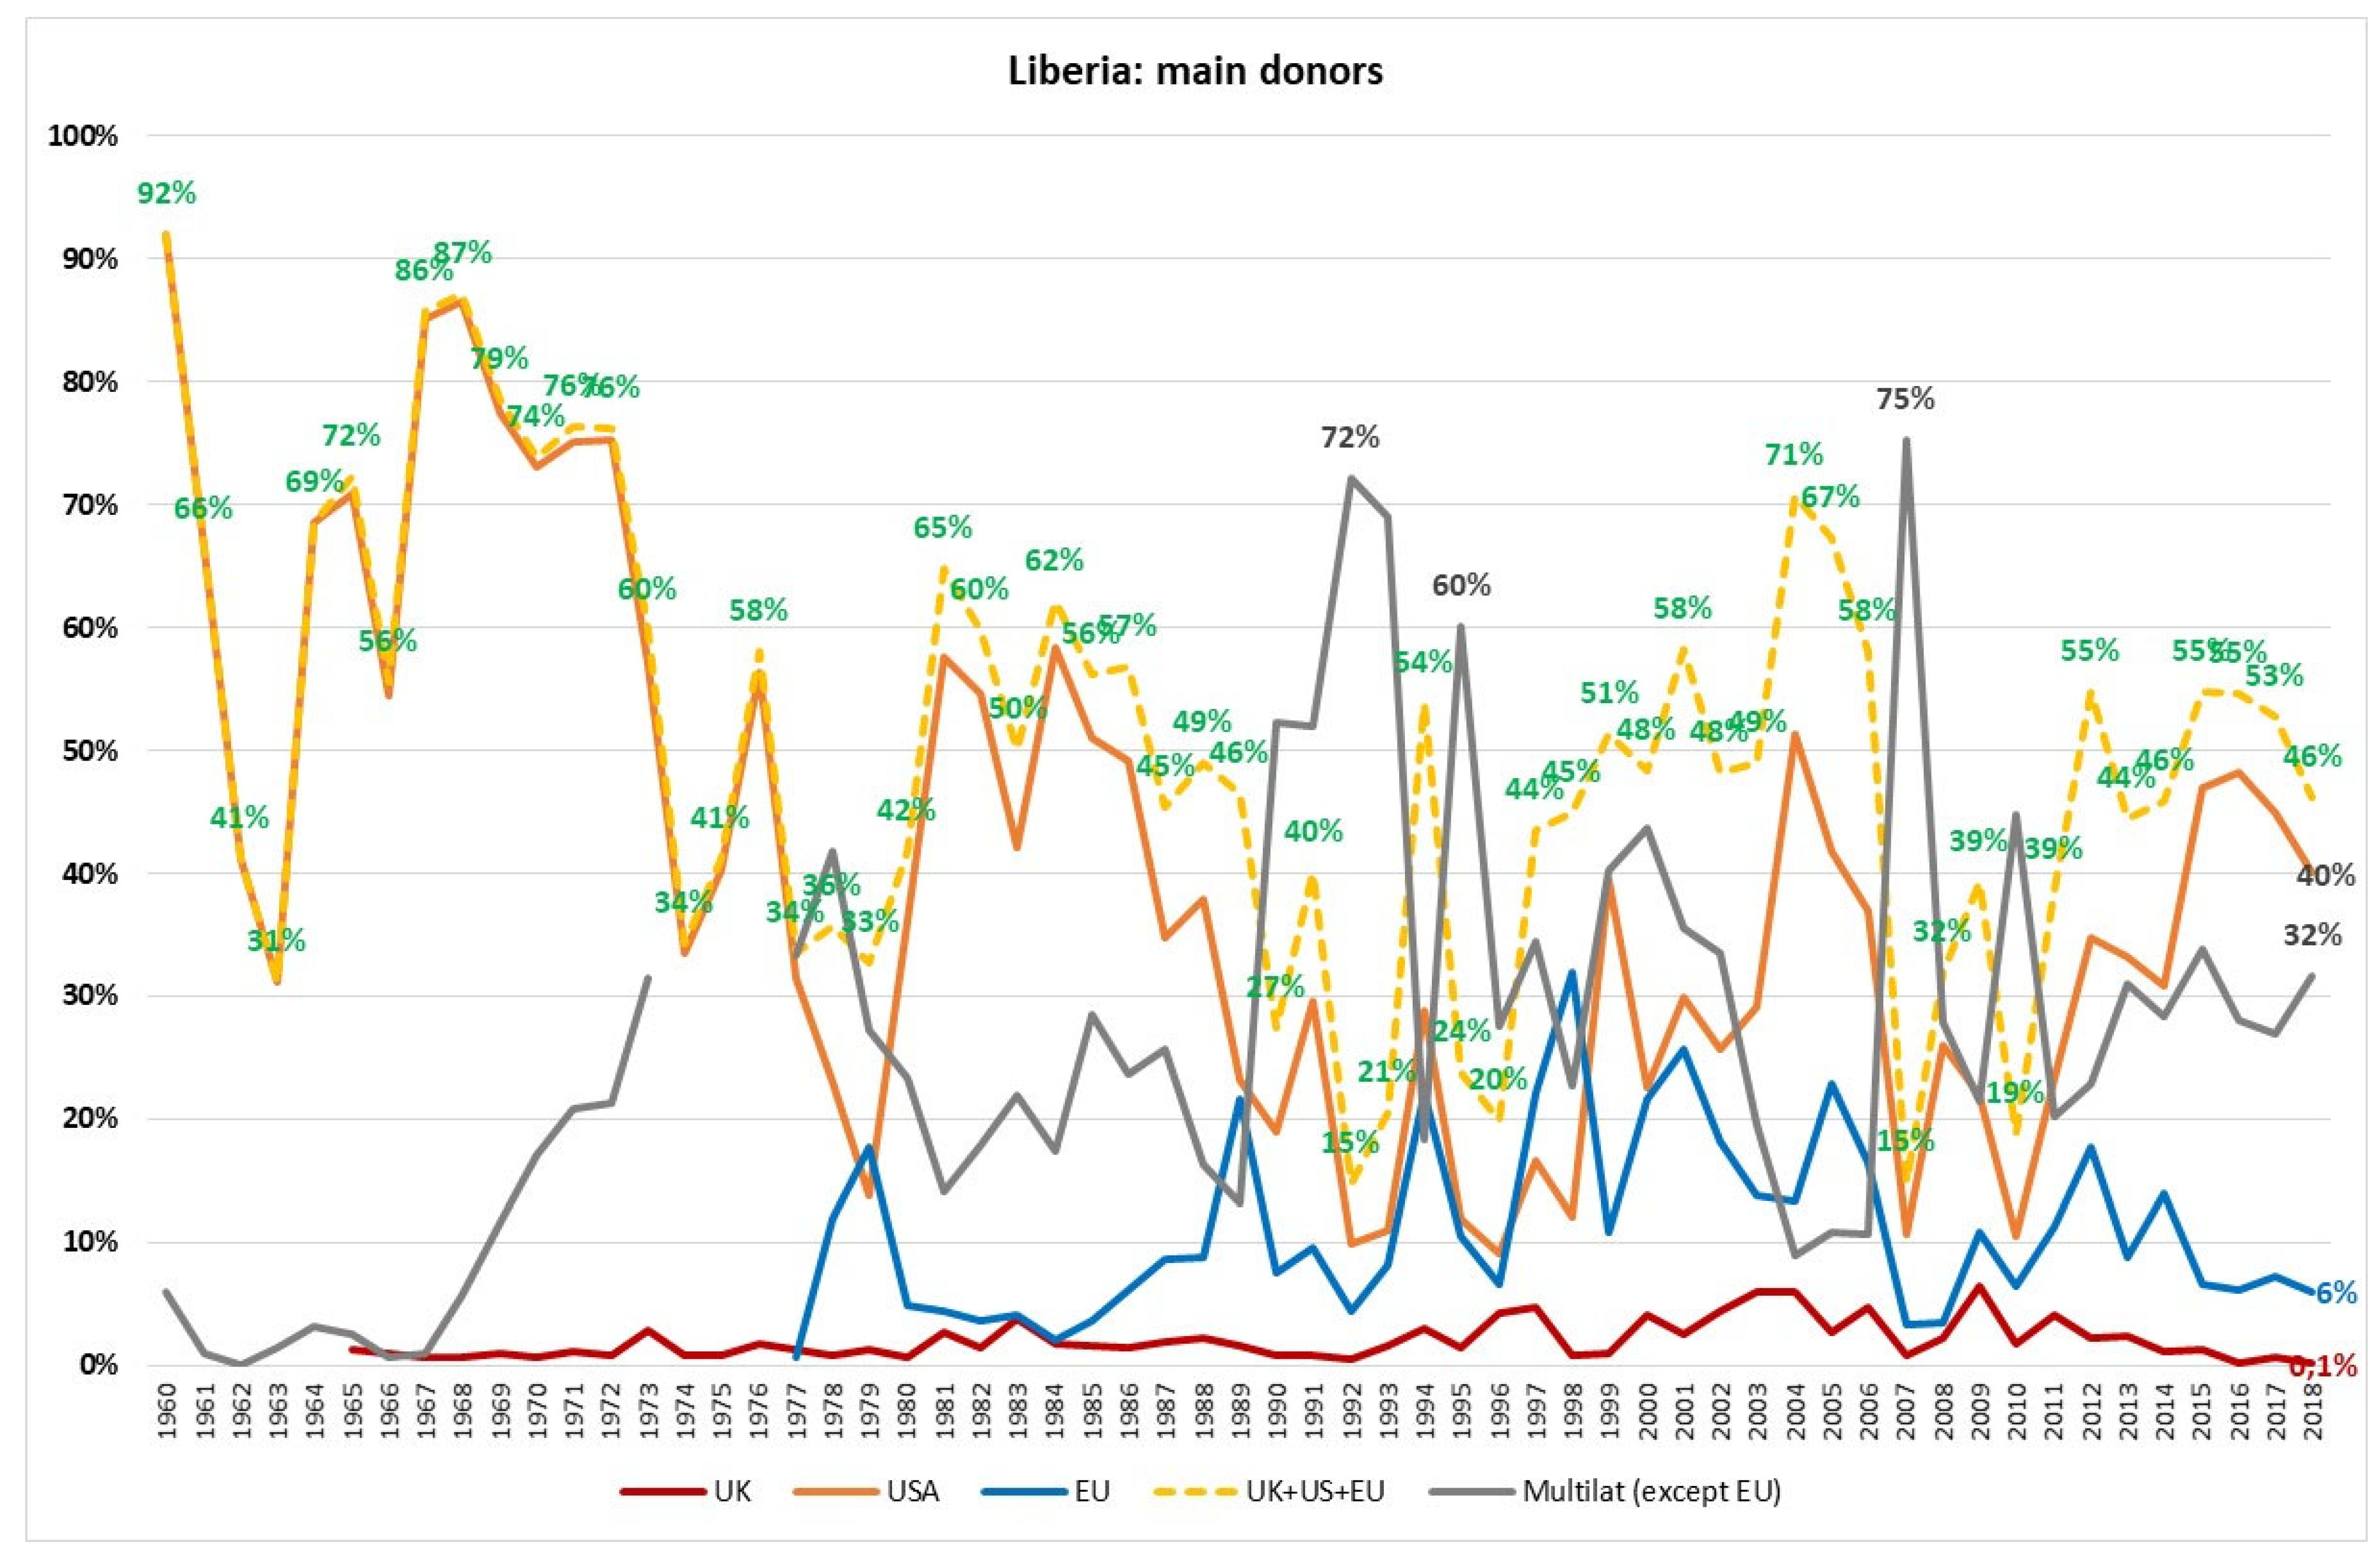
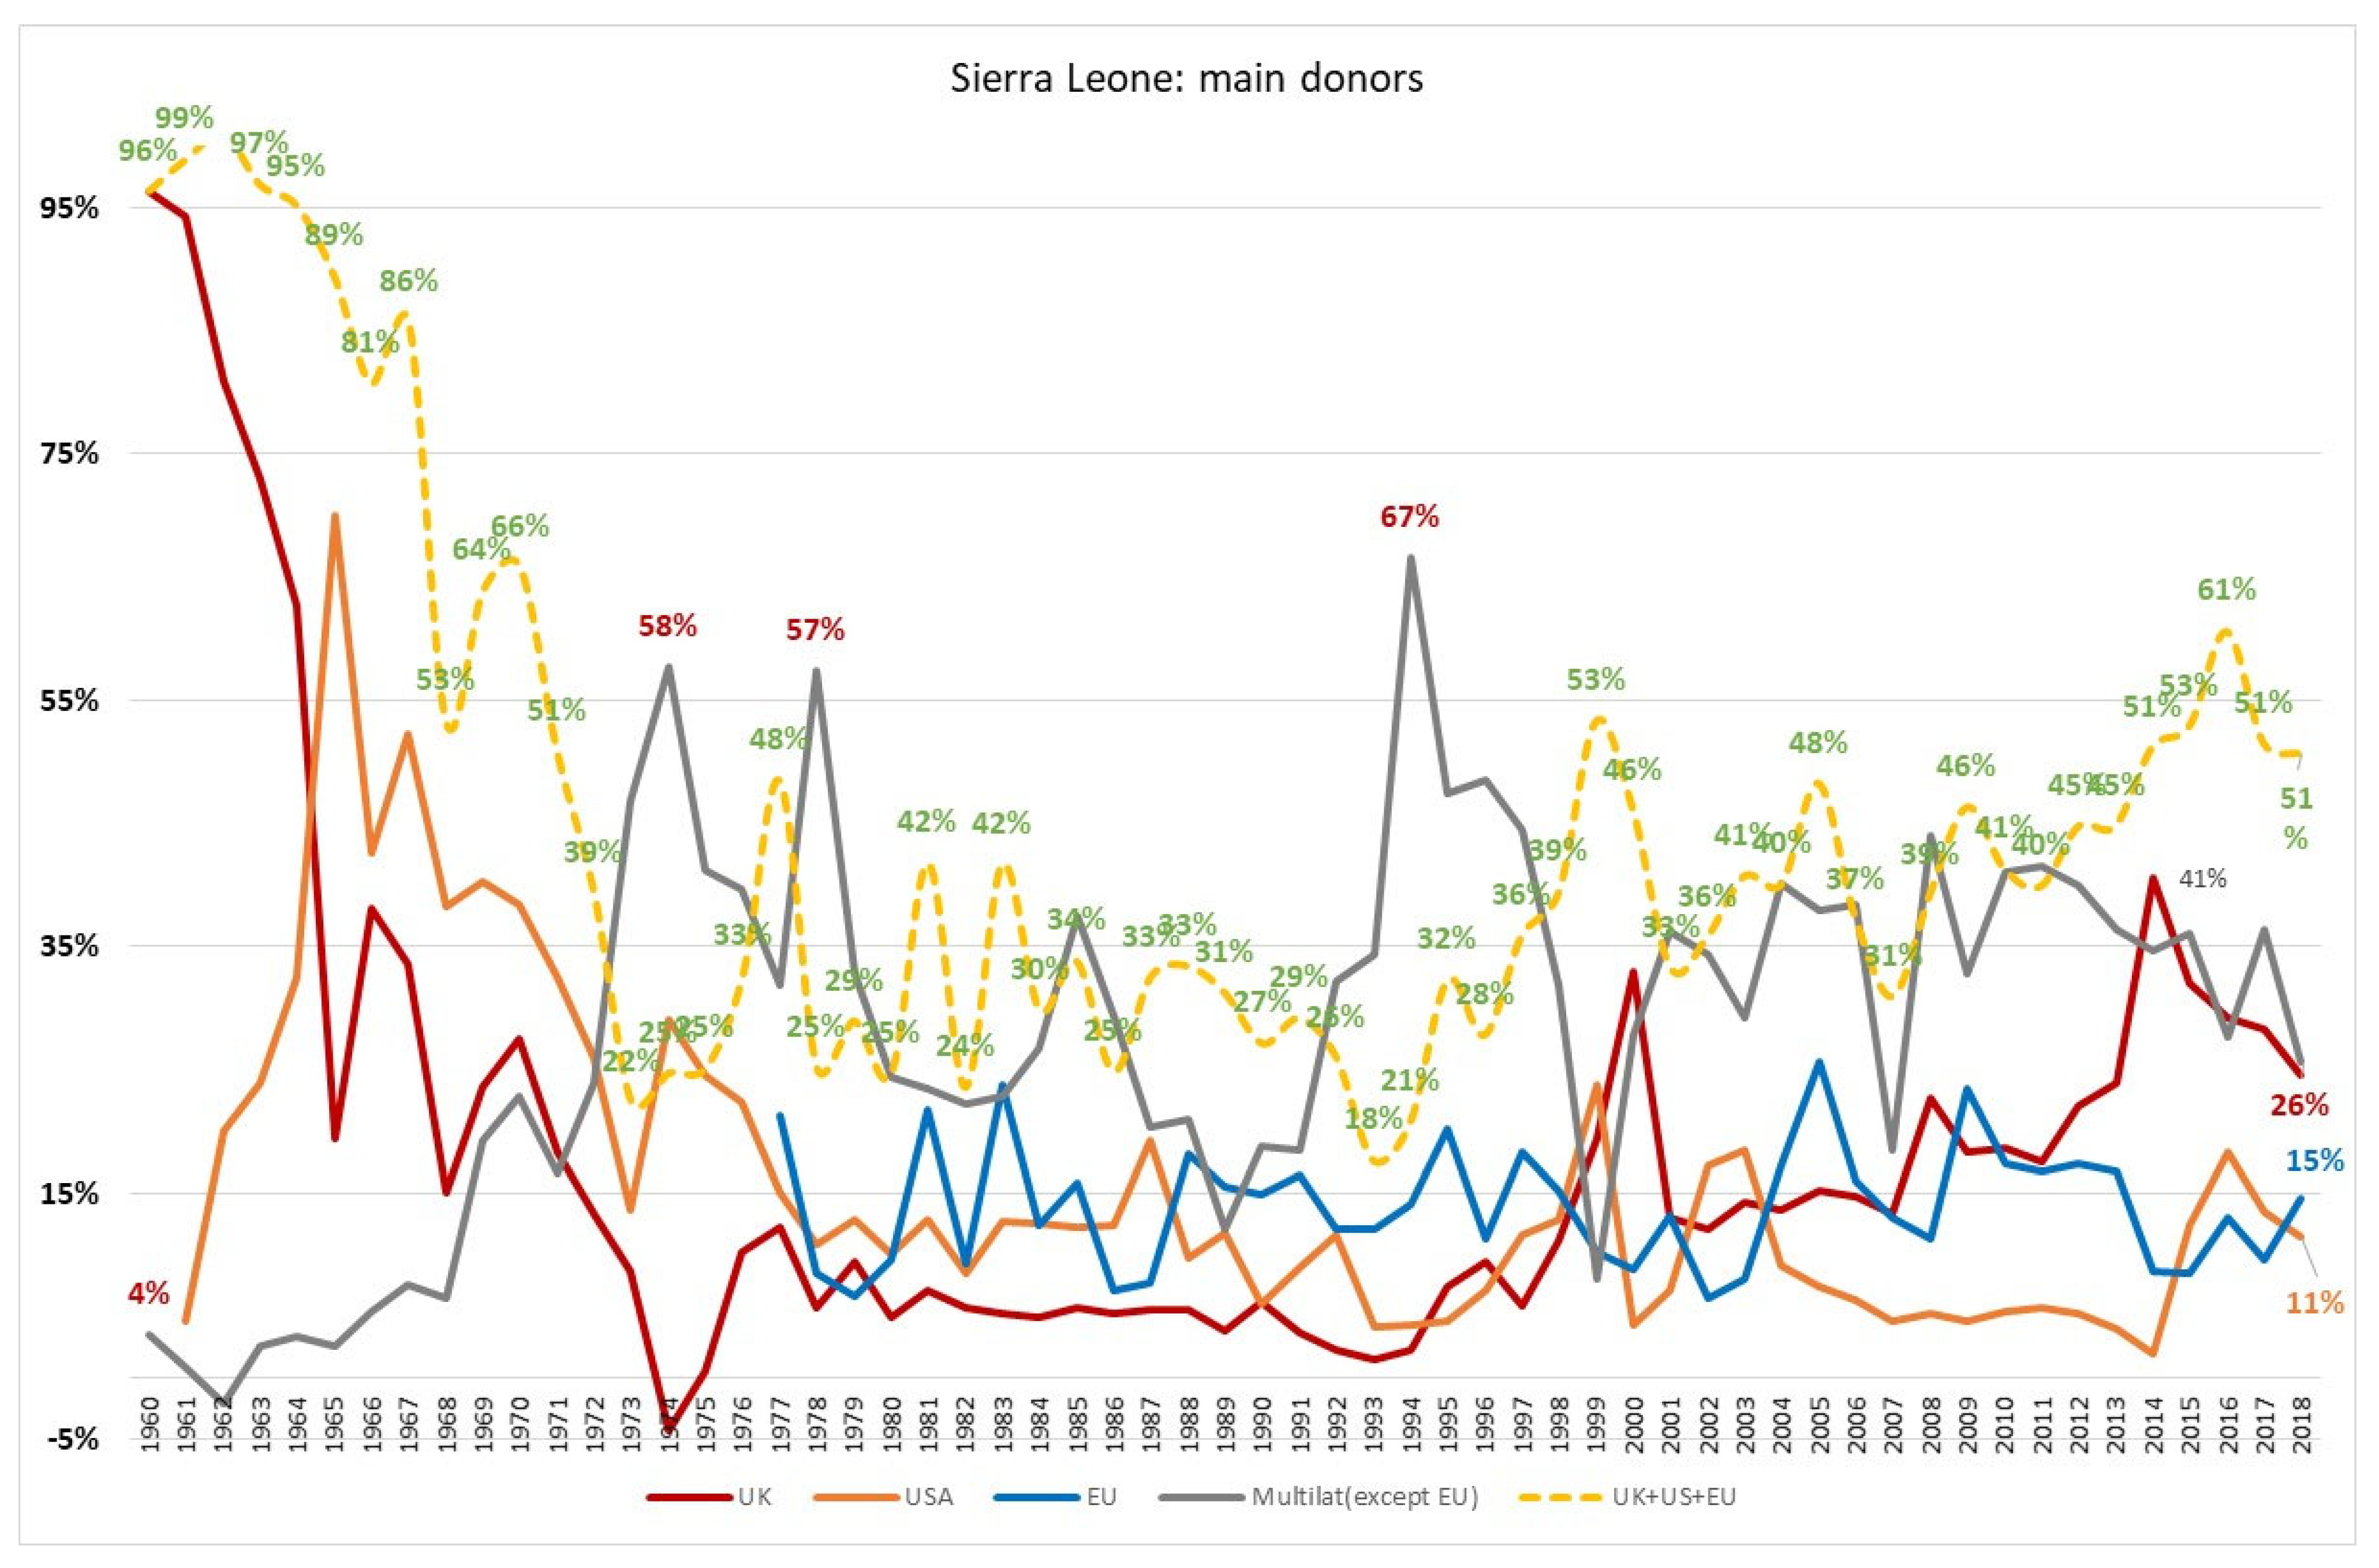
2.2.2. ODA Main Donors

As Figure 6 shows, multilateral donors are the main character in Guinea. They reach 71% in 2012 and they still concentrate the 41% of the ODA flows in 2018. IMF and African Development Fund are the multilateral donors whose contributions are remarkable. Among bilateral donors, United States, the United Kingdom and the European Union contribute the most. The sum of their contributions depicts more than one third of net ODA received by Guinea (31% in 2018). The European Union has maintained the highest amounts in recent years (18% in 2018). For 2017–2018 (the last couple of years with data available), the main donors have been the EU (17.7%), USA (14.2%) and World Bank’s IDA (12.6%).
In the case of Liberia (Figure 7), bilateral donors dominate the contributions. The USA is clearly the main donor (more than 40% since 2015), followed by multilateral donors. The peak in the share of multilateral donors in 1992 and 1995 is explained by a special World Food Program contribution (USD 94.5 and USD 76.1 million, respectively) and the maximum in 2007 was due to a contribution of the World Bank (USD 842.8 million). European Union contributions have been declining since the ‘90s (they only capture a 6% in 2018). For the period 2017–2018, the main donors have been the USA (42.6%), followed by IDA (10.6%) and both the European Union (6.7%) and African Development Fund (6.6%).
Considering the case of Sierra Leone (Figure 8), bilateral ODA amounts dominate. The sum of the UK, US and EU contributions are higher than the 40% in last years. The United Kingdom is the main donor (the share of its ODA reached 41% in 2014 and 26% in 2018), followed by the European Union. The amounts coming from multilateral donors were declining since 1994 (when an IMF loan for USD 155.7 million was approved) but their contributions are still in line with the USA. For 2107–2018, the main donors are UK (26.6%), the USA (12.5%) and the EU (12%).

2.3. Multidimensional Poverty Index

Surprisingly, the three countries have shown remarkably good results in many of the indicators of the global MPI that one can consider, as the next Figure 9, Figure 10 and Figure 11 show.
Finally, there are some commonalities between urban and rural poverty in the three countries. Although rural poverty is much higher, cooking fuel, sanitation and electricity are the main deprivations both in urban and rural contexts.
Unfortunately, ODA data are not disaggregated for urban or rural allocations, and therefore we cannot carry out an impact analysis of ODA on urban/rural poverty.

2.4. Data Sources

The economic data are gathered from the World Bank’s World Development Indicators. We consider Gross Domestic Product (GDP) amounts, and their demand components: final consumption expenditure, gross capital formation, exports and imports.
Net Official Development Assistance (ODA) comes from International Development Statistics (IDS) online databases. Net ODA consists of disbursements of loans made on concessional terms (net of repayments of principal) and grants by official agencies of the members of the Development Assistance Committee (DAC), by multilateral institutions, and by non-DAC countries to promote economic development and welfare in countries and territories in the DAC list of ODA recipients. It includes loans with a grant element of at least 25 percent (calculated at a rate of discount of 10 percent). Net official aid refers to aid flows (net of repayments) from official donors to countries and territories in the DAC list of recipients. Data are in constant 2015 U.S. dollars.
The quality of ODA indicators comes from the Global Partnership for Effective Development Co-operation database.
Sectoral ODA. With the aim of analysing the sectoral distribution of ODA flows, we download the disbursements in constant US dollars from the OECD-Creditor Reporting System database (OECD 2021) for 2002–2018, and we split the period in two subperiods: 2002–2009 and 2010–2018. We get the sums for each period and sector, and we compare the percentage of each sector-period for the main donors
AidData. To our knowledge, we use for the first time, aid-disaggregated data from the AidData database [28] for Sierra Leone (AidData 2017 [27])11. This dataset has 856 projects on 2314 locations for 1992–2014 and allows us to know the amount of aid disbursed by donor, sector and province (district) of the country. Data availability starts in 1992 and end in 2018. The total amount of aid compiled by AidData for Sierra Leone reached USD13,389,548,744.
Multidimensional Poverty Index (MPI). Data for the MPI values, and their headcount and intensity comes from Alkire, S., J. M. Roche and A. Vaz (2014) [31]. There are two surveys for poverty indicators for Sierra Leone: a Demographic and Health Survey for 201312 and Multiple Indicator Cluster Surveys (MICS) for 201713. This fact implies that our period of analysis is 2013–2017.

2.5. Methods

2.5.1. Vector Error Correction Model

The aim of this section is to check whether there is a statistical (causal) association between the aid flows (measured by ODA) and the economic growth (measured by GDP and its components) in the three selected countries. We try to shed light in the aid-and-growth academic corpus of literature. In particular, we bear in mind the “micro-macro paradox” [17]. The paradox is that, whether foreign aid seems to show good results at micro-level (projects tend to reach their specific results), there is no significative changes in macro indicators, such as poverty levels, human development indexes or GDP per capita.
For studying the possible relation between ODA and economic growth the paper uses several statistical methods, including some econometric ones. All calculations are done using either Microsoft Excel or Python 3.8.11 with the libraries numpy, pandas and statsmodels.
There is no consensus on which is the best mathematical tool to study how ODA relates to the economic system as there are huge amounts of factors that can influence and sometimes time scales are quite different among others [9,10,11,20,32,33,34],but plenty of research has been carried out using time series models [35,36,37]; such as Vector Autoregression (VAR) that, among other advantages, does not need to specify which variables are endogenous and exogenous. The main model that will be used here is the Vector Error Correction Model (VECM).
VECM models are built in order to examine short-term and long-term relations of non-stationary variables that are cointegrated. The main features of the model are:
  • All variables are considered endogenous.
  • All variables should be of order 1, some variables might be stationary, but none are to be of order 2.
  • The system dynamics must show, at least, one cointegration relation (thus, it can be regarded as a VAR model with the restrictions driven by cointegration).
It is important to stress out that for the VECM model, the amount of data available for Liberia is rather scarce for the number of variables that we want to include and thus the analysis and results are affected. As a matter of fact, a model including the six variables at the same time cannot be computed for such a small number of observations and therefore a model with five variables is considered. Additionally, the maximum lags allowed for that model is smaller than for the other two.
After the preprocessing, the steps carried out to obtain the VECM model are as follows. First, we checked that the variance increases with mean in all series. As it is customary in these cases, a logarithmic transformation was used in all variables. Then, Augmented Dickey Fuller (ADF) tests were carried out for each of the variables in order to check whether they are stationary, setting a significance level of α = 0.01 .

2.5.2. Multidimensional Poverty Index

The global multidimensional poverty index is a quantitative assessment of the state of acute poverty in developing countries. Based on Alkire and Foster’s methodology (2011) [38], it was updated [30,39] to closely align the measure to the Sustainable Development Goals (SDGs) that are underlie the 2030 Agenda for Sustainable Development [40]. Based on national surveys, the MPI can be disaggregated in urban and rural areas, ethnic groups, gender, age cohort or deprivation considered under its ten indicators.
The MPI has three equally weighted dimensions: health, education and living standards. Under the health dimension, two indicators are considered: nutrition (a household is deprived if any person under 70 years of age for whom there is nutritional information is undernourished) which is linked to SDG 2 (zero hunger), and child mortality (when a child under 18 has died in the household in the five-year period preceding the survey) linked to SDG 3 (good health and well-being). Under the education dimension, these two indicators are taken into account: years of schooling (when no eligible household member has completed six years of schooling) and school attendance (when any school-aged child is not attending school up to the age at which he or she would complete class 8) both linked to SDG 4 (quality education). Finally, under the living standards dimension, six indicators are considered: cooking fuel (a household cooks using solid fuel such as dung, agricultural crop, shrubs, wood, charcoal or coal) linked to SDG 7 (renewable energy); sanitation (the household has unimproved or no sanitation facility or it is improved but shared with other households) linked to SDG 6; drinking water (the household’s source of drinking water is not safe or safe drinking water is a 30-min or longer walk from home, roundtrip) linked also to SDG 6; electricity (when the household has no electricity) linked to SDG 7 (affordable and clean energy); housing (the household has inadequate housing materials in any of the three components: floor, roof or walls) linked to SDG 11 (sustainable cities and communities); and assets (the household does not own more than one of these assets: radio, TV, telephone, computer, animal cart, bicycle, motorbike or refrigerator, and does not own a car or a truck) linked to SDG 1 (no poverty).
The association of the MPI indicators with the SDGs has many advantages; among others, for assessing if ODA flows are being allocated in the countries and sectors where the deprivations are higher. In this paper, we will try to link MPI indicators, SDGs and sectorial ODA amounts to verify if ODA is contributing to multidimensional poverty results.

3. Results

3.1. ODA and GDP: Vector Error Correction Model

Following the method described above, Table 2 shows the results of the ADF tests p-values and stationary decisions for net ODA, GDP and its components.
Given these results, the first differences are taken for series that are non-stationary. Performing again ADF tests, now on the differentiated series, with the same significance level, we obtain Table 3:
As stated before, it is correct to consider a model where one of the variables is non-stationary as long as all of them are considered only in first differences. Only for the first two series of Libera are the second differences considered, leading to p-values of 0.0 and 0.2077, respectively. Therefore, the final series for the models are considered as follows. All the series for Guinea and Sierra Leona are transformed logarithmically and taken in first differences, whereas the series for Liberia are transformed logarithmically and taken in first differences in the case of Gross Capital Formation and Consumption and in second differences in the case of Net ODA and GDP.
The next step is to choose an adequate order of lag; if it is too large significance in the coefficients might be reduced while if taking a small order, residuals might not be normal [41]. Thus, a trade-off between fit and parsimony is needed. The most frequent tools to help us find make this decision are the Akaike Information Criterion (AIC) and the Bayesian Information Criterion (BIC). The last step consists on determining the cointegration rank which is done by means of the Johansen cointegration test using the trace test statistic with significance level α = 0.05 . The following lag orders and cointegration ranks were found (Table 4).
All in all, we identify a positive and statistically significant association between ODA received by the three Sub-Saharan countries, their GDP and the demand components of the GDP.
Conversely to Mosley 1986 (he found positive micro level results, but he did not any macro impact) [17], we now want to know if there is some micro evidence that might support our VECM results. For this purpose, we analyzed the association between ODA flows and multidimensional poverty indicators.

3.2. ODA: Quality and Sectoral Distribution

3.2.1. ODA Quality

There are some quality indicators of ODA collected by surveys conducted by the Global Partnership for Effective Development Cooperation. The main results for the three countries and regional Africa averages are shown in Table 5. The indicators show that the quality of ODA is not bad, broadly speaking. The best practices seem to be interventions that draw objectives from country-led results framework (the so-called ownership principle in the Paris Declaration for Effective Development Cooperation), the annual predictability of aid funds (not for medium-term) and the low levels of tied aid (indicator 10).
All in all, donor practices seem to be good enough for development in the three countries. We cannot infer that this is translated into a poverty reduction automatically, but it is a useful evidence for our purpose.

3.2.2. ODA Sectoral Distribution

In the case of Guinea, the sectoral composition for all donors has not changed a lot between the two periods. Social infrastructure leads the ODA (42%), Economic infrastructure has increased a little (from 7% to 11%) and there has been some reductions in ODA for production (from 9% to 4%), in Multisector (specially in general environment protection) and in Debt relieve (from 20% to 17%). Some donor and sectoral specialization could be identified. For instance, European Union leads ODA for road transport (more than their 30% of ODA went to this sector). African Development Bank and IDA tend to concentrate their aid in Economic Infrastructure, whereas United Nations preferred to help Government and civil society, especially conflict, peace and security (14% of its ODA in 2010–2018).
One remarkable feature for all donors is that they do not tent to send ODA flows to sectors related to multidimensional poverty indicators. The highest percentage of ODA channelled to dimensions directly related to causes of poverty was education (16% 2002–2009). However, some donors tend to distribute their ODA more concentrated. For instance, education received 32% of IDA flows for 2002–2009, health 55% from other multilaterals (excluding EU, World Bank, IMF, regional development banks and UN). The IMF is clearly specialized in channelled its aid through General Budget Support (more than 80% in the two periods considered). Lastly, the UK focused a huge proportion of its aid to debt relive (33% in 2002–2009 and 69% in 2010–2018). It should bear in mind, that these amounts cannot be considered directly linked to poverty reduction. In fact, it is not “fresh money” for development agents, NGOs or practitioners.
In the case of Liberia, some features concur with Guinea. For instance, Social Infrastructure dominates in both periods (35%) and Economic infrastructure has increased from 6% to 17%. One quarter of ODA is for Debt relief and the proportion of Humanitarian Aid has declined from 19% to 11%. IMF and African Development Fund channeled their aid through general budget support (80% or more for 2002–2009). The US focused their aid in education (10% in 2010–2018) whereas health sector was mainly attended by IDA (22% of their funds were to that sector). Drinking water and sanitation received very little ODA. Only the share of the ADF (12%) was noticeable. Energy (electricity included) only was noteworthy for IDA (20% for 2010–2018).
In Sierra Leone, ODA has focused on Social Infrastructure (43.8% for 2010–2018) followed by humanitarian aid (17.6%), Health (14%) and General Budget Support (13%). It was very important the aid for Action related to Debt for 2002–2009 (25%). Education is helped by the United States (8.4% of its aid in 2010–2018).
United Kingdom was the main donor for Sierra Leone. The sectorial allocation of this donor was focused on Government and civil society for 2002–2009 (42.8%) followed by General Budget Support (33.1%) and Humanitarian aid for 2010–2018 (38.1%). This sector was also prioritized by the United States (34.7%). The European Union has focused on Road transport (19% in 2002–2009 and 27% for 2010–2018). IDA is specialized on Economic Infrastructure (19%), mainly on agriculture (14%) for 2010–2018.
The main idea that shows this sectoral structure is that there is some specialization in some sectors by different donors. Furthermore, the sectors more directly linked to the deprivations measured by the global Multidimensional Poverty Index, such as schooling, nutrition, housing, electricity, water or sanitation, are not privileged by any donor in relative terms. We may consider this fact as a first approach for having doubts about a direct and causal link between ODA flows and the multidimensional poverty reduction happened in the three countries that we are studying.

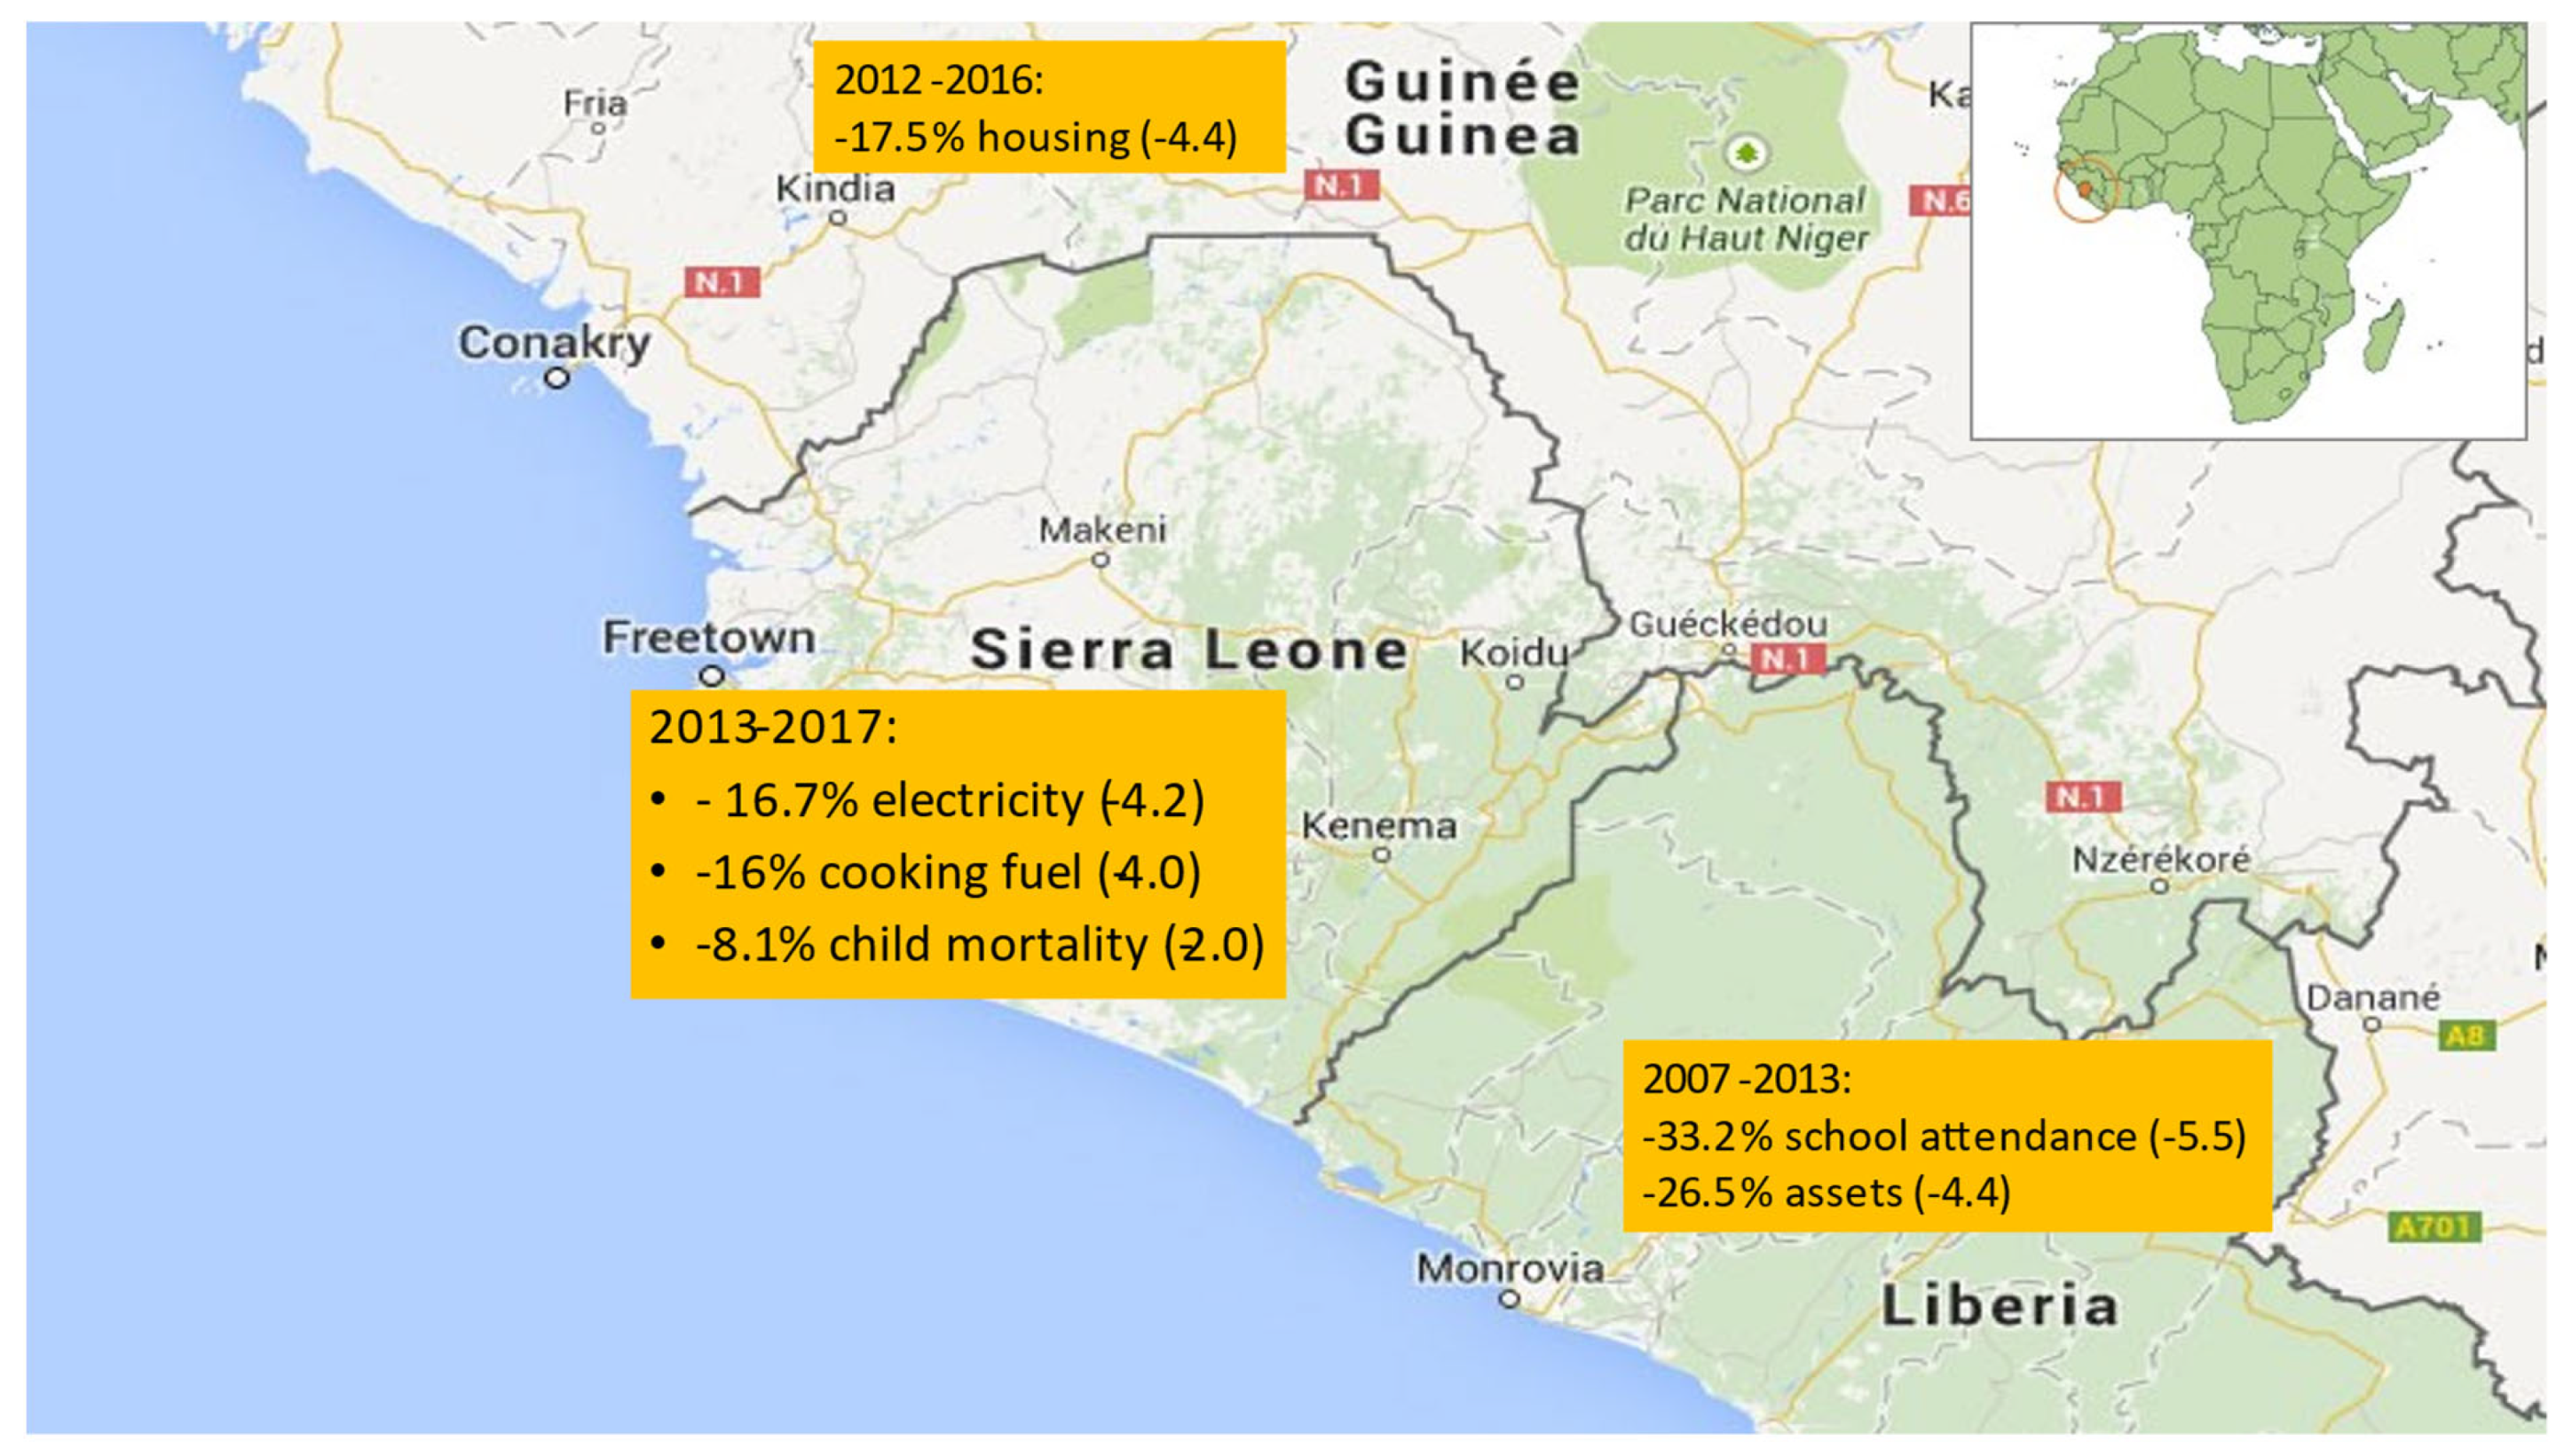
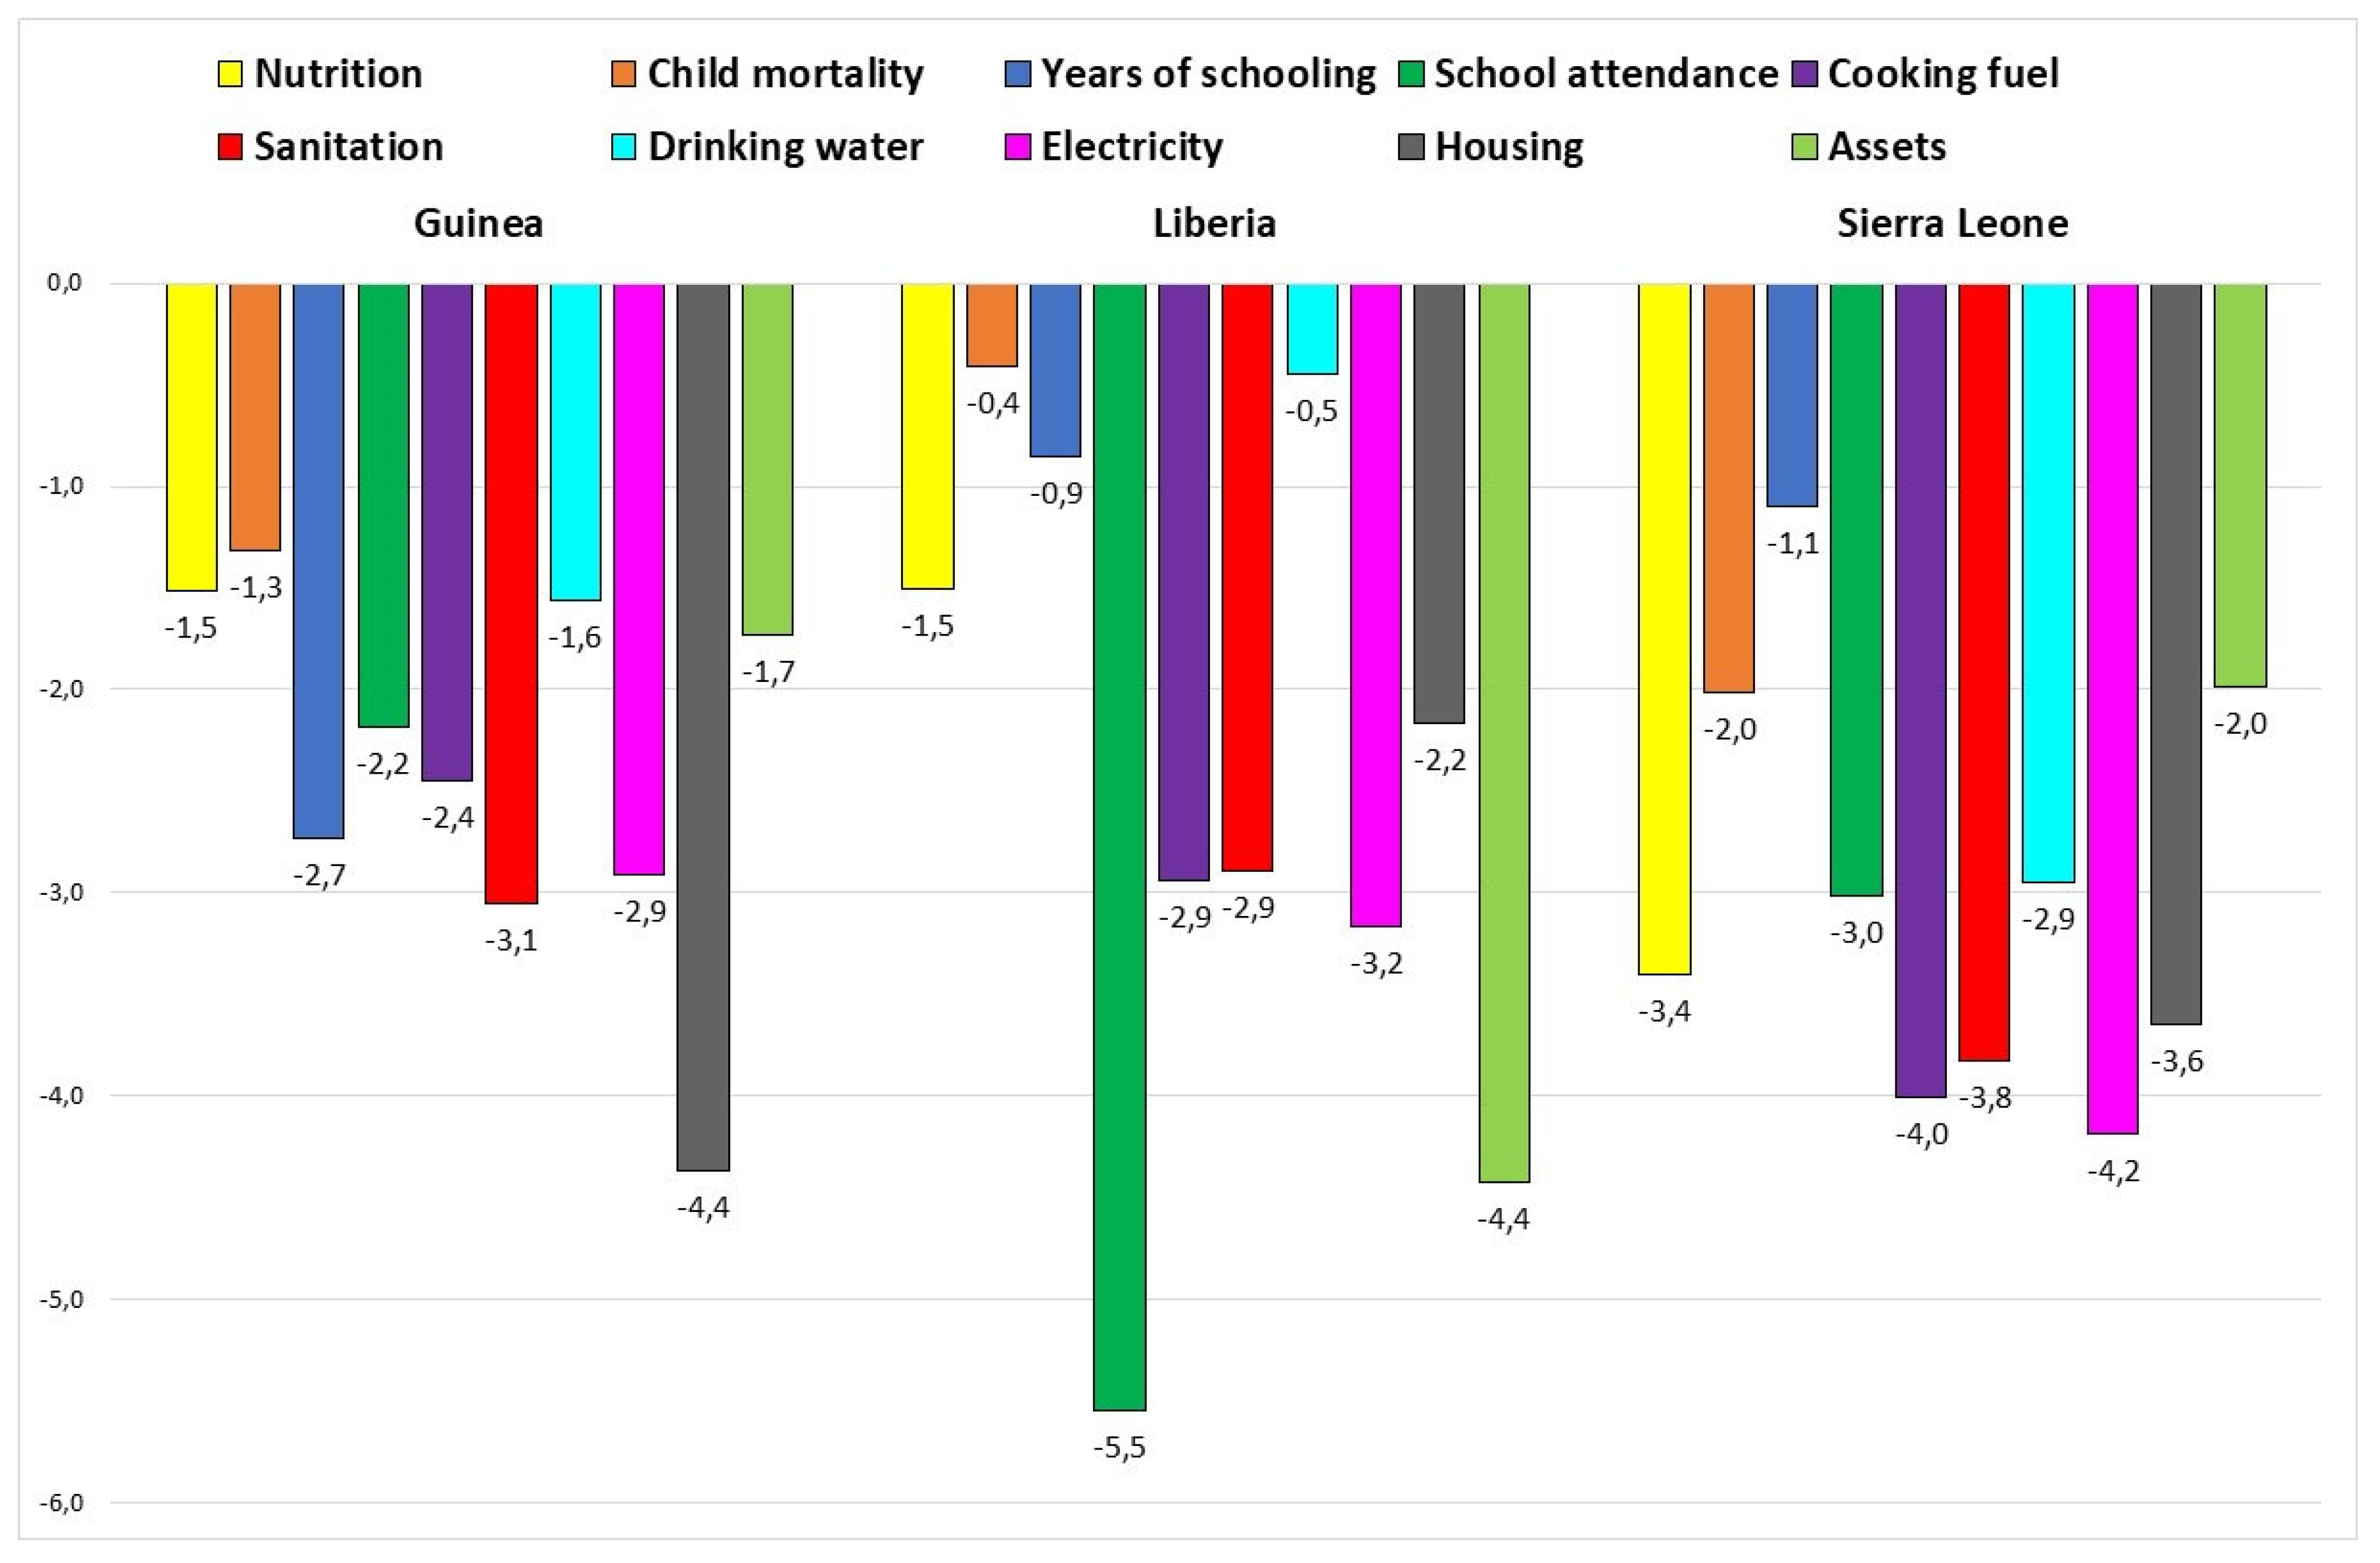
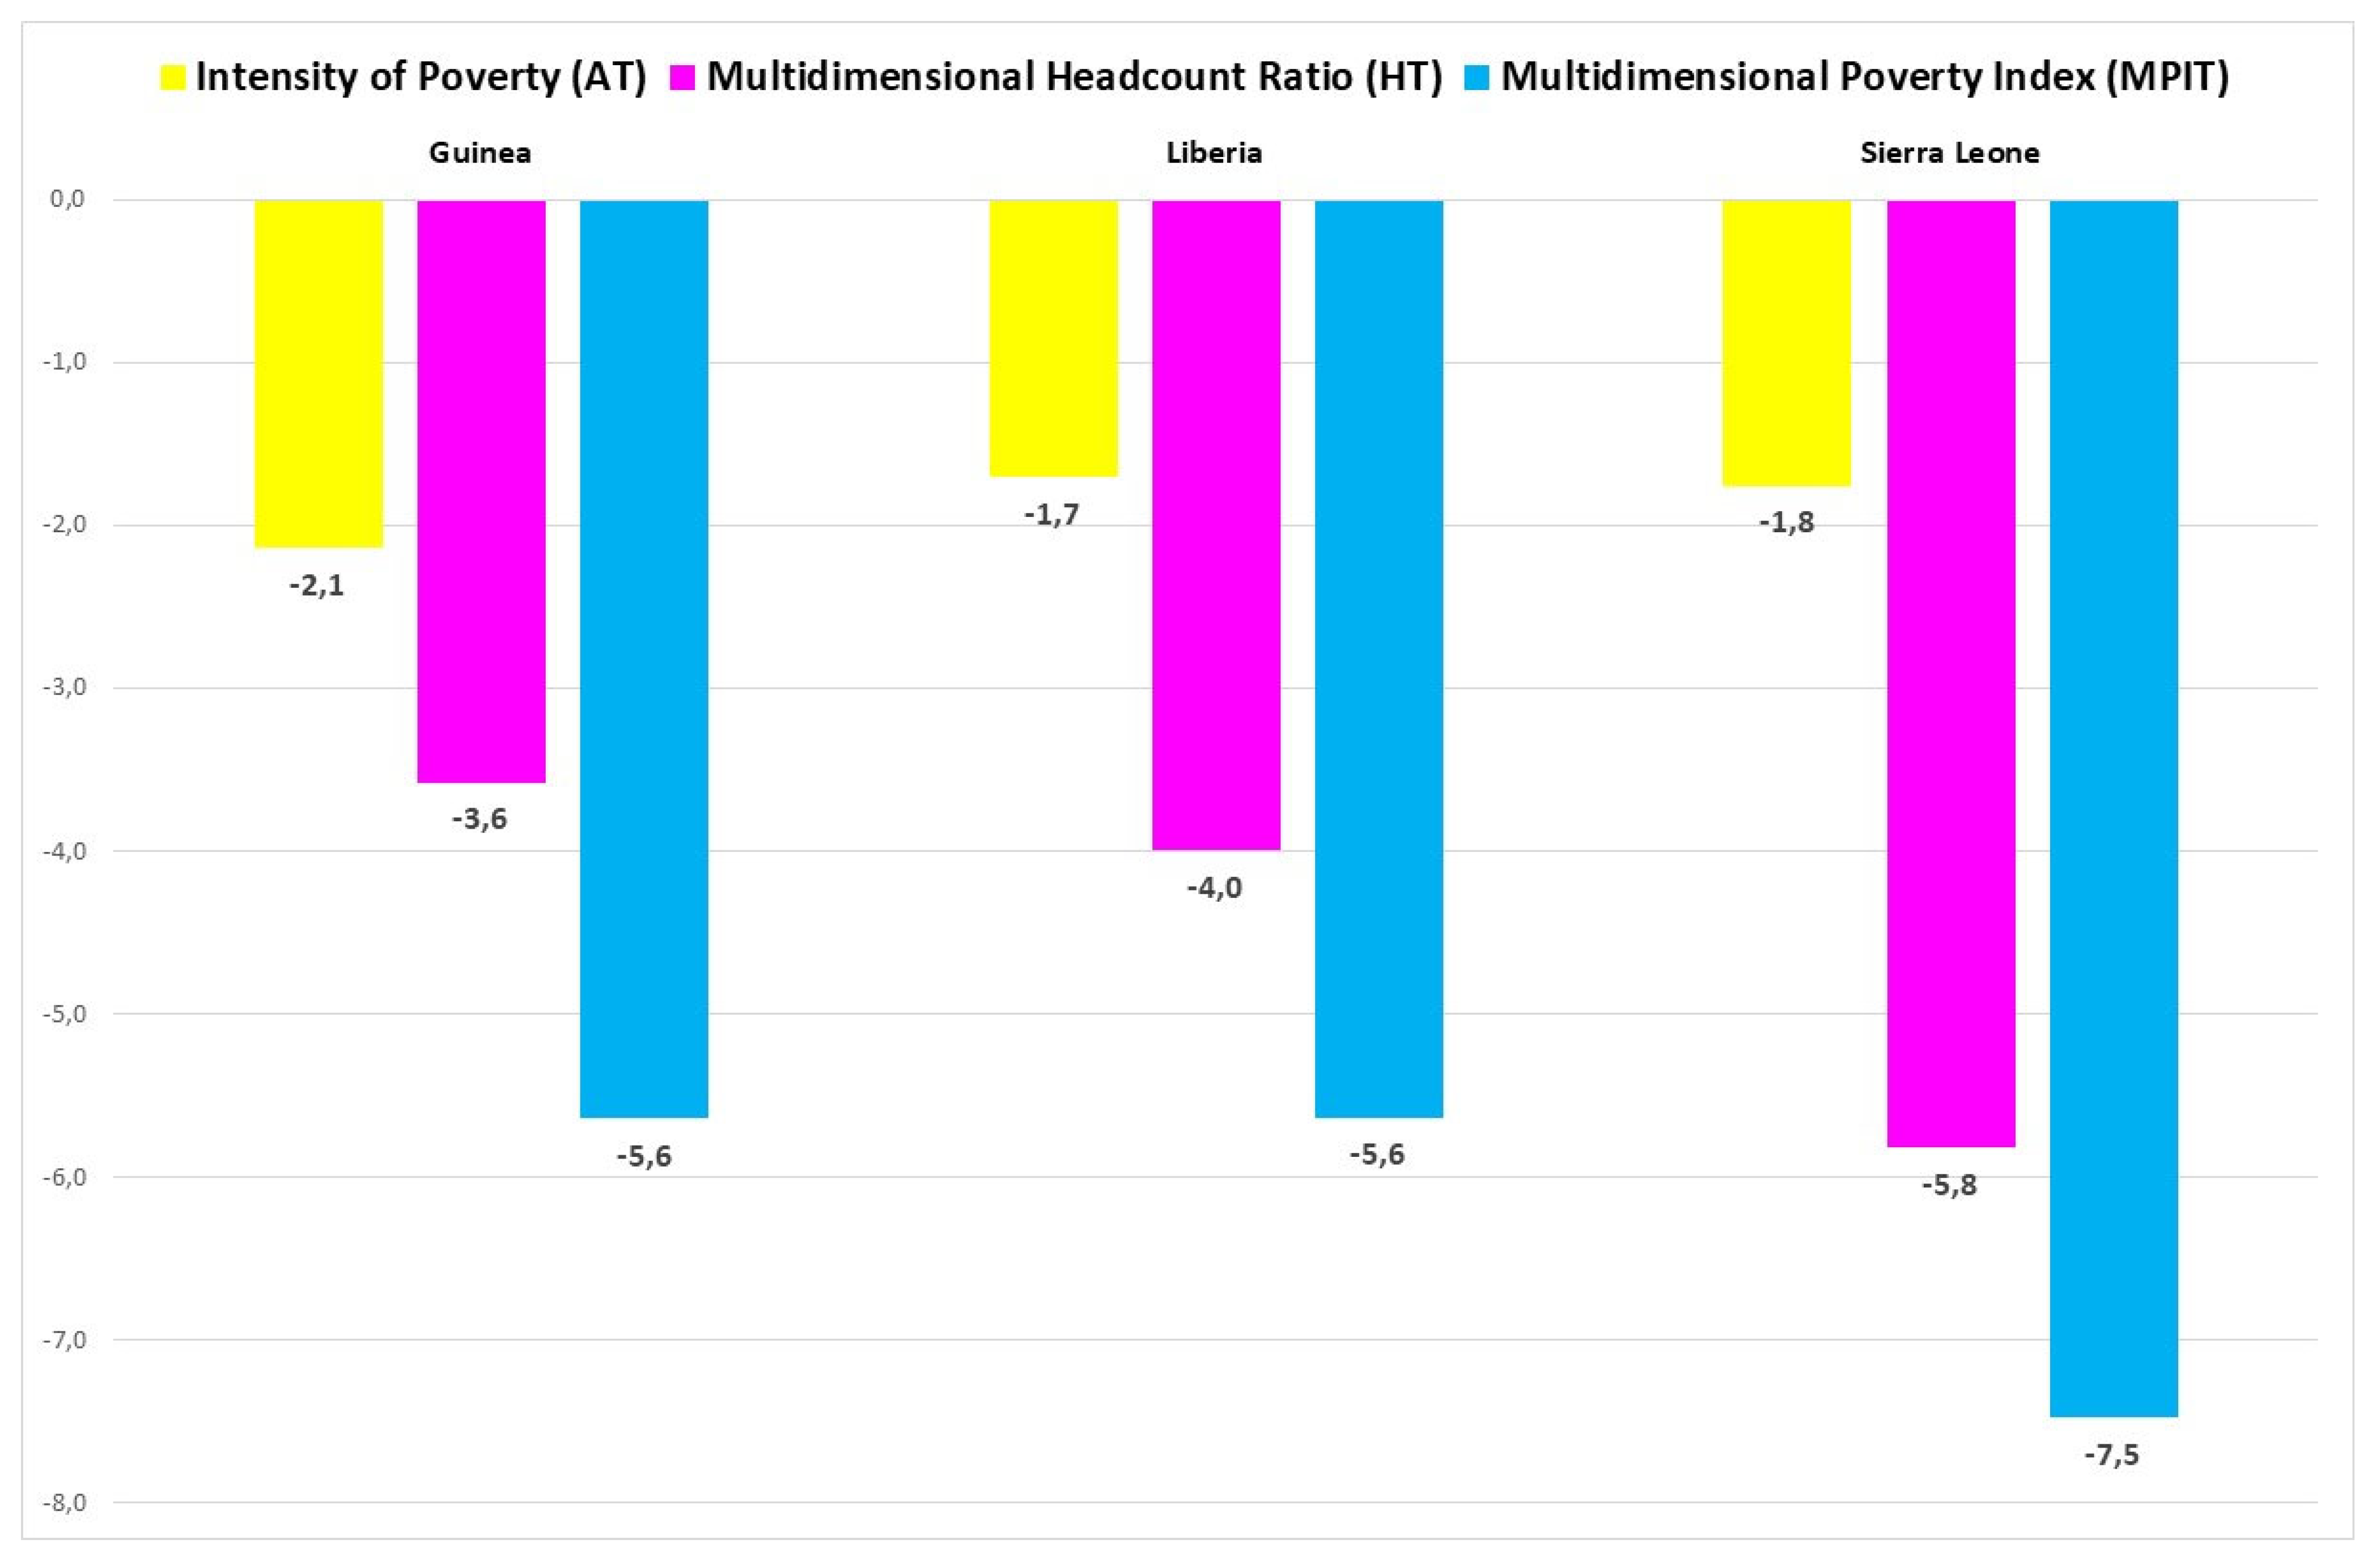
3.3. Poverty Incidence and ODA Flows: Is There a Link?

The goal of this section is to try to relate development aid flows to changes in the 10 multidimensional poverty indicators. To do this, the aid data by most relevant sectors and the corresponding years of the poverty surveys of the three countries, have been downloaded from Creditor Reporting System dataset (OECD 2021).
The following table (Table 6) provides the sum of ODA from all donors to the corresponding sectors, along with decreases in the 10 multidimensional poverty indicators (the last three columns).
This information allows us to compare at first glance whether it is reasonable to think that aid could have contributed to the achievement of poverty reduction.
The hypothesis is that if a sufficient amount of aid has been produced in the sectors that are most closely related to poverty indicators, it could be expected that it has contributed in some way to said reduction. In cases where a possible impact is identified, we will look for which donor has been most responsible for this aid-poverty alleviation relationship.
(A)
Regarding the dimension of deprivation in education, Guinea and Liberia receive a similar amount (USD 200 million) while Sierra Leone receives somewhat less (133 million). In relative terms, it is a very low proportion: 1.3% in the “basic education” sector. Liberia dedicated the majority of its ODA to education to this basic subsector (109 million out of 200). It contrasts that the reduction in “Years of schooling” was the lowest in the three countries among the 10 poverty indicators. In a way, it could be said that Liberia was the best profitable for aid to education. With USD 200 million he managed to reduce poverty by −5.5 points due to not being able to go to school attendance. It is noteworthy that most of the aid to education in Liberia was provided by the USA (73 million or 36.5% of the 200 million). Guinea also “profited” the aid well in terms of contribution to educational improvement, since with USD 196 million, it achieved a cumulative −4.9 points in educational poverty, while Sierra Leone received less (133 million) and reduced—4.1 educational poverty.
It is interesting to note how the aid is not mainly intended for education. It is also important to note how the percentages are somewhat skewed by the heavy burdens of debt relief in Guinea and Liberia and by Humanitarian Aid in Sierra Leone (Ebola years).
(B)
As regards health, it is complex to identify a representative sector of nutrition or infant mortality. In terms of nutrition, the reduction in Sierra Leone stands out (−3.4 points). Received food aid (there are two sectors that are not shown but that can be associated with nutrition: “Development food assistance” (sector 510 of the OECD-DAC classification) and “Emergency food assistance” (sector 72040 of the OECD-DAC classification within Humanitarian Aid). In both cases, aid to Sierra Leone came from the US and Japan. Together they represent 82% of what Sierra Leone received for food aid, which reached USD 126.4 million. It is possible that this aid could have contributed to the reduction of malnutrition in the country and partially explain this remarkable reduction of −3.4 points (in contrast to zero for Guinea and −1.5 for Liberia).
(C)
Regarding the dimension of standard of living, it is very difficult to assign any aid item that is associated with cooking fuel or with assets, so we do not comment on these two indicators.
With regard to sanitation, there is a subsector directly related to it “basic sanitation” but which barely received funding (the largest was Guinea with 5.6 million, which is only 0.2% of its ODA). The same happens with “basic drinking water supply” where Guinea once again received the maximum but only 6.6 million. If the aggregate of the “Water and sanitation” sector is considered, Sierra Leone received the most funds (USD 180 million), accounting for 4.8% of its ODA and this was concentrated in the contributions of the UK and the African Development Bank. The contributions of both represented 81% of what Sierra Leone received for water and sanitation.
In sum, it is highly unlikely that ODA could have contributed to poverty reduction in these two key water and sanitation indicators.
A similar diagnosis emerges from the Housing analysis (zero ODA, which does not explain the great reduction of −4.4 points in housing in Guinea). Neither did electricity, where Sierra Leone showed a record (−4.2) but barely received USD 37.5 million from the UK (USD 16.4 million and only between 2016-17 and from the IDA of the World bank USD 11, 1 million between 2015-17, the rest of the years was zero). Both contributions represent 73% of what Sierra Leone received in the period for electricity, which barely represents 1% of its ODA.
Looking at the data in detail, ODA for electricity was clearly very low for the three countries and periods (Table 7). Electricity is a key indicator due to its multiple spillovers and interlinkages with other deprivations [42]. It is very implausible that these amounts may explain the high levels of poverty in electrification. Alternative explanations may be data measurement error in the surveys or other financial source such as public budget or private investment funds.
In the case of Sierra Leone, a likely explanation for the improvement in rural electrification is the Rural Renewable Energy Project (RREP)14. The project is supported by the UK’s Foreign, Commonwealth and Development Office (FCDO). It is implemented by the United Nations Office for Project Services (UNOPS) on behalf of the Ministry of Energy. The RREP, which spans from October 2016 to May 2022, provides access to clean energy, for sustainable growth of the country’s energy capacity. With a budget of 37.7 million pounds, the project is being completed in several phases and aligned with the overall national strategy to tap into Sierra Leone’s great renewable energy resources to provide more reliable, environmentally friendly and secure electricity to rural communities. The first phase, which involved the installation of solar power in 54 community health centres and network distribution to one school in Conakry Dee (Port Loko District), was successfully completed in July 2017. A further 44 installations were planned to be completed by 2020 through co-investment with the private sector operators. In total, the RREP will construct in total 94 solar-powered mini-grids and three stand-alone systems installed across the country. The RREP impact is to increase rural communities’ welfare through social and economic growth, saved fuel costs, and improved health and education outcomes. The project will also significantly reduce Sierra Leone’s future Green House Gas emissions. To do so, it aims to provide up to four MegaWatts of sustainable renewable electricity in rural communities through mini-grid installations with private sector involvement. In 2018, the project expanded 50 of the previously constructed health centre solar power stations and installed distribution networks throughout each village, creating independent mini-grids. It is remarkably enough that any ODA fund was dedicated to “electric power transmission and distribution (isolated mini-grids)” as it is named in the OECD-DAC 23631 sector classification. Any donor, in any time, and none of the three countries considered in this study.
In a nutshell, the success of −4.2 in the multidimensional poverty indicator for electricity in Sierra Leone is better explained considering other resources than ODA. Only three donors gave foreign aid for centralised grids electric power transmission and distribution. Despite these successes, according to International Energy Agency, there were still 6 million people without access to electricity in 2019 and only 26% of Sierra Leonese have access to electricity: 52% in urban zones but only 6% in rural villages (IEA 2021 [43]).

3.4. Sierra Leone Case Study. Using Disaggregated ODA Data

The purpose of this section is to try to link the evolution of poverty and foreign aid (ODA ammounts). As we explained above, we use for the first time, aid-disaggregated data from the AidData database. As we also have disaggregated MPI, incidence (headcount), and intensity of poverty by districts, we could use this micro-level unit for the analysis. As Table 8 shows, ODA projects for 2013–2017 (the period between the two poverty surveys) came from seven multilateral and three bilateral donors (Ireland, United Kingdom, and Japan).
Based on data form multidimensional poverty country briefs, we computed and ranked the changes in MPI, headcount (Hc) and intensity (A) of poverty and the aid received by district between 2013 and 2017 (Table 9).
The Pearson correlation between aid (column 8) and change in MPI (column 2) is −0.4139; between aid (column 8) and poverty incidence (column 4) is −0.2682 and between aid (column 2) and intensity of poverty (column 6) is −0.2573.
Data of the table shows that Kenema district was where MPI decreased most, especially because of the incidence (−29.7%). Aid for the Kenema ranked the third with 11% of the total aid.
In the same vein, Kono district was the second in the reduction of MPI, incidence and was the district where more aid was allocated (17.8%).
Kambia is an example of a district where poverty was reduced especially in intensity (−8.3%) but was penultimate in aid allocation (4.3%).
Bonthe district was where the poverty reduction was smallest under the three indicators (MPI, incidence and intensity). Bonthe received 5.6% of total aid.
All in all, although we cannot show robust evidence that aid does not causally explain the poverty reduction in Sierra Leone, we show some evidence that -at least at district level- it is a reasonable hypothesis. Further and more detailed evidence could come from projects impact evaluations (using random control trials or other rigorous techniques for attributing causality), but this level of evidence is out of the purpose of this paper.

4. Discussion

The hypothesis of the paper was that, conversely the micro-macro paradox identified by Mosley (1986) [17] a macro-micro paradox might be detected, at least in these three Sub-Saharan countries. Mosley found that ODA flows might show positive results when the goals of the ODA projects were evaluated, but there was not any positive macro result when aid and growth were analysed. We have identified a positive cointegration between ODA and GDP (macro effect), but this result is not enough to show that ODA was an effective financial instrument to reduce multidimensional poverty when a sectorial and spatial analysis were carried out (meso or micro effect). In fact, the main findings of the paper are that, although a positive cointegration between ODA and GDP may be identified, ODA flows were not focused on the sectors that are more related to multidimensional poverty indicators and -at least in the case of Sierra Leone- neither on the districts where multidimensional poverty were higher.
It is worth bearing in mind that a macro predictive model between aid and growth was not our main interest. We did not want to offer policy measures based on past data, on how aid can increase economic growth. We are more interested in showing how ODA flows and poverty indicators are linked, in the vein of the 2030 Agenda and Sustainable Development Goal 1 and target 1.2. “By 2030, reduce at least by half the proportion of men, women and children of all ages living in poverty in all its dimensions according to national definitions”. If poverty is multidimensional and ODA flows try to reduce poverty, how are they linked?
Thus, we propose a macro-micro paradox opposite to that of Mosley, who estimated that aid worked in the micro sphere but did not transfer to the macro (GDP per capita). Our argument is that, although cointegration (correlated trends) in macro variables can be identified with aid, this is not enough to believe that aid is reducing poverty (multidimensional). As such, our results suggest a reversal macro-micro paradox.
The political economy consequence of our results is that the analysis of the aid-growth nexus is not enough to state the effectiveness of foreign aid and its contribution to reach SDGs targets. A micro analysis based on disaggregated data is required15. Aid data based on geospatial allocation on ODA project and the poverty indicator that was intended to reduce, is necessary when the research question is whether ODA flows are linked to multidimensional poverty results at the country level16. The theory of change that underlies our framework can be seen in Figure 12.
IPM allows for disaggregated poverty indicators by space (urban or rural, districts), groups (ethnic, gender), sex (male, female), ages (especially for youths and children) or deprivation (each of the ten indicators). This information is not being systematically considered by ODA donors in their plans and aid allocation criteria. In other words, the four effectiveness principles of the Global Partnership for Effective Development Co-operation (country ownership, focus on results, inclusive partnerships and transparency and mutual accountability) should be a norm, not an aspiration17. We have shown great room for maneuvering to improve their implementation in the cases of Guinea, Liberia and Sierra Leone (see Table 5).
Our results, especially in the case study of Sierra Leone, show that country ownership, defined as “countries set their own national development priorities, and development partners align their support accordingly while using country systems” is still more a wish than a reality. Donors might take advantage of Sierra Leonean national multidimensional poverty index and data [44] as a base line to align their ODA contributions, at least those that have the specific intention of reducing poverty (ODA for the poor). This would be a sign that the Global Partnership’s work is going further than the irrelevance.
Linking ODA to MPI indicators can be a concrete and successful good practice in line with the Global Partnership Action Area 2.6. “strengthening development effectiveness at subnational level to achieve the SDGs”. The Partnership echoes the low capacity that cities, municipalities, local and regional authorities have to exert a real influence on donors allocations, but the Partnership only offers a space for dialogue and knowledge sharing on how to overcome the challenges that implementing the 2030 Agenda implies. Our recommendation to associate ODA projects and programmes to multidimensional poverty indicators might help to overcome the level of vagueness and rhetoric of the Partnership discourse. We believe that linking ODA to multidimensional poverty indicators, disaggregated by space, groups, sex, ages and deprivations may be an effective contribution to “enhance international support for implementing effective and targeted capacity building in developing countries to support national plans to implement all the SDGs, including North-South, South-South and triangular cooperation” (target 17.9. of the 2030 Agenda for Sustainable Development).

5. Conclusions

Using a VECM, we identified significant positive cointegration between ODA, GDP and its components for Guinea, Liberia (with caveats) and Sierra Leone. This finding is in line with the effect in other regions (see Dash 2021 [45] for South Asian countries) and the use of cointegration techniques [46].
However, when we analyse ODA by sectors and their links with multidimensional poverty indicators, we do not find a close relationship. Finally, in the case of Sierra Leone and using disaggregated aid data, we find that districts with higher poverty incidence and intensity are not those who received more aid. Regarding electricity access, it was other public and private funds that explain the success in the rural electrification coverage in Sierra Leone.
Instead of the Mosley’s micro-macro paradox, we find a macro-micro paradox in the sense that despite the positive cointegration results, there is not enough convinced evidence that ODA has contributed to the remarkable positive multidimensional poverty results in these countries, even when the Ebola’s outbreak has happened.
The policy implications of these findings are clear: ODA donors can make better contributions to multidimensional poverty reduction. They should incorporate the poverty indicators disaggregated in rural and urban zones in their foreign aid allocation plans. Their monitor and evaluation exercises should be focused on these poverty measures if the 2030 Agenda for Sustainable Development is taken seriously into account. The multidimensional poverty indicators are already aligned with Sustainable Development Goals. Better ownership is needed, especially when some recipient countries, such as Sierra Leone, have elaborated their own multidimensional poverty index and development plan [44] which has disaggregated information by rural and urban areas, regions and districts.
To improve our knowledge and certainty of the effects of ODA on poverty, it is necessary that aid projects are linked to a particular multidimensional poverty indicator. Nowadays this information is not available for many recipient countries. We could only use Sierra Leone’s case for an initial study. More research is needed to link the, perhaps, rhetorical purpose of aid to eradicate poverty (SDGs target 17.2) and to get a clearer knowledge to what extent aid is responsible for the results of SDG-1, target 1.2., both in rural and urban places.

Author Contributions

Conceptualization, J.M.L.; methodology, J.M.L. and C.Q.G.; software, C.Q.G.; validation, J.M.L. and C.Q.G.; formal analysis, C.Q.G.; investigation, J.M.L.; resources, J.M.L.; data curation, J.M.L.; writing—original draft preparation, J.M.L. and C.Q.G.; writing—review and editing, J.M.L. and C.Q.G.; visualization, J.M.L. All authors have read and agreed to the published version of the manuscript.

Funding

This research received no external funding.

Institutional Review Board Statement

Not applicable.

Informed Consent Statement

Not applicable.

Data Availability Statement

The data presented in this study are available on request from the correspondence author.

Conflicts of Interest

The authors declare no conflict of interest.

Notes

1
One option is to use cluster analysis as Larrú et al. (2021) [24].
2
See https://www.oecd.org/dac/effectiveness/thehighlevelforaonaideffectivenessahistory.htm (accessed on 19 October 2021) for a brief summary of the Forums.
3
Literaly, “We emphasize that international public finance plays an important role in complementing the efforts of countries to mobilize public resources domestically, especially in the poorest and most vulnerable countries with limited domestic resources. An important use of international public finance, including official development assistance (ODA), is to catalyse additional resource mobilization from other sources, public and private. ODA providers reaffirm their respective commitments, including the commitment by many developed countries to achieve the target of 0.7 per cent of gross national income for official development assistance (ODA/GNI) to developing countries and 0.15 per cent to 0.2 per cent of ODA/GNI to least developed countries” (number 43).
4
The share is only 14% for developing countries. Foreign Direct Investment reaches 51% in developing countries, whereas is only 29% in least developing countries.
5
Porteus shows that 45% of all economics journal articles and 65% of articles in the top five economics journals are about five countries (namely, South Africa, Nigeria, Ghana, Kenya and Ethiopia) accounting for just 16% of the continent's population. 91% of the variation in the number of articles across countries can be explained by a peacefulness index, the number of international tourist arrivals, having English as an official language, and population. The majority of research is context-specific, so the continued lack of research on many African countries means that the evidence base for local policy-makers is much smaller in these countries. In the Porteus work, neither the volume of trade nor the foreign aid received by each country, could explained the attention received in academic journals [47].
6
According to UNCTAD classification among 47 countries: https://unctad.org/topic/vulnerable-economies/least-developed-countries/list (accessed on 25 November 2021).
7
Guinea ranked 175 out of 189 countries in the Human Development Report 2018, whereas Liberia was 181° and Sierra Leone 184°. Their HDI values were 0.459; 0.435 and 0.419 respectively.
8
The other members are Benin, Burkina Faso, Cabo Verde, Côte d'Ivoire, Gambia, Guinea, Guinea-Bissau, Liberia, Malí, Níger, Nigeria, Senegal y Togo.
9
The source of these data is UN ComTrade database.
10
Sierra Leone’s exports to Guinea in 2017 were 1.84% of the total exports and 1.93% to Liberia. Imports from Guinea to Sierra Leone were 0.78% and 0.08% from Liberia.
11
This dataset represents the most comprehensive project-level data tracking international development finance. The base of the Research Release is all core data exported from the AidData Portal at www.aiddata.org. The Research Release serves as (1) a time-stamped version of AidData’s core data, which allows users and researchers to replicate their research results, and (2) a version of the data that is provided in a flat-table structure, allowing for users and researchers to analyze annual commitments more easily. This dataset was developed by AidData with the support of AidData’s core funders, including the Hewlett Foundation.
12
Oxford Poverty and Human Development Initiative (2015). “Sierra Leone Country Briefing”, Multidimensional Poverty Index Data Bank. OPHI, University of Oxford, January.
13
We get the data from OPHI (2020) Global MPI Country Briefing 2020: Sierra Leone (Sub-Saharan Africa).
14
15
See for example Shao & Wang (2021) [48] analysing the Japanese aid to China.
16
For instance, Dreher et al (2019) [49] used and geocoded 1650 Chinese development finance projects across 3097 physical locations committed to Africa over the 2000–2012 period to analyse if current African political leaders' birth regions receive substantially larger financial flows from China than other regions.
17
In fact, this was the main conclusion of the 21st meeting of the Global Partnership Steering Committee for the next High-Level Meeting scheduled for late 2022.

References

  1. Alesina, A.; Dollar, D. Who Gives Foreign Aid to Whom and Why? J. Econ. Growth 2000, 5, 33–63. [Google Scholar] [CrossRef]
  2. Annen, K.; Knack, S. Better Policies from Policy-Selective Aid? World Bank Econ. Rev. 2021, 35, 829–844. [Google Scholar] [CrossRef]
  3. Bourguignon, F.; Plateau, J.F. Aid allocation: The role of external discipline. Int. Econ. 2021, in press. [Google Scholar] [CrossRef]
  4. Dreher, A.; Simon, J.; Valasek, J. Optimal decision rules in multilateral aid funds. Rev. Int. Organ. 2021, 16, 689–719. [Google Scholar] [CrossRef]
  5. Dreher, A.; Lang, V.; Rosendorff, B.P.; Vreeland, J.R. Bilateral or Multilateral? International Financial Flows and the Dirty-Work Hypothesis. J. Politics 2021, in press. [Google Scholar] [CrossRef]
  6. Tengstam, S.; Isaksson, A.-S. Kill Your Darlings? Do New Aid Flows Help Achieve a Poverty Minimizing Allocation of Aid? IFN Working Paper No. 1415; Research Insitute of Industrial Economics: Stockholm, Sweden, 2021. [Google Scholar]
  7. Asatullaeva, Z.; Aghdam, R.F.Z.; Ahmad, N.; Tashpulatova, L. The impact of foreign aid on economic development: A systematic literature review and content analysis of the top 50 most influential papers. J. Int. Dev. 2021, 33, 717–751. [Google Scholar] [CrossRef]
  8. Clemens, M.; Radelet, S.; Bhavnani, R.; Bazzi, S. Counting chickens when they hatch: Timing and the effects of aid on growth. Econ. J. 2012, 122, 590–617. [Google Scholar] [CrossRef] [Green Version]
  9. Minoiu, C.; Reddy, S. Development Aid and Economic Growth: A Positive Long-Run Relation. Q. Rev. Econ. Financ. 2010, 50, 27–39. [Google Scholar] [CrossRef] [Green Version]
  10. Roodman, D. The Anarchy of Numbers: Aid, Development, and Cross-country Empirics. World Bank Econ. Rev. 2007, 21, 255–277. [Google Scholar] [CrossRef] [Green Version]
  11. Roodman, D. A Replication of ‘Counting Chickens When They Hatch’ (Economic Journal 2012). Public Financ. Rev. 2015, 43, 256–281. [Google Scholar] [CrossRef] [Green Version]
  12. Banerjee, A.; Duflo, E.; Goldberg, N.; Karlan, D.; Osei, R.; Parienté, W.; Shapiro, J.; Thuysbaert, B.; Udry, C. A multifaceted program causes lasting progress for the very poor: Evidence from six countries. Science 2015, 348. [Google Scholar] [CrossRef] [PubMed] [Green Version]
  13. Butler, D. Short Term Aid Has Long-Term Impact. Nature 2015, 521, 269. [Google Scholar] [CrossRef] [PubMed]
  14. Inter-Agency Task Force on Financing for Sustainable Development. Financing for Sustainable Development Report 2019; United Nations: New York, NY, USA, 2019. [Google Scholar]
  15. UNDP; OPHI. Global Multidimensional Poverty index 2020—Charting Pathways out of Multidimensional Poverty: Achieving the SDGs; Report; Unite Nations Development Programme and Oxford Poverty and Human Development Initiative: Oxford, UK, 2020. [Google Scholar]
  16. Alkire, S.; Kanagaratnam, U.; Suppa, N. The Global Multidimensional Poverty Index (MPI) 2020; OPHI MPI Methodological Notes, 49; Oxford Poverty and Human Development Initiative, University of Oxford: Oxford, UK, 2020. [Google Scholar]
  17. Mosley, P. Aid-Effectiveness: The Micro-Macro Paradox. IDS Bull. 1986, 17, 22–35. [Google Scholar] [CrossRef] [Green Version]
  18. Ferreira, I.A.; Simões, M.C. Aid and growth: A comparative study between Sub-Saharan Africa and Asia. Appl. Econom. Int. Dev. 2013, 13, 113–132. [Google Scholar]
  19. Roberts, G.O. The role of foreign aid in independent Sierra Leone. J. Black Stud. 1975, 5, 339–373. [Google Scholar] [CrossRef]
  20. Tang, K.B.; Bundhoo, D. Foreign Aid and Economic Growth in Developing Countries: Evidence from Sub-Saharan Africa. Theor. Econ. Lett. 2017, 7, 1473–1491. [Google Scholar] [CrossRef] [Green Version]
  21. Casey, K.; Glennerster, R.; Miguel, E.; Voors, M.J. Long Run Effects of Aid: Forecasts and Evidence from Sierra Leone. Natl. Bur. Econ. Res. 2021. [Google Scholar] [CrossRef]
  22. Kargbo, P.M. Impact of Foreign Aid on Economic Growth in Sierra Leone: Empirical Analysis; WIDER Working Paper No. 2012/07; The United Nations University World Institute for Development Economics Research (UNU-WIDER): Helsinki, Finland, 2012. [Google Scholar]
  23. Larrú, J.M. Linking ODA to the MPI: A Proposal for Latin America. Glob. Econ. J. 2017, 17, 20170041. [Google Scholar] [CrossRef]
  24. Larrú, J.M.; Ibar, R.; Quesada, C. Grouping foreign aid and the Multidimensional Poverty Index: A cluster analysis. J. Econ. Coop. Dev. 2021, 42. [Google Scholar]
  25. Buera, F.J.; Kaboski, J.P.; Townsend, R.M. From Micro to Macro Development. Natl. Bur. Econ. Res. 2021. [Google Scholar] [CrossRef]
  26. OECD. Creditor Reporting System Database. 2021. Available online: https://stats.oecd.org/index.aspx?DataSetCode=CRS1 (accessed on 15 May 2021).
  27. AidData. SierraLeoneAIMS_GeocodedResearchRelease_Level1_v1.0 Geocoded Dataset; AidData: Williamsburg, VA, USA; Washington, DC, USA, 2017; Available online: http://aiddata.org/research-datasets.https://www.aiddata.org/datasets (accessed on 15 March 2021).
  28. Tierney, M.J.; Nielson, D.L.; Hawkins, D.G.; Roberts, J.T.; Findley, M.G.; Powers, R.M.; Parks, B.; Wilson, S.E.; Hicks, R.L. More dollars than sense: Refining our knowledge of development finance using AidData. World Dev. 2011, 39, 1891–1906. [Google Scholar] [CrossRef]
  29. Alkire, S.; Kovesdi, F.; Mitchell, C.; Pinilla-Roncancio, M.; Scharlin-Pettee, S. Changes over Time in the Global Multidimensional Poverty Index; OPHI MPI Methodological Notes 50; Oxford Poverty and Human Development Initiative, University of Oxford: Oxford, UK, 2020. [Google Scholar]
  30. Alkire, S.; Kanagaratnam, U.; Suppa, N. The Global Multidimensional Poverty Index (MPI) 2021; OPHI MPI Methodological Notes 51; Oxford Poverty and Human Development Initiative, University of Oxford: Oxford, UK, 2021. [Google Scholar]
  31. Alkire, S.; Roche, J.M.; Vaz, A. Multidimensional Poverty Dynamics: Methodology and Results for 34 Countries; Oxford Poverty and Human Development Initiative, Oxford University: Oxford, UK, 2014. [Google Scholar]
  32. Doucouliagos, H.; Paldam, M. The Ineffectiveness of Development Aid on Growth: An Update Covering Four Years of Research. Eur. J. Political Econ. 2011, 27, 399–404. [Google Scholar] [CrossRef]
  33. Kalyvitis, S.; Stengos, T.; Vlachaki, I. Are Aid Flows Excessive or Insufficient? Estimating the Growth Impact of Aid in Threshold Regressions. Scott. J. Political Econ. 2012, 59, 298–315. [Google Scholar] [CrossRef]
  34. Quibria, M.Q. Aid Effectiveness: Research, Policy and Unresolved Issues. Dev. Stud. Res. 2014, 1, 75–87. [Google Scholar] [CrossRef] [Green Version]
  35. Juselius, K.; Framroze, N.; Tarp, F. The Long-Run Impact of Foreign Aid in 36 African Countries. Insights from Multivariate Time Series Analysis. Oxf. Bull. Econ. Stat. 2014, 76, 153–184. [Google Scholar] [CrossRef] [Green Version]
  36. Lof, M.; Mekasha, T.J.; Tarp, F. Aid and Income: Another Time-series Perspective. World Dev. 2015, 69, 19–30. [Google Scholar] [CrossRef]
  37. Nowak-Lehmann, D.F.; Dreher, A.; Herzer, D.; Klasen, S.; Martínez-Zarzoso, I. Does Foreign Aid Really Raise Per-Capita Income? A Time Series Perspective. Can. J. Econ. 2012, 45, 288–313. [Google Scholar] [CrossRef]
  38. Alkire, S.; Foster, J. Counting and multidimensional poverty measurement. J. Public Econ. 2011, 95, 476–487. [Google Scholar] [CrossRef] [Green Version]
  39. Alkire, S.; Kanagaratnam, U.; Suppa, N. The Global Multidimensional Poverty Index (MPI) 2018; OPHI MPI Methodological Notes 46; Oxford Poverty and Human Development Initiative, University of Oxford: Oxford, UK, 2018. [Google Scholar]
  40. Larrú, J.M. Poverty Index: Welfarist and Multidimensional Approaches. In No Poverty. Encyclopedia of the UN Sustainable Development Goals; Leal Filho, W., Azul, A., Brandli, L., Lange Salvia, A., Özuyar, P., Wall, T., Eds.; Springer: Cham, Switzerland, 2020. [Google Scholar]
  41. Green, W.H. Econometric Analysis, 5th ed.; New York University: New York, NY, USA; Prentice Hall: Hoboken, NJ, USA, 2003. [Google Scholar]
  42. Alkire, S.; Kanagaratnam, U.; Vollmer, F. Interlinkages between Multidimensional Poverty and Electricity: A Study Using the Global Multidimensional Poverty Index; The Rockefeller Foundation and Oxford Poverty and Human Development Initiative: Oxford, UK, 2021. [Google Scholar]
  43. IEA. World Energy Outlook 2020; International Energy Agency: Paris, France, 2021. [Google Scholar]
  44. Government of Sierra Leone. Sierra Leone Multidimensional Poverty Index 2019; UNDP and Oxford Poverty and Human Development Initiative: Oxford, UK, 2019. [Google Scholar]
  45. Dash, A.K. Does foreign aid influence economic growth? Evidence from South Asian countries. Transnatl. Corp. Rev. 2021. [Google Scholar] [CrossRef]
  46. Herzer, D.; Grimm, M. Does foreign aid increase private investment? Evidence from panel cointegration. Appl. Econ. 2012, 44, 2537–2550. [Google Scholar] [CrossRef]
  47. Porteus, O. Research Deserts and Oases: Evidence from 27 Thousand Economics Journal Articles on Africa. Working Paper. 2020. Available online: https://sites.google.com/site/oporteous/research (accessed on 15 October 2020).
  48. Shao, J.; Wang, J.M. Revisiting Economic Effectiveness of Foreign Aid: The Case of Japanese Aid to China. The World Economy 2021, in press. [Google Scholar] [CrossRef]
  49. Dreher, A.; Fuchs, A.; Hodler, R.; Parks, B.C.; Raschky, P.A.; Tierney, M.J. African leaders and the geography of China’s foreign assistance. J. Dev. Econ. 2019, 140, 44–71. [Google Scholar] [CrossRef]
Figure 1. Countries and indictors of poverty reduction where each country ranked first among developing countries analized by UNDP & OPHI (2020) [15]. Percentage change between surveys years and annuliazed change in parenthesis.
Land 11 00010 g001
Figure 2. Research strategy. Author’s elaboration.
Land 11 00010 g002
Figure 3. Time series of GDP growth. Source: World Bank, World Development Indicators.
Land 11 00010 g003
Figure 4. Net ODA flows in relative terms. Source: World Bank: WDI.
Land 11 00010 g004
Figure 5. Time series of net ODA in constant dollars. Source: World Bank; World Development Indicators.
Land 11 00010 g005
Figure 6. Main donors to Guinea. Source: Authors’ elaboration with data from OECD-DAC Table 2a: net ODA total net disbursements in constant USD, 2018.
Land 11 00010 g006
Figure 7. Main donors to Liberia. Source: Authors’ elaboration with data from OECD-DAC Table 2a: net ODA total net disbursements in constant USD, 2018.
Land 11 00010 g007
Figure 8. Main donors to Sierra Leone. Source: Authors’ elaboration with data from OECD-DAC Table 2a: net ODA total net disbursements in constant USD, 2018.
Land 11 00010 g008
Figure 9. Reduction in the global MPI, and its headcount and intensity. Note: annualized relative changes in the Multidimensional Poverty Index harmonized for comparisons across time (MPIT). Time periods are: Guinea 2012–2016; Liberia 2007–2013; Sierra Leone 2013–2017. Source: Alkire et al. (2020) [16,29].
Land 11 00010 g009
Figure 10. Reduction in each multidimensional poverty indicator. Notes: Annualized changes. This table provides censored headcount ratios for each of the 10 MPI indicators. Censored headcount ratios are the proportion of people who are MPI poor and experience deprivations in each of the indicators. Source: Alkire et al. (2020) [16,29].
Land 11 00010 g010
Figure 11. Poverty incidence in rural and urban locations. Source: Authors elaboration based on Alkire et al. (2021) [30].
Land 11 00010 g011
Figure 12. Theory of the change that underlies the relationship between ODA and MPI. Source: Author’s elaboration.
Land 11 00010 g012
Table 1. Economic structure: selected indicators (in percentage of GDP).
CountryExportsImportsAgricultureIndustryServices
Guinea21.9 (40% gold; 36% aluminum ores)−36.9 (14% petroleum oils; 11% rice)19.832.148.1
Liberia17.5−89.23413.852.2
Sierra Leone26.8 (17% motor vehicles; 14% cocoa beans)−55.3 (rice 19%; 6.5% motor cars)60.76.532.9
Source: CIA Factbook and UN ComTrade database. Liberians values are for 2016 whereas for Guinea and Sierra Leone are 2017 estimations. Trade data for Liberia were not available in the UN ComTrade database.
Table 2. Analysis of the stationarity of time series: step 1.
GuineaLiberiaSierra Leona
Variablep-ValueDecisionp-ValueDecisionp-ValueDecision
Net ODA0.0571Non-Stationary0.613Non-Stationary0.9586Non-Stationary
GDP0.8974Non-Stationary0.9841Non-Stationary0.9743Non-Stationary
Gross Capital Form.0.6418Non-Stationary0.0594Non-Stationary0.7923Non-Stationary
Exports0.9082Non-Stationary0.0Stationary0.8895Non-Stationary
Imports0.9306Non-Stationary0.0039Stationary0.9711Non-Stationary
Consumption0.9162Non-Stationary0.8734Non-Stationary0.9951Non-Stationary
Source: Author’s elaboration.
Table 3. Analysis of the stationarity of time series: step 2.
GuineaLiberiaSierra Leona
Variable (1st diff)p-ValueDecisionp-ValueDecisionp-ValueDecision
Net ODA0.6781Non-Stationary0.6578Non-Stationary0.0001Stationary
GDP0.0004Stationary0.2638Non-Stationary0.0Stationary
Gross Capital Form.0.0001Stationary0.0Stationary0.0Stationary
Exports0.0Stationary--0.0Stationary
Imports0.0044Stationary--0.0Stationary
Consumption0.0003Stationary0.0001Stationary0.0064Stationary
Source: Author’s elaboration.
Table 4. Lags order and cointegration ranks.
GuineaLiberiaSierra Leone
Lag order202
Cointegration rank401
Source: Author’s elaboration.
Table 5. ODA quality indicators.
Year2008201120162018
Indicator/CountryGuineaLiberiaSierra LeoneAfricaGuineaLiberiaSierra LeoneAfricaGuineaLiberiaSierra LeoneAfricaGuineaLiberiaSierra LeoneAfrica
% of use of country-owned results frameworks by providers of development co-operation (SDG 17.15.1)72.1%44.4%49.4%66.0%
% of new development interventions that draw objectives from country-led results frameworks100%100%90.0%84.8%69.2%100%88.9%79.7%
% of results indicators drawn from country-led results frameworks51.9%51.8%62.8%60.5%82.5%33.3%30.0%62.8%
% of results indicators monitored using the partner country's own sources48.1%53.5%40.6%51.3%64.7%0.0%29.2%53.7%
% of new interventions that plan a final evaluation with partner country involvement66.7%11.8%70.4%51.2%25.0%0.0%35.7%54.7%
Indicator 1b: Overall strength of national results framework (%)0.0%70.9%70.5%67.8%
Indicator 5a: Annual predictability of development co-operation99.3%79.5%79.3%N.A.33.3%88.1%79.5%96.8%75.1%94.1%72.4%97.0%98.1%100%86.0%
Indicator 5b: Medium-term predictability of development co-operation100%100%53.3%61.2%N.A.53.3%N.A.59.9%
Indicator 6: Development co-operation is on budgets which are subject to parliamentary scrutinyN.A.38.8%54.0%N.A.100%29.2%21.3%41.4%100%9.3%45.0%N.A.100%N.A.50.2%
Indicator 9b: Use of partner countries public financial management and procurement systems to deliver development co-operation24.0%24.6%31.8%N.A.39.6%32.9%34.8%12.8%81.1%46.9%36.8%16.5%8.8%0.2%28.1%
Indicator 10: Aid is untied66.2%38.3%65.6%87.6%88.4%91.3%80.6%91.9%84.4%95.8%82.4%N.A.71.6%94.2%82.7%
Note: bold percentages mean a value higher than Africa’s average. Source: Global Partnership for Effective Development Cooperation: https://dashboard.effectivecooperation.org/country (accessed on 15 October 2021).
Table 6. ODA by sector for Guinea (2012-16), Liberia (2007-13) and Sierra Leone (2013-17).
Guinea 2012-16Liberia 2007-13Sierra Leone 2013-17GuineaLiberiaSierra Leone
YearTOTAL%TOTAL%TOTAL%
Sector
1000: Total All Sectors3229.21 7122.85 3.783.63
450: Total Sector Allocable1657.4051.3%3270.1545.9%2004.4853.0%Years schooling
100: I. Social Infrastructure & Services, Total1203.3837.3%2276.0632.0%1479.4839.1%−2.7−0.9−1.1
110: I.1. Education, Total195.526.1%200.132.8%132.693.5%School attendance
112: I.1.b. Basic Education, Total46.811.4%108.581.5%62.261.6%−2.2−5.5−3.0
120: I.2. Health, Total468.7014.5%381.385.4%542.0814.3%
122: I.2.b. Basic Health, Total394.4612.2%311.884.4%433.5211.5%
130: I.3. Population Policies/Programmes & Reproductive Health, Total153.144.7%182.072.6%259.626.9%
140: I.4. Water Supply & Sanitation, Total41.571.3%54.840.8%180.384.8%
14030: Basic drinking water supply and basic sanitation13.470.4%21.090.3%4.800.1%drinking wáter
14031: Basic drinking water supply6.630.2%0.020.0%1.780.0%−1.6−0.5−2.9
14032: Basic sanitation5.600.2%0.120.0%3.660.1%Sanitation
14050: Waste management/disposal1.480.0%2.590.0%5.920.2%−3.1−2.9−3.8
150: I.5. Government & Civil Society. Total290.159.0%1380.9319.4%280.677.4%
160: I.6. Other Social Infrastructure & Services. Total54.301.7%76.711.1%84.042.2%
16030: Housing policy and administrative management 0.400.0% Housing
16040: Low-cost housing 0.020.0%0.660.0%−4.4−2.2−3.6
200: II. Economic Infrastructure & Services, Total257.268.0%687.919.7%322.468.5%
210: II.1. Transport & Storage, Total153.774.8%263.363.7%207.375.5%
220: II.2. Communications, Total31.221.0%22.960.3%6.250.2%
230: II.3. Energy, Total68.752.1%331.314.7%75.722.0%Electricity
23630: Electric power transmission and distribution (centralised grids)50.171.6%85.171.2%37.521.0%−2.9−3.2−4.2
240: II.4. Banking & Financial Services, Total0.930.0%5.400.1%19.120.5%
300: III. Production Sectors, Total99.233.1%144.182.0%144.193.8%
400: IV. Multi-Sector/Cross-Cutting, Total97.523.0%162.002.3%58.361.5%Nutrition
500: VI. Commodity Aid/General Programme Assistance, Total390.0112.1%686.569.6%570.4515.1%0.0−1.5−3.4
600: VII. Action Relating to Debt, Total812.5025.2%2667.5637.5%135.343.6%
700: VIII. Humanitarian Aid, Total223.506.9%489.096.9%973.0325.7%cooking-fuel
910: Administrative Costs of Donors, Total8.700.3%4.100.1%13.850.4%−2.4−2.9−4.0
930: Refugees in Donor Countries, Total3.580.1%0.530.0%0.580.0%Assets
998: IX. Unallocated/Unspecified, Total133.524.1%4.860.1%85.892.3%−1.7−4.4−1.0
Note: For comparative purpose, last three columns show the differences in the MPI indicators. Source: author’s elaboration. Based on OECD, Creditor Reporting System. Current USD million.
Table 7. ODA for electricity (millions USD).
Guinea
Year20122013201420152016Total%
Official Donors, Total4.9834.79611.73113.47515.18950.174100.00%
France0.006 ........0.006 0.01%
EU Institutions0.118 ........0.118 0.2%
African Development Fund [AfDF]4.082 3.212 4.859 7.555 11.165 30.873 62%
International Development Association [IDA]0.776 1.584 6.872 5.920 4.024 19.177 38%
Liberia
Year2007200820092010201120122013Total% donor
Official Donors, Total2.1549.83110.12616.01224.00421.2781.76685.171100.0%
Norway2.130 6.071 5.358 10.129 20.580 19.709 ..63.98 75.1%
United States0.024 ............0.024 0.03%
EU Institutions..3.760 4.767 5.883 3.302 0.076 0.129 17.917 21.0%
International Development Association [IDA]........0.123 1.494 1.637 3.253 3.8%
Sierra Leone
Year20132014201520162017Total%
Official Donors, Total0.3570.24712.46714.03910.41137.521100%
Japan0.357 0.247 9.219 0.201 ..10.025 27%
United Kingdom......13.835 2.627 16.462 44%
African Development Fund [AfDF]....0.071 ....0.071 0.2%
International Development Association [IDA]....3.177 0.003 7.784 10.964 29%
Source: author’s elaboration. Based on OECD, Creditor Reporting System. Current USD million.
Table 8. Sectors, donors and projects for Sierra Leone collected by AidData.
SectorDonorsProjects
EducationDFID (UK)14
World Food Program12
HealthIrish Aid4
Islamic Development Bank1
European Union13
Water and sanitationDFID (UK)4
European Union1
EnergyJICA (Japan)1
Government and civil societyIrish Aid1
DFID (UK)9
African Development Bank1
International Organization for Migrations2
UNDP1
European Union41
JICA (Japan)1
Other sectorsOPEC
European Union
DFID (UK)
49
Source: Author’s elaboration.
Table 9. Poverty and foreign aid by districts.
Rank MPIRank HcRank AAidData2013–2017 by Districts
Kenema−0.194Kenema−29.7Kailahun−9.8Kono17,141,41717.8%
Kono−0.194Kono−26.0Kambia−8.3Tonkolili12,759,82013.2%
Kambia−0.186Bo−23.6Tonkolili−7.9Kenema10,610,60211.0%
Port Loko−0.175Western rural−23.5Koinadugu−7.6Kailahun7,514,6197.8%
Kailahun−0.172Port Loko−23.2Moyamba−7.5Bo5,636,8425.9%
Bo−0.170Bombali−22.8Kono−7.0Bombali5,611,6555.8%
Moyamba−0.161Kambia−20.3Bo−6.7Bonthe5,395,4575.6%
Koinadugu−0.140Western urban−19.5Port Loko−6.0Pujehun5,277,8325.5%
Tonkolili−0.138Moyamba−17.2Pujehun−5.2Koinadugu4,802,2525.0%
Bombali−0.136Kailahun−16.8Kenema−4.9Moyamba4,686,4294.9%
Western rural−0.118Tonkolili−12.9Western urban−4.4Port Loko4,547,2274.7%
Pujehun−0.108Koinadugu−12.2Bombali−2.5Western rural4,546,5544.7%
Western urban−0.099Pujehun−11.4Western rural−1.6Kambia4,177,5294.3%
Bonthe−0.062Bonthe−10.3Bonthe−0.5Western urban3,601,2643.7%
Source: Author’s elaboration.
Publisher’s Note: MDPI stays neutral with regard to jurisdictional claims in published maps and institutional affiliations.

