Article

Habitat Integrity in Protected Areas Threatened by LULC Changes and Fragmentation: A Case Study in Tehran Province, Iran

by
Parvaneh Sobhani
1,
Hassan Esmaeilzadeh
1,*,
Shahindokht Barghjelveh
1,
Seyed Mohammad Moein Sadeghi
2 and
Marina Viorela Marcu
2
1
Environmental Sciences Research Institute, Shahid Beheshti University, Evin, Tehran 1983969411, Iran
2
Department of Forest Engineering, Forest Management Planning and Terrestrial Measurements, Faculty of Silviculture and Forest Engineering, Transilvania University of Brasov, Şirul Beethoven 1, 500123 Brasov, Romania
*
Author to whom correspondence should be addressed.
Submission received: 15 November 2021 / Revised: 13 December 2021 / Accepted: 17 December 2021 / Published: 21 December 2021

Abstract

:
The integration and connection of habitats in protected areas (PAs) are essential for the survival of plant and animal species and attaining sustainable development. Investigating the integrity of PAs can be useful in developing connections among patches and decreasing the fragmentation of a habitat. The current study has analyzed spatial and temporal changes to habitat to quantify fragmentation and structural destruction in PAs in Tehran Province, Iran. To achieve this purpose, the trends in land use/land cover (LULC) changes and the quantitative metrics of the landscape ecology approach have been examined. The results revealed that in Lar National Park, low-density pasture has the top increasing trend with 4.2% from 1989 to 2019; in Jajrud PA, built-up has the top increasing trend with 1.5% during the studied years; and among the land uses in TangehVashi Natural Monument, bare land has the top increasing trend with 0.6% from 1989 to 2019. According to the findings, habitat fragmentation and patch numbers have expanded in the studied areas due to the development of economic and physical activities. The results also indicate that the current trend of habitat fragmentation in PAs will have the highest negative impacts, especially in decreasing habitat integrity, changing the structure of patterns and spatial elements, and increasing the edge effect of patches.

1. Introduction

One of the main goals of the Millennium Development Report is to ensure environmental sustainability [1], which is responsible maintenance of natural resources and the avoidance of jeopardizing the ability of future generations to meet their needs [2]. Environmental sustainability is a core prerequisite for lasting socio-economic development. Mitigating future environmental problems and improving livelihoods everywhere depend on healthy and diverse ecosystems and natural resources [1]. One crucial area playing the main role in maintaining natural resources and achieving environmental sustainability is protected areas (PAs), which have high sensitivity because of their recognized natural, ecological, or cultural values [3,4], and they must be widely preserved. The core issue in PAs is habitat integrity, which helps maintain natural resources and biodiversity, especially when habitat is complementary [5,6,7]. Habitat integrity is associated with how pristine an environment is and its function relative to an ecosystem’s potential or original state before imposed human exploitations and alterations [8,9]. It is built on the assumption that a decline in the values of an ecosystem’s functions is primarily caused by human activity [9].
Unprincipled land use/land cover (LULC) change is one of the most critical problems in most PAs of Iran because it disrupts environmental planning and increases landscape fragmentation. Iran ranks 5th globally in terms of its high diversity in plant and animal species [10]; thus, it is essential to maintain habitat integrity in its PAs. Tehran Province (as the capital of Iran), with 11 PAs [11], is one of the wealthiest provinces of Iran and can be a good platform for the development of plant and animal species. Unfortunately, in recent decades and for various reasons, PAs in this province has undergone several changes. Therefore, habitat integrity in these areas has been seriously threatened. Many factors have contributed to the growing habitat fragmentation in these areas, such as LULC changes, the illegal activities of multiple organizations in the various development projects, road construction, the development of various infrastructures, the establishment of industrial spaces, and overexploitation of mines, even while these areas are protected by the Department of Environment of Iran and must have the highest protection conditions. Other problems, such as livestock overgrazing by the nomads and the widespread development of tourism activities, have been insufficiently monitored by the Provincial Department of Environment, thus resulting in the destruction of pastures, depletion of water resources and vegetation, and severe damage to ecosystems in these areas. The existence of numerous tourist attractions (like Mount Damavand, Lar dam, Kamard waterfall, the unique forests of wild pistachio (Pistacia atlantica Desf.), Latian Dam, Jajrud River, the beautiful landscapes of TangehVashi Natural Monument, and diverse medicinal plant species) that have national and regional importance has encouraged tourism and the development of tourism activities. In addition to the low level of monitoring in the area has affected the destruction of natural resources in these areas. Undoubtedly, the continuation of this process will decrease landscape integrity and increase environmental unsustainability. Moreover, due to the rapid physical growth of the Tehran metropolis in recent decades, some PAs are now located in the city’s interior. This issue has led to increased LULC changes. Therefore, controlling LULC changes and developing conservation approaches to decrease habitat fragmentations are essential to achieving environmental sustainability in PAs.
The landscape ecology approach is one of the main methods of identifying the integrity level of ecosystems. This approach examines the relationship between patterns and functions on spatial and temporal scales and the impacts of ecological processes and natural habitats [12]. Accordingly, landscape ecologists have developed metrics to quantify ecological patterns and the effects of human activities on ecosystem processes, each of which can elucidate a visible change in the landscape [5]. Several researchers have evidenced the usefulness of these metrics for evaluating the state of habitat integrity in PAs, including Paolaet et al. [13], who studied “using landscape structure to develop quantitative baselines for PAs monitoring”. They also used landscape metrics, including COHESION (cohesion index), MESH (effective mesh size), PD (patch density), CWED (contrast-weighted edge density), TECI (total edge contrast index), CONTAG (contagion), and SHDI (Shannon’s diversity index), and focused on the spatial characteristics of LULC classes in the landscape. The results revealed that PD, CWED, and TECI had been increased at the level of LULC classes, while COHESION, MESH, CONTAG, and SHDI have been decreased, which elucidates the decrease in integrity patches. Scariot et al. [14] studied connectivity dynamics of Araucaria forest and grassland surrounding a national forest in Southern Brazil. Because changes in the structure of natural habitats surrounding PAs interfere with biodiversity conservation measures, this research analyzed the fragmentation and loss of vegetation in three landscape levels surrounding Passo Fundo National Forest, RS, Brazil, in 1986, 1997, and 2011, and identified the degree of isolation/connectivity of these patches. Another study was the work of Castillo et al. [15] on the “evaluation of forest cover change using remote sensing techniques and landscape metrics in Moncayo Natural Park (Spain)”. This research analyzed LULC changes to assess the state of habitat integrity in PAs through quantitative landscape metrics over LULC maps. The metrics used in this study included PD, NP (number of patches), COHESION, LPI (largest patch index), PLAND (percentage of landscape), AREA-MN (mean of patch area), ENN-MN (mean of Euclidean nearest neighbor distance), and CA (class area) and focused on the class level. These metrics were selected based on past research on forest evolution, natural parks, or urban expansion [16,17,18,19,20]. De Matos et al. [21] studied “PAs and forest fragmentation: sustainability index for prioritizing fragments for landscape restoration” and developed a forest sustainability index based on the landscape ecology approach. Accordingly, a LULC map was used to calculate landscape metrics at two levels: landscape and patch. Hence, the metrics combination which best represented their goal included CA, NP, MPS (mean path size), MSI (mean shape index), TCAI (total core area index), and ENNM (mean distance from the nearest neighboring patch). Landscape structure analysis showed that MSI, MPS, and NP metrics decreased at the forest level, explaining the decrease in the number of patches, total edge, and mean patch size. On the other hand, CA, TCAI, and ENNM metrics were increased at the forest level, explaining the increase in integrity patches. Moreover, Adriana-Chetan and Dornik [22] studied 20 years of landscape dynamics within the world’s largest international network of PAs. Accordingly, the suitable metrics applied to analyze the change in fragmentation were NP, MPS, DI (division index), and DOM (dominance index). The results indicated that NP and DOM were increased, while MPS and DI were decreased.
According to different studies, landscape metrics are generally classified into landscape composition and configuration. Landscape composition metrics evaluate the landscape regardless of spatial features, while landscape configuration examines the spatial arrangement of landscape elements, and their calculation requires spatial information [23]. Metrics such as SHDI or PLAND are commonly used to study landscape composition, while landscape configuration metrics involve MNN (mean nearest neighbor distance), PLAD (percentage of like adjacency), MSI, or MPI [24]. These metrics are essential in the study of habitat fragmentation, where patch isolation causes the extinction of species populations by decreasing dispersion in patches [25,26]. In some cases, habitat fragmentation reduces the continuity of the population in the face of natural hazards (e.g., fires and storms) [27]. In addition, the MSI and MPS metrics were used to examine various environmental features, animal search strategies and flows between patches [28]. The MSI metric is directly related to the overall heterogeneity of the landscape, while the CA metric provides space to support appropriate populations in terms of ecological relevance [29]. In general, not enough attention is given to classifying and selecting related landscape composition and configuration metrics in different studies. Accordingly, the current research has considered this issue, and landscape configuration metrics have been used. The purpose of these metrics is to quantify ecological patterns and the impacts of human activities on habitats. Hence, the most common metrics used in this study are CA, CAP (class area percentage), NP, TE (total edge), MSI, MNN, and MPS. The research’s main questions were: (1) What extent were the LULC changes in the studied areas during recent decades? (2) What is the level of habitat fragmentation in the studied areas? (3) What are the major impacts of habitat fragmentation on the ecosystem’s structure and functions in the studied areas? Finally, (4) what is the situation of habitat integrity in the studied sites? Hence, this study aimed to evaluate the state of habitat integrity in PAs through quantitative landscape metrics and compared the results of LULC changes and fragmentation in three different PAs, including a national park, protected area, and national natural monument. Then, as no other studies have done, the impacts of habitat fragmentation on the structure and function of the ecosystem were analyzed. In addition, habitat integrity was assessed in various study sites.

2. Materials and Methods

2.1. PAs of Tehran Province

In this study, three different PAs in Tehran Province, namely Lar National Park, Jajrud PA, and TangehVashi National Natural Monument, were selected because of the severe LULC changes and uncontrolled development of human activities in these areas and their proximity to Tehran. The average annual temperature is 17 °C, relative humidity is 41%, and rainfall averages 200 mm, making this province a semi-arid climate [30,31]. Accordingly, the characteristics of the PAs studied are described below:
(1)
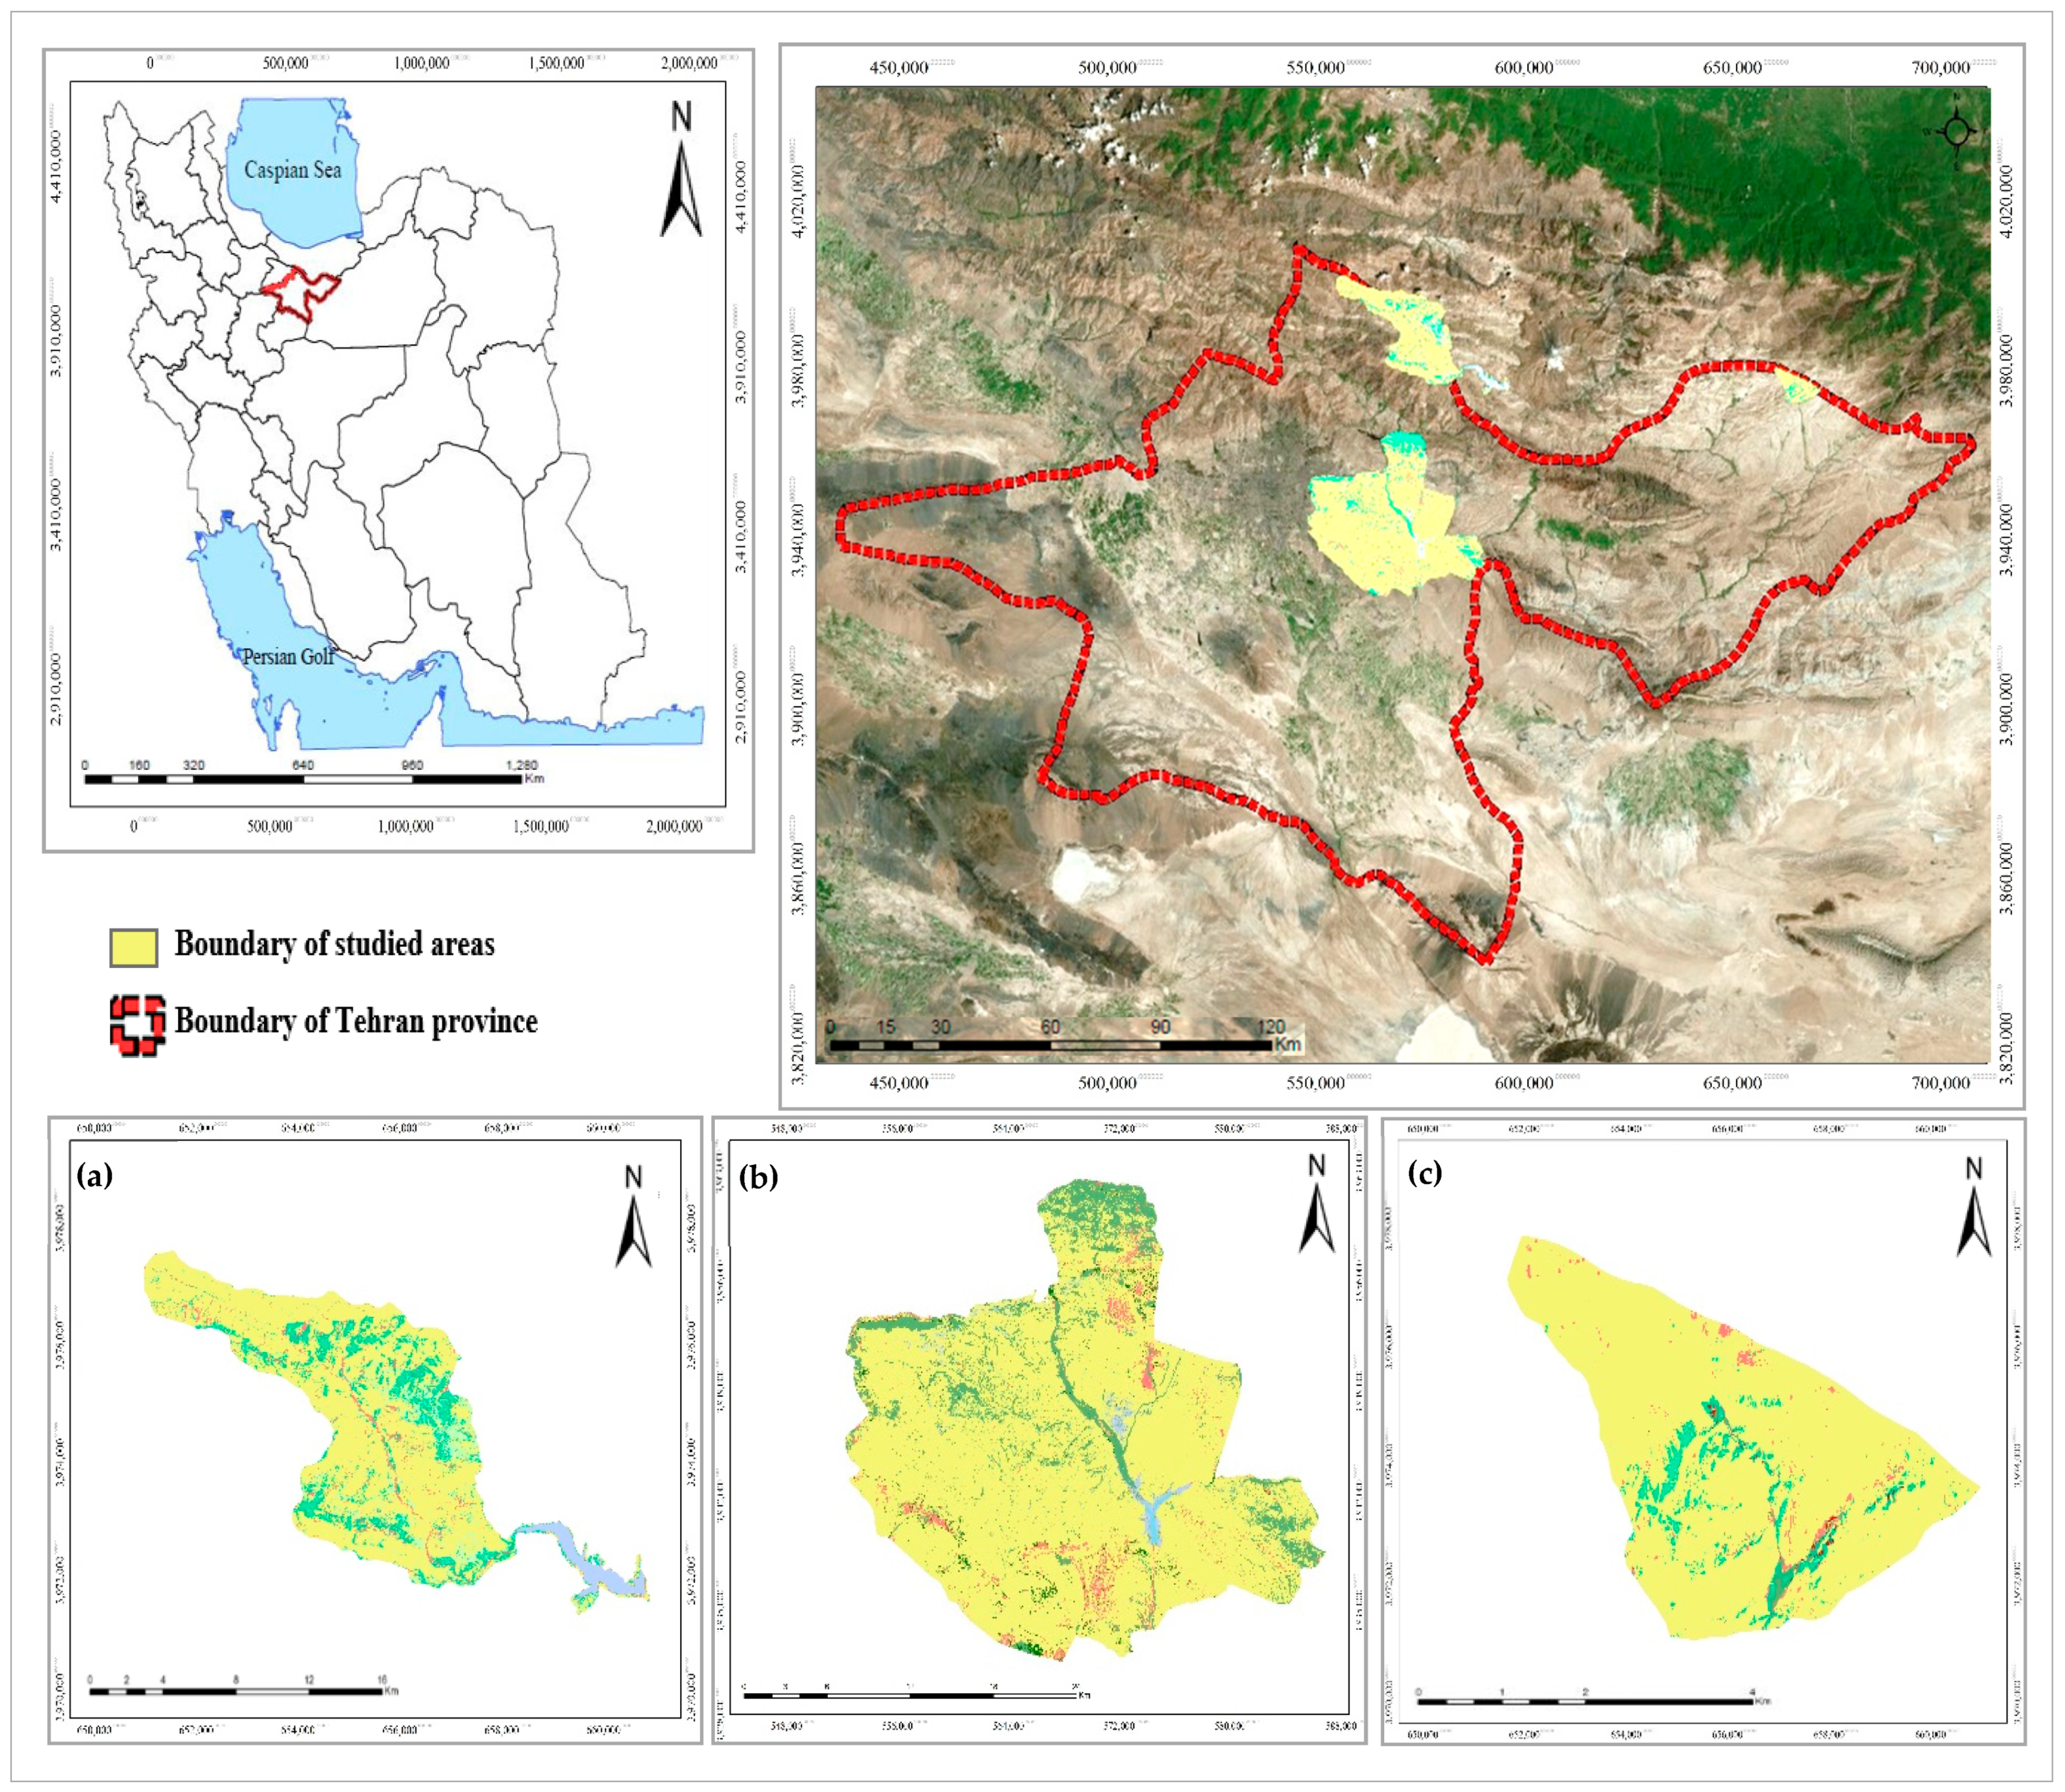
Lar National Park has an area of about 28,037 ha on the western slopes of Mount Damavand between Mazandaran and Tehran Provinces. One hundred fifty-nine vertebrate animal species have been identified in this area, including Central Alborz Ovis orientalis (endemic species; IUCN red list category: endangered (EN)), Capra aegagrus (endemic species; IUCN red list category: vulnerable (VU)), Panthera pardussaxicolor (endemic species; IUCN red list category: critically endangered (CR)), and Canis lupus (endemic species; IUCN red list category: least concern (LC)). In addition, this area is considered as one of the few main habitats of Salmo trutta fario (endemic species; IUCN red list category: LC) in Iran and is therefore very important. In terms of vegetation, it has an alpine cover, medicinal plants, and food plants, which have a long history and good reputation [32,33].
(2)
Jajrud PA, with an area of about 75,670 ha, is located in the east of the Tehran metropolis. This area has the Khojir and Sorkheh Hesar National Parks, both of which have high biodiversity value. Jajrud PA is the primary habitat of O. orientalis and C. aegagrus species. Moreover, 517 vascular plant species have been identified in the area (e.g., Astragalus sp., Artemisia sp., Bromus sp., Amygdalus sp., and Zygophyllum sp.) [33,34].
(3)
TangehVashi is a national natural monument in Tehran Province with an area of 3650 ha and is located about 160 km from the metropolis of Tehran. This area is famous for its waterfall, beautiful plains, and historical relief. One of the prominent and endemic plant species of this area is Ferula gummosa, and among the wildlife species of this area are O. orientalis and C. aegagrus [35]. Figure 1 shows the location of the studied areas [36].

2.2. Methods

2.2.1. Research Methods

Study about the LULC changes is the main prerequisite to quantify landscape fragmentation level. Therefore, we studied two aspects: (1) the assessment of landscape features (quantification of landscape metrics such as fragmentation), and (2) analysis of the change of those landscape features. To do this, LULC changes were examined using satellite images during different periods (1989, 1999, 2009, and 2019). Then the statuses of landscape metrics were quantified through the obtained quantitative results. Quantifying the landscape metrics was not possible without examining LULC changes. Hence, the Landsat data archive, which houses historical-spatial information, is essential for studying particular land areas for more than 40 years (from 1972 until now). These data have a high application in studying the trend of LULC changes (free and easy access during these years). Landsat images have a high potential to recognize vegetation due to their red (R) and near-infrared (NIR) bands [37,38]. Moreover, considering the first program of socio-economic and cultural development of Iran began in 1989 (after the revolution of the Islamic Republic of Iran and the war between Iran and Iraq) and increased the growth of population and urbanization, LULC changes, environmental problems, etc., Landsat images from 1989 to 2019 were assessed in this research. LULC maps were prepared from L5-TM (1 April 1989), L5-TM (1 April 1999), L7-ETM+ (2 May 2009), and L8 and OLI-TIRS (2 May 2019) from the U.S. Geological Survey (USGS). Spring images (April and May) were used to evaluate LULC changes because the accuracy of the images in these months was higher in terms of the degree of cloud cover and most pasture covers can be seen in this season.
The GPS pointing method was used to geometrically correct images. GPS data were collected during a field survey to support LULC mapping. A set of field sites was selected using random sampling, and images used were also corrected by ground control points (30 points for each of the studied areas) and resampling equations. In addition, the nearest neighbor resampling method was used to calculate output pixel DN values from input DN values (resample pixel value of uncorrected image). This method used the nearest pixel value in an input image as the new value for the output pixel. Accordingly, geometric corrections were performed using first-degree polynomial functions, GPS points, and a topographic map at a scale of 1:25,000, yielding RMS error values for TM, ETM+, and OLI-TIRS of 0.39, 0.43, and 0.48 pixels, respectively, which is very desirable. Partial radiometric corrections were also used to reduce atmospheric and unexpected variables among multi-time images. Reducing the opacity of phenomena (dark object subtraction method) is one of the relative radiometric correction methods [39]. This method is used in cases where the image of some pixels is in full shadow and their radiation in the satellite is completely due to the scattering of the atmosphere (path radiation). This path radiance value is then subtracted from each pixel value in the image. This process was used to reduce the effects of atmospheric diffusion on the image. Finally, the impacts of habitat fragmentation on the structure and function of the ecosystem in the study areas were analyzed according to experts’ viewpoints using the Delphi method. Figure 2 depicts the flow diagram of the methodological process.

2.2.2. Classify Images

The Anderson scheme, a standard system for displaying LULC information and classification [40], was used in this study to classify images. Various methods, including support vector machine (SVM), random forest (RF), neural network (NN), and regression trees (RT), have been proposed for classification. Still, maximum likelihood (ML) is one of the most common methods [41,42]) and was used in this study. LULC classes indicate how much a region is covered by forests, wetlands, impervious surfaces, agriculture, or other land and water types. Moreover, considering that the studied data have a normal distribution, LULC maps were classified based on the ML algorithm. Accordingly, LULC in Lar National Park was classified as built-up, water body, cropland and garden, high-density pasture, and low-density pasture. The Jajrud PA was classified as built-up, water body, cropland and garden, high-density pasture, low-density pasture, and planted forest. In TangehVashi, LULCs were classified into four classes (i.e., built-up, high-density pasture, low-density pasture, and bare land). Using training samples for LULC classes, 600 samples were examined from the sampled collection, and 300 samples were examined for algorithm training, and 300 samples were evaluated for classification evaluation. Finally, classification accuracy was examined against the ground truth data, and a set of training samples for LULC classes (300 pixels) was collected for this purpose (Table S1). The confusion matrix, which displays information from classification errors, was used to assess accuracy [43,44].
To prepare LULC maps of the studied areas, after pre-processing, images from 1989, 1999, 2009, and 2019 were classified. Then, overall accuracy and the kappa coefficient were evaluated. This study presented overall accuracy, producer, and user accuracy with a 95% confidence interval in ENVI software (1989 to 2019). Moreover, the kappa coefficient, derived from the confusion matrix, was used to test accuracy in the correct cells’ location and quantity [45,46,47]. Pastures supply a wide variety of ecosystem goods and services for humans. Due to human activities and LULC changes with decreasing vegetation, increasing invasive species, and soil erosion [48]. Accordingly, pasture management is essential for livestock grazing, related ecosystem goods, and services in PAs. Given that pastures are one of the main plant species in terms of area and dominant vegetation in these areas, pasture classes and the trend of changes in their density from 1989 to 2019 were investigated in this study. Considering the canopy cover percentage, pasture species were classified mainly into low-density pastures (with a coverage of less than 25%), moderate-density pastures (with a coverage of 25–50%), and high-density pastures (with a coverage of more than 50%) [49]; accordingly, the present study employed the normalized difference vegetation index (NDVI) to distinguish vegetation from other kinds of cover in ENVI software, and LULC of pastures was classified into the two classes of high-density and low-density [50,51]. Two images were also used for each year in this study to classify cropland and garden because of changes in planting and harvesting stages during the year. Moreover, principal component analysis (PCA) was used to reduce and remove input variables. This process helped improve the interpretability of images and remove extracted and invisible information [52,53,54]. Roads not only interrupt ecological areas, decrease integrity, and reduce vegetation, they also lead to loss of wildlife and decreased biodiversity [55,56,57,58,59]. Accordingly, the vector layer was converted into a raster image with a 30-m pixel to classify roads as part of the built-up areas.

2.2.3. Landscape Metrics

According to Table 1, the LULC pattern was assessed using landscape configuration metrics at the class level. Hence, landscape metric changes in the high-density pasture class were investigated as the main land use in terms of area and dominant vegetation in these areas from 1989 to 2019. Accordingly, the appropriate metrics for evaluating the state of habitat integrity in the studied areas included CA, CAP, NP, TE, MSI, MNN, and MPS [60]; such metrics are important to investigating habitat fragmentation and patch isolation. Landscape metrics should be selected according to the characteristics of the study areas and specific objectives [61]. Accordingly, the metrics chosen in this research are based on similar studies [15,59,60,62,63,64] and the features of the studied areas.

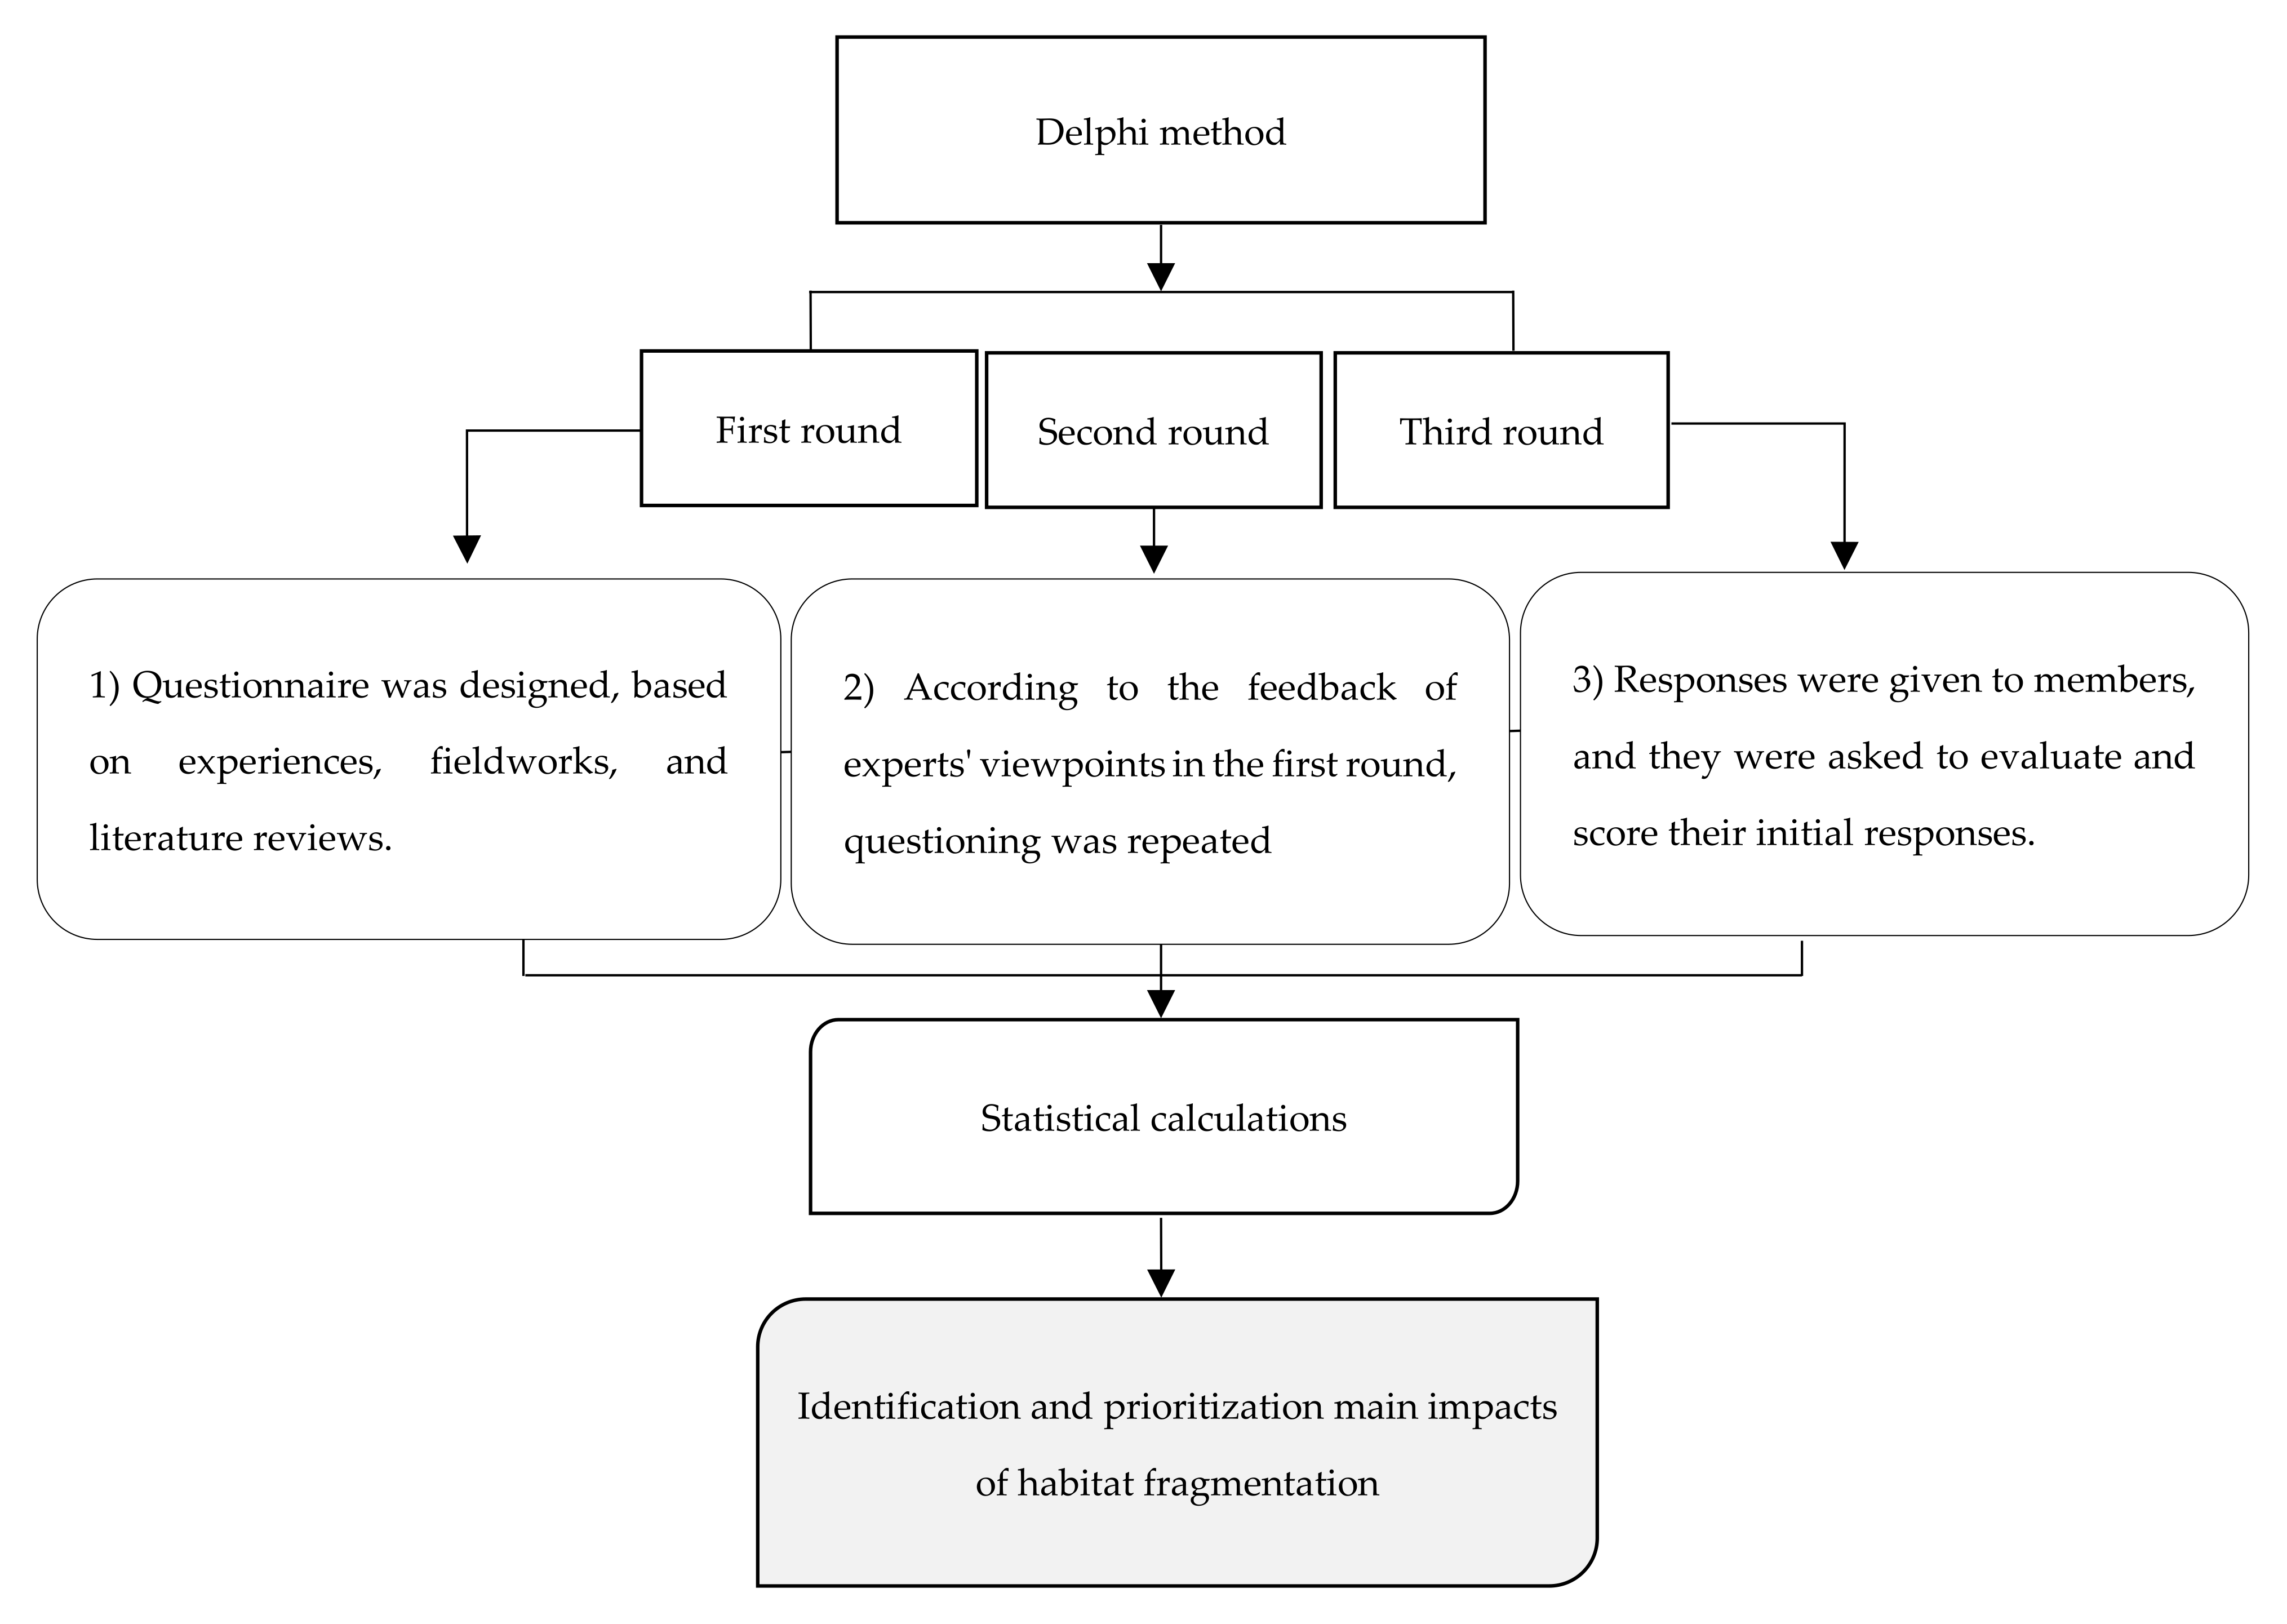
2.2.4. Delphi Method

Delphi is a method of group knowledge acquisition that has a structural process to predict and facilitate decision-making during survey rounds, data collection, and finally, group consensus [65,66]. This method allows researchers to achieve a theoretical consensus based on experts’ opinions where data and information are unreliable and experts’ viewpoints are heterogeneous [67,68,69,70]. Hence, this study used the Delphi as an appropriate method to reach a consensus among experts, predict the future, and complete the current information through a group of experts, with whose participation, the impacts of habitat fragmentation were identified and assessed. To estimate the impacts of habitat fragmentation, 20 indicators were designed in the form of a series of questionnaires completed by 40 experts who were selected from among academics with related scientific specialties (such as environmental engineering, biodiversity, zoology, biology, landscape designing and planning, and geography) (Table 2). To obtain quantitative information about the impacts of habitat fragmentation, the experts determined a value from 1 to 5 (very low, low, moderate, high, and very high). Then, the collected data were analyzed using statistical tests. Hence, the mean, standard deviation (SD), and variance (V) were calculated for each impact. Finally, according to the obtained results, the effects of habitat fragmentation were ranked from highest to lowest. In general, the Delphi method was conducted in three rounds [71]. In this study, the three rounds comprised the following (Figure 3): the first round of the Delphi questionnaire was designed based on experiences, fieldwork, and literature review. In the second round, questioning was repeated based on the experts’ feedback in the first round. Among the 40 participants, four people did not respond within the allotted time (Table 2). Finally, in the third round, responses were given to members, and they were asked to evaluate and score their initial responses (Table 2). In this round, two other people did not respond to the questions; thus, 34 questionnaires were completed and used to identify and analyze the major impacts of habitat fragmentation in the studied areas (Table 2). After the viewpoints of the participants were obtained, statistical calculations were performed and the impacts were prioritized. Accordingly, the results of the Delphi method were based on the feedback of experts, and by analyzing the experts’ viewpoints, a consensus was reached on the possible impacts of habitat fragmentation on the structure and function of the ecosystem.

3. Results

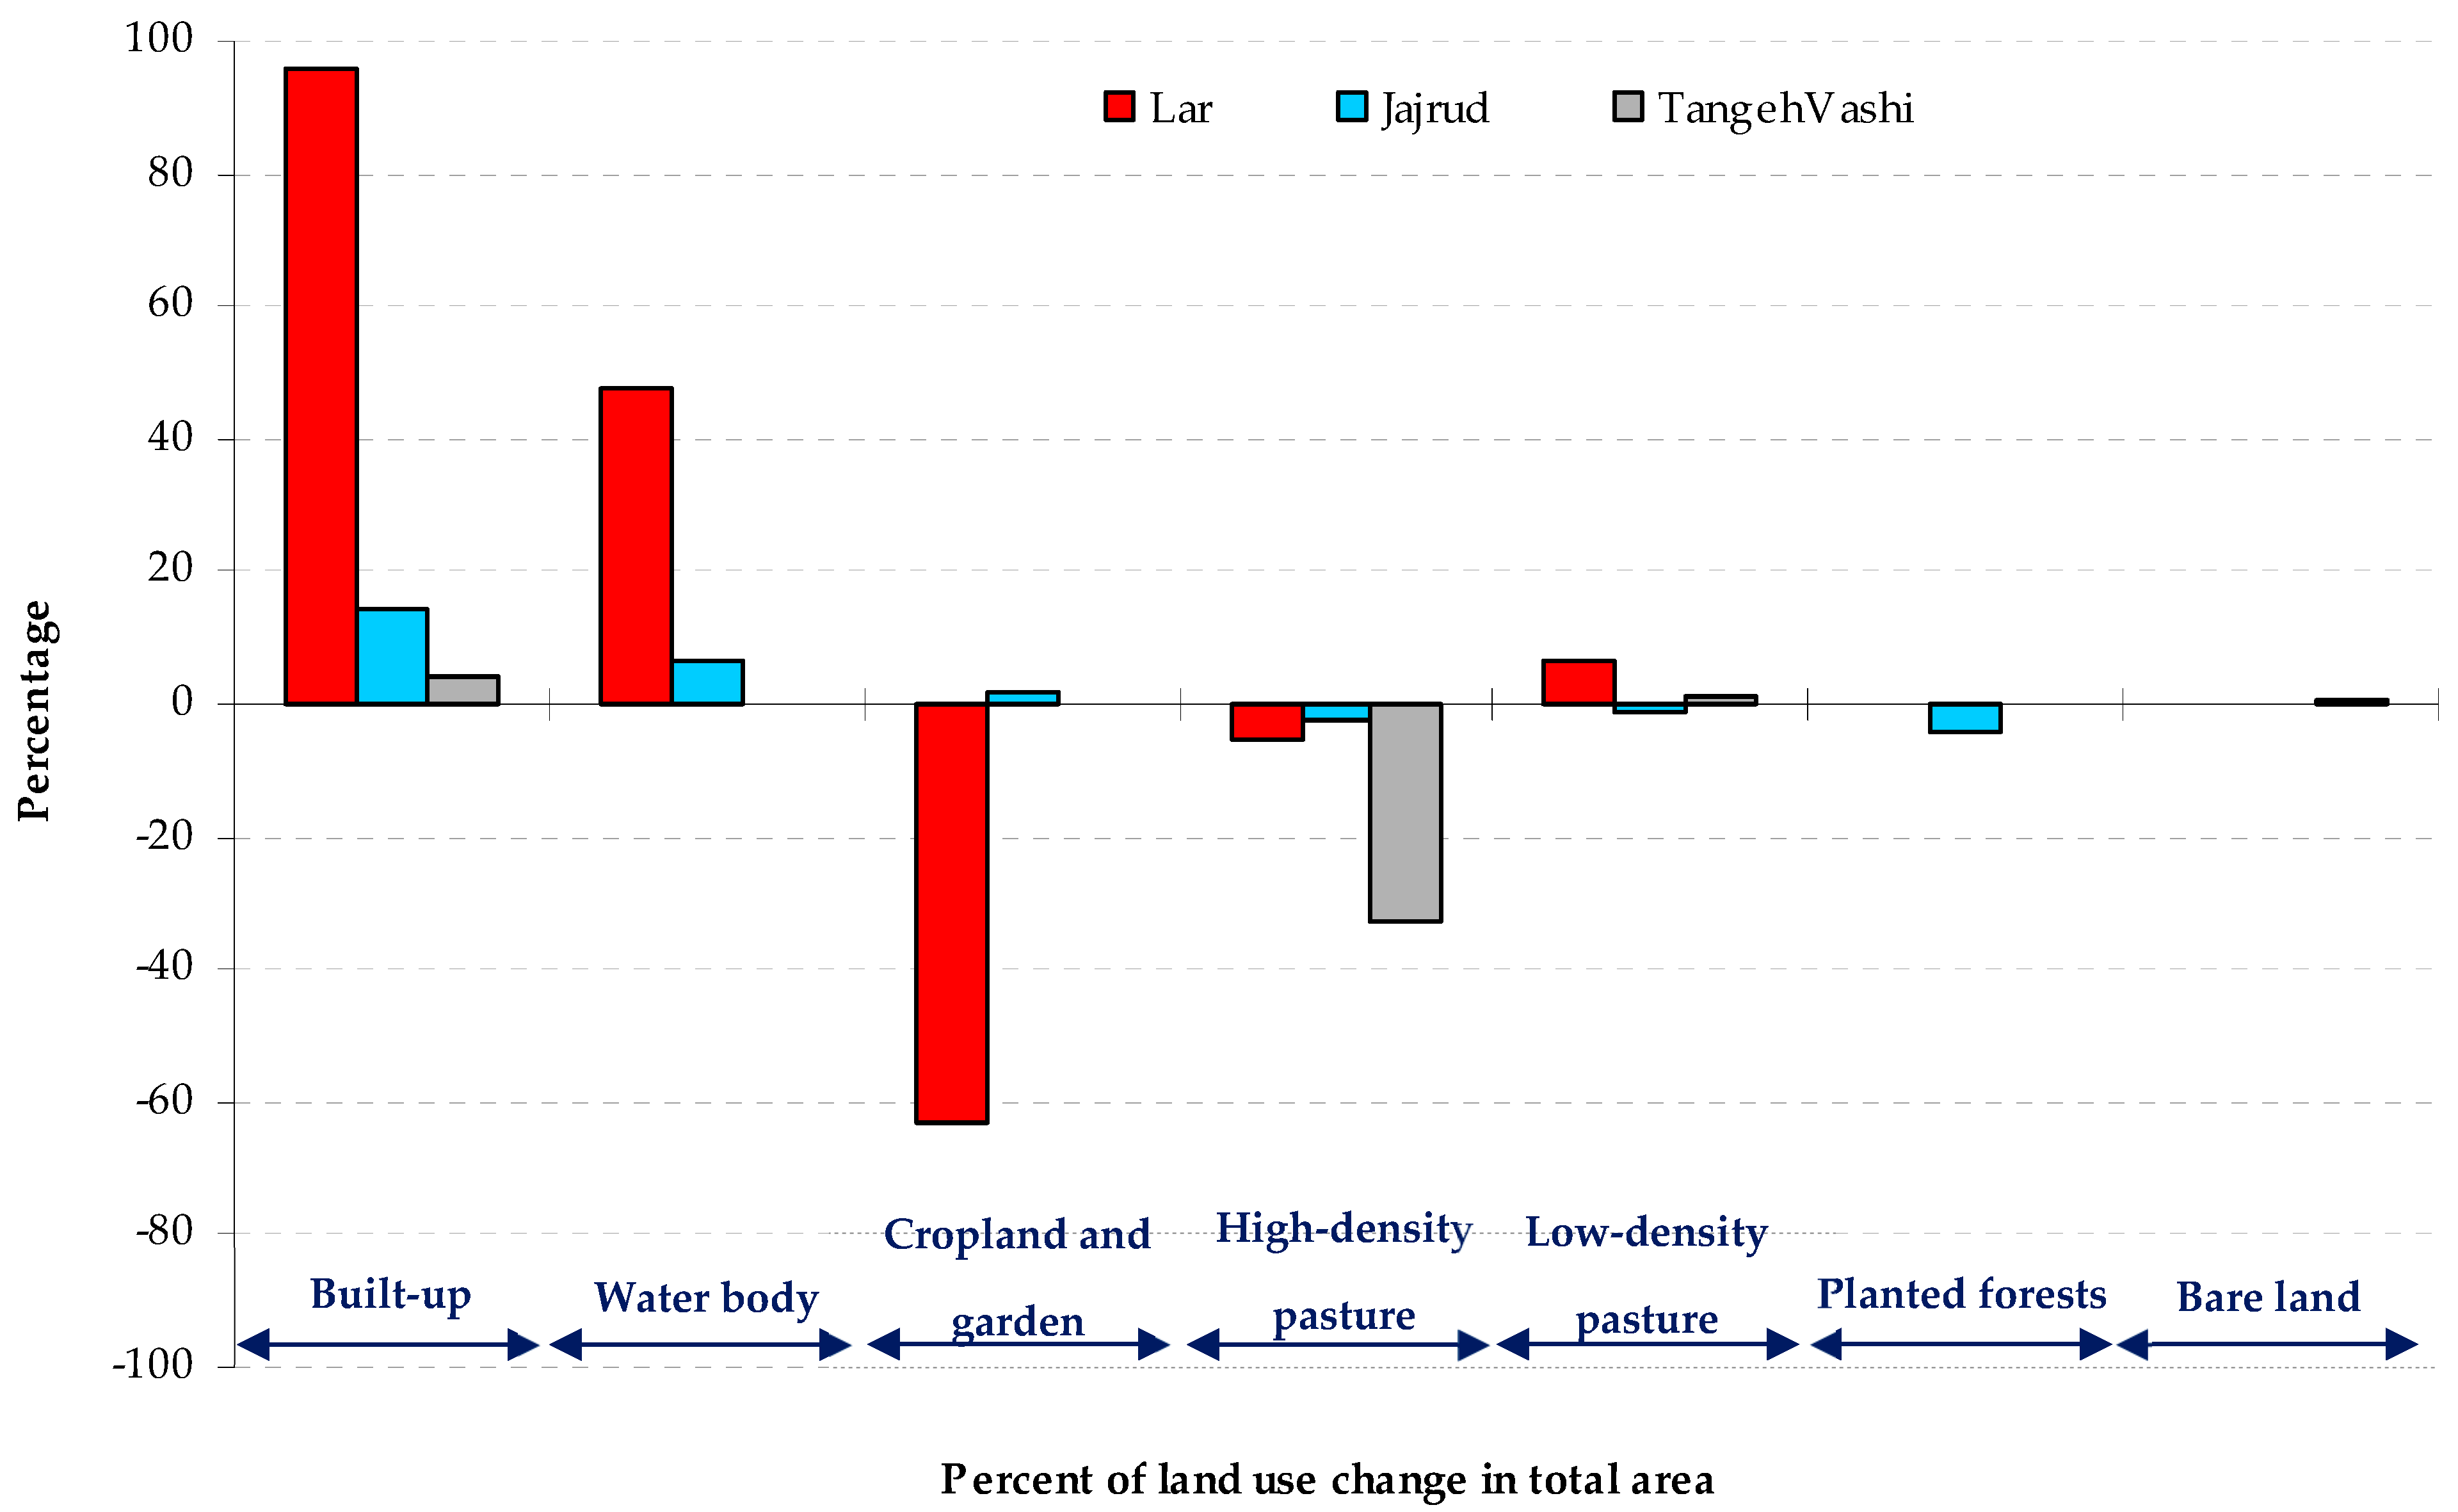
3.1. LULC Temporal Change

In Lar National Park, overall accuracy from 1989, 1999, 2009, and 2019 was 0.90, 0.85, 0.94, and 0.92, respectively, and the kappa coefficient was 0.86, 0.77, 0.92, and 0.89, respectively (Table 3). In the Jajrud PA, overall accuracy was 0.87, 0.92, 0.85, and 0.97 the kappa coefficient was 0.76, 0.88, 0.81, and 0.95, respectively (Table 3). Finally, in TangehVashi Natural Monument, overall accuracy was 0.90, 0.87, 0.91, 0.98, and the kappa coefficient was 0.86, 0.83, 0.85, and 0.89, respectively, for the studied years (Table 3). The results revealed that the greatest overall accuracy was related to TangehVashi Natural Monument among the studied areas. Furthermore, the kappa coefficient and overall accuracy were high in efficiency and acceptable in all three areas. Accordingly, the confusion matrix results were obtained in the form of four tables during the studied years. However, due to space limitations, only the results of 2019 are presented herein (Table S2). According to Table 4 and Figure 4, the largest contribution among the LULC in Lar National Park was low-density pasture, with 69.03% in 2019 compared to 64.83% in 1989. In the Jajrud PA, the greatest land use was allocated to low-density pasture during studied periods (Table 4 and Figure 4). Bare land had the most expanded land use in the TangehVashi Natural Monument (Table 4 and Figure 4).
The results indicate that in Jajrud PA, high-density pasture experienced the highest rate of area decrease with 37.71% (28,540 ha) in 2019 compared to 38.64% (29,241 ha) in 1989. Low-density pasture also decreased during the studied years, with 44.85% (33,938 ha) in 2019 compared to 45.43% (34,380 ha) in 1989. In this area, built-up had the top increasing trend with 11.95% (9048 ha) in 2019 compared to 10.43% (7895 ha) in 1989. Water body increased, with 0.94% (715 ha) in 2019 compared to 0.88% (676 ha) in 1989. Among other LULC, cropland and garden increased by 2.31% (1753 ha) in 2019 compared to 2.27% (1724 ha) in 1989 and planted forest increased from 2.21% (1675 ha) in 2019 compared to 2.31% (1754 ha) in 1989 (Figure 5). Finally, in the TangehVashi Natural Monument, bare land had the top increasing trend with 81.42% (2972 ha) in 2019 compared to 80.84% (2951 ha) in 1989, while high-density pasture decreased during the studied years, with 1.17% (43 ha) in 2019 compared to 1.94% (71 ha) in 1989. In this area, low-density pasture increased by 17.1% (626 ha) in 2019 compared to 16.98% (620 ha) in 1989. Another LULC is built-up, which increased from 0.24% (9 ha) in 2019 compared to 0.21% (8 ha) in 1989 (Figure 6). According to the results, the greatest decreasing trend in LULC in Lar National Park was related to cropland and garden. In Jajrud PA and the TangehVashi Natural Monument, the decreasing trend was related to high-density pasture. In addition, the greatest increasing trend in LULC changes was related to low-density pasture in Lar National Park, a built-up area in Jajrud PA, and bare land in TangehVashi Natural Monument.
Figure 7 and Figure S1 show the percentage of LULC changes in the studied areas from 1989 to 2019. For example, among these three studied areas, the greatest change of the high-density pastures class is related to Lar National Park from 1989 to 2019 (Figure S1 and Figure 7).

3.2. Landscape Metrics Temporal Change

As seen in Table 5, the trend of changes in landscape metrics in high-density pastures was investigated as the main LULC in terms of area and dominant vegetation from 1989 to 2019. As the results of landscape metrics analysis elucidate, in Lar National Park, the CA, CAP, and MPS metrics were decreased at the level of high-density pastures during the studied years, which illustrates an increase in fragmentation of patch size (Table 5). However, NP, MSI, MNN, and TE increased, indicating a decrease in habitat integrity. Moreover, among the metrics in Lar National Park, the CA metric had the top decreasing trend with 7122 ha in 2019 compared to 7515 ha in 1989, while the TE metric had the highest increasing trend with 784,156 m in 2019 compared to 482,145 m in 1989 (Table 5). In the Jajrud PA, CA, CAP, and MPS also decreased at the level of high-density pasture class during the studied years, which elucidates the increase in fragmentation patch size (Table 5). However, NP, MSI, MNN, and TE increased, which shows a decrease in habitat integrity. Moreover, among the metrics in this area, CA had the top decreasing trend with 28,540 ha in 2019 compared to 29,241 ha in 1989, while TE had the top increasing trend with 812,565 m in 2019 compared to 532,145 m in 1989 (Table 5). Finally, in TangehVashi, CA, CAP and MPS decreased at the high-density pasture class level, explaining the fragmentation patch size increase (Table 5). However, NP, MSI, MNN, and TE increased, which indicates a decrease in habitat integrity (Table 5). Furthermore, among the metrics in this area, CA had the top decreasing trend with 43 ha in 2019 compared with 71 ha in 1989, while TE had the top increasing trend with 641,421 m in 2019 compared with 385,412 m in 1989 (Table 5). According to the results, the increasing number and distance between patches caused habitat fragmentation to grow in these areas (Table 5). Hence, habitat fragmentation and patch distance have expanded while the size of the patches has decreased (Table 5). Moreover, the results revealed that among all the metrics, in Lar National Park, NP with 6021 patches had the top increasing trend, while in TangehVashi, NP with 4872 patches had the lowest increasing trend (Table 5). Accordingly, the results indicated that most habitat fragmentation was related to Lar National Park, while the lowest was associated with the TangehVashi Natural Monument (Table 5).

3.3. Assessment of Habitat Integrity

After repeating the Delphi method in 3 rounds, the results were obtained in three tables; due to space limitations in the article, the results of rounds 1 and 2 have been presented in the Supplementary Files, and the results of round 3 are as follows. According to Table S3, 23 impacts were extracted in the first round of Delphi using the experts’ viewpoints, and in the second round, 21 impacts were extracted using the experts’ viewpoints (Table S4). In the first round of the Delphi, the impacts of habitat boundary change and increase in inbreeding among species were removed from the questions in subsequent rounds based on the experts’ viewpoints. The results revealed that the most important impacts of fragmentation differ among areas because of the degree of biological sensitivity and LULC changes in these areas. In round 3 of the Delphi method, 20 impacts were determined based on the experts’ responses. As seen in Table 6, most of the impacts of habitat fragmentation were related to Jajrud PA with a score of 3.80; the lowest impacts were related to TangehVashi Natural Monument with a score of 3.09 (Table 6). In addition, comparing the means of fragmentation impacts in each studied area revealed that in Lar National Park, the greatest impact was related to a decrease in habitat integrity (source and sink) with a score of 4.50 (Table 6). In contrast, the lowest impact was related to soil erosion level (sedimentation and decrease of soil fertility level) with a score of 2.63 (Table 6). In Jajrud PA, the greatest impact was related to changes in the patterns and structure of spatial elements (size, shape, number, type, composition, and status of habitat) with a score of 4.64, and the most negligible impact was related to an increase in water evaporation level with a score of 3.15 (Table 6). Finally, in TangehVashi Natural Monument, the greatest impact was related to a decrease of stability and increase of the edge effect of patches with a score of 3.77 (Table 6). The least impact is related to disturbance of landscape and environmental desirability with a score of 2.43 (Table 6). According to the current study results, the increasing impacts of habitat fragmentation have caused habitat integrity to decrease in these areas (Table 6).

4. Discussion

Insufficient knowledge to assess habitat integrity in PAs is a significant challenge. The results of some studies have revealed that habitat integrity leads to high protection of biodiversity and achieves environmental sustainability [14,71]. Accordingly, habitat integrity was investigated using landscape ecology metrics in Lar National Park, Jajrud PA, and TangehVashi Natural Monument. Based on the conservation approaches in PAs of Iran, national parks and natural monuments have high sensitivity and low flexibility for the development of human activities [72]; therefore, the exploitation of these areas is prohibited, while in PAs, the development of some restricted economic activities is possible according to the rules and regulations. Hence, to recognize the state of habitat integrity in PAs, this study identified and monitored LULC changes from 1989 to 2019.
Among the LULC in Lar National Park, low-density pasture had the top increasing trend with 69% in 2019 compared to 65% in 1989 (Figure 7). One of the main reasons for this increased volume in a low-density pasture is livestock overgrazing by nomads (the number of livestock is more than the capacity and potential of pastures), which has decreased high-density pasture volume and increased low-density pasture in this area. In previous studies, overgrazing was reported as the most important reason for pasture degradation [73,74]. Another reason is the uncontrolled movement of visitors for hunting, walking, mountaineering, rock climbing, and off-road vehicle driving in this area. There are various famous tourist attractions in this area (such as Mount Damavand, Lar Dam, etc.); therefore, most of the time, many tourists visit the area and cause ecosystem degradation, landscape fragmentation, and environmental unsustainability. For example, off-road vehicle driving is considered as the main contributor to land degradation in semiarid and arid pastures [75]. Insufficient monitoring is one main reason for the uncontrolled entry of nomads and tourists into the area, and they have many negative impacts on habitat integrity. These findings have also been confirmed in literature reviews [32,33,59]. Moreover, Jahani and Saffariha [76] assessed the impacts of livestock and tourism activities on vegetation in Lar National Park. Their results indicated that vegetation diversity has decreased due to overgrazing and the development of tourism activities. Accordingly, the results of many studies have suggested that the diversity and density of vegetation have declined because of the development of human activities [55,56,77,78,79,80,81].
According to the results, Jajrud PA, one of the oldest PAs in Tehran Province, had the top increase in built-up trend with 12% in 2019 compared to 10% in 1989. Accordingly, in the Jajrud PA, habitat integrity has been extensively destroyed due to multiple factors, particularly the interference of different institutions with the management of the PA through the development of physical and economic activities. Through overwhelming influence, different parts of this PA have been assigned to various organizations for financial exploitation, and they could quickly destroy the ecosystem and habitats of the area. The diversity of decision-making institutions has diminished the role of the Department of the Environment of Iran as custodian of the management and decision-making process related to the protection of these areas. Several issues must be analyzed to determine whether the Department of the Environment of Iran are accomplishing their goal to preserve natural resources and biodiversity in PAs, like the conservation budget and logistical shortcomings [82,83,84]. Moreover, another important issue increasing the LULC changes in this area is the growth of human activities, particularly dams, roads, residential complexes, factories, industrial and mining activities, canalization, and gas pipes. The inability of the Department of the Environment of Tehran to monitor and manage the area, along with the influence of some governmental stakeholders, has led to extensive human activities in the area. Furthermore, the deterioration of the PAs was not accounted for due to a lack of monitoring [85]. In addition, the lack of cooperation among different organizations and the Department of the Environment of Tehran in protecting this area has caused extensive destruction and unsustainability in the PAs. As seen in Table 4, during 1989–2019, built-up had the top increasing trend in this area, which led to a decrease in the volume of vegetation, especially high-density pasture. Other studies have confirmed these findings [33,34,62,86,87], which have demonstrated that habitat fragmentation and unsustainability of societies have increased because of human activities such as the development of transportation infrastructures and growth in population and cities.
According to the protection laws and regulations of the Department of the Environment of Iran, TangehVashi Natural Monument has high legal restrictions against all physical and economic activities; however, low-level monitoring and high tourist volume have led to the destruction of vegetation in this area, thus decreasing habitat integrity. Many tourism activities are available in the TangehVashi area, such as mountaineering and rock climbing (especially on weekends and holidays). These activities have caused the destruction of high-density pastures and increased habitat fragmentation. As the results revealed, bare land had the top increasing trend with 81.4% in 2019 compared to 80.8% in 1989. One of the foremost issues affecting the direction of LULC changes in TangehVashi is many tourists to this area. As per statistics from Tehran Province’s Department of the Environment, more than 600,000 tourists visit this area annually [11]. Various factors, such as livestock overgrazing, the widespread development of tourism activities, and natural disasters (e.g., soil erosion and abrupt floods), have reduced vegetation density, especially in the high-density pasture. Other important reasons for LULC changes in the TangehVashi area include the lack of monitoring and control stations, insufficient number of guard stations and environmental guardians, a lack of the necessary protective equipment, and intelligent cameras to monitor the density of tourists. Our literature reviews would support these interpretations [35,88,89,90]. Tourist numbers, vegetation types, and seasonality (both visitor use and plant growth) can affect how soil and vegetation react to tourists’ trampling [91,92]. Additionally, interviews with 93 PA managers globally discovered that the number of guards within the PA was significantly related to PAs’ ability to deter habitat change [93]. Literature reviews suggest that the growing demand for tourism in the PAs may also play a role in driving population increase as a driving force for LULC change [94]. The decreasing trend in changes to the high-density pastures class is related to Lar National Park from 1989 to 2019. The main reasons for these changes are livestock overgrazing, proximity to the metropolis of Tehran, having pristine natural attractions, and the effect of a suitable climate for developing tourism activities.
According to landscape ecology principles, habitat fragmentation leads to an increased number of patches and finally changes in the structure and function of the ecosystem [64]. Landscape metrics can be used to measure the impacts of LULC changes on habitats at different spatial and temporal scales. For example, researchers explain that scale and zoning effects associated with changes in the size, shape, and connectivity of natural and semi-natural LULC affect critical ecological processes such as species migration or influence landscape management [95]. Moreover, different studies have demonstrated that metrics used to examine human activities and LULC types perform well in documenting structural changes through time and investigating the dynamics of LULC changes [96,97]. The results indicated that CA, CAP, and MPS metrics decreased at the level of high-density pastures during the studied years, which explains the increase in the size of fragmentation patches. However, NP, MSI, MNN, and TE increased, which illustrates an increase in the number of patches and a decrease in habitat integrity. Moreover, the most decreasing trend was related to CA among the metrics, while the lowest decreasing trend during the studied years was associated with TE. The findings further demonstrate that the class of high-density pasture had the highest fragmentation during the studied years due to the trend in LULC changes. Hence, increasing the number and distance between patches has caused habitat fragmentation to grow in these areas. One of the main reasons for this issue is the uncontrolled development of human activities, which has decreased habitat integrity; the continuation of this trend will lead to increased unsustainability in these areas.
According to the experts, many authors have highly acknowledged the importance of knowledge-sharing as an integral part of decision-making. The synergy of experts’ knowledge, which can be realized through a collaborative knowledge-sharing process, can be further pursued by devising a workable policy framework [98]. Accordingly, in this study, and based on the experts’ viewpoints, the main impacts of habitat fragmentation in different types of PAs were evaluated, which may help prevent the negative consequences of LULC changes in these areas. A comparison of the studied areas (Table 6) indicated that in Lar National Park, the most significant impacts are related to decreased habitat integrity and increased sink habitat patches. “Source-sink” landscape theory separates all landscape types into source and sink types; it aims to explain ecological processes by looking at landscape patterns and determining suitable landscaping patterns [99]. “Source-sink” landscape theory offers effective practical framework for integrating landscape patterns and ecological processes, and it has been applied successfully to environmental issues [100]. Sources are habitats of high quality that permit population growth. Sinks consist of low-quality habitats that, on their own, cannot sustain a population and have a negative population growth rate [101]. Decreasing habitat integrity leads to dysconnectivity between species and, ultimately, their extinction [102]. Accordingly, conservation biologists believe that connectivity and habitat integrity increase the species’ survival, while the impacts of fragmentation lead to increased habitat isolation [103,104]. The source-sink landscape theory states that incremental habitat loss caused by fragmentation can have a negative impact on population growth, resulting in abrupt thresholds in population viability [99,100]. This study further clarified that, in Jajrud PA, the most increasing fragmentation is in the landscape and animal habitats due to the development of built-up and LULC changes in this area. These findings have also been confirmed in the study of Sadegh-Oghli et al. [62]. Therefore, according to the experts’ viewpoints, the greatest possible impacts of habitat fragmentation relate to changes in the patterns and structure of spatial elements (size, shape, number, type, composition, and status of habitat). Finally, the study of the impacts of fragmentation in the TangehVashi Natural Monument elucidated that the increase in habitat patches in this area (due to the development of many tourism activities) has led to a decrease in the stability of the area and increased edge effect. Hence, the possible impacts of habitat fragmentation relate to decreased stability and the increased edge effect of patches. Therefore, studying habitat fragmentation in this area is necessary to achieve proper planning and management. These findings have also been confirmed in the study of Paziresh et al. [88].
In the present study, the issue of habitat integrity and connectivity in PAs as a fundamental basis for the evaluation and development of conservation strategies has been primarily addressed in terms of protection and development in these areas. Protected area managers do not strictly enforce many of the regulations and laws on PAs. This is particularly true when protecting objectives conflict with socio-economic demands [83]. According to the methodology of this study, the capability of quantifying ecological patterns and impacts of human activities on natural ecosystems, especially PAs, and quantifying the landscape patterns can help managers protect these areas and achieve environmental sustainability. Therefore, controlling LULC changes and developing conservation approaches are essential steps to decreasing habitat fragmentation in PAs. Despite the mentioned strengths, one weakness of this study is the relatively short description of study areas and their main ecological features. In other words, less attention was given to habitat structural differences, pattern changes, and signs related to ecological processes in the study areas. Hence, the results of this study emphasize the use of the landscape ecology approach for evaluating the management of PAs and identifying protection patches to prioritize and protect these areas as much as possible.
A key limitation of the Delphi method is that there are no comprehensive and universal guidelines, a lack of adequate policies, a lack of consensus for a conclusion, and no explicit definition of the expert for the Delphi group [105,106]. Our research had many limitations to using the Delphi method, including different definitions and principles for defining/performing Delphi steps, respondents failing to complete questionnaires with seriousness, and concerns about written comments.

5. Conclusions

Undoubtedly, findings can help planners and policy-makers control LULC changes and habitat fragmentation in PAs. This issue can help evaluate PAs’ management quality and identify protection patches to prioritize and protect these areas as much as possible. We should consider that a global analysis highlights that PAs experience lower habitat loss rates than unprotected areas [107]. In other words, PA establishment is indeed a common conservation strategy to prevent the degradation of natural resources [108].
Our research revealed that the increasing trend of economic and physical activities in the studied areas has led to a decrease in habitat integrity levels. In other words, results mainly showed that even though PAs seem to have been preventing habitat loss and fragmentation at the local scale, we identified regions with severe issues in protecting their habitats. The underlying causes of those issues should be assessed to implement an appropriate solution (especially in TangehVashi natural monument, due to high ecological sensitivity). Unfortunately, due to the lack of adequate supervision, a trend of LULC changes and environmental degradation in PAs have been increased remarkably in recent decades. Developing an integrated management system to achieve organizational coordination is necessary to resolve this problem. The custodian of these areas is the Department of Environment of Tehran Province. Hence, any physical or economic activities should be licensed and monitored only by this department. Some future research directions have been proposed, including evaluating and revising LULC regulations in PAs regarding principles of environmental sustainability, modeling risk of LULC changes from environmental drivers in PAs, assessing the carrying capacity of LULC changes to avoid ecological fragmentations, and meta-analysis of controlling strategies of ecological fragmentations. PAs require proper planning and management, so by analyzing the trends of past changes, and predicting their probability in the future, the findings of this study will aid managers in monitoring and controlling PAs.

Supplementary Materials

The following are available online at https://www.mdpi.com/article/10.3390/land11010006/s1, Table S1: Ground truth and LULC classes, Table S2: Confusion matrix, Table S3: Impacts of habitat fragmentation in the studied areas (results of round 1 of Delphi method), Table S4: Impacts of habitat fragmentation in the studied areas (results of round 2 of Delphi method), Figure S1: Percentage of LULC changes in the studied areas from 1989 to 2019; (a) Lar, (b) Jajrud, (c) TangehVashi.

Author Contributions

Conceptualization, P.S., H.E. and S.B.; methodology, P.S. and H.E.; software, P.S. and H.E.; validation, P.S. and H.E.; formal analysis, P.S. and H.E.; investigation, P.S. and H.E.; data curation, P.S. and H.E.; visualization, P.S., H.E. and S.M.M.S.; original draft preparation, H.E., S.M.M.S. and M.V.M.; writing review and editing, S.M.M.S. and M.V.M.; supervision, H.E., S.M.M.S. and M.V.M.; All authors have read and agreed to the published version of the manuscript.

Funding

The APC was funded by the Department of Forest Engineering, Forest Management Planning and Terrestrial Measurements, Faculty of Silviculture and Forest Engineering, Transilvania University of Brasov.

Institutional Review Board Statement

Not applicable.

Informed Consent Statement

Not applicable.

Data Availability Statement

The data that support the findings of this study are available from the corresponding author (H.E.) upon reasonable request.

Conflicts of Interest

The authors declare no conflict of interest. The views expressed are strictly those of the authors and do not necessarily represent the positions or policy of their respective institutions.

References

  1. United Nations. The Millennium Development Goals Report; United Nations Publications: New York, NY, USA, 2015. [Google Scholar]
  2. Evans, M. What Is Environmental Sustainability? Definition & Examples of Environmental Sustainability. Available online: https://www.thebalancesmb.com/what-is-sustainability-3157876 (accessed on 22 October 2021).
  3. Ervin, J.; Sekhran, N.; Gidda, S.; Vergeichik, M.; Mee, J. PAs for the 21st Century: Lessons from UNDP/GEF’s Portfolio; UNDP: New York, NY, USA, 2010. [Google Scholar]
  4. Sobhani, P.; Goshtasb, H.; Nezami, B.; Jahani, A. Evaluation of promoting conservation hunting areas: In the case Hamedan Alvand No-Hunting Area. J. Env. Sci. Tech. 2018, 20, 145–159. [Google Scholar]
  5. Leitao, A.B.; Ahren, J. Applying landscape ecological concepts and metrics in sustainable landscape planning. Landsc. Urb. Plan. 2002, 59, 65–93. [Google Scholar] [CrossRef]
  6. Haddad, N.M.; Brudvig, L.A.; Clobert, J.; Davies, K.F.; Gonzalez, A.; Holt, R.D.; Collins, C.D. Habitat fragmentation and its lasting impact on Earth’s ecosystems. Sci. Adv. 2015, 1, 1500052. [Google Scholar] [CrossRef] [PubMed] [Green Version]
  7. Venter, O.; Fuller, R.A.; Segan, D.B.; Carwardine, J.; Brooks, T.; Butchart, S.H.; Di-Marco, M.; Iwamura, T.; Joseph, L.; O’Grady, D.; et al. Targeting global protected area expansion for imperiled biodiversity. PLoS Biol. 2014, 12, 1–12. [Google Scholar] [CrossRef] [Green Version]
  8. Andreasen, J.; O’Neill, R.; Noss, R.; Sloser, N. Considerations for the development of a terrestrial index of ecological integrity. Ecolog. Indicat. 2001, 1, 21–35. [Google Scholar] [CrossRef]
  9. Fennell, D.A. A content analysis of ecotourism definitions. Curr. Issues Tourism 2001, 4, 403–421. [Google Scholar] [CrossRef]
  10. Department of the Environment of Iran. Reports of Iran’s Pas; Department of the Environment of Iran: Tehran, Iran, 2016.
  11. Department of Environment of Iran. Reports of Iran’s Pas; Department of Environment of Iran: Tehran, Iran, 2020.
  12. Uuemma, E.; Antrop, M.; Roosaare, J.; Marja, R.; Mander, U. Landscape metrics and indices: An overview of their use in landscape research’. Living Rev. Landsc. Res. 2009, 3, 5–28. [Google Scholar] [CrossRef]
  13. Paola, M.; Cafarelli, B.; Boccaccio, L.; Leronni, V.; Labadessa, R.; Kosmidou, V.; Nagendra, H. Using landscape structure to develop quantitative baselines for protected area monitoring. Ecolog. Indicat. 2013, 33, 82–95. [Google Scholar]
  14. Scariot, E.C.; Almeida, D.; Santos, J.E.D. Connectivity dynamics of araucaria forest and grassland surrounding Pass Fundo National Forest, southern Brazil. Nat. Conservação. 2015, 13, 54–59. [Google Scholar] [CrossRef] [Green Version]
  15. Castillo, E.M.D.; Garcia-Martin, A.; Aladren, L.A.L.; Luis, M.D. Evaluation of forest cover change using remote sensing techniques and landscape metrics in Moncayo Natural Park (Spain). App. Geograp. 2015, 62, 247–255. [Google Scholar] [CrossRef]
  16. Bas-Kent, E.Z.; Kadıogulları, A.I. Spatial and temporal dynamics of land use pattern in Turkey: A case study in Inegol. Landscape Urban. Plan. 2007, 81, 316–327. [Google Scholar] [CrossRef]
  17. Çakır, G.; Sivrikaya, F.; Keles, S. Forest cover change and fragmentation using Landsat data in Maçka State Forest Enterprise in Turkey. Env. Mon. Assess. 2008, 137, 51–66. [Google Scholar] [CrossRef]
  18. Keles, S.; Sivrikaya, F.; Çakır, G.; Kose, S. Urbanization and forest cover change un regional directorate of Trabzon forestry from 1975 to 2000 using landsat data. Env. Mon. Assess. 2008, 140, 1–14. [Google Scholar] [CrossRef]
  19. Poças, I.; Cunha, M.; Pereira, L.S. Remote sensing-based indicators of changes in a mountain rural landscape of Northeast Portugal. App.Geograp. 2011, 31, 871–880. [Google Scholar] [CrossRef]
  20. Terzioglu, S.; Bas-kent, E.Z.; Kadıogulları, A.I. Monitoring forest structure at landscape level: A case study of Scots pine forest in NE Turkey. Env. Mon. Assess. 2009, 152, 71–81. [Google Scholar] [CrossRef]
  21. De Matos, T.P.V.; De Matos, V.P.V.; De Mello, K.; Valente, R.A. Protected areas and forest fragmentation: Sustainability index for prioritizing fragments for landscape restoration. Geol. Ecol. Landsc. 2019, 5, 19–31. [Google Scholar]
  22. Adriana-Chetan, M.; Dornik, A. 20 years of landscape dynamics within the world’s largest multinational network of protected areas. J. Env. Manag. 2020, 280, 111712. [Google Scholar]
  23. Botequilha-Leitao, A.; Miller, J.; Ahern, J.; McGarigal, K. Measuring Landscapes: A Planner’s Handbook; Island Press: Washington, DC, USA, 2006. [Google Scholar]
  24. Turner, M.G.; Gardner, R.H.; O’Neill, R.V. Landscape Ecology in Theory and Practice: Pattern and Process; Springer: New York, NY, USA, 2001. [Google Scholar]
  25. With, K.A. The theory of conservation biology. Conserv. Biol. 1997, 11, 1436–1440. [Google Scholar] [CrossRef]
  26. With, K.A. Landscape Connectivity and Metapopulation Dynamics; Gergel, S.E., Turner., M.G., Eds.; Springer: New York, NY, USA, 2002; pp. 208–227. [Google Scholar]
  27. Franklin, J.F.; Forman, R.T.T. Creating landscape patterns by forest cutting: Ecological consequences and principles. Landscape Ecol. 1987, 1, 5–18. [Google Scholar] [CrossRef]
  28. Zollner, P.A.; Lima, S.L. Landscape-level perceptual abilities in white-footed mice: Perceptual range and the detection of forested habitat. Oikos 1997, 80, 51–60. [Google Scholar] [CrossRef] [Green Version]
  29. Bolliger, J.; Wagner, H.H.; Turner, M.G. Identifying and Quantifying Landscape Patterns in Space and Time. In A Changing World; Landscape Series; Kienast, F., Wildi, O., Ghosh, S., Eds.; Springer: Dordecht, The Netherlands, 2007; Volume 8, pp. 177–194. [Google Scholar]
  30. Sadeghi, S.M.M.; Van Stan II, J.T.; Pypker, T.G.; Friesen, J. Canopy hydrometeorological dynamics across a chronosequence of a globally invasive species, Ailanthus altissima (Mill., tree of heaven). Agric. For. Meteorol. 2017, 240, 10–17. [Google Scholar] [CrossRef]
  31. Heshmatol Vaezin, S.M.; Moftakhar Juybari, M.; Daei, A.; Avatefi Hemmat, M.; Shirvany, A.; Tallis, M.J.; Hirabayashi, S.; Moeinaddini, M.; Hamidian, A.H.; Sadeghi, S.M.M.; et al. The effectiveness of urban trees in reducing airborne particulate matter by dry deposition in Tehran, Iran. Env. Mon. Assess. 2021, 193, 842. [Google Scholar] [CrossRef] [PubMed]
  32. Department of the Environment of Iran. Lar National Park Environmental Management Plan; Office of Habitats and Regional Affairs, First Consulting Engineers: Tehran, Iran, 2003.
  33. Department of the Environment of Iran. Jajrud Collection Management plan (Review) and Lar National Park Environmental Management Plan; Department of the Environment of Iran: Tehran, Iran, 2012. [Google Scholar]
  34. Department of the Environment of Iran. Jajroud Collection Management Plan; Office of Habitat and Regional Affairs, Boomabad Consulting Engineers: Tehran, Iran, 2001.
  35. Department of the Environment of Iran. TangehVashi National Natural Monument Management Plan; Office of Habitat and Regional Affairs, Department of the Environment of Tehran: Tehran, Iran, 2014.
  36. Department of Environment of Iran. Reports of Iran’s Pas; Department of Environment of Iran: Tehran, Iran, 2019.
  37. Taubenböck, H.; Esch, T.; Felbier, A.; Wiesner, M.; Roth, A.; Dech, S. Monitoring urbanization in mega cities from space Remote Sens. Environmental 2012, 117, 162–176. [Google Scholar]
  38. Patino, J.C.; Duque, J.C. A review of regional science applications of satellite remote sensing in urban settings. Comput. Env. Urb. Syst. 2013, 37, 1–17. [Google Scholar] [CrossRef]
  39. Chavez, P.S. Image-based atmospheric Corrections-Revisited and improved. Photogramm. Eng. Remote Sens. 1996, 62, 1025–1036. [Google Scholar]
  40. Anderson, J.R.; Hardy, E.E.; Roach, J.T.; Richard, E.W. A LULC classification system for use with remote sensor data. U.S. Geol. Survey Circ. 1976, 604, 1–27. [Google Scholar]
  41. Singh, S.K. Moderate deviation for maximum likelihood estimators from single server queues. Probab. Uncert. Quant. Risk 2020, 5, 1–13. [Google Scholar] [CrossRef] [Green Version]
  42. Ahmad, A.; Quegan, S. Analysis of maximum likelihood classification on multispectral data. Mathemat. Sci. 2012, 129, 6425–6436. [Google Scholar]
  43. Olofsson, P.; Foody, G.M.; Stehman, S.V.; Woodcock, C.E. Making better use of accuracy data in land change studies: Estimating accuracy and area and quantifying uncertainty using stratified estimation. Rem. Sens. Envi. 2013, 129, 122–131. [Google Scholar] [CrossRef]
  44. Lee, S.; Choi, J.; Min, K. Landslide susceptibility analysis and verification using the Bayesian probability model. Env. Geol. 2002, 43, 120–131. [Google Scholar] [CrossRef]
  45. Liu, J.; Dietz, T.; Stephen, R.; Carpenter, S.R.; Taylor, W.W. Complexity of coupled human and natural systems. Science 2007, 317, 1513–1516. [Google Scholar] [CrossRef] [Green Version]
  46. Congalton, R.G.; Green, K. Assessing the Accuracy of Remotely Sensed Data. Principles and Practices, 2nd ed.; CRC Press: Boca Raton, FL, USA, 2009; p. 384. [Google Scholar]
  47. Munthali, M.G.; Mustak, S.; Adeola, A.; Botai, J.; Singh, S.K.; Davis, N. Modelling land use and land cover dynamics of Dedza district of Malawi using hybrid Cellular Automata and Markov model. Remote Sens. App. Soc. Env. 2020, 17, 100276. [Google Scholar] [CrossRef]
  48. Sandhage-Hofmann, A. Rangeland Management. Reference Module in Earth Systems and Environmental Sciences; Elsevier: Amsterdam, The Netherlands, 2017. [Google Scholar] [CrossRef]
  49. Küchler, A.W.; Zonneveld, I.S. Vegetation Mapping; Kluwer Academic Publishers: Dordrecht, The Netherlands, 1988; p. 365. [Google Scholar]
  50. Zaitunah, A.; Samsuri, A.; Ahmad, A.G.; Safitri, R.A. Normalized difference vegetation index (NDVI) analysis for land cover types using Landsat 8 OLI in Besitang watershed, Indonesia. Earth Env. Sci. 2018, 126, 012112. [Google Scholar] [CrossRef]
  51. Jin, S.; Yang, L.; Zhu, Z.; Homer, C. A land cover change detection and classification protocol for updating Alaska NLCD 2001 to 2011. Remote Sens. Env. 2017, 195, 44–55. [Google Scholar] [CrossRef]
  52. Li, Z.; Shi, W.; Lu, P.; Yan, L.; Wang, Q.; Miao, Z. Landslide mapping from aerial photographs using change detection-based Markov random field. Remote Sens. Environment 2016, 187, 76–90. [Google Scholar]
  53. Noori, R.; Abdoli, M.A.; Ameri-Ghasrodashti, A.; Jalili-Ghazizadea, M. Prediction of municipal solid waste generation with combination of support vector machine and principal component analysis: A case study of Mashhad. Env. Progress Sustai. Energy. 2008, 28, 249–258. [Google Scholar] [CrossRef]
  54. Lua, P.; Qin, Y.; Li, Z.; Mondini, A.C.; Casagli, N. Landslide mapping from multi-sensor data through improved change detection-based Markov random field. Remote Sens. Env. 2019, 231, 111235. [Google Scholar] [CrossRef]
  55. Deljouei, A.; Abdi, E.; Marcantonio, M.; Majnounian, B.; Amici, V.; Sohrabi, H. The impact of forest roads on understory plant diversity in temperate hornbeam-beech forests of Northern Iran. Env. Monitor. Asses. 2017, 189, 1–15. [Google Scholar] [CrossRef] [PubMed]
  56. Deljouei, A.; Sadeghi, S.M.M.; Abdi, E.; Bernhardt-Römermann, M.; Pascoe, E.L.; Marcantonio, M. The impact of road disturbance on vegetation and soil properties in a beech stand, Hyrcanian forest. Eur. J. For. Res. 2018, 137, 759–770. [Google Scholar] [CrossRef]
  57. Lele, S.; Wilshusen, P.; Brockington, D.; Seidler, R.; Bawa, K. Beyond exclusion: Alternative approaches to biodiversity conservation in the developing tropics. Curr. Opin. Env. Sust. 2010, 2, 94–100. [Google Scholar] [CrossRef]
  58. Forman, R.T.T.; Lauren, E.A. Roads and their Major Ecological Effects. Annu. Rev. Ecol. Syst. 1998, 29, 207–231. [Google Scholar] [CrossRef] [Green Version]
  59. Haghverdi, F.; Jahani, A.; Zebardast, L.; Makhdom, M.; Goshtasb, H. Quantification of wildlife habitat disintegration using landscape ecology approach (case study: Lar National Park and Virgin PA). J. Animal Env. 2018, 10, 23–34. [Google Scholar]
  60. Torres-Morandi, D.; de Jesus-França, L.C.; Menezes, E.S.; Mendonça-Machado, E.L.; da Silva, M.D.; Mucida, D.P. Delimitation of ecological corridors between conservation units in the Brazilian Cerrado using a GIS and AHP approach. Ecol. Indic. 2020, 115, 106440. [Google Scholar]
  61. Chen, A.; Lei, Y.; Sun, R.; Chen, L.D. How many metrics are required to identify the effects of the landscape pattern on land surface temperature? Ecol. Indic. 2014, 45, 424–433. [Google Scholar] [CrossRef]
  62. Sadegh-Oghli, R.; Jahani., A.; Alizadeh Shabani., A.; Goshtasb., H. Quantifying the landscape fragmentation as an indicator for assessing wildlife habitat (Case Study: Jajroud PA). Land Use Plan. 2019, 11, 57–78. [Google Scholar]
  63. Jaeger, J.A.G.; Bertiller, R.; Schwick, C.; Muller, K.; Steinmeier, C.; Ewald, K.C.; Ghazoul, J. Implementing landscape fragmentation as an indicator in the swiss monitoring system of sustainable development. Env. Manag. 2008, 88, 737–751. [Google Scholar] [CrossRef]
  64. McGarigal, K.; Marks, B.J. FRAGSTATS: Spatial Pattern Analysis Program for Quantifying Landscape Structure. Forest Science Department. General Technical Report; USDA: Portland, OR, USA, 1995; p. 122. [Google Scholar]
  65. Kennedy, H. Enhancing Delphi research: Methods and results. J. Adv. Nursing. 2004, 45, 504–511. [Google Scholar] [CrossRef]
  66. Dunham, R.B. The Delphi Technique. Available online: http://www.slais.ubc.ca/resources/researchmethods/group.htm (accessed on 17 September 2021).
  67. Stern, T.; Ledl, C.; Schwarzbauer, P.; Heil, G. Identifying innovation barriers using a Delphi method approach: The case of technical lignin in the wood-based panel industry. Int. Wood Prod. J. 2012, 3, 116–123. [Google Scholar] [CrossRef]
  68. Sutterlüty, A.; Hesser, F.; Schwarzbauer, P.; Schuster, K.C.; Windsperger, A.; Stern, T. A Delphi approach to understanding varying expert viewpoints in sustainability communication: The case of water footprints of bio-based fiber resources. J. Ind. Ecol. 2016, 21, 412–422. [Google Scholar] [CrossRef]
  69. Huber, D.J.; Huber, J.; Hersser, F.; Hollbacher, E.; Stern, T. Two experts, three opinions: Volatile organic compounds’ testing methods and regulative systems. Eur. J. Wood Prod. 2018, 76, 5–12. [Google Scholar] [CrossRef] [Green Version]
  70. Dooms, M.; van der Lugt, V.; De Schepper, O. Socioeconomic Performance Assessment of Port Clusters: More Challenges, Fewer Solutions? Green Ports, Inland and Seaside Sustainable Transportation Strategies; Elsevier: Amsterdam, The Netherlands, 2019; pp. 231–253. [Google Scholar]
  71. Skokanova, H.; Eremlasova, R. Landscape functionality in protected and un PAs: Case studies from the Czech Republic. Ecol. Informatics 2013, 14, 71–74. [Google Scholar] [CrossRef]
  72. Majnonian, H. National Parks Planning (Park Management, Planning of National Parks and PAs); A Manual with Annotated Examples; Publications of Day Negar: Tehran, Iran, 2015; p. 308. [Google Scholar]
  73. Zhao, H.; Zhao, X.; Zhou, R.; Zhang, T.; Drake, S. Desertification processes due to heavy grazing in sandy rangeland, Inner Mongolia. J. Arid Environ. 2005, 62, 309–319. [Google Scholar] [CrossRef]
  74. Zhang, Q. The dilemma of conserving rangeland by means of development: Exploring ecological resettlement in a pastoral township of Inner Mongolia. Nomadic Peoples 2012, 16, 88–115. [Google Scholar] [CrossRef]
  75. Assaeed, A.M.; Al-Rowaily, S.L.; El-Bana, M.I.; Abood, A.A.; Dar, B.A.; Hegazy, A.K. Impact of off-road vehicles on soil and vegetation in a desert rangeland in Saudi Arabia. Saudi J. Biolog. Sci. 2019, 26, 1187–1193. [Google Scholar] [CrossRef] [PubMed]
  76. Jahani, A.; Saffariha, M. Human activities impact prediction in vegetation diversity of Lar National Park in Iran using artificial neural network model. Integ. Env. Assess. Manag. 2020, 17, 42–52. [Google Scholar] [CrossRef]
  77. Murray, D.B.; Muir, J.P.; Miller, M.S.; Erxleben, D.R.; Mote, K.D. Effective management practices for increasing native plant diversity on Mesquite Savanna-Texas Wintergrass-dominated rangelands. Rangel. Ecol. Manag. 2012, 75, 161–169. [Google Scholar] [CrossRef]
  78. Nacoulma, B.M.I.; Schumann, K.; Traore, S.; Bernhardt-Römermann, M.; Hahn, K.; Wittig, R.; Thiombiano, A. Impacts of land-use on West African savanna vegetation: A comparison between protected and communal area in Burkina Faso. Biodiv. Conserv. 2011, 20, 3341–3362. [Google Scholar] [CrossRef]
  79. Zhang, J.T.; Xiang, C.L.; Li, M. Effects of tourism and topography on vegetation diversity in the subalpine meadows of the Dongling Mountains of Beijing, China. Env. Manag. 2012, 49, 403–411. [Google Scholar] [CrossRef]
  80. Wei, L.; Hulin, F.; Chevalier, R.; Archaux, F.; Gosseli, F. Is plant diversity on tractor trails more influenced by disturbance than by soil characteristics? For. Ecol. Manag. 2016, 379, 173–184. [Google Scholar] [CrossRef]
  81. Deljouei, A.; Abdi, E.; Majnounian, B. Changes of trees regeneration diversity in main and secondary roads of Hyrcanian forests, Iran. J. Ins. Nat. App. Sci. 2014, 19, 30–35. [Google Scholar]
  82. De la Rosa-Velázquez, M.I.; Espinoza-Tenorio, A.; Díaz-Perera, M.Á.; Ortega-Argueta, A.; Ramos-Reyes, R.; Espejel, I. Development stressors are stronger than protected area management: A case of the Pantanos de Centla Biosphere Reserve, Mexico. Land Use Policy 2017, 67, 340–351. [Google Scholar] [CrossRef]
  83. Jiang, L.; Yu, L. Analyzing land use intensity changes within and outside protected areas using ESA CCI-LC datasets. Glob. Ecol. Conserv. 2019, 20, e00789. [Google Scholar] [CrossRef]
  84. Ghazvini, S.A.M.; Timothy, D.J.; Sarmento, J. Environmental concerns and attitudes of tourists towards national park uses and services. J. Outdoor Recreat. Tourism 2020, 31, 100296. [Google Scholar] [CrossRef]
  85. Xu, J.; Melick, D.R. Rethinking the effectiveness of public protected areas in southwestern China. Conserv. Biol. 2007, 21, 318–328. [Google Scholar] [CrossRef] [PubMed]
  86. Tehran Urban Research and Planning Center. East Tehran tourism pole studies report. In The Case SorkhehHesar Forest Park; Department of Environment: Tehran, Iran, 2014. [Google Scholar]
  87. Danehkar, A.; Jafari, S. Degradation assessment of Jajrud PA using landscape degradation model. Remote Sensing GIS Natur. Resour. 2017, 8, 17–32. [Google Scholar]
  88. Paziresh, R.; Sarvar, P.; Heidari-Baba-Kamal, Y.; Parhizi-Rad, A. Environmental impact assessment of rural tourism in TangehVashi using the DPSIR model. In Proceedings of the First National Conference on Tourism, Tehran, Iran, 2013; pp. 1–12. [Google Scholar]
  89. Esmaeilzadeh, H.; Ehteshami, M. Land use changes and restraining environmental risks via mitigation approach, the case of Darakeh -Velenjak watershed in Iran. Sustain. Earth Review. 2020, 1, 23–37. [Google Scholar] [CrossRef]
  90. Montoya, A.V.G.; Vizuete, D.D.C.; Toaza, J.M.M.; Marcu, M.V.; Borz, S.A. Importance and use of ecosystem services provided by the Amazonian landscapes in Ecuador-evaluation and spatial scaling of a representative area. Bull. Transilv. Uni. Bras. For. Wood Indus. Agric. Food Eng. Ser. II. 2019, 12, 1–26. [Google Scholar]
  91. Buckley, R.C. Environmental Impacts of Ecotourism; CABI Publishing: New York, NY, USA, 2004. [Google Scholar]
  92. Leung, Y.; Marion, J.L. Recreation Impacts and Management in Wilderness: A State of-Knowledge Review; Proceedings US Department of Agriculture, Forestry Service, Rocky Mountain Research Station: Missoula, MT, USA, 2000.
  93. Bruner, A.G.; Gullison, R.E.; Rice, R.E.; Da Fonseca, G.A. Effectiveness of parks in protecting tropical biodiversity. Science 2001, 291, 125–128. [Google Scholar] [CrossRef] [PubMed] [Green Version]
  94. Dai, L.; Wang, Y.; Lewis, B.J.; Xu, D.; Zhou, L.; Gu, X.; Jiang, L. The trend of land-use sustainability around the Changbai Mountain Biosphere Reserve in northeastern China: 1977–2007. Int. J. Sustain. Develop. World Ecol. 2012, 19, 369–377. [Google Scholar] [CrossRef]
  95. Ewers, R.M.; Didham, R.K. Confounding factors in the detection of species responses of habitat fragmentation. Biol. Rev. Camb. Philos. Soc. 2006, 81, 117–142. [Google Scholar] [CrossRef] [PubMed]
  96. Magrach, A.; Larrinaga, A.R.; Santamara, L. Changes in patch features may exacerbate or compensate for the effect of habitat loss on forest bird populations. PLoS ONE 2011, 6, 1–11. [Google Scholar] [CrossRef] [PubMed] [Green Version]
  97. Jaafari, S.; Alizadeh-Shabani, A.; Danehkar, A.; Nazarisamani, A.; Plexida, S. Application of landscape metrics for assessment of land use/ land cover (LULC) changes in Varjin protected area, Iran. Env. Eng. Manag. 2017, 12, 2813–2821. [Google Scholar] [CrossRef]
  98. Khedrigharibvand, H.; Azadi, H.; Teklemariam, D.; Ebrahimi, A.; Omidzadeh-Ardali, E.; Van Acker, V.; Van Eetvelde, V.; De Maeyer, P.; Witlox, F. Sustainable rangeland management in southwest Iran: Understanding changes in experts’ attitudes toward livelihood alternatives. Rangel. Ecol. Manag. 2019, 72, 433–445. [Google Scholar] [CrossRef]
  99. Chen, L.; Fu, B.; Zhao, W. Source-sink landscape theory and its ecological significance. Front. Biol. China 2008, 3, 131–136. [Google Scholar] [CrossRef]
  100. Wu, J.; Zhu, Q.; Qiao, N.; Wang, Z.; Sha, W.; Luo, K.; Feng, Z. Ecological risk assessment of coal mine area based on “source-sink” landscape theory–A case study of Pingshuo mining area. J. Cleaner Product. 2021, 295, 126371. [Google Scholar] [CrossRef]
  101. Draheim, H.M.; Moore, J.A.; Etter, D.; Winterstein, S.R.; Scribner, K.T. Detecting black bear source–sink dynamics using individual-based genetic graphs. Proceed. Royal Soc. B. Biol. Sci. 2016, 283, 20161002. [Google Scholar] [CrossRef] [PubMed] [Green Version]
  102. Bennett, A.F. Linkages in the Landscape. The Role of Corridors and Connectivity in Wildlife Conservation, 2nd ed.; IUCN, The World Conservation Union: Gland, Switzerland; Cambridge, UK, 2003; p. 262. [Google Scholar]
  103. Crooks, K.R. Relative sensitivities of mammalian carnivores to habitat fragmentation. J. Conserv. Biodiv. 2002, 16, 488–502. [Google Scholar] [CrossRef]
  104. Sobhani, P.; Esmaeilzadeh, H.; Mostafavi, H. Simulation and impact assessment of future land use and land cover changes in two protected areas in Tehran, Iran. Sust. Cities Soc. 2021, 75, 1–11. [Google Scholar] [CrossRef]
  105. Ritchie, B.W.; Burns, P.M.; Palmer, C.A. Tourism Research Methods: Integrating Theory with Practice; CABI: Cambridge, MA, USA, 2005. [Google Scholar]
  106. Roudgarmi, P.; Mahdiraji, M.T.A. Current challenges of laws for preservation of forest and rangeland, Iran. Land Use Policy 2020, 99, 105002. [Google Scholar] [CrossRef]
  107. Geldmann, J.; Barnes, M.; Coad, L.; Craigie, I.D.; Hockings, M.; Burgess, N.D. Effectiveness of terrestrial protected areas in reducing habitat loss and population declines. Biolog. Conserv. 2013, 161, 230–238. [Google Scholar] [CrossRef]
  108. Leberger, R.; Rosa, I.M.; Guerra, C.A.; Wolf, F.; Pereira, H.M. Global patterns of forest loss across IUCN categories of protected areas. Biolog. Conserv. 2020, 241, 108299. [Google Scholar] [CrossRef]
Figure 1. Location of the studied areas; (a) Lar, (b) Jajrud, and (c) TangehVashi.
Land 11 00006 g001
Figure 2. The flow diagram of the methodology.
Land 11 00006 g002
Figure 3. Main steps of the Delphi method, statistical calculation and detection of habitat fragmentation.
Land 11 00006 g003
Figure 4. Temporal LULC maps in Lar; (a) 1989, (b) 1999, (c) 2009, (d) 2019.
Land 11 00006 g004
Figure 5. Temporal LULC maps in the Jajrud PA; (a) 1989, (b) 1999, (c) 2009, (d) 2019.
Land 11 00006 g005
Figure 6. Temporal LULC maps in the TangehVashi; (a) 1989, (b) 1999, (c) 2009, (d) 2019.
Land 11 00006 g006
Figure 7. Percentage of LULC temporal changes in the studied areas from 1989 to 2019.
Land 11 00006 g007
Table 1. List of landscape metrics used in the studied areas [15,59,60,62,63,64].
MetricsRange of ChangeCalculationUnit
Class Area (CA)CA > 0 CA   = j = 1 n a i j 1 10000 ha
Class Area Percentage (CAP)0 < CAP ≤ 100 CAP   =   Pi   = j = 1 n a i j 1 A   100 %
Number of Patches (NP)NP ≥ 1 NP   = n i -
Total Edge (TE)TE ≥ 0 TE   = k = 1 m e l k m
Mean Shape Index (MSP)MSI ≥ 1 MSI = i = 1 n p i Π * a i 2 * a i A -
Mean Nearest Neighbor Distance (MNN)MNN > 0 MNN = i = 1 m j = 1 n h ij N m
Mean Patch Size (MPS)MPS > 0 MPS = i = 1 n a i n = A n ha
The variables in the formulas in Table 1 depict the following: A = total area of patches; aij = selected patch area; eik = length of the edge between the patches i and k; hij = distance from the nearest patch in the landscape; N = number of patches; ni = number of patches; pij = selected patch circumference.
Table 2. Number of experts who participated in the Delphi study.
CategoryScience FieldRound 1Round 2Round 3
AcademicsEnvironmental engineering876
Biodiversity1088
Zoology765
Biology444
Landscape designing and planning666
Geography555
Total (number)403634
Table 3. Overall accuracy and kappa coefficient during the studied years.
Study SiteYearPrepared Land Use Map
Overall Accuracy (Unitless)Kappa Coefficient (Unitless)
Lar National Park19890.90.86
19990.850.77
20090.940.92
20190.920.89
Jajrud PA19890.870.76
19990.920.88
20090.850.81
20190.970.95
TangehVashi Natural Monument19890.90.86
19990.870.83
20090.910.85
20190.980.89
Table 4. Changes in LULC classes between 1989 and 2019 in three sites.
Lar National Park
Year1989199920092019Differences (1989–2019) **
Land useArea contribution (%)Area contribution (%)
Built-up *0.0090.0040.0110.019+0.01
Water body2.232.262.623.28+1.05
Cropland and garden6.135.262.292.26−3.86
High-density pasture26.8026.4726.4325.40−1.40
Low-density pasture64.8365.9768.6469.03+4.20
Total100100100100-
Jajrud PA
Year1989199920092019Differences (1989–2019) **
Land useArea contribution (%)Area contribution (%)
Built-up *10.4310.5711.0811.96+1.52
Water body0.890.900.920.95+0.06
Cropland and garden2.282.302.312.32+0.04
High-density pasture38.6438.6138.5237.71−0.93
Low-density pasture45.4345.3244.9344.85−0.59
Planted forests2.322.302.242.21−0.10
Total100100100100-
TangehVashi Natural Monument
Year1989199920092019Differences (1989–2019) **
Land useArea contribution (%)Area contribution (%)
Built-up *0.220.250.250.25+0.03
High-density pasture1.941.831.731.18−0.75
Low-density pasture16.9917.0417.1217.15+0.13
Bare land80.8580.8880.9081.42+0.59
Total100100100100-
* Built up = residential, commercial, industrial, and roads spaces. ** Differences (%) = area contribution of land use (%) in 2019—area of contribution of land use (%) in 1989.
Table 5. Changes in high-density pasture habitat metrics between 1989 and 2019 at the three sites.
Site YearVariationPercent of Metric Variation from 1989 to 2019 *
Metrics19891999200920191989–2019
Lar National ParkCA (ha)7515742074117122−393−5.2
CAP (%)78.6165.2153.1241.63−36.98−47.0
NP (unitless)1874325656717895+6021+321.3
MPS (m)65.3152.3345.6934.25−31.06−48.6
MNN (unitless)79.6364.3158.1245.21−34.42−43.2
TE (m)482,145532,145662,583784,156+302,011+62.6
MSI (ha)7.437.158.448.56+1.13+15.2
Jajrud PACA (ha)29,24129,21229,15028,540−701−2.4
CAP (%)67.2156.3444.6538.95−28.26−42.0
NP (unitless)2785321562347821+5036+180.8
MPS (m)55.2143.1538.4528.71−26.5−48.0
MNN (unitless)78.5174.3261.2550.32−28.19−35.9
TE (m)532,14562,87573,654812,565+280,420+52.7
MSI (ha)7.658.158.419.36+1.71+22.4
TangehVashi Natural MonumentCA (ha)71676343−28−39.4
CAP (%)89.2378.3672.4168.2−21.03−23.6
NP (unitless)1856234143256728+4872+262.5
MPS (m)45.8138.2633.5127.64−18.17−39.7
MNN (unitless)69.2164.7860.2155.43−13.78−19.9
TE (m)385,412415,263622,115641,421+256,009+66.4
MSI (ha)6.787.228.518.62+1.84+27.1
* Percent of metric variation from 1989 to 2019 = (metric value in 2019/metric value in 1989) * 100.
Table 6. Impacts of habitat fragmentation in the studied areas (results of round 3 of Delphi method).
SiteImpactsnMeanSDVRankTotal Mean
Lar National Park(1) Decrease of habitat integrity (source and sink)344.501.0002.00013.23
(2) Change of the patterns and spatial elements’ structure (size, shape, number, type, composition, and status of habitat)344.331.0001.0602
(3) Change in the ecosystem function (flow of matter, energy and information, etc.)343.851.0291.0003
(4) Decrease of stability and increase of the edge effect of patches343.701.0002.0305
(5) Change of ecological flows343.751.0001.0004
(6) Decreased of resilience and biological capacity of species343.151.0291.00010
(7) Habitat destruction and decrease of biodiversity and genetic343.251.0001.0006
(8) Extinction of biologically valuable species (fauna and flora)343.181.0002.0008
(9) Change of the species’ diet and their migration path342.971.0002.05513
(10) Change of ecological process in the area343.221.0001.0007
(11) Reduction and loss of vegetation in the area343.171.0001.0009
(12) Increase of climate change343.101.0001.00011
(13) Increase of environmental pollution343.001.0001.00012
(14) Decrease of the reservoirs of groundwater aquifers and change in surface water regime342.941.0001.00014
(15) Change of biogeochemical cycles342.871.0001.00016
(16) Decrease of ecosystem services342.901.0002.03015
(17) Increase of water evaporation level342.771.0301.00017
(18) Increase of soil erosion level (sedimentation and decrease of soil fertility level)342.631.0001.00020
(19) Disturbance of landscape and environmental desirability342.731.0001.00018
(20) Increase of abrupt environmental crises (such as storm, flood, earthquake, etc.)342.661.0001.00019
Jajroud PA(1) Decrease of habitat integrity (source and sink)344.331.0001.00023.80
(2) Change of the patterns and spatial elements’ structure (size, shape, number, type, composition, and status of habitat)344.641.0002.0001
(3) Change in the ecosystem function (flow of matter, energy and information, etc.)344.221.0001.0604
(4) Decrease of stability and increase of the edge effect of patches344.181.0001.0005
(5) Change of ecological flows344.281.0001.0433
(6) Decreased of resilience and biological capacity of species343.981.0001.0007
(7) Habitat destruction and decrease of biodiversity and genetic344.081.0291.0006
(8) Extinction of biologically valuable species (fauna and flora)343.851.0001.0009
(9) Change of the species’ diet and their migration path343.921.0001.0008
(10) Change of ecological process in the area343.831.0001.00010
(11) Reduction and loss of vegetation in the area343.781.0002.03011
(12) Increase of climate change343.641.0001.00013
(13) Increase of environmental pollution343.721.0001.00012
(14) Decrease of the reservoirs of groundwater aquifers and change in surface water regime343.521.0001.00015
(15) Change of biogeochemical cycles343.471.0001.00016
(16) Decrease of ecosystem services343.581.0001.00014
(17) Increase of water evaporation level343.151.0001.00020
(18) Increase of soil erosion level (sedimentation and decrease of soil fertility level)343.441.0001.00017
(19) Disturbance of landscape and environmental desirability343.241.0001.00019
(20) Increase of abrupt environmental crises (such as storm, flood, earthquake, etc.)343.311.0002.00018
TangehVashi Natural Monument(1) Decrease of habitat integrity (source and sink)343.441.0291.06463.09
(2) Change of the patterns and spatial elements’ structure (size, shape, number, type, composition, and status of habitat)343.581.0001.0003
(3) Change in the ecosystem function (flow of matter, energy and information, etc.)343.521.0001.0004
(4) Decrease of stability and increase of the edge effect of patches343.771.0001.0001
(5) Change of ecological flows343.641.0001.0002
(6) Decreased of resilience and biological capacity of species343.481.0002.0335
(7) Habitat destruction and decrease of biodiversity and genetic343.361.0001.0007
(8) Extinction of biologically valuable species (fauna and flora)343.271.0001.0548
(9) Change of the species’ diet and their migration path343.051.0001.00011
(10) Change of ecological process in the area343.121.0001.00010
(11) Reduction and loss of vegetation in the area343.181.0001.0009
(12) Increase of climate change342.791.0001.00015
(13) Increase of environmental pollution342.861.0001.05514
(14) Decrease of the reservoirs of groundwater aquifers and change in surface water regime342.981.0001.03312
(15) Change of biogeochemical cycles342.721.0291.00016
(16) Decrease of ecosystem services342.541.0001.00019
(17) Increase of water evaporation level342.601.0002.00018
(18) Increase of soil erosion level (sedimentation and decrease of soil fertility level)342.661.0001.00017
(19) Disturbance of landscape and environmental desirability342.431.0001.00020
(20) Increase of abrupt environmental crises (such as storm, flood, earthquake, etc.)342.921.0001.00013
Publisher’s Note: MDPI stays neutral with regard to jurisdictional claims in published maps and institutional affiliations.

