Abstract
Urban forests provide many ecosystem services, such as reducing heat, improving air quality, treatment of stormwater, carbon sequestration, as well as biodiversity benefits. These benefits have resulted in increasing demand for urban forests and strategies to maintain and enhance this natural infrastructure. In response to a broader resilience strategy for Melbourne, Australia, we outline how a metropolitan-wide urban forest strategy (Living Melbourne) was developed, encompassing multiple jurisdictions and all land tenures. To this end, we mapped tree cover within the Melbourne metropolitan area, modelled potential habitat for some bird species, and investigated the role of tree cover for urban heat island mitigation. We outline the consultation and governance frameworks used to develop the strategy, the vision, goals and actions recommended, including canopy and shrub cover targets for different parts of the metropolitan area. The metropolitan-wide urban forest strategy acts as an overarching framework to guide local government authorities and various stakeholders towards a shared objective of increasing tree cover in Melbourne and we discuss the outcomes and lessons from this approach.
1. Introduction
Nature is increasingly recognised as one of our most valuable assets to build resilience to 21st century urban challenges: the urban forest and the biodiversity that it supports can take pressure off our increasingly strained built infrastructure while supporting the liveability of our cities [1]. There is a growing understanding and demand for urban forests due to the multiple benefits that they provide. Urban forests provide many ecosystem services, such as reducing surface temperatures through shading, maintaining water quality through treatment of stormwater, providing carbon sequestration, and improving air quality through particulate matter removal [2]. In addition, the urban forest provides habitat for wildlife [3]. A recent and rapidly accumulating body of evidence demonstrates that experiencing nature in cities is critical to the health and well-being of the community [4,5]. In a context of rapid urbanisation, biodiversity conservation in towns and cities plays a significant role in minimising both the local extinction of species and maintaining the human experience of native plants and wildlife [1]. Although parks and reserves currently remain the focus for conserving urban nature, private gardens offer an extensive and undervalued resource for enhancing urban biodiversity [6].
Urban populations are growing [7], and many cities are densifying [8]. Densification can place pressure on canopy cover and other elements of vegetation in urban environments [9,10]. Acknowledging the many benefits of urban vegetation, and particularly trees, many city municipal governments have responded through developing urban forest strategies and targets [11]. It is atypical for urban forest strategies to be undertaken by coalitions of local government authorities (LGA). They are more typically undertaken by an individual LGA, as this is the extent of their jurisdiction (e.g., [12,13]).
Australia is no exception to the trends of both urban population growth and densification and responding through developing urban forest strategies. Australia is one of the most highly urbanised nations in the world, with almost 90% of the population living in urban areas in 2016 [14]. Municipal governments have been increasingly developing urban forest strategies [15], but as governance is typically fragmented in larger cities (through many local government entities), there is rarely coordination to develop whole-of-metropolitan urban forest strategies.
From 2012 to 2017, Melbourne, Australia’s second largest city located in temperate south-eastern Australia, accommodated 87 percent of the total population growth of the State of Victoria [16]. A combination of natural increase and net immigration will make Melbourne Australia’s largest city, with a projected population of 8 million people by 2051 [16]. To house this growing population, more than 1.6 million new dwellings will be needed, resulting in further density in existing areas and the addition of new suburbs on the urban fringe [17].
As with other Australian cities, Melbourne has a fragmented governance framework with no single metropolitan authority to coordinate action such as developing integrated urban forests. A key challenge, therefore, is achieving coordinated approaches across various jurisdictions and government entities. However, whilst challenging, it has successfully been achieved in some regions such as Chicago, USA where, for over 20 years, in excess of 250 partners, work together to improve conservation outcomes [18]. Here, we describe and discuss the process behind developing a metropolitan-wide urban forest strategy for Melbourne, the rationale behind various elements and outline lessons learnt, from the perspective of the authors of that strategy.
2. Background
2.1. Current Context for Melbourne
Melbourne sits at the junction of several bioregions, which are broad geographical regions composed of clusters of interacting ecosystems that share common physical and biological features such as climate, geology, landforms, soils and vegetation [19]. The different regions vary widely in canopy cover. This is a result of their natural attributes—which influence vegetation patterns—combined with the historical development and growth of Melbourne. The vegetation types that existed in Melbourne before European settlement included grasslands and grassy woodlands in the west, heaths and heathy woodlands in the south-east, and dry and damp forests in the east. In addition to these natural differences, Melbourne’s development and growth since the 1830s has had an important influence on the shape and form of today’s urban forest. Settlers’ preferences for elevation, views, water and mature trees meant that Melbourne’s early development moved outwards from the original European settlement on the banks of the Yarra River to the north-east, east and south-east, and tended to be on the hillier, treed terrain. The flatter northern and western areas—largely grassland plains—were considered less hospitable and desirable.
Melbourne is consistently ranked as one of the world’s most liveable cities [20] and Victoria, the state for which it is the capital, has been known as ‘Garden State’. Visitors to Melbourne (who contribute approximately AUD 8 billion to the city’s annual economy) ranked parks and gardens as Melbourne’s number-one unique attribute, and as the city’s top ‘must do’ attraction [21]. Melbourne has one of the highest percentages of open green space of any city in the world [19]. The distribution and extent of native vegetation varies, with inner-city areas retaining less original native vegetation and having a larger proportion of introduced flora species than Melbourne’s outer suburbs [22].
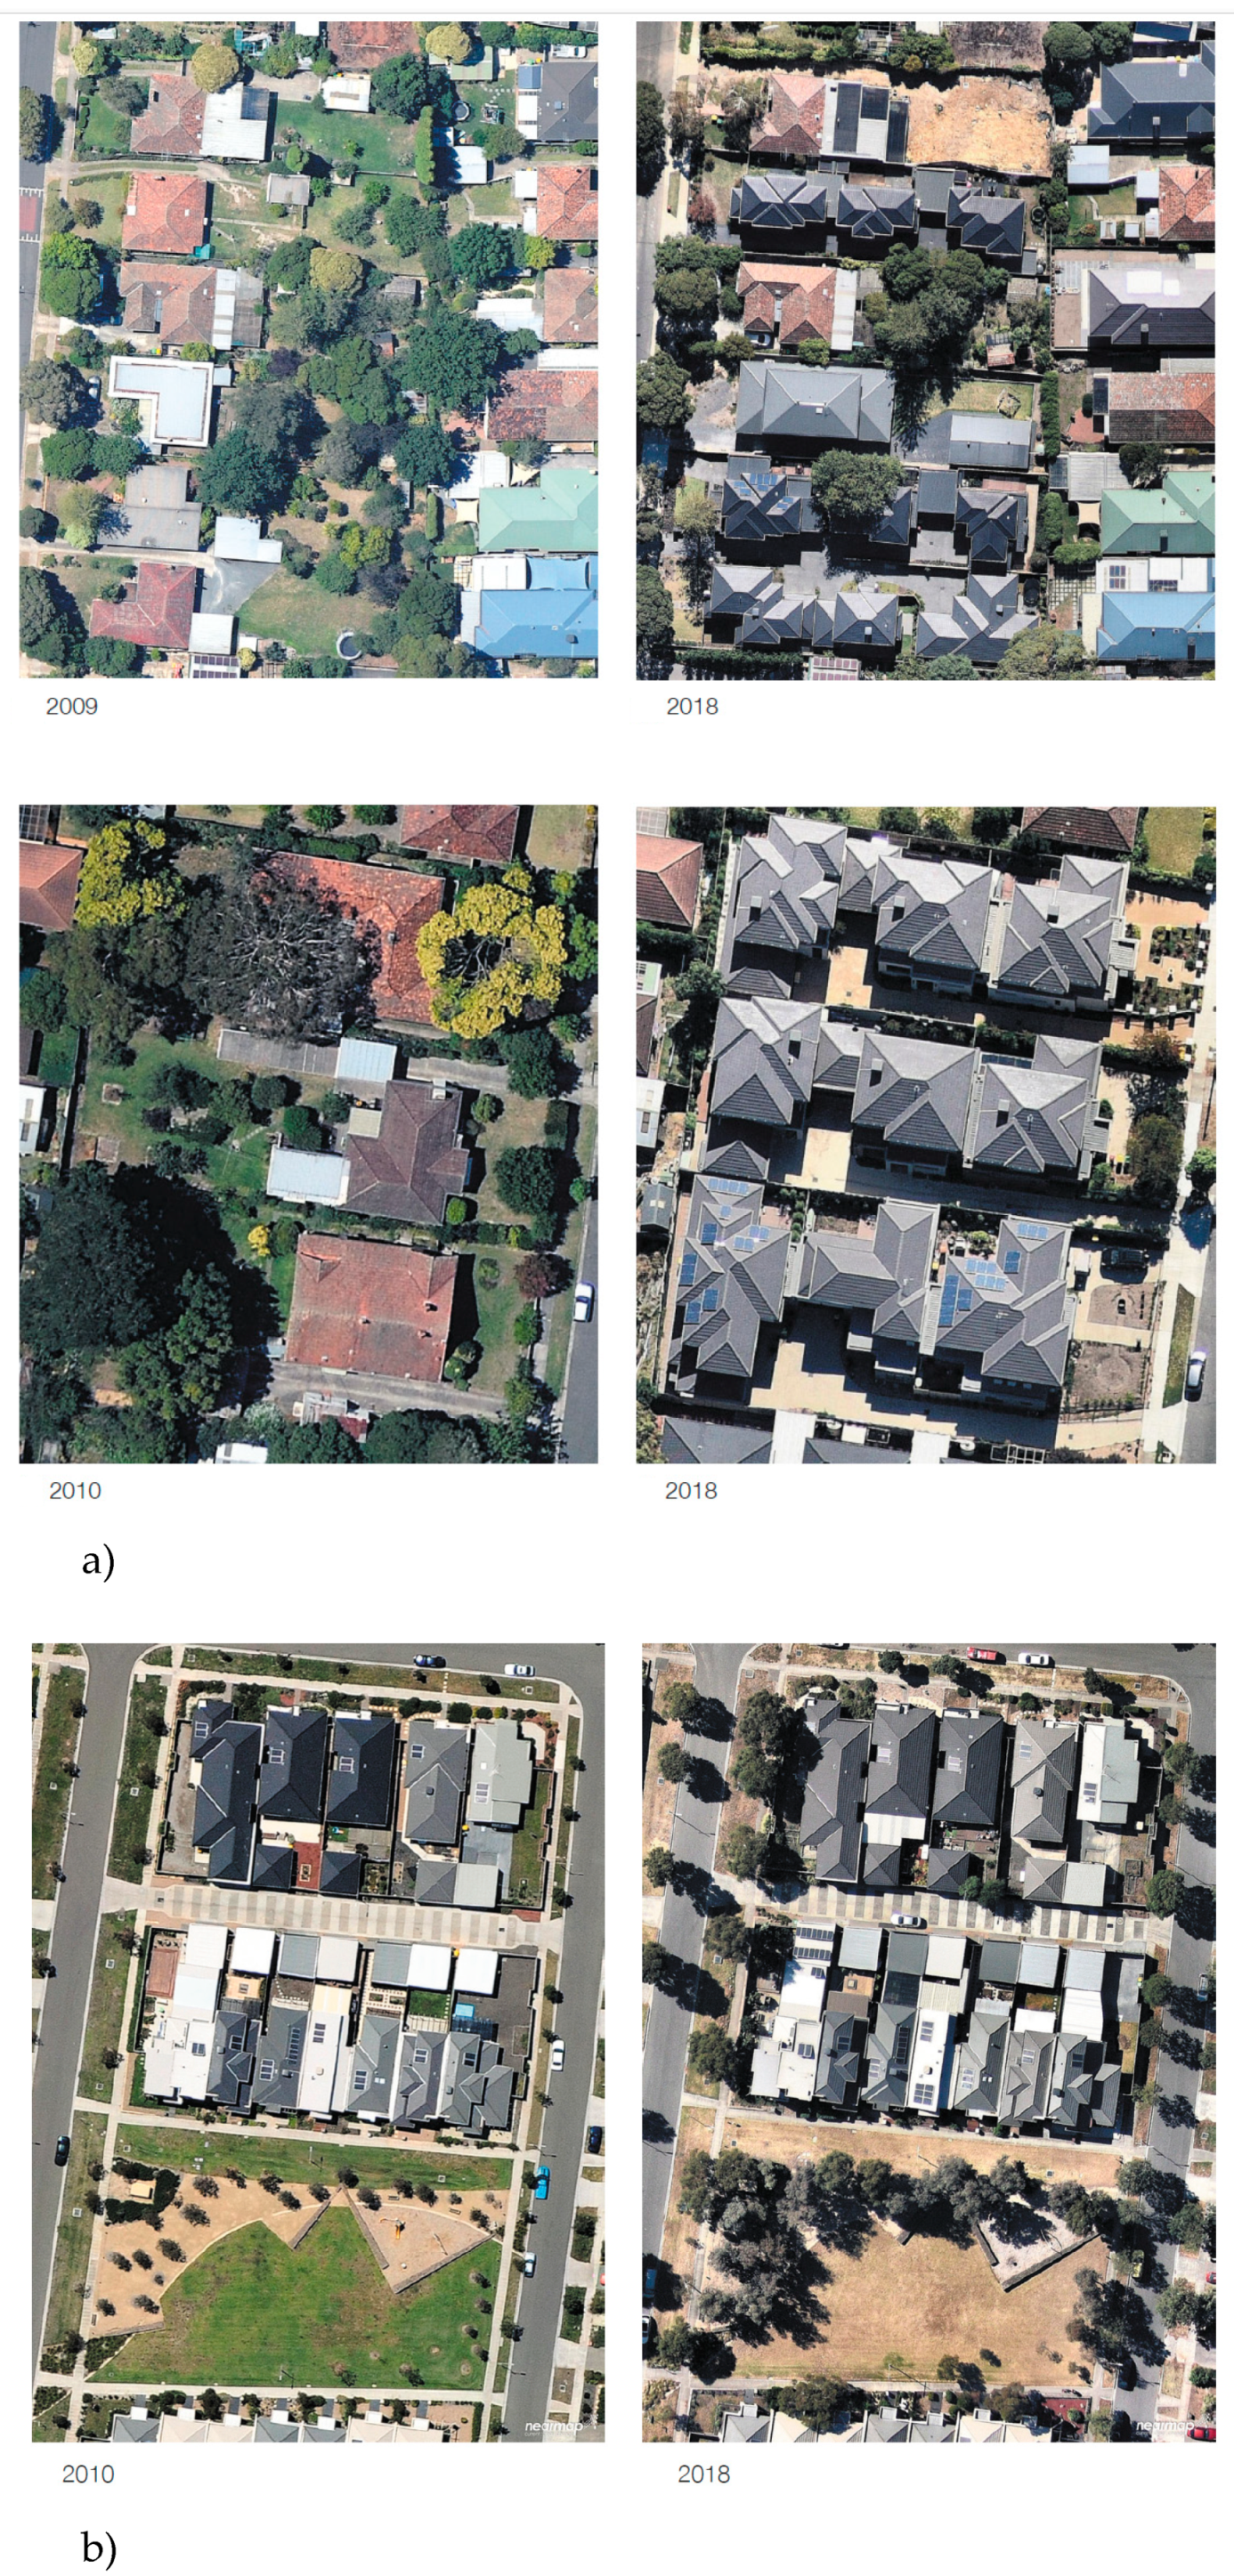
However, it was known that Melbourne was losing its canopy cover [23], and recent research found that between 2014 and 2018 there was a loss of canopy and shrub cover (combined) of 1.9% and tree cover alone of 0.7% across metropolitan Melbourne [24]. The loss is not uniform across metropolitan Melbourne, the eastern and southern regions showing greater rates of tree canopy loss (off a much higher base) resulting largely from densification of existing residential blocks (Figure 1a), and the western and northern regions of Melbourne showing a slight increase (off a low base) as a result of new developments on former farmland resulting in new streetscape, parkland and back/front yard plantings and during this period (Figure 1b).

Figure 1.
(a) Historic vs. recent growth patterns in established urban areas in Melbourne’s eastern region (upper images: higher residential density and single-dwelling renovation or construction of new dwellings; lower images: a redevelopment of four allotments with four detached dwellings to yield 12 dwellings) and (b) historic vs. current growth patterns in urban growth areas in Melbourne’s northern region (note growth of street trees over an eight-year period). Year of photo under image.
Metropolitan Melbourne incorporates 32 LGAs. Local government is the third level of government in Australia and has a significant impact on the community. LGAs deliver more than 100 services including environmental management, managing land and community infrastructure. LGAs are responsible for a large range of capital and operational works such as waste management, road maintenance, drainage management, municipal building management and maintenance, social and community services, planning and building regulation, parks, open space and streetscape vegetation [25]. Fragmented governance hampers the ability to plan for and adequately protect a metropolitan-scale urban forest across different jurisdictions and land tenures. LGAs are the primary developers of urban forest strategies and are also major land managers of the urban forest itself, along with State government and statutory authorities (such as Parks Victoria and Melbourne Water) and private landholders.
As at 2019, 13 LGAs in Melbourne had or were developing an urban forest strategy and were making efforts to maintain or increase tree canopy cover (Table 1). Although some of these strategies focus narrowly on street trees and canopy on public land, others also consider vegetation on private land, have performance measures, are long term, and use a broad definition of an urban forest. Other LGAs have ‘urban landscape’, ‘open space’, or ‘street tree’ strategies which also contribute to the urban forest (Table 1). A range of Victorian Government documents provide support and guidance relating to parts of Melbourne’s urban forest. These include Plan Melbourne 2017–2050 [17], the Victorian Climate Change Adaptation Plan 2017–2020 [26], Protecting Victoria’s Environment–Biodiversity 2037 [27], the Victorian Public Health and Wellbeing Plan [28] and the Draft Metropolitan Open Space Strategy [29]. However, a coordinated approach to planning Melbourne’s urban forest across the entire metropolitan area, across different tenures, and encompassing native and exotic vegetation was lacking.

Table 1.
Municipal urban forest plans in Greater Melbourne, including current total tree canopy cover (as specified in individual local government plans or related documents), measurable canopy cover targets (public and private), overall canopy cover target and measurable tree diversity target (as at 2019).
Some efforts have been made to coordinate across jurisdictions at a regional (sub-metropolitan) scale. For example, ‘Greening the West’ is a regional collaboration to help communities in Melbourne’s west expand green spaces in parks, reserves, streetscapes, roofs and walls, backyards, car parks, sporting fields and waterways. A total of 23 organisations—LGAs, Victorian Government departments and agencies, water utilities and community groups—work successfully together to protect and enhance the urban forest, sharing knowledge and promoting and scaling up practical solutions in western Melbourne. The value of this collaboration is that, to date, Greening the West has generated AUD 30 million worth of green infrastructure projects in the Western Region of Melbourne [30].
2.2. Developing the ‘Resilient Melbourne’ Strategy
In 2014, Resilient Melbourne was established as part of the 100 Resilient Cities (100RC) initiative, pioneered by The Rockefeller Foundation. This global initiative aimed to help cities around the world become more resilient to the physical, social and economic challenges that are a growing part of the 21st century [31]. Melbourne was selected from 372 applicant cities around the world to be in the first wave of 33 cities to join the network. A key element of all cities as part of this program was the development of a resilience strategy.
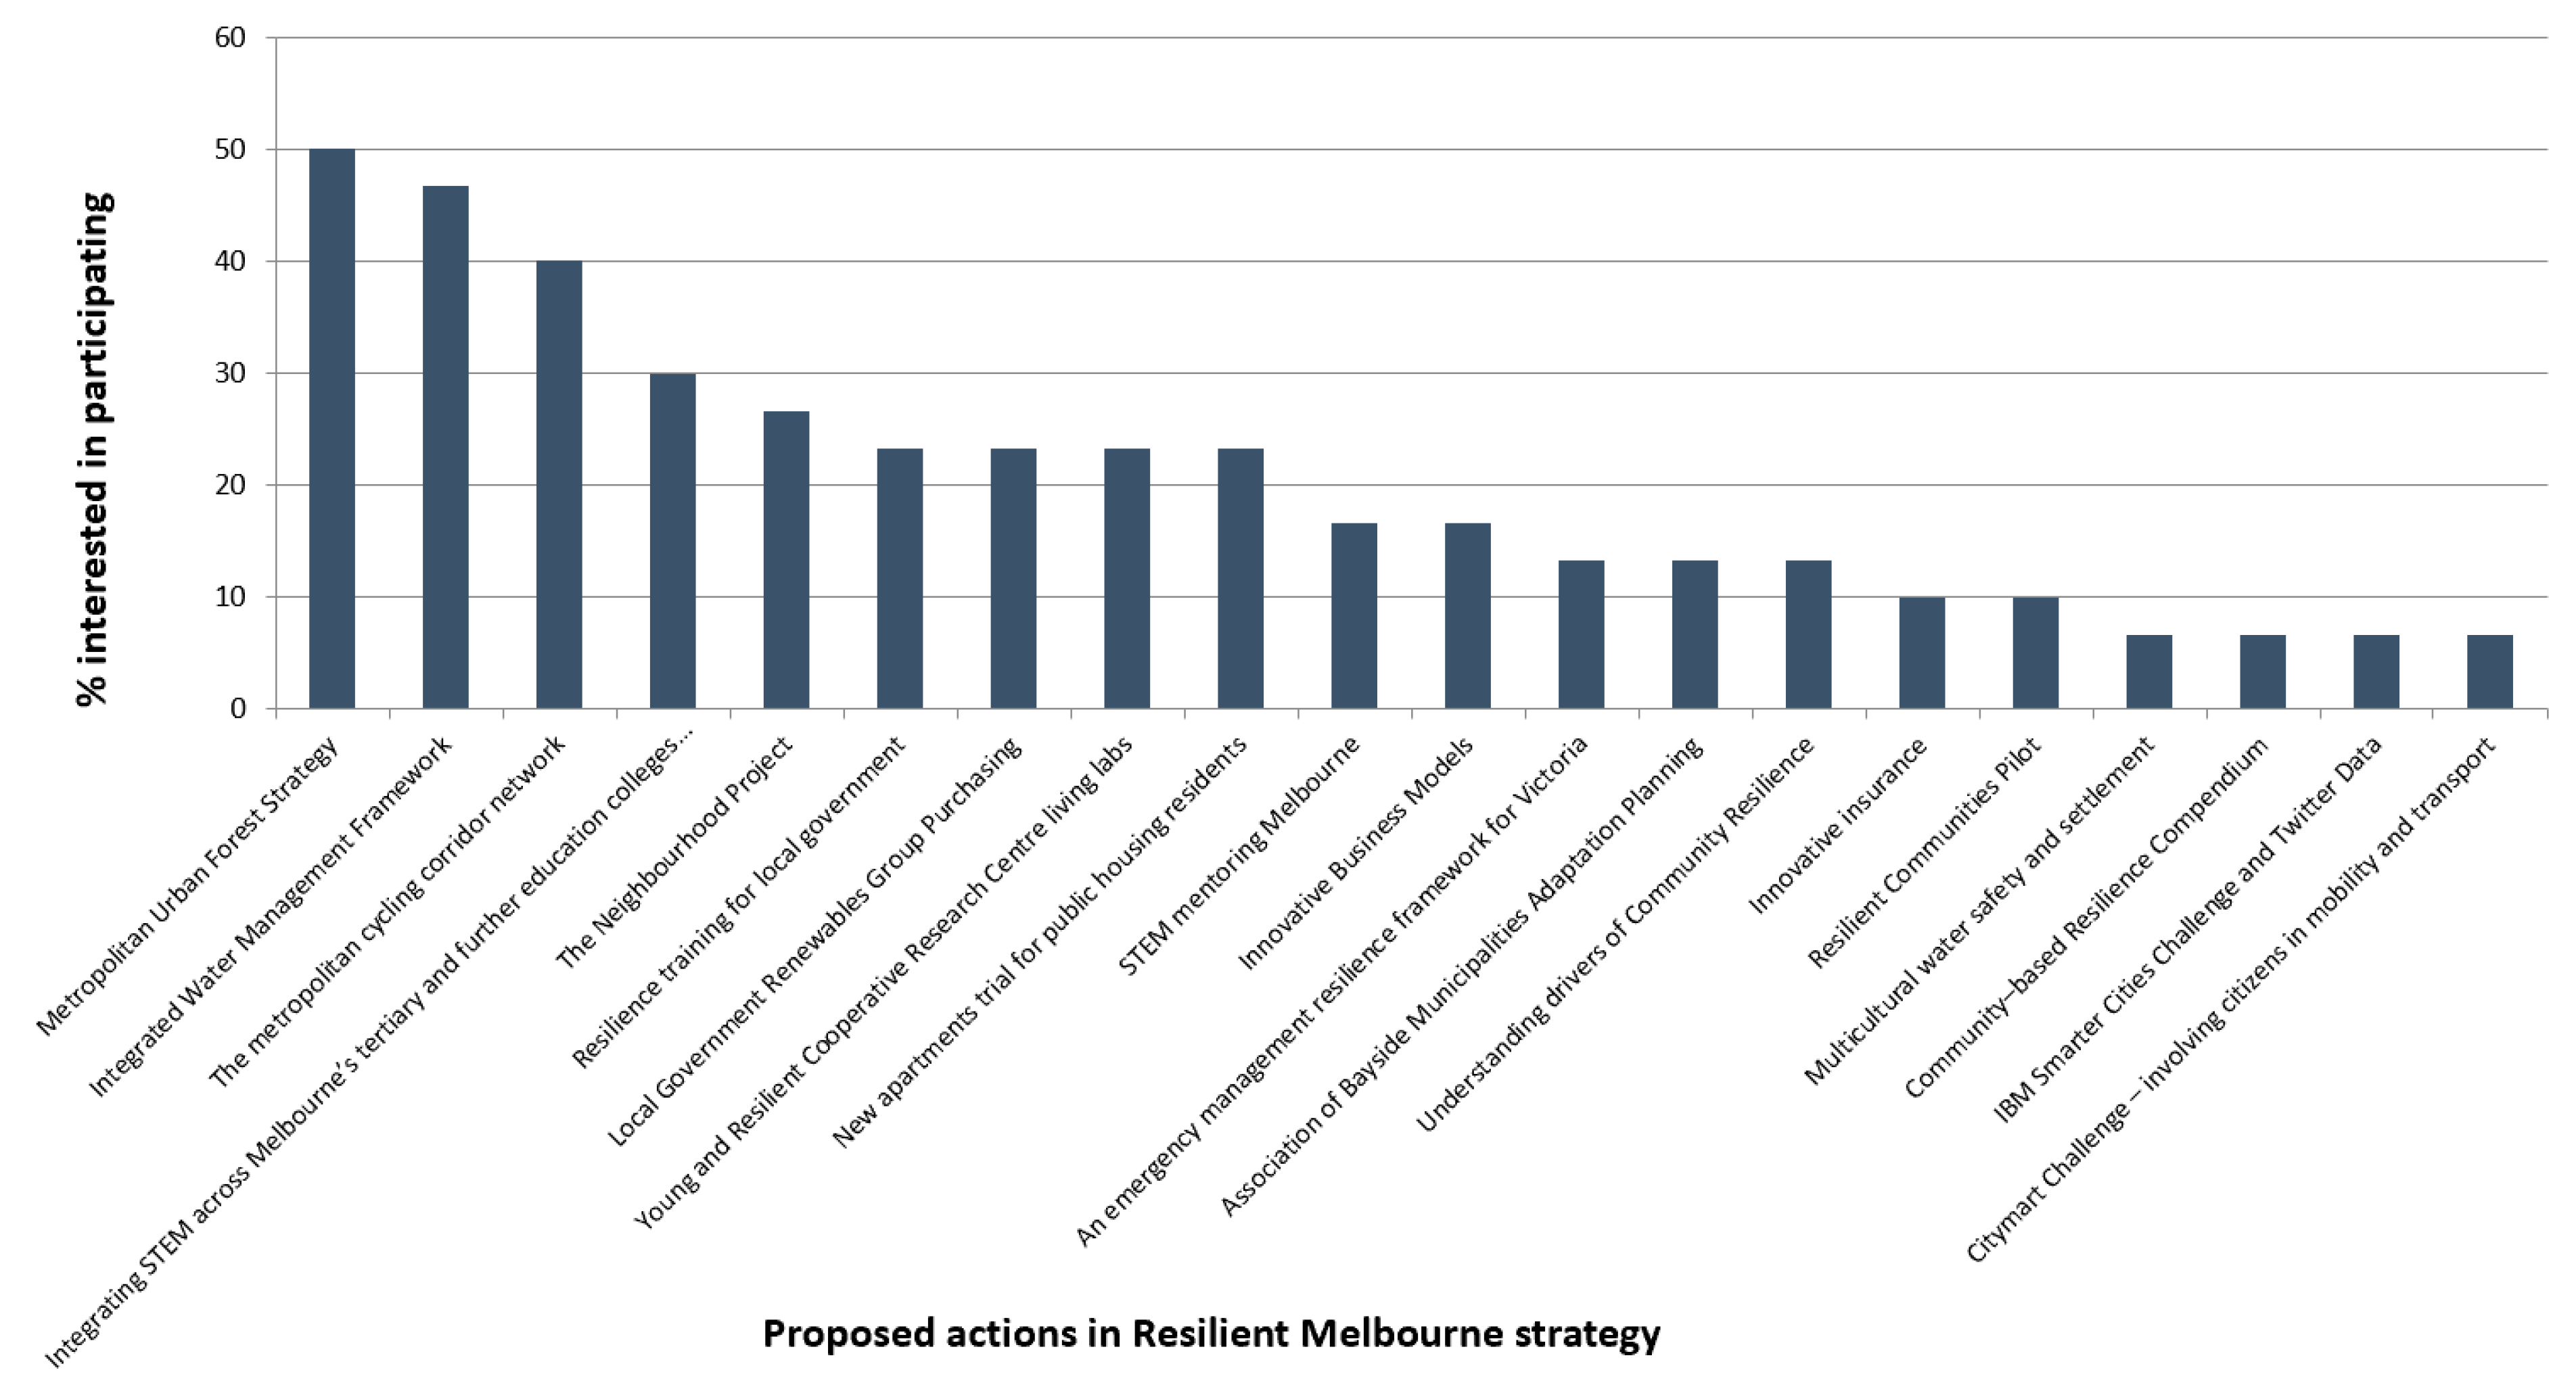
Following significant engagement across metropolitan Melbourne, including all LGAs, Victorian Government, and many other stakeholders, the Resilient Melbourne strategy was released in 2016 [32]—the first ever metropolitan-wide strategy in Australia that was led by local government. The Resilient Melbourne strategy recognised that a metropolitan-wide urban forest strategy would bring city-wide benefits that could not be achieved by individual LGAs in isolation and recommended the development of such a strategy as a flagship action (which was also considered the highest priority action for LGAs (Figure 2).

Figure 2.
Local Government voting results on the most important Resilient Melbourne Strategy actions.
The Nature Conservancy, a global conservation NGO, worked in cities across Europe, North America and Africa, and Asia collaboratively with organisations and communities using strategic planning and science-based solutions make cities resilient, healthy and equitable (e.g., [33,34]). In 2014, The Nature Conservancy scoped the potential for a city-wide biodiversity strategy for Melbourne and found strong interest amongst stakeholders. The Nature Conservancy was a global platform partner with 100 Resilient Cities and in 2016 agreed to partner with Resilient Melbourne to lead the development of a metropolitan urban forest strategy which would become Living Melbourne: Our Metropolitan Urban Forest [35].
3. Developing a Metropolitan-Wide Urban Forest Strategy
Three major processes were run concurrently to gather information and ensure stakeholder engagement and ownership: (1) mapping of the urban forest (in the absence of a consistent metropolitan-wide dataset), (2) governance and advisory, and (3) broader engagement and co-design. These are outlined below.
3.1. Mapping and Modelling to Inform Priorities
3.1.1. Mapping Metropolitan Melbourne’s Urban Forest
Mapping the extent of the urban forest is essential for its development, protection, maintenance and growth. Comprehensive and accurate maps give government authorities and other land managers the information they need to make informed decisions about improving, re-establishing and connecting natural environments [36]. Canopy cover is an important measure of the urban forest’s ability to benefit the community and the environment [37]. One of the major inhibitors for developing metropolitan-wide strategy was a lack of consistent data across the region. Thus, developing a consistent, metropolitan-wide vegetation and canopy map for the Living Melbourne strategy was a critical step in assessing the current status of metropolitan Melbourne’s urban forest, and for setting future targets and actions [12].
100 Resilient Cities (100RC) secured global platform partners to undertake the mapping of metropolitan vegetation and subsequent development of Living Melbourne. To better inform the strategic approach of connecting and enhancing our metropolitan urban forest, new mapping resources including imagery and mapping derivatives were developed. eCognition Essentials software provided by global software developer Trimble was used to map metropolitan Melbourne’s urban forest. The two main sources of data were: (1) two-metre resolution multispectral satellite imagery provided by DigitalGlobe (November 2016–March 2017) and (2) Victorian Government Light Detection and Ranging (LiDAR) datasets (years 2005–2006, 2008–2009, 2011–2012, 2012–2013) and 1 m resolution Digital Terrain Model (DTM) and Digital Surface Model (DSM). Overall, the provided source data were well suited and of good quality (Morphum Environmental pers. comm. 2018). These data sets were prepared and formatted before being processed by eCognition Essentials.
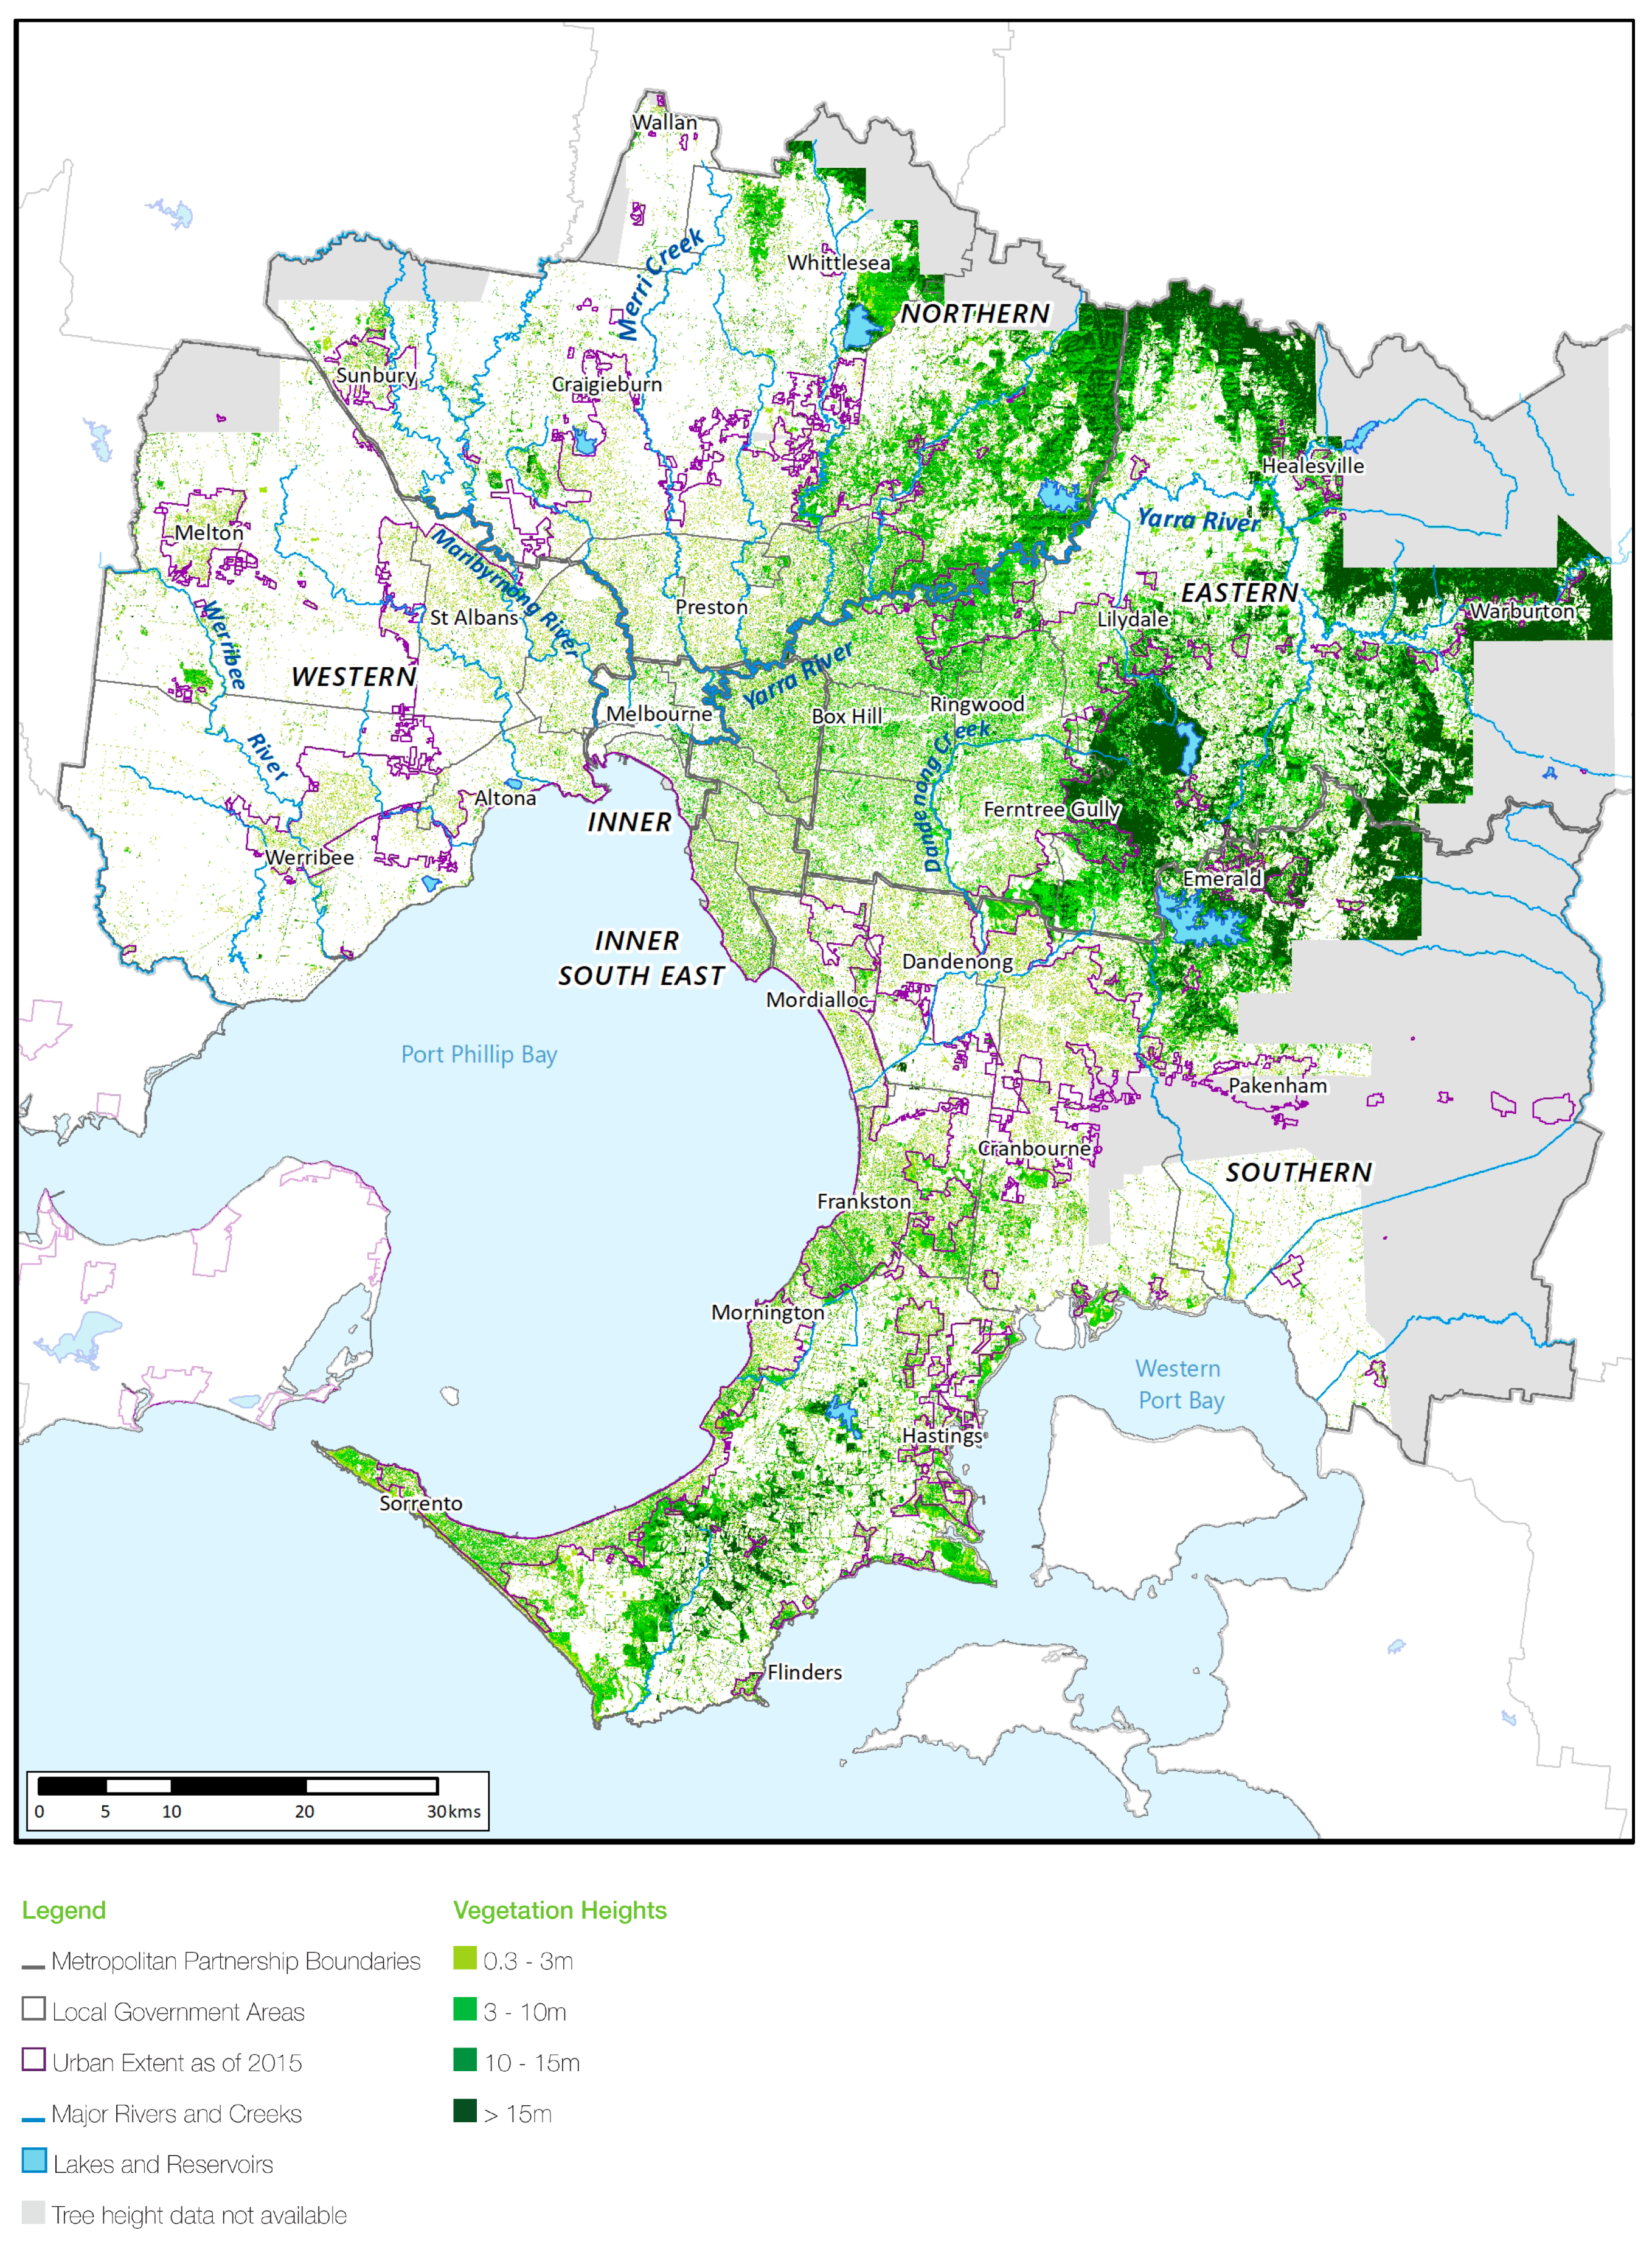
The output provided a map of the distribution and height of vegetation across metropolitan Melbourne (Figure 3 and Figure 4 and further details in [38]). The resultant mapping classified vegetation height into 5 Height Class categories: 1 = 0–0.3 m (grass), 2 = 0.3–3 m (shrub), 3 = 3–10 m (small tree), 4 = 10–15 m (tree), 5 = 15+ m (large trees). In general use, it is recommended that due to (a) the variations in the dates and times of the satellite imagery and LiDAR datasets, (b) the DTM and DSM resolution, and (c) the satellite imagery resolution that the vegetation data are best viewed at a scale of approximately 1:12,000. The overall accuracy of the metropolitan Melbourne urban vegetation height dataset is 82.0%, with Producer’s Accuracy ranging from 74.3% (Height Class 4) to 90.1% (Height Class 1), and User’s Accuracy ranging from 80.0% (Height Class 5) to 85.0% (Height Class 4). When the height classes are condensed down to belonging to Understory Vegetation (<3.0 m) or Tree Canopy (>3.0 m), the Overall Accuracy increases to 94.5%, with Producer’s Accuracy and User’s Accuracy for individual classes above 90%.
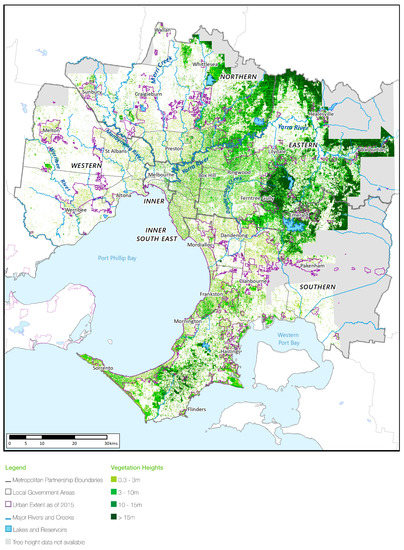
Figure 3.
Metropolitan Melbourne’s Urban Forest by vegetation height. Note grasslands not shown.
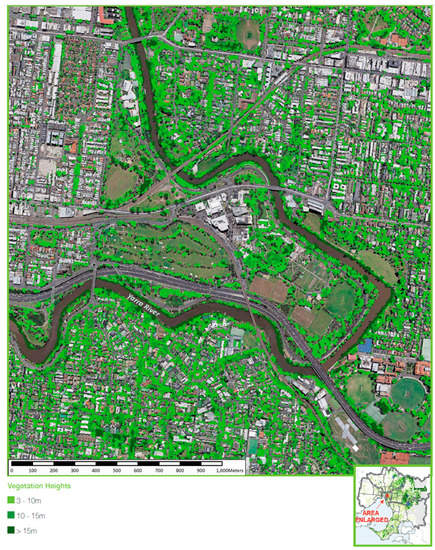
Figure 4.
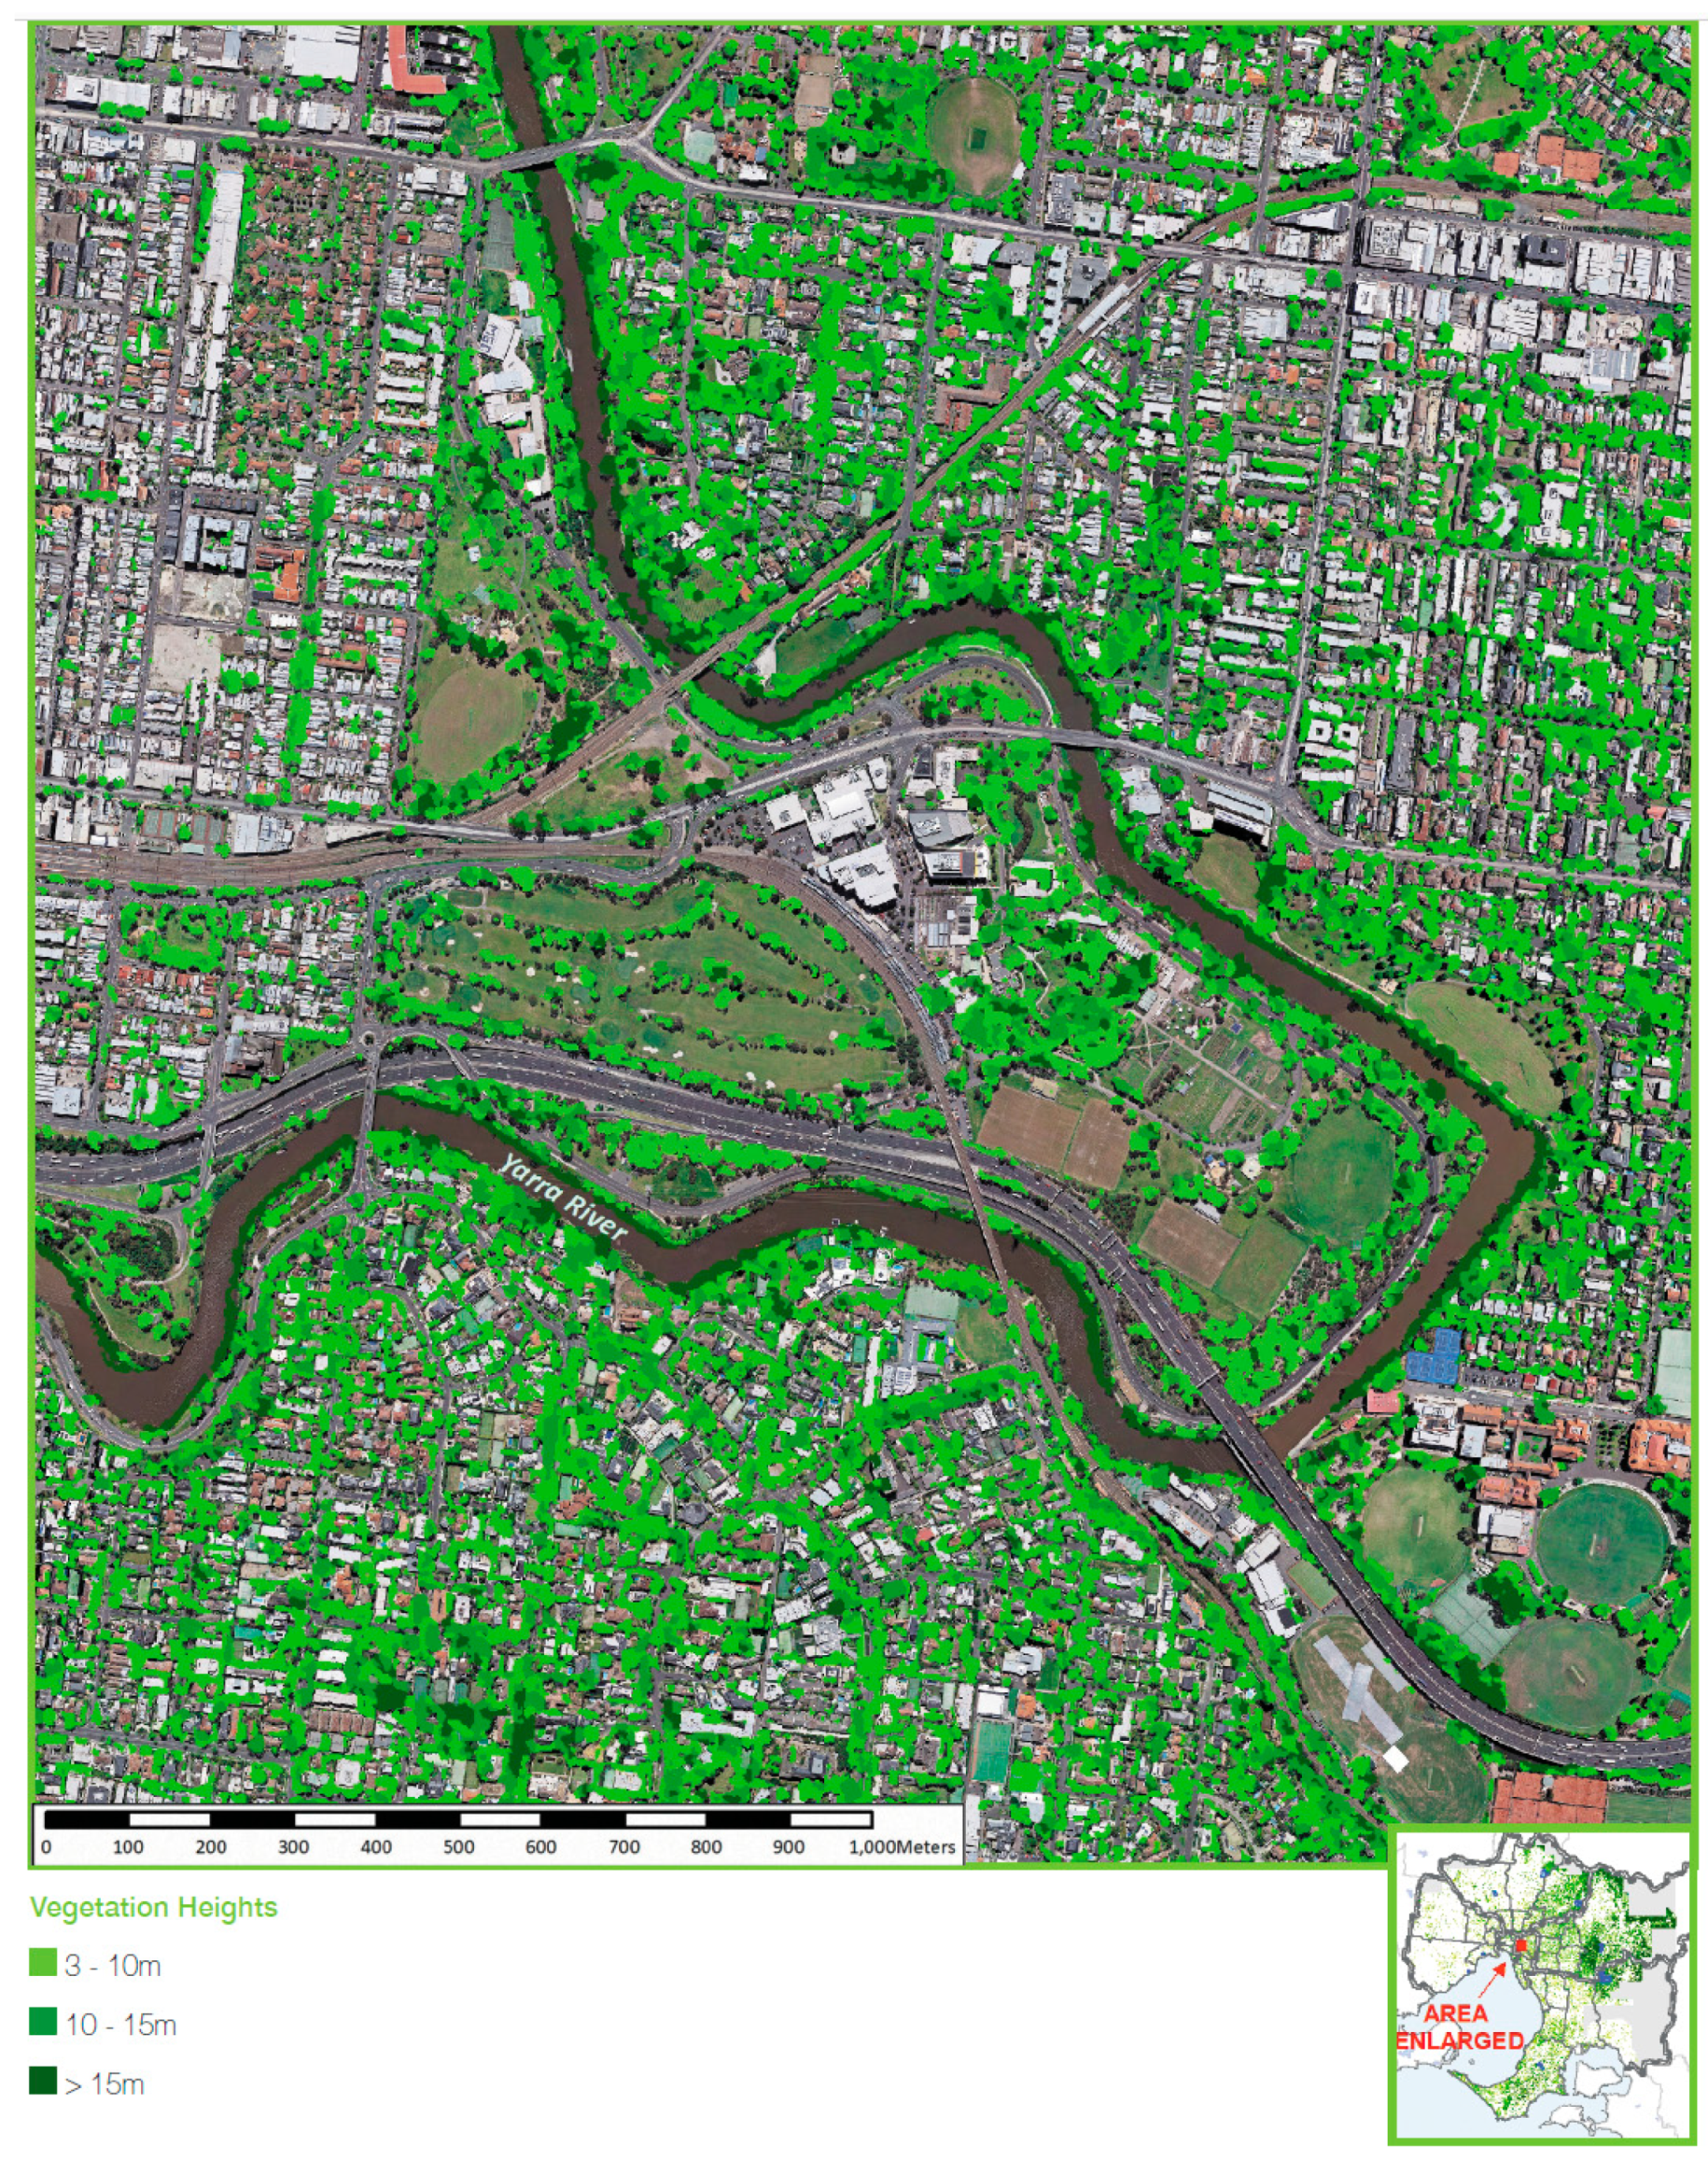
Canopy vegetation, overlayed on aerial imagery and centred on the suburb of Burnley, inner eastern Melbourne.
The metropolitan urban area has a total canopy cover of 15 percent. Table 2 provides a regional breakdown of the distribution of canopy cover across metropolitan Melbourne (Regions shown in Figure 3). Canopy is defined as vegetation above three metres in height. Canopy cover is highest in the Eastern (25%) and Inner South-East (22%) regions. The Southern (16%), Inner (13%) and Northern (12%) regions have less canopy cover. Canopy cover is lowest in the Western Region (4%).
Table 2.
Canopy cover in urban Melbourne.
3.1.2. Habitat Connectivity
Connectivity and the ability of animals to move, and plants to disperse, within or between patches of habitat is critical for conservation [39]. Many individual patches of habitat in urban areas are too small and widely dispersed to support viable populations [40]. It is therefore important that green spaces, such as gardens and public open space, are not viewed at the individual scale, but instead considered collectively as interconnected networks of green spaces across the urban landscape [41,42].
In Melbourne, like in other Australian cities, streetscapes with native trees support significantly more diverse and abundant populations of native birds than streets with mostly exotic trees [41,43]. Birds provide a useful candidate taxon for monitoring as they are relatively easy to detect and identify, census methods are well developed and formal and informal monitoring and databases in existence (e.g., [44]). Using the urban forest canopy cover mapping layer with bird atlas data (supplied by BirdLife Australia) and other important datasets (such as ecological vegetation classes), enabled the modelling of different levels of connectivity and landscape permeability for different bird species and bird groups (Figure 5).
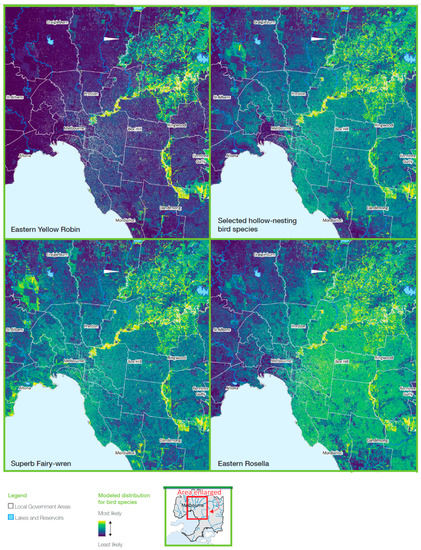
Figure 5.
Modelled distribution for various bird species or bird groups in Melbourne’s urban landscape, with suitability ranging from most likely (yellow) to least likely (dark blue).
The high suitability of particular riparian corridors (such as along the Yarra River and Dandenong Creek) for many of these bird species highlights the importance of these features for the persistence of some species in the urban landscape, and the importance of connectivity [40,45]. However, for species that are better able to exist in the urban environment, suitable habitat and connectivity is also provided by streetscapes and backyards.
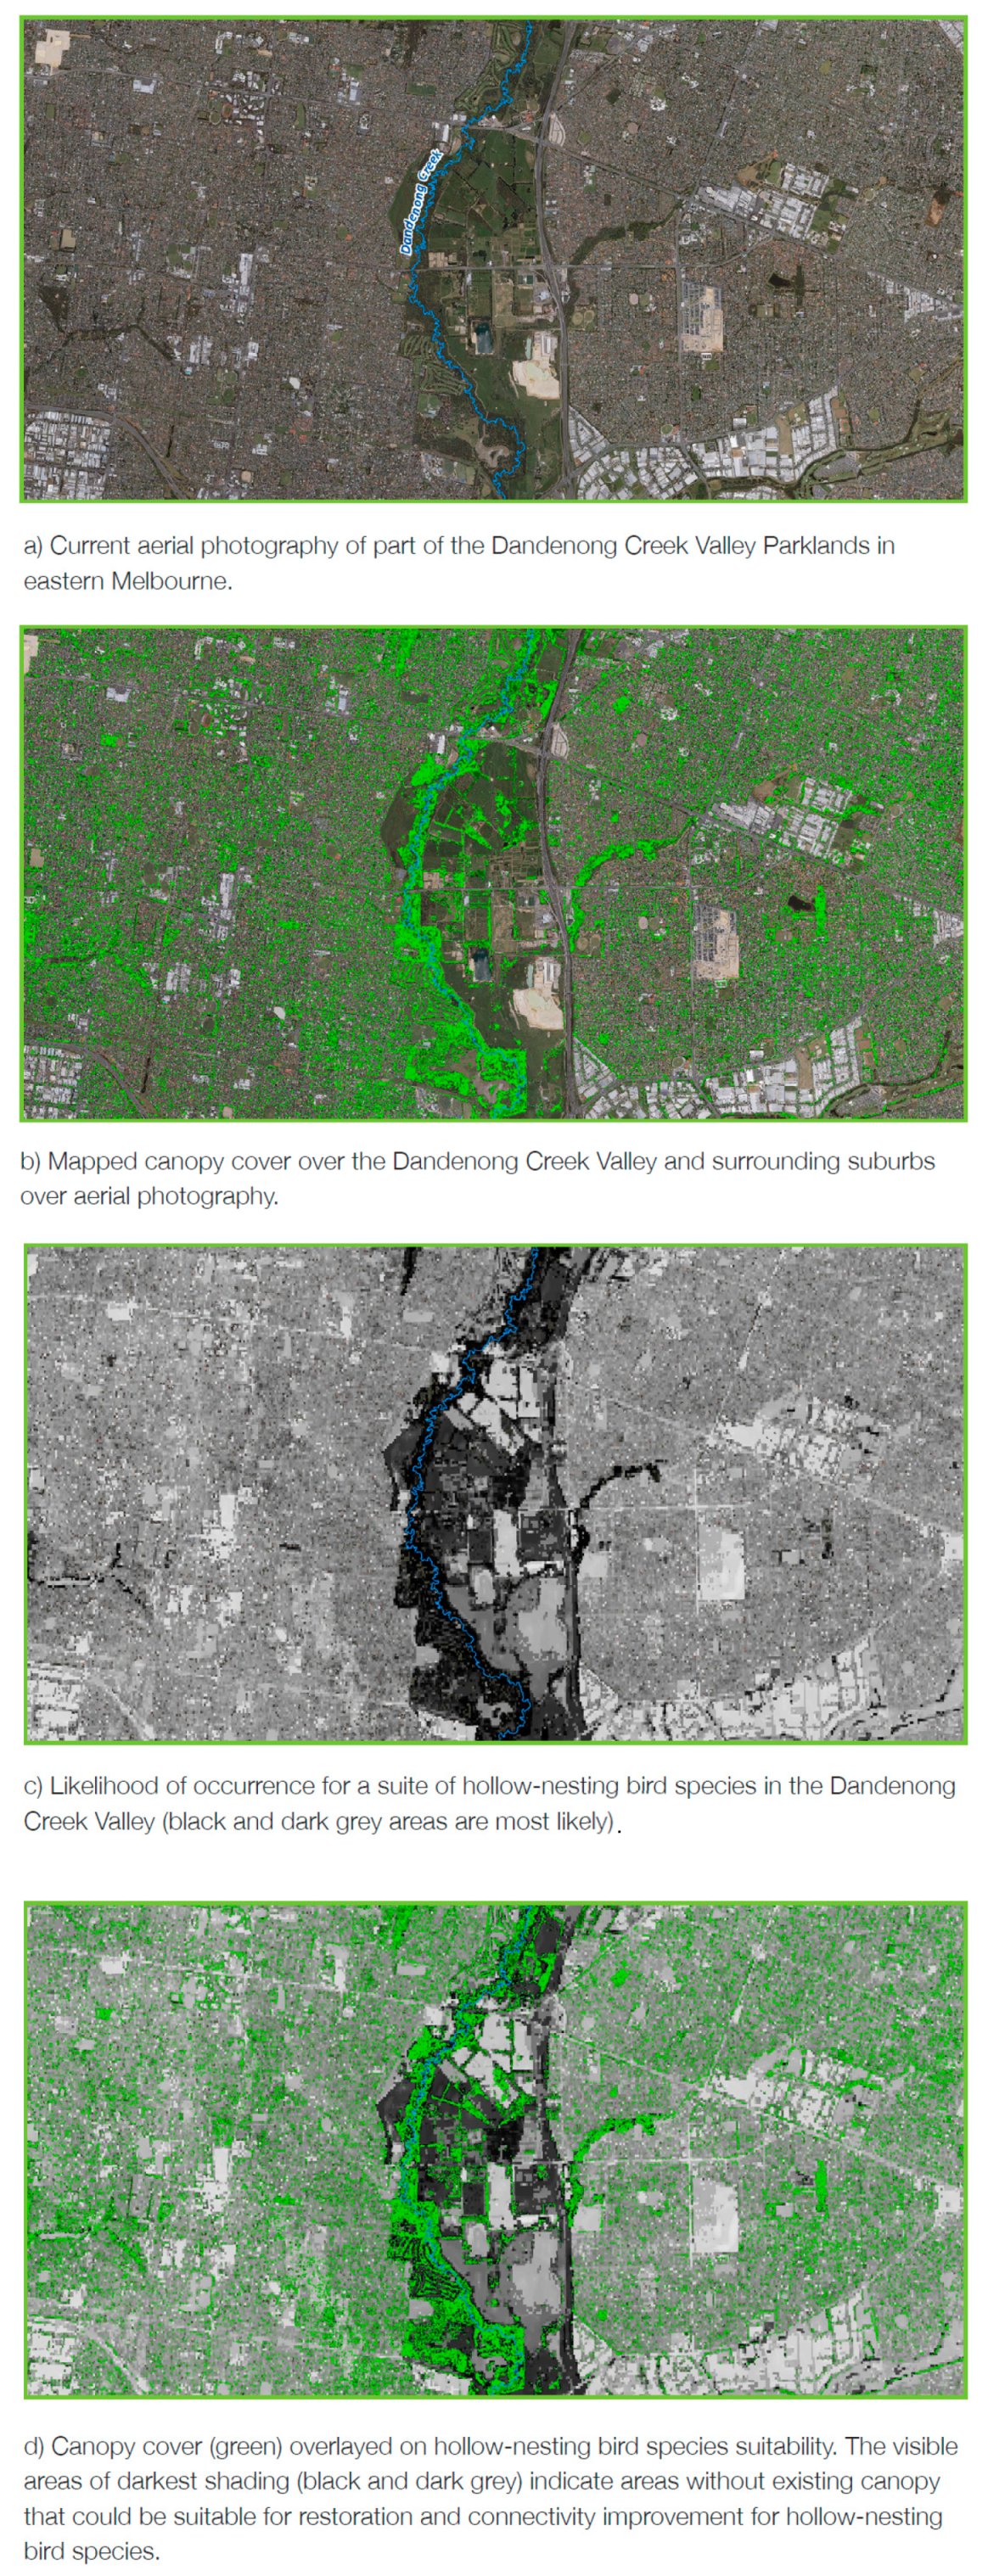
Identifying a network of existing and potentially new habitat corridors at different scales for a range of species (and protecting and improving these corridors) will be an important step in creating an enhanced urban forest for Melbourne. For example, combining habitat models based on species records and known habitat preferences with canopy mapping can reveal areas for future corridor improvement (Figure 6).
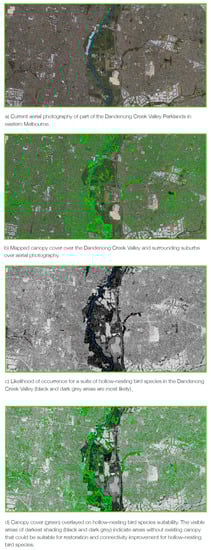
Figure 6.
Canopy mapping and bird species habitat modelling used together, to reveal areas suitable for corridor improvement by expanding the urban forest: Dandenong Creek Valley Parklands in eastern Melbourne.
3.1.3. Correlations between the Urban Forest and Heat Vulnerability
Urban forests cool surrounding environments. Built-up areas of cities can be as much as 7 °C warmer than surrounding areas [46]. This ‘urban heat island effect’ is caused by the heat-absorptive thermal mass of concrete, bitumen and bricks. The urban heat island disproportionately affects vulnerable people, including young children, the elderly, people who are unwell or socially isolated, and those who are financially disadvantaged [47].
In developing the Living Melbourne strategy, the land surface temperature was analysed using a variety of Australian Bureau of Statistics indices, such as the Socio-Economic Indexes for Areas, which ranks areas in Australia according to relative socio-economic advantage and disadvantage. This found a close correlation between “hot spots” in the landscape and vulnerable populations (Figure 7, Table 3).
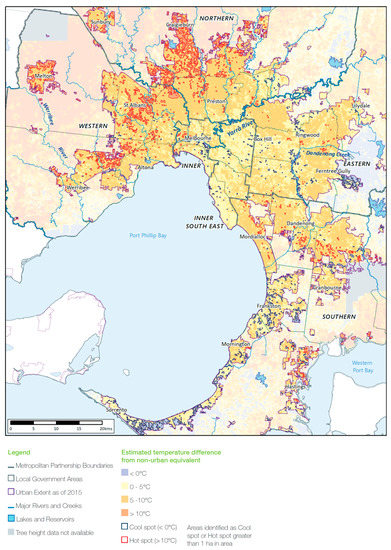
Figure 7.
Urban heat islands across metropolitan Melbourne. Hot spots (>10 °C warmer than non-urban conditions) bordered in bright red. Cool spots (areas that are equal to or below their estimated non-urban baseline temperature =< 0 °C) bordered in dark blue.
Table 3.
Mean Percent residential rental properties and mean average weekly household income (AUD) compared between urban heat island cool spots and hot spots across Melbourne’s regions.
The land surface temperature analysis was also undertaken to explore the effect of total vegetation cover and vegetation height. About half of metropolitan Melbourne was 5 °C above the city’s estimated non-urban baseline temperature. This applies to about 80 percent of the Northern and Western regions. Canopy vegetation between three and 10 metres high was predominant across Melbourne, and vegetation at this height range provided for more cool spots (areas that are equal to or below their estimated non-urban baseline temperature) (Table 4). Overall, in cool spots there is more vegetation and far more canopy (Table 4). On average, hot spots had less than three percent canopy and no tall trees (trees greater than 15 metres high).
Table 4.
Number, average area and total area of urban heat island cool spots and hot spots across the regions, and total metropolitan area and mean percent cover of vegetation in different height classes compared between urban heat island cool spots and hot spots across the regions. NA = Not applicable.
The highest numbers of hot spots occur in the north, west and south of Melbourne (Figure 7). The north and west also had far more hot spots than cool spots. The size of hot spots and cool spots varied—hot spots in the east were on average three hectares in area, compared to hot spots in the west averaging nearly 10 hectares in area. The opposite was true for the cool spots—these are larger in southern and eastern Melbourne (which is more heavily vegetated) and smaller in the north and west.
We also found, in most cases, a greater number of hot spots where the percentage of residential rental properties is higher and where weekly household income is lower (Table 3).
3.2. Governance Arrangements
The development of Living Melbourne was guided by two key bodies: the ‘Senior Reference Group’ and the ‘Technical Advisory Group’. The Senior Reference Group’s role was to oversee the progress of the strategy and consisted of senior representatives from local government sub-regions of metropolitan Melbourne and a senior representative from Melbourne Water, Parks Victoria, and the Department of Environment, Land, Water and Planning. The Technical Advisory Group, constituting specialists in state and local governments and academia, provided technical input, advice and recommendations to the Living Melbourne project team about the key issues, opportunities and barriers to meeting strategy objectives that should be considered.
3.3. Concurrent Consultation with Stakeholders
A critical part of the development of Living Melbourne was the collaborative approach that was taken by The Nature Conservancy and Resilient Melbourne, with approximately 65 other organisations and 250 individuals either attending workshops or providing feedback on the drafts of the strategy, in addition to the advice of a Senior Reference Group and a Technical Advisory Group. This process included a series of workshops to guide development of the strategy, incorporate stakeholder perspectives and review the strategy as it progressed. Four major workshops helped to:
- Establish the current status of the urban forest and associated management issues;
- Develop the vision and goals;
- Develop the critical strategic areas that the strategy would address;
- Identify technical evidence to guide the strategy;
- Frame and develop the draft strategy.
The stakeholders involved were metropolitan Melbourne’s 32 LGAs, Victorian Government departments (e.g., the Department of Environment, Land, Water and Planning, Department of Health and Human Services, Department of Transport) and statutory agencies (e.g., Melbourne Water, retail water authorities), technical experts, land managers, policy makers, planners, developers and community representatives.
The workshops were complemented by formal and informal consultation with individuals, research organisations, individual stakeholder organisations, associated local government alliances and industry and relevant professional groups.
Each of the workshops had a critical mass of stakeholders present and many stakeholders attended all workshops. In addition to the strong workshop engagement, there was a co-design process including smaller working groups that helped define and delineate the vision, goals and actions arising from the workshop process.
Stakeholders contributed fundamental data that informed various elements of Living Melbourne. Critical data gathered from stakeholders included:
- Twenty-six LGAs contributed their tree asset inventories of street trees and open space trees. While these databases vary in size and scope, these datasets were used to help determine the monetised value of these assets including the economic savings in the form of pollution removal, carbon storage, carbon sequestration, and avoided water run-off. The datasets also helped calculate the cost of replacing these assets with similar trees based on size, species, health and location.
- BirdLife Australia supplied bird atlas data. Using the urban forest canopy cover mapping layer with bird atlas data and other important datasets (such as ecological vegetation classes), enabled the modelling of different levels of connectivity and landscape permeability for different bird species and bird groups.
- Thirty organisations, including 27 LGAs and three major public land managers (Parks Victoria, Melbourne Water and VicRoads) supplied their operational costs relating to the establishment, management and maintenance of vegetation.
- Tree purchasing, planting and maintenance costs were supplied by organisations such Council Arborists Victoria, Nursery and Garden Industry Victoria and public land management agencies to inform estimates of costs for future canopy targets.
- The Clean Air and Urban Landscapes (CAUL) Hub and RMIT University provided road partition features and valuable advice and guidance around the use of the “Melbourne Vegetation and land use cover 2014” [24,48]. This dataset was used to assist the urban heat island analysis.
First and second drafts of the strategy were circulated to stakeholders to seek feedback. In many cases, this feedback was followed up and discussed with the stakeholder to ensure that their views were clearly understood and where appropriate articulated in the strategy before the strategy was finalised. Living Melbourne was launched in mid-2019. Its key elements are outlined below.
4. Vision, Goals and Actions of Living Melbourne
Through the co-design process, a strategic vision was agreed of ‘our thriving communities are resilient, connected through nature’. This vision is supported by three goals:
- Healthy people: Protect and increase access to nature, green space and canopy cover, to reduce heat exposure, and improve mental and physical wellbeing.
- Abundant nature: Protect and extend habitat connectivity and corridors to enhance biodiversity.
- Natural infrastructure: Protect and increase vegetation on public and private land, in order to cool urban areas, retain water in the soils, reduce flood risk and increase water and air quality.
These goals are supported by a program of six interrelated actions that together aim to support and coordinate action across the metropolitan area. These actions are outlined below:
- Action 1: Protect and restore habitats, and increase ecological connectivity of all types between streetscapes, conservation reserves, riparian and coastal areas, open spaces and other green infrastructure across metropolitan Melbourne.
Urban areas can play a significant role in conserving biodiversity, but without conscious efforts to protect and enhance habitat and linking corridors, Melbourne’s natural environment, which is ‘fundamental to the health and wellbeing of every Victorian’ [27] will continue to decline. Living Melbourne recommended restoring corridors and connectivity in Melbourne at different scales and with different approaches needed. The strategy emphasised restoring corridors on public land, with a focus on riverine corridors, and a priority for using indigenous plant species. In an urban setting, while indigenous plant species are usually best for native fauna (especially mobile fauna such as birds, bats and insects), non-indigenous native plant species can also provide important resources (such as food and shelter). Although introduced species of trees and shrubs typically offer fewer resources to fauna, they still provide ecosystem services and, in neighbourhoods where introduced trees dominate, the habitat value of these areas can be improved by increasing structure (such as by planting shrubs and native understorey). The strategy noted the importance of managing the different elements of the urban forest collectively, and building upon existing habitat and vegetation to form an interconnected matrix of green spaces across the urban landscape.
Action 1 comprised the following components:
1.1 Consolidate data, maps and other relevant information.
1.2 Assess the values and quality of information, to develop a list of priority areas for immediate protection.
1.3 Map existing and new areas for biodiversity connectivity at different scales, and prioritise areas for strengthening connectivity and biolinks, including responses to climate change, within each municipality and across the region.
1.4 Implement priorities for conservation, and secure and build habitat connectivity.
- Action 2: Set urban canopy and understorey targets for each metropolitan region, and decide on a clear and consistent method for long-term monitoring and evaluation of the quality and extent of the urban forest.
Increasing canopy cover is a key performance measure for most urban forest strategies [12].
Action 2 comprised the following components:
2.1 Establish and implement urban forest greening targets including, as a minimum, ‘tree canopy’ and ‘tree canopy and shrub’ cover for each region.
2.2 Establish a measure of permeability across the regions, with the aim of implementing a permeability target for public and private land.
2.3 Establish a method for monitoring, evaluating and reporting on the improvement of the urban forest, including indicators and measures for quality and extent.
2.4 Develop a system for consistently collecting and analysing urban forest data, and coordinate the collection and publication of data in a publicly available, comparable database.
The strategy proposed the adoption of regional targets for canopy and vegetation across Melbourne that were based on a common analysis of metropolitan-scale vegetation, current literature and an analysis of the targets incorporated in existing urban forest strategies in 13 municipalities across Melbourne [35]. In addition, these targets were tested through two major rounds of consultation in December 2018 and February 2019 and a final strategy was circulated for endorsement in April 2019.
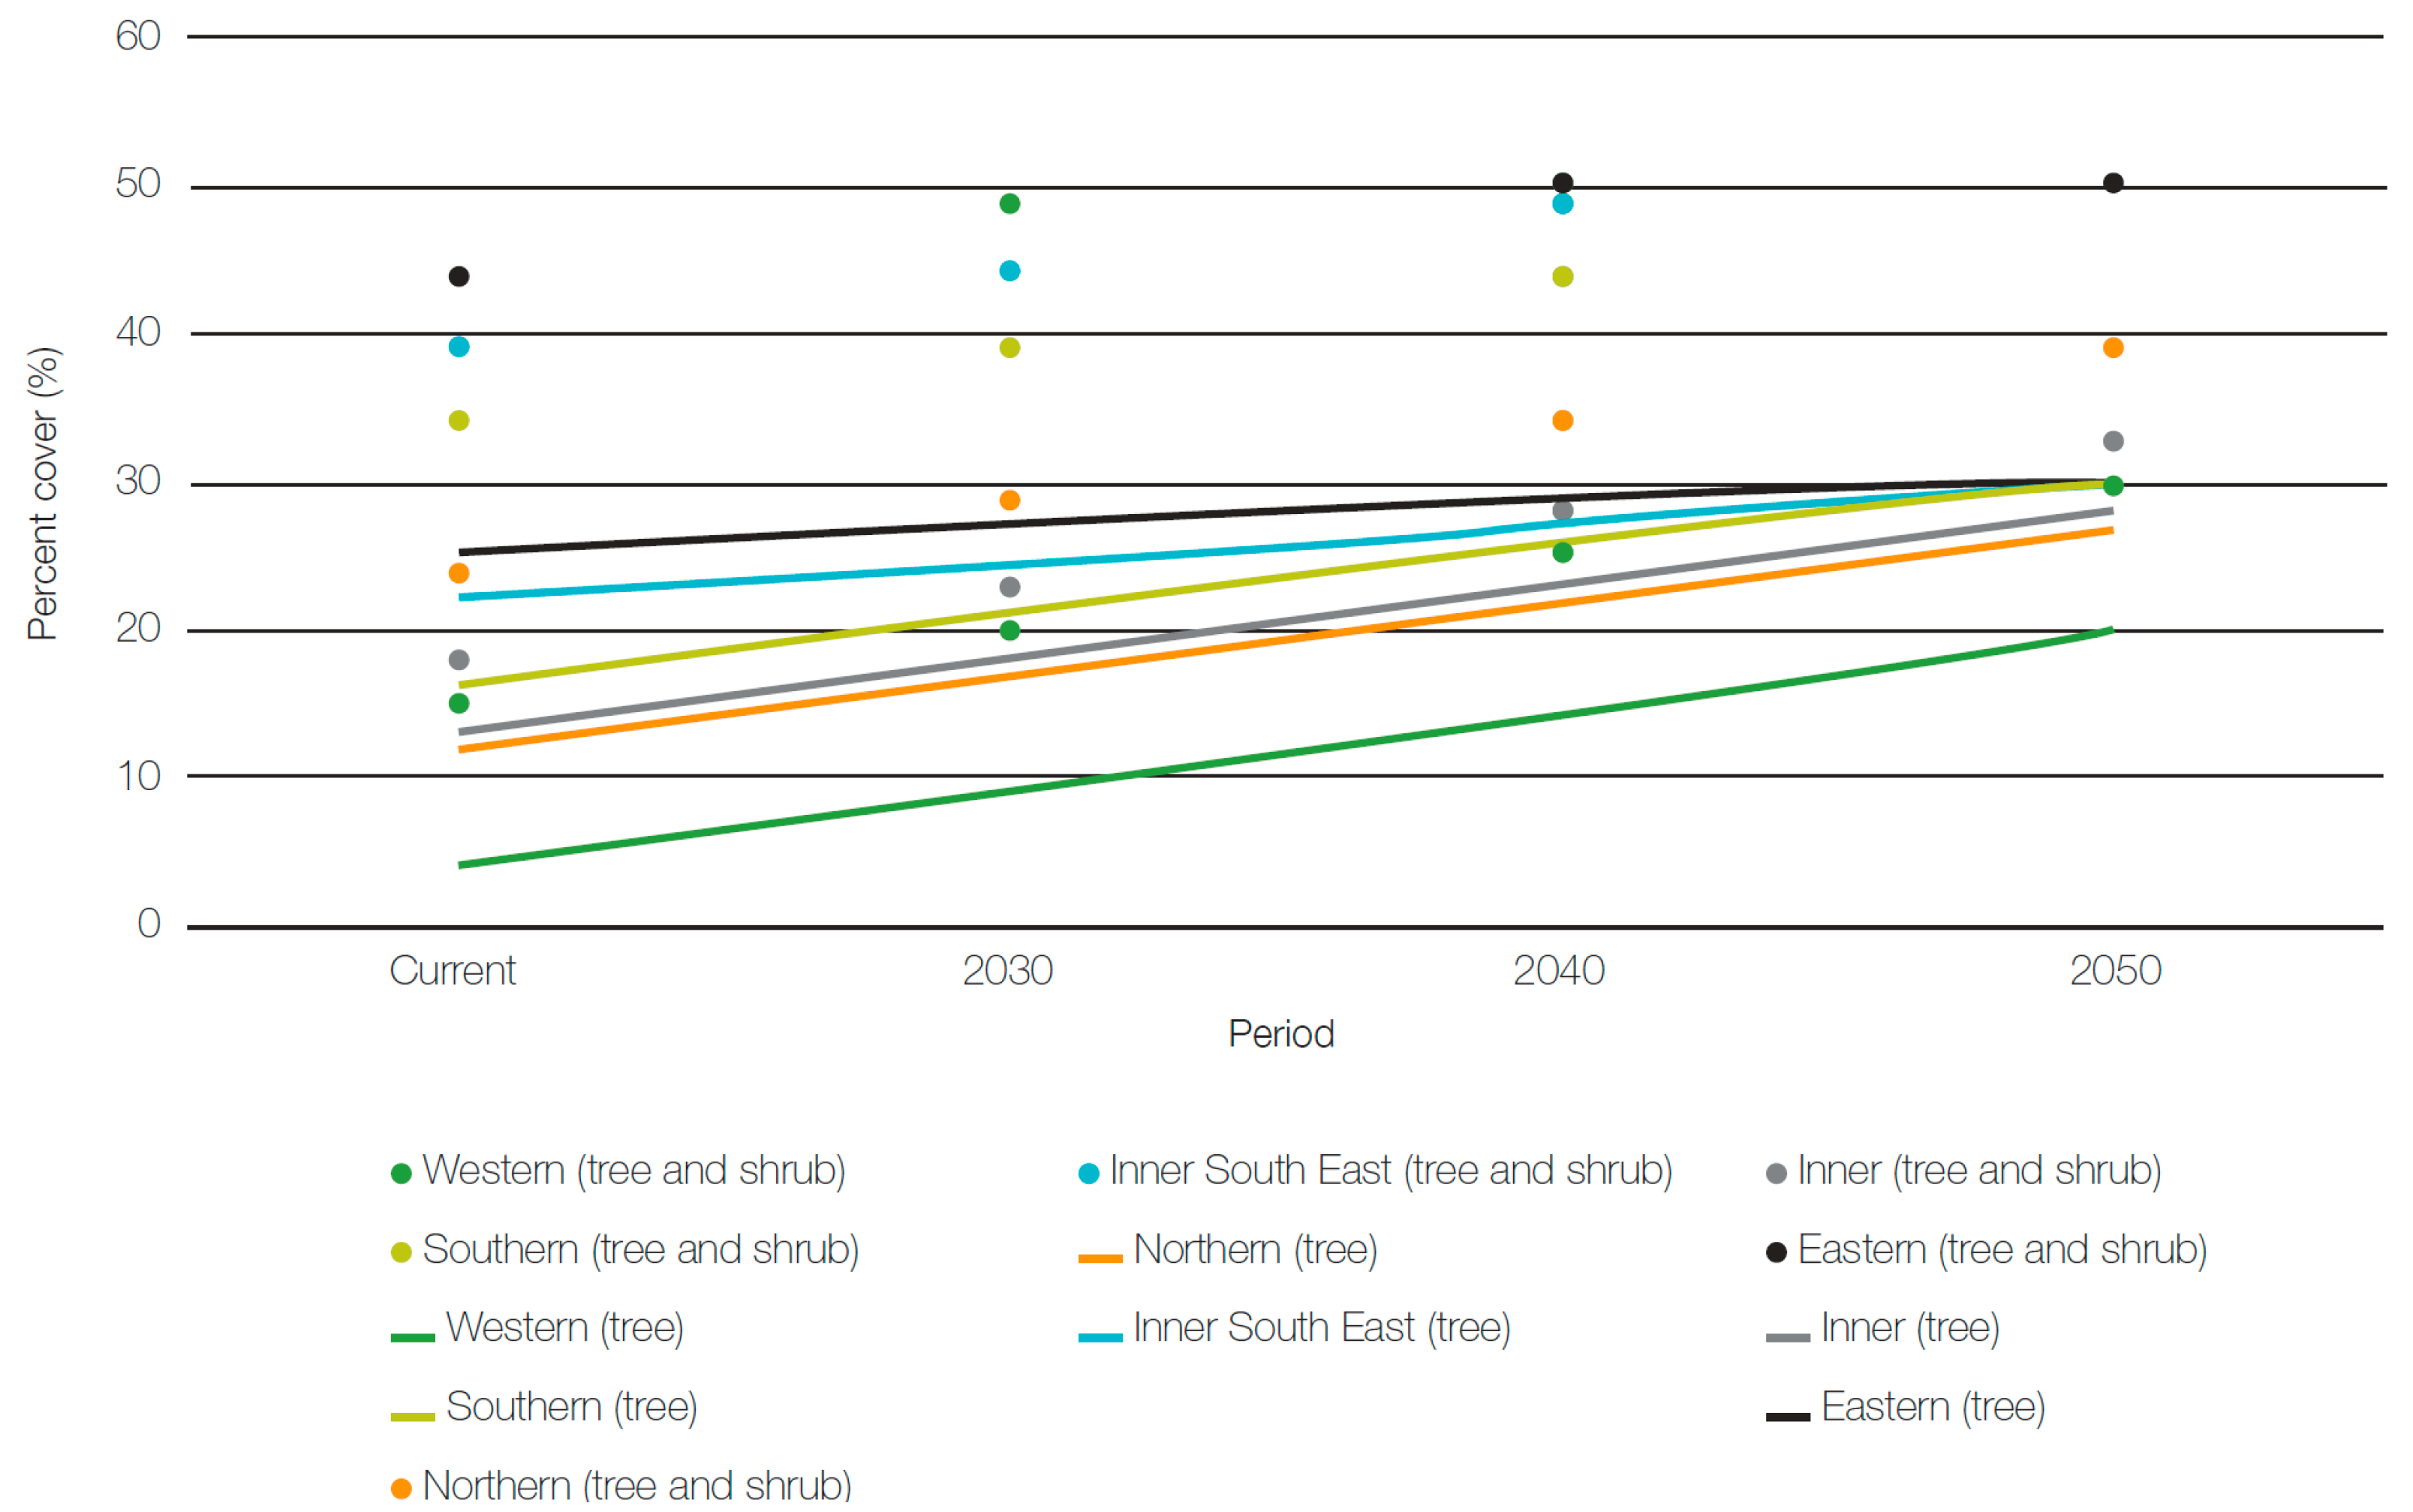
Research suggests that targets should be specific to each region and should take into account local conditions such as development density, land use, and climate [49]. After considering the baseline canopy and canopy and shrub cover for each region, the literature, current LGA urban forest strategies, and regional context, ambitious regional tree canopy cover targets of between 20 and 30 percent were proposed. Because native understorey and tree canopy cover of at least 30 percent benefits biodiversity [3], both tree canopy and shrub targets of between 30 and 50 percent by 2050 were proposed.
As a starting point for regional agreement, Living Melbourne proposed targets that:
- Were calculated based on vegetation in the existing urban area at 2015.
- Applied to all land (public and private) in each region.
- Recommended increases each decade.
- Were supported by principles, including no net loss of tree or shrub cover on public and private urban land in each metropolitan region.
Targets for ‘canopy cover’ and ‘canopy and shrub’ for each metropolitan region are proposed in Table 5 and Figure 8.
Table 5.
Targets for ‘tree canopy’, and for ‘canopy and shrubs’, by region to 2050.
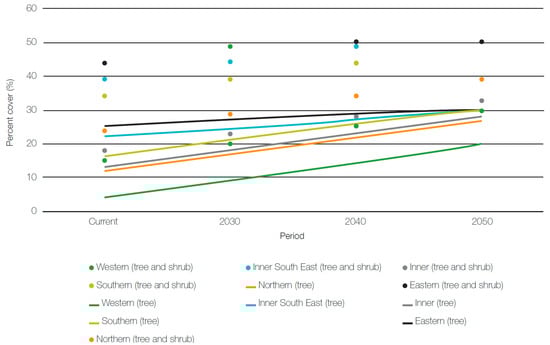
Figure 8.
Commencement points and potential progress towards targets for each region. Tree canopy and tree and shrub cover targets: 2015(Current)–2050 for greater Melbourne region.
The 2015 baseline and targets for each of the six metropolitan regions vary, as they acknowledge the historical development of these regions and the ecological characteristics of their underlying bioregions. In addition, they acknowledge the ambitious canopy cover targets set by some metropolitan municipalities. For example, the Eastern Region of Melbourne was developed before the Western Region, and is largely in the Gippsland Plain bioregion, which before European settlement was mostly dry and damp forest. The result is a canopy cover of about 25 percent in 2015, a higher 2050 target, and less action required to achieve this target. By contrast, the Western Region is a newer urban growth area and is predominantly in the Victorian Volcanic Plain bioregion, which was originally a largely plains grassland landscape. The result is a 2015 canopy cover of only 4 percent, a lower 2050 target, and significantly more effort required to achieve this lower target. The strategy also sets out principles to guide the implementation of urban forest targets along with thresholds for the percentage of vegetation to be maintained or established on public and private land [35].
- Action 3: Strengthen planning and development standards and relevant guidelines to increase the greening of the private realm.
Land zoned for residential, commercial, industrial, special or rural use contributes more than 66 percent of the existing tree canopy, with residential land alone contributing 58 percent. With a trend towards larger houses on smaller lots in greenfield developments, and higher-density development in urban infill areas, gardens have become smaller, and impervious surfaces have increased. The result is a rapid diminishing of the urban forest, as room for vegetation in private space shrinks. Protecting, maintaining and nurturing the trees and suitable understorey vegetation on private land is critical to maintaining and expanding the urban forest.
Action 3 comprised the following components:
3.1 Strengthen regulations to support greening in new subdivisions and developments—to benefit human health and wellbeing, and increase biodiversity.
3.2 Strengthen regulations to protect canopy trees.
3.3 Encourage private landholders to protect and enhance the urban forest and expand greening activities by offering incentives for planting, installing and maintaining natural infrastructure.
- Action 4: Encourage collaboration between sectors and regions, to protect and expand the urban forest by strengthening existing regional partnerships, and establishing new ones, and by accelerating greening efforts on private land.
Although work is under way to protect and expand the urban forest across Melbourne, the fragmentation of these efforts within and between municipalities is one of the most significant barriers to reaching metropolitan Melbourne’s urban forest goals.
Several successful alliances and cross-organisational governance agreements already existed in different parts of Melbourne. The strategy advocated that these should be the starting point for building further collaborations and alliances for greening across the city. Local communities can help urban forest efforts by gathering and sharing important data, so that investment in the urban forest is targeted wisely. To obtain specific tree information, such as species and numbers, the strategy advocated the involvement of citizen scientists and drawing on Aboriginal ecological knowledge.
Action 4 comprised the following components:
4.1 Capitalise on existing collaborations between local and state governments and the private sector.
4.2 Mobilise broad community support.
4.3 Support and develop existing and new methods to obtain and apply community knowledge.
4.4 Foster and promote urban forest champions, in both the public and private sectors.
- Action 5: Equip practitioners to protect and enhance the urban forest by building on existing resources and creating a shared toolkit to facilitate implementation of best practices.
Helping practitioners identify, agree on and adopt best practice is central to the successful protection and expansion of our urban forest.
There is a growing list of open-source tools, resources and reference materials that practitioners can apply to their greening efforts, but new tools are needed. In particular, materials that will help involve the wider community and the land development industry, such as best practice guidelines and case studies; clear and agreed procedures to attract involvement by private and semi-public utility companies; and vegetation-management and associated technical training for staff of utility companies, to improve decision-making.
Managing, maintaining and expanding the urban forest requires significant capital and operational expenditure. The strategy recommended guidance on current and projected future costs to help all parties forecast future funding requirements more accurately, identify any unnecessary or unreasonable expenditures, and bring efficiencies in funding the urban forest.
Action 5 comprised the following components:
5.1 Build the capacity of public and private sector practitioners to protect, enhance and expand the urban forest.
5.2 Build on, and develop new tools for public sector land managers.
5.3 Build on, and develop new guidance materials for managing the capital and operational costs of urban forest endeavours.
- Action 6: Establish a set of funding and financing options to suit different types of urban forest action.
Estimates undertaken as part of developing this strategy, drawn from existing government and peer-reviewed sources, suggest that Melburnians already enjoy benefits from nature valued at close to AUD 5 billion dollars per annum from ecosystem services [38]. Reaching the canopy and broader vegetation targets set out in Action 2 will require an estimated investment of AUD 1 billion over the next 30 years, with the bulk of this investment to be made in the decade to 2030. A range of financing tools will be required to achieve the goals of the Living Melbourne strategy. These sources range in scale and complexity from conventional government budget appropriations and philanthropy to public-private partnerships, ecosystem service payments, performance-based incentives and hybrid instruments that feature a range of revenue streams.
Action 6 comprised the following components:
6.1 Identify and secure long-term financing to realise the Living Melbourne vision.
6.2 Investigate and establish a targeted grants program to support innovation and action for greener neighbourhoods.
5. Discussion
5.1. Key Processes and Enabling Conditions That Facilitated Success
The development of Living Melbourne was supported by a high degree of stakeholder engagement throughout the process and has been described “as an instance of metropolitan governance in action” [50,51,52]. Approximately 65 organisations and over 250 individuals made contributions to the strategy. The efforts to involve and secure senior executive and political (mayor, CEO and executive officer level) buy-in during the development of the Resilient Melbourne strategy greatly enhanced the ability for subsequent engagement in Living Melbourne, as did the early identification of the metropolitan urban forest as a priority action (Figure 2). This senior stakeholder engagement was critical to the success of Living Melbourne as it provided the staff of stakeholder organisations, in particular LGAs, with a mandate to fully engage in the co-design process. The transparent co-design process provided stakeholders with confidence that Living Melbourne reflected their views.
The scheduling of the development of Living Melbourne benefitted from substantial urban greening research, policy, strategy and on-ground activity across metropolitan Melbourne (e.g., [15,53,54]). Examples of this activity included:
- The City of Melbourne had developed a world-class urban forest strategy.
- Thirteen LGAs (including City of Melbourne) had already developed (or were developing) municipal urban forest strategies and other metropolitan LGAs had relevant urban greening and open space related policies or strategies.
- Greening the West had been working as an alliance of organisations working toward a common agenda and was in the process of planting one million trees.
- The State Government had released several strategic plans, including Plan Melbourne 2017–2050 [17] and Biodiversity 2037 [27] that supported cooling and greening metropolitan Melbourne.
- Melbourne Water was developing the Healthy Waterways Strategy 2018–2028 [55], a strategy shared by Melbourne Water, state and local governments, water corporations and the community. It covers the rivers, creeks, estuaries and wetlands of the Port Phillip and Westernport region, providing a single framework to protect and improve the waterways’ environmental, social, economic and cultural values for the community.
- The Nature Conservancy had recently scoped the potential for a city-wide biodiversity strategy for Melbourne.
5.2. Challenges, Limitations and Critical Areas to Build on for Implementing the Strategy
Living Melbourne is largely positioned to support, expand and extend existing urban greening initiatives and provide enabling conditions to encourage better urban greening outcomes. As with any planning and strategy development process, there were time and resource constraints in which it was completed. There are five key areas where, had additional time and resources allowed, knowledge gaps might have been filled, allowing for an even richer and more directive strategy. They are each identified below.
- A critical element of the strategy included the science associated with the vegetation mapping and the resultant use of the vegetation mapping in urban heat island analysis and models for some elements of biodiversity. Although it was considered that the input data to create the vegetation were of good quality and that there was a high level of accuracy, the large geographic area of metropolitan Melbourne meant that there were variations in the dates and times of the satellite imagery and LiDAR datasets, and the DTM and DSM resolution. Additional technical analysis would have enhanced the strategy, although these remain areas that could be readily undertaken using the base vegetation mapping.Most municipalities have biodiversity-related policy, strategy and or detailed plans. A granular analysis of a larger suite of metropolitan biodiversity values and threats, using available local government biodiversity-related strategy and existing Victorian Government datasets, could have provided more detailed direction for biodiversity benefits and habitat connectivity opportunities. Acknowledging the continuing need for this activity, Action 1 in the strategy provides a step-by-step approach for improving biodiversity and connectivity.The Living Melbourne canopy analysis, undertaken using the software eCognition Essentials (Trimble Geospatial), provided tenure-neutral canopy mapping of 639,124 hectares of urban, peri-urban and rural land across the Melbourne metropolitan area. While the canopy mapping identified vegetation distribution and height, future analysis that could better differentiate different tree types (e.g., deciduous, eucalyptus, broadleaf trees, etc.) would be useful for finer scale conservation planning and assist the further prioritisation of on-ground urban greening locations.Sixteen local government street and park tree inventories were gathered during the development of the strategy and were most helpful to inform some research related to the financial value of such assets. These inventories could also be used to inform biodiversity connectivity mapping and identify where opportunities exist to provide good heat mitigation walking-corridors. In addition, such inventories, combined with the values available from the multi-spectral satellite imagery and canopy mapping might assist to validate remote species identification.
- Collaboration was sought with land managers (including urban development industry representatives) and policy makers and not directly with the general public. It was agreed by the Senior Reference Group that LGAs, being the closest tier of government to the community should be relied upon to engage with relevant community stakeholders about Living Melbourne. Had significantly greater resources been available, direct community engagement at some level could have been advantageous. It should be acknowledged as part of the ongoing implementation of the strategy that public land management practitioners, in particular LGAs, will continue to closely engage with the public.
- LGAs as key stakeholders and other major land management organisations (e.g., water authorities and public land managers) were specifically targeted as key endorsers as a subset of the wider consultation undertaken. Suggestions by some academic commentators [51,52] that the views of other key stakeholders (e.g., transport, health) were not sought is erroneous.
- The rationale for the targets proposed in Living Melbourne is articulated above. An alternative target strategy would have been for all regions to reach 30% canopy by 2050 rather than the range of targets that were offered. This would have lent an increased element of regional equity for residents to benefit from ambitious canopy targets. It would also have required a much more aggressive canopy enhancement approach for some regions each decade. Most notably the Western Region, and to a lesser extent the Northern and Inner Regions, would have had to have increased canopy beyond the 5 percent increase per decade. It is uncertain whether this would be achievable.
- Endorsing authorities were asked to support Living Melbourne’s vision, goals and actions and commit to work in partnership with the other endorsing organisations towards its implementation. More could have been requested of endorsing organisations, such as a specific commitment of financial and other resources.
5.3. Implementation Post Strategy Development
In 2020, Resilient Melbourne’s remit changed from metropolitan Melbourne to the City of Melbourne and has transitioned into the Climate Change and City Resilience Branch. Given this change, one of the key challenges for Living Melbourne will be to secure a new and innovative governance model to drive implementation of the strategy. To this end, a new governance model to implement the strategy is currently evolving which seeks to include and empower critical endorsing organisations and a broader stakeholder group.
In 2019, a discussion paper was developed by The Nature Conservancy in collaboration with Resilient Melbourne and the Victorian Government to provide a targeted evaluation of ways to fund urban forest investments in Living Melbourne. The paper is one evidence base for structuring funding and financing of Living Melbourne urban forest investments with investors.
At the time of the launch of Living Melbourne, Victoria’s Department of Environment, Land, Water and Planning recognised, through Plan Melbourne 2017–2050 [17] the need to create urban forests throughout metropolitan Melbourne by preparing new guidelines and regulations that support greening new subdivisions and developments via landscaping, green roofs, and increase the percentage of permeable site areas in developments.
In February 2020, following a stakeholder workshop in September 2019 and further feedback and consultation, 26 projects were agreed to take Living Melbourne forward over a three year period. As of July 2021, besides the two projects mentioned above, three additional projects have been completed and a further seven projects are being progressed, led by endorsing organisations or implementation partners and assisted by a range of stakeholders. The three projects completed under the umbrella of Living Melbourne include: (1) Greener Spaces Better Places led the development of the Urban Greeners’ Resource Hub, a curated on-line collection of best practice tools, guides, resources and case studies to help urban greening professionals protect and enhance Australia’s urban forests and green cover in towns and cities; (2) Living Melbourne, in association with Resilient Melbourne, provided a written submission to the Victorian Planning Authority regarding the alignment between the draft Guidelines for Precinct Structure Planning in Melbourne’s Greenfields [56] and the vision, goals and action Living Melbourne; and (3) Melbourne Water completed modelling of Melbourne’s greening and cooling irrigation demand out to 2070 under different climate scenarios.
6. Conclusions
Urban forests help mitigate the damage caused by several types of acute shocks and chronic stresses. Protecting and improving urban forests is an opportunity to unlock the economic, health and social dividends that strengthen the ability for cities to thrive. The development of a metropolitan-wide urban forest strategy for Melbourne was the first for Australia and one of the first at this scale globally. It is unlike many urban forest plans in that it is an enabling strategy rather than a strategy focussed on directing geospatial urban greening activity. Living Melbourne provides some of the evidence that could influence on-ground activity, for example urban heat island data modelled against canopy cover and vulnerable communities. However, it focuses on both identifying and recommending action to a range of themes that would significantly improve conditions for urban greening. This includes elements such as removing or amending regulatory barriers, increasing and consolidating existing tools and resources and, enhancing existing positive and successful initiatives. Being one of the first of its kind, it should be considered both a first step in expanding metropolitan Melbourne’s urban forest, as well as playing an important role in encouraging the take up of urban forestry practice in many cities around the world. The lessons here (both key areas of success and challenges experienced) add to the growing body of literature on the characteristics and design of urban forest strategies and city resilience more broadly (e.g., [12,57,58]).
Author Contributions
Conceptualization, M.H., J.F., M.G., T.K.; methodology, M.H., J.F., M.G., T.K.; writing-original draft preparation, M.H., J.F., M.G., T.K.; writing-review and editing, M.H., J.F., M.G., T.K. All authors have read and agreed to the published version of the manuscript.
Funding
This research received no external funding.
Data Availability Statement
The new data were created in this study are available on request.
Acknowledgments
Living Melbourne was developed in collaboration with 32 local government authorities, Victorian State Government departments and agencies, non-government not-for-profit and private sector organisations and industry groups. Their buy-in and willingness to collectively co-design the strategy was critical to its development. Amy Hahs and Morphum Environmental Pty Ltd. undertook the majority of the canopy mapping. Hahs was also responsible for the detailed statistical analysis of the vegetation model against various climatic and socio-demographic variables and the detailed statistical analysis of the urban heat island mapping. We thank 100RC colleagues Sam Kernaghan and Henri Blas and The Nature Conservancy’s Rob McDonald, Rich Gilmore, Bob Moseley, Nate Peterson, Tim Boucher and Rebecca Keen for their contributions to Living Melbourne. Comments on earlier drafts from Hugh Possingham, Megan Good, Justine Hausheer and three anonymous referees improved the manuscript.
Conflicts of Interest
The authors declare no conflict of interest.
References
- Oke, C.; Bekessy, S.A.; Frantzeskaki, N.; Bush, J.; Fitzsimons, J.A.; Garrard, G.E.; Grenfell, M.; Harrison, L.; Hartigan, M.; Callow, D.; et al. Cities should respond to the biodiversity extinction crisis. NPJ Urban Sustain. 2021, 1, 11. [Google Scholar] [CrossRef]
- McDonald, R.; Kroeger, T.; Boucher, T.; Longzhu, W.; Salem, R.; Adams, J.; Bassett, S.; Edgecomb, M.; Garg, S. Planting Healthy Air: A Global Analysis of the Role of Urban Trees in Addressing Particulate Matter Pollution and Extreme Heat; The Nature Conservancy: Arlington, VA, USA, 2016. [Google Scholar]
- Threlfall, C.G.; Mata, L.; Mackie, J.A.; Hahs, A.K.; Stork, N.E.; Williams, N.S.; Livesley, S.J. Increasing biodiversity in urban green spaces through simple vegetation intervention. J. Appl. Ecol. 2017, 54, 1874–1883. [Google Scholar] [CrossRef] [Green Version]
- Shanahan, D.F.; Fuller, R.A.; Bush, R.; Lin, B.B.; Gaston, K.J. The health benefits of urban nature: How much do we need? BioScience 2015, 65, 476–485. [Google Scholar] [CrossRef] [Green Version]
- Díaz, S.; Pascual, U.; Stenseke, M.; Martín-López, B.; Watson, R.T.; Molnár, Z.; Hill, R.; Chan, K.M.A.; Baste, I.A.; Brauman, K.A.; et al. Assessing nature’s contributions to people. Science 2018, 359, 270–272. [Google Scholar] [CrossRef] [Green Version]
- Mumaw, L.; Bekessy, S. Wildlife gardening for collaborative public–private biodiversity conservation. Austral. J. Environ. Manag. 2017, 24, 242–260. [Google Scholar] [CrossRef]
- United Nations. Revision of the World Urbanization Prospects: 2018; United Nations Department of Economic and Social Affairs: New York, NY, USA, 2018. [Google Scholar]
- Jim, C.Y.; Konijnendijk van den Bosch, C.; Chen, W.Y. Acute challenges and solutions for urban forestry in compact and densifying cities. J. Urban Plann. Dev. 2018, 144, 04018025. [Google Scholar] [CrossRef]
- Haaland, C.; Konijnendijkvan den Bosch, C. Challenges and strategies for urban green-space planning in cities undergoing densification: A review. Urban For. Urban Green. 2015, 14, 760–771. [Google Scholar] [CrossRef]
- Saunders, A.; Duncan, J.; Hurley, J.; Amati, M.; Caccetta, P.; Chia, J.; Boruff, B. Leaf my neighbourhood alone! Predicting the influence of densification on residential tree canopy cover in Perth. Landsc. Urban Plan. 2020, 199, 103804. [Google Scholar] [CrossRef]
- Ordóñez, C.; Threlfall, C.G.; Livesley, S.J.; Kendal, D.; Fuller, R.A.; Davern, M.; van der Ree, R.; Hochuli, D.F. Decision-making of municipal urban forest managers through the lens of governance. Environ. Sci. Pol. 2020, 104, 136–147. [Google Scholar] [CrossRef]
- Ordóñez, C.; Duinker, P. An analysis of urban forest management plans in Canada; Implications for urban forest management. Landsc. Urban Plan. 2013, 116, 36–47. [Google Scholar] [CrossRef] [Green Version]
- Hinch, R.; Maxwell, E.; Chen, N. A Summary of Current Urban Forest Plans and Metrics; The Nature Conservancy: Arlington, VA, USA, 2018. [Google Scholar]
- ABS. 3105.0.65.001-Australian Historical Population Statistics, 2016; Australian Bureau of Statistics, Commonwealth of Australia: Canberra, Australia, 2019. Available online: https://www.abs.gov.au/AUSSTATS/abs@.nsf/mf/3105.0.65.001 (accessed on 31 October 2020).
- Phelan, K.; Hurley, J.; Bush, J. Land-use planning’s role in urban forest strategies: Recent local government approaches in Australia. Urban Pol. Res. 2019, 37, 215–226. [Google Scholar] [CrossRef]
- Infrastructure Victoria. Growing Victoria’s Potential: The Opportunities and Challenges of Victoria’s Population Growth; Infrastructure Victoria: Melbourne, Australia, 2019. [Google Scholar]
- DELWP. Plan Melbourne 2017–2050; Victorian State Government: Melbourne, Australia, 2017. [Google Scholar]
- Heneghan, L.; Mulvaney, C.; Ross, K.; Umek, L.; Watkins, C.; Westphal, L.M.; Wise, D.H. Lessons learned from Chicago Wilderness—Implementing and sustaining conservation management in an urban setting. Diversity 2012, 4, 74–93. [Google Scholar] [CrossRef] [Green Version]
- VEAC. Metropolitan Melbourne Investigation Final Report; Victorian Environmental Assessment Council: Melbourne, Australia, 2011. [Google Scholar]
- Wahlquist, C. Melbourne ‘World’s Most Liveable City’ for Seventh Year Running. The Guardian. 6 August 2017. Available online: https://www.theguardian.com/australia-news/2017/aug/16/melbourne-worlds-most-liveable-city-for-seventh-year-running (accessed on 31 October 2020).
- Destination Melbourne. Greater Melbourne’s Destination Management Visitor Plan: Executive Summary; Destination Melbourne: Melbourne, Australia, 2018. [Google Scholar]
- Hahs, A.; McDonnell, M.; Holland, K.; Caryl, F. Biodiversity of Metropolitan Melbourne; Prepared for Victorian Environmental Assessment Council by Australian Research Centre for Urban Ecology; Royal Botanic Gardens: Melbourne, Australia, 2009. Available online: https://veac.vic.gov.au/investigations-assessments/previous-investigations/document/getDownload?fid=MjAx (accessed on 31 October 2020).
- Moore, G.M. Taking It to the Streets: Celebrating a Twenty Year History of Treenet—Responding to the Urban Forest Challenge. In Proceedings of the Treenet: 18th National Street Tree Symposium, Adelaide, Australia, 7–8 September 2017; Available online: https://treenet.org/wp-content/uploads/2017/10/Taking-it-to-the-Streets-Responding-to-the-Urban-Forest-Challenge_GM-Moore.pdf (accessed on 31 October 2020).
- Hurley, J.; Saunders, A.; Both, A.; Sun, C.; Boruff, B.; Duncan, J.; Amati, M.; Caccetta, P.; Chia, J. Urban Vegetation Cover Change in Melbourne 2014–2018; Centre for Urban Research, RMIT University: Melbourne, Australia, 2019. [Google Scholar]
- Municipal Association of Victoria. 2019. Available online: http://www.mav.asn.au/ (accessed on 11 December 2019).
- DELWP. Victoria’s Climate Change Adaptation Plan 2017–2020; Victorian Government: Melbourne, Australia, 2016. [Google Scholar]
- DELWP. Protecting Victoria’s Environment: Biodiversity 2037; Victorian State Government: Melbourne, Australia, 2017. [Google Scholar]
- Victorian Government. Victorian Public Health and Wellbeing Plan 2015–2019; Victorian Government: Melbourne, Australia, 2015. [Google Scholar]
- DELWP. Melbourne Open Space Strategy: Ensuring Liveability for Future Generations. Draft for Comment September 2019; Victoria State Government: Melbourne, Australia, 2019. [Google Scholar]
- Greening the West. About Greening the West. Available online: https://greeningthewest.org.au/about/ (accessed on 12 December 2019).
- Zebrowski, C. Acting local, thinking global: Globalizing resilience through 100 Resilient Cities. New Perspect. 2020, 28, 71–88. [Google Scholar] [CrossRef]
- Resilient Melbourne. Resilient Melbourne Strategy; City of Melbourne: Melbourne, Australia, 2016. [Google Scholar]
- McDonald, R.I.; Colbert, M.; Hamann, M.; Simkin, R.; Walsh, B. Nature in the Urban Century: A Global Assessment of Where and How to Conserve Nature for Biodiversity and Human Wellbeing; The Nature Conservancy: Arlington, VA, USA, 2018; Available online: https://www.nature.org/content/dam/tnc/nature/en/documents/TNC_NatureintheUrbanCentury_FullReport.pdf (accessed on 29 September 2020).
- McDonald, R.I.; Mansur, A.V.; Ascensão, F.; Colbert, M.; Crossman, K.; Elmqvist, T.; Gonzalez, A.; Güneralp, B.; Haase, D.; Hamann, M.; et al. Research gaps in knowledge of the impact of urban growth on biodiversity. Nat. Sustain. 2020, 3, 16–24. [Google Scholar] [CrossRef]
- The Nature Conservancy and Resilient Melbourne. Living Melbourne: Our Metropolitan Urban Forest; The Nature Conservancy and Resilient Melbourne: Melbourne, Australia, 2019. [Google Scholar]
- Yan, J.; Zhou, W.; Han, L.; Qian, Y. Mapping vegetation functional types in urban areas with WorldView-2 imagery: Integrating object-based classification with phenology. Urban For. Urban Green. 2018, 31, 230–240. [Google Scholar] [CrossRef]
- City of Melbourne. Urban Forest Strategy: Making a Great City Greener: 2012–2032; City of Melbourne: Melbourne, Australia, 2012. [Google Scholar]
- The Nature Conservancy and Resilient Melbourne. Living Melbourne: Our Metropolitan Urban Forest Technical Report; The Nature Conservancy and Resilient Melbourne: Melbourne, Australia, 2019. [Google Scholar]
- Crooks, K.; Sanjayan, M. Connectivity Conservation; Cambridge University Press: New York, NY, USA, 2006. [Google Scholar]
- Palmer, G.C.; Fitzsimons, J.A.; Antos, M.J.; White, J.G. Determinants of native avian richness in suburban remnant vegetation: Implications for conservation planning. Biol. Conserv. 2008, 141, 2329–2341. [Google Scholar] [CrossRef] [Green Version]
- White, J.G.; Antos, M.J.; Fitzsimons, J.A.; Palmer, G.C. Non-uniform bird assemblages in urban environments: The influence of streetscape vegetation. Lands. Urban Plan. 2005, 71, 123–135. [Google Scholar] [CrossRef]
- Callaghan, C.T.; Major, R.E.; Lyons, M.B.; Martin, J.M.; Kingsford, R.T. The effects of local and landscape habitat attributes on bird diversity in urban greenspaces. Ecosphere 2018, 9, e02347. [Google Scholar] [CrossRef] [Green Version]
- Champness, B.S.; Palmer, G.C.; Fitzsimons, J.A. Bringing the city to the country: Relationships between streetscape vegetation type and bird assemblages in a major regional centre. J. Urban Ecol. 2019, 5, juz018. [Google Scholar] [CrossRef]
- Fraixedas, S.; Lindén, A.; Piha, M.; Cabeza, M.; Gregory, R.; Lehikoinen, A. A state-of-the-art review on birds as indicators of biodiversity: Advances, challenges, and future directions. Ecol. Indic. 2020, 118, 106728. [Google Scholar] [CrossRef]
- Fitzsimons, J.A.; Antos, M.J.; Palmer, G.C. When more is less: Urban remnants support high bird abundance but diversity varies. Pac. Conserv. Biol. 2011, 17, 97–109. [Google Scholar] [CrossRef] [Green Version]
- Coutts, A.M.; Tapper, N.J.; Beringer, J.; Loughnan, M.; Demuzere, M. Watering our cities: The capacity for water sensitive urban design to support urban cooling and improve human thermal comfort in the Australian context. Prog. Phys. Geogr. Earth Environ. 2012, 37, 2–28. [Google Scholar] [CrossRef]
- Tapper, N.; Loughnan, M.; Nicholls, N. Towards management of urban heat stress in urban environments: Recent developments in Melbourne, Victoria. Emerg. Med. Australas. 2010, 22, A11–A12. [Google Scholar]
- DELWP. Melbourne Vegetation and Land Use Cover 2014; Department of Environment, Land, Water and Planning: Melbourne, Australia, 2018. Available online: https://services.land.vic.gov.au/SpatialDatamart/index.jsp (accessed on 12 December 2020).
- Leahy, I. Why We No Longer Recommend a 40 Percent Urban Tree Canopy Goal. Loose Leaf: The Official Blog of American Forests. 2017. Available online: https://www.americanforests.org/blog/no-longer-recommend-40-percent-urban-tree-canopy-goal/ (accessed on 26 September 2018).
- Coenen, L.; Davidson, K.; Frantzeskaki, N.; Grenfell, M.; Håkansson, I.; Hartigan, M. Metropolitan governance in action? Learning from metropolitan Melbourne’s urban forest strategy. Aust. Plan. 2020, 56, 144–148. [Google Scholar] [CrossRef]
- Bush, J.; Coffey, B.; Fastenrath, S. Governing urban greening at a metropolitan scale: An analysis of the Living Melbourne strategy. Aust. Plan. 2020, 56, 95–102. [Google Scholar] [CrossRef]
- Fastenrath, S.; Bush, J.; Coenen, L. Scaling-up nature-based solutions. Lessons from the Living Melbourne strategy. Geoforum 2020, 116, 63–72. [Google Scholar] [CrossRef]
- Dobbs, C.; Kendal, D.; Nitschke, C. The effects of land tenure and land use on the urban forest structure and composition of Melbourne. Urban For. Urban Green. 2013, 12, 417–425. [Google Scholar] [CrossRef]
- Gulsrud, N.M.; Hertzog, K.; Shears, I. Innovative urban forestry governance in Melbourne?: Investigating “green placemaking” as a nature-based solution. Environ. Res. 2018, 161, 158–167. [Google Scholar] [CrossRef]
- Melbourne Water. Healthy Waterways Strategy 2018–2028; Melbourne Water: Melbourne, Australia, 2018. [Google Scholar]
- VPA. Guidelines for Precinct Structure Planning in Melbourne’s Greenfields: Draft for Public Engagement September 2020; Victorian Planning Authority: Melbourne, Australia, 2020. [Google Scholar]
- Ostoić, S.K.; Salbitano, F.; Borelli, S.; Verlič, A. Urban forest research in the Mediterranean: A systematic review. Urban Forest. Urban Green. 2018, 31, 185–196. [Google Scholar] [CrossRef]
- Fastenrath, S.; Coenen, L.; Davidson, K. Urban resilience in action: The Resilient Melbourne Strategy as transformative urban innovation policy? Sustainability 2019, 11, 693. [Google Scholar] [CrossRef] [Green Version]


Publisher’s Note: MDPI stays neutral with regard to jurisdictional claims in published maps and institutional affiliations. |
© 2021 by the authors. Licensee MDPI, Basel, Switzerland. This article is an open access article distributed under the terms and conditions of the Creative Commons Attribution (CC BY) license (https://creativecommons.org/licenses/by/4.0/).