
Tracking Deformation Processes at the Legnica Glogow Copper District (Poland) by Satellite InSAR—I: Room and Pillar Mine District

 ,
, 
 and
and 
Abstract
1. Introduction
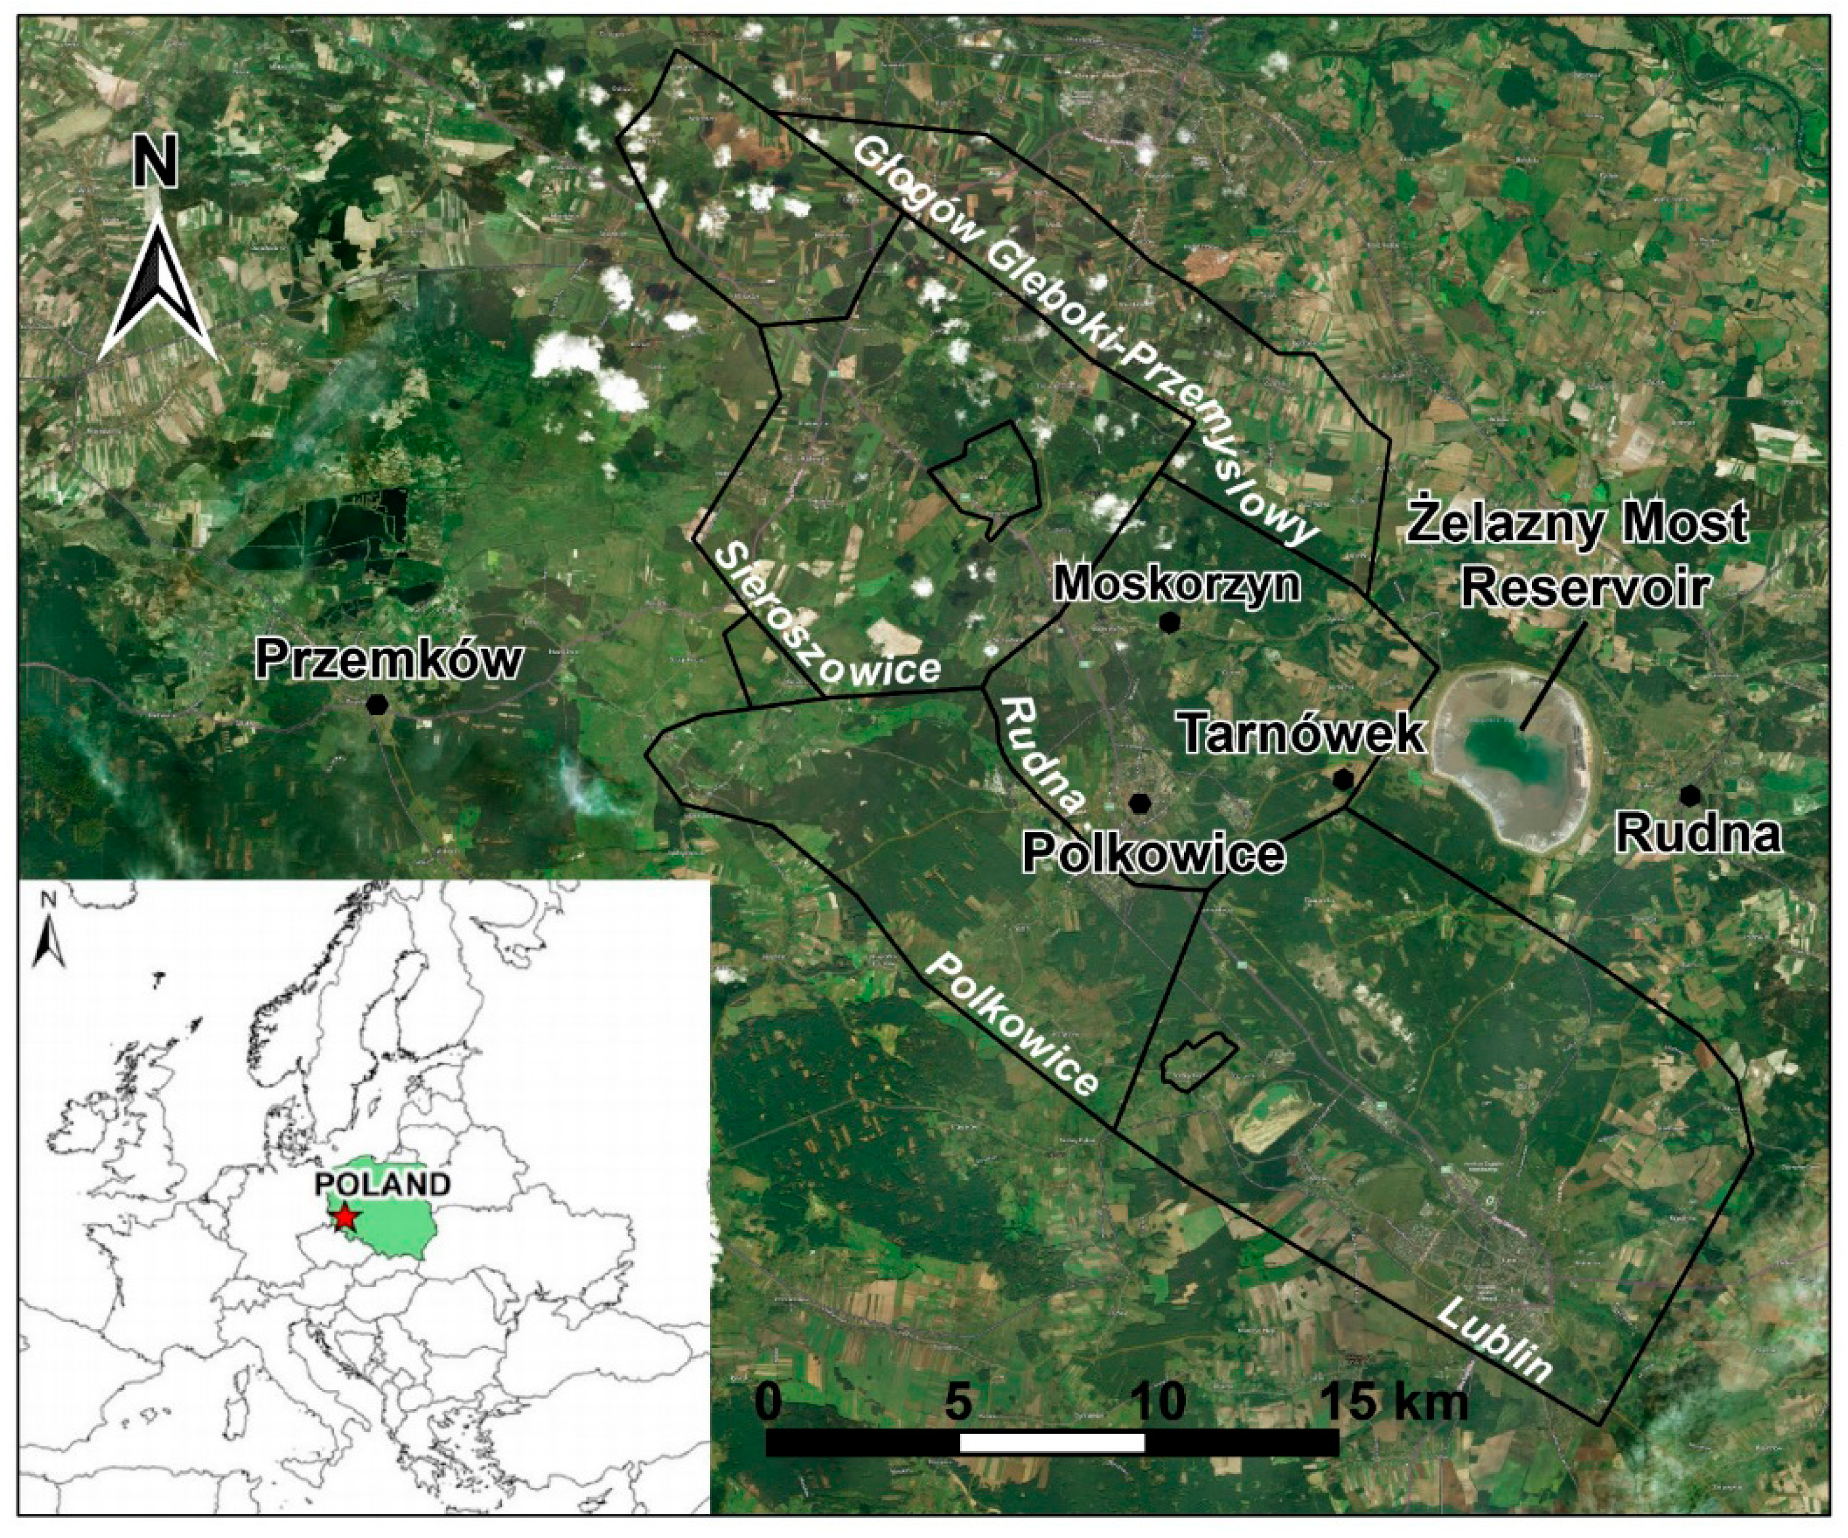
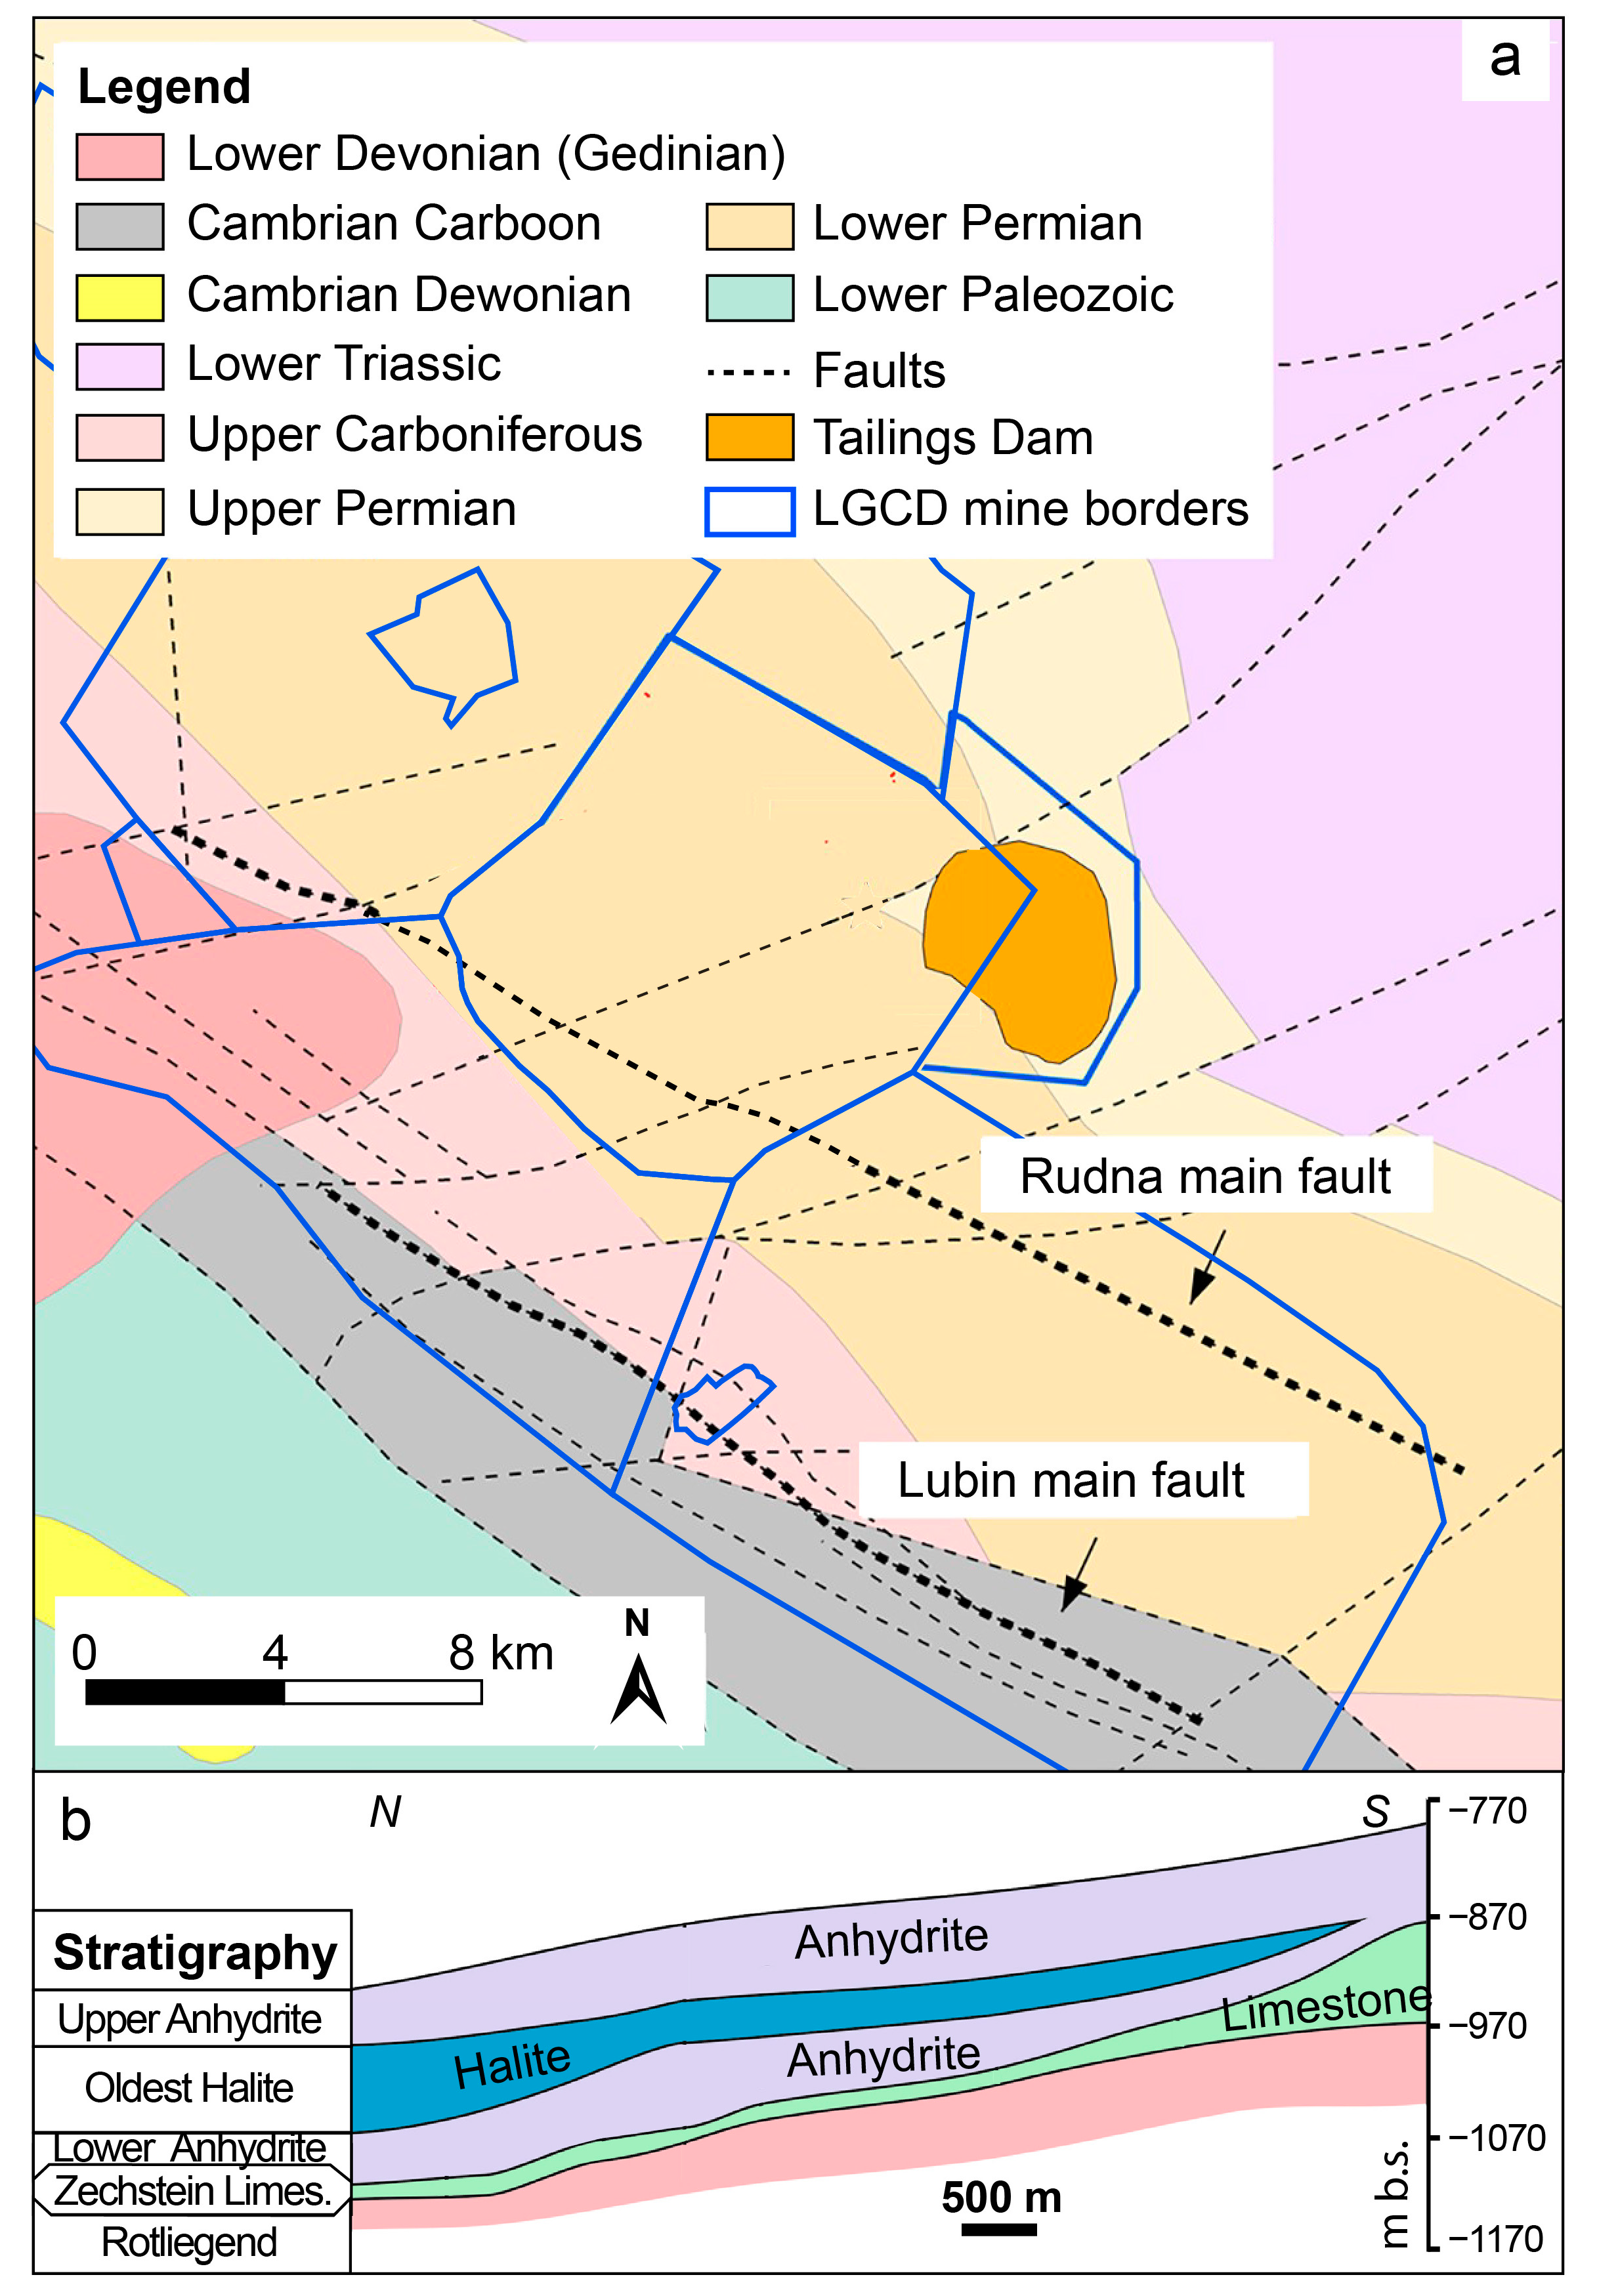
Geological Setting
2. Materials and Methods
2.1. Multi-Temporal DInSAR Analysis
2.2. Advanced DInSAR Analyses (A-DInSAR)
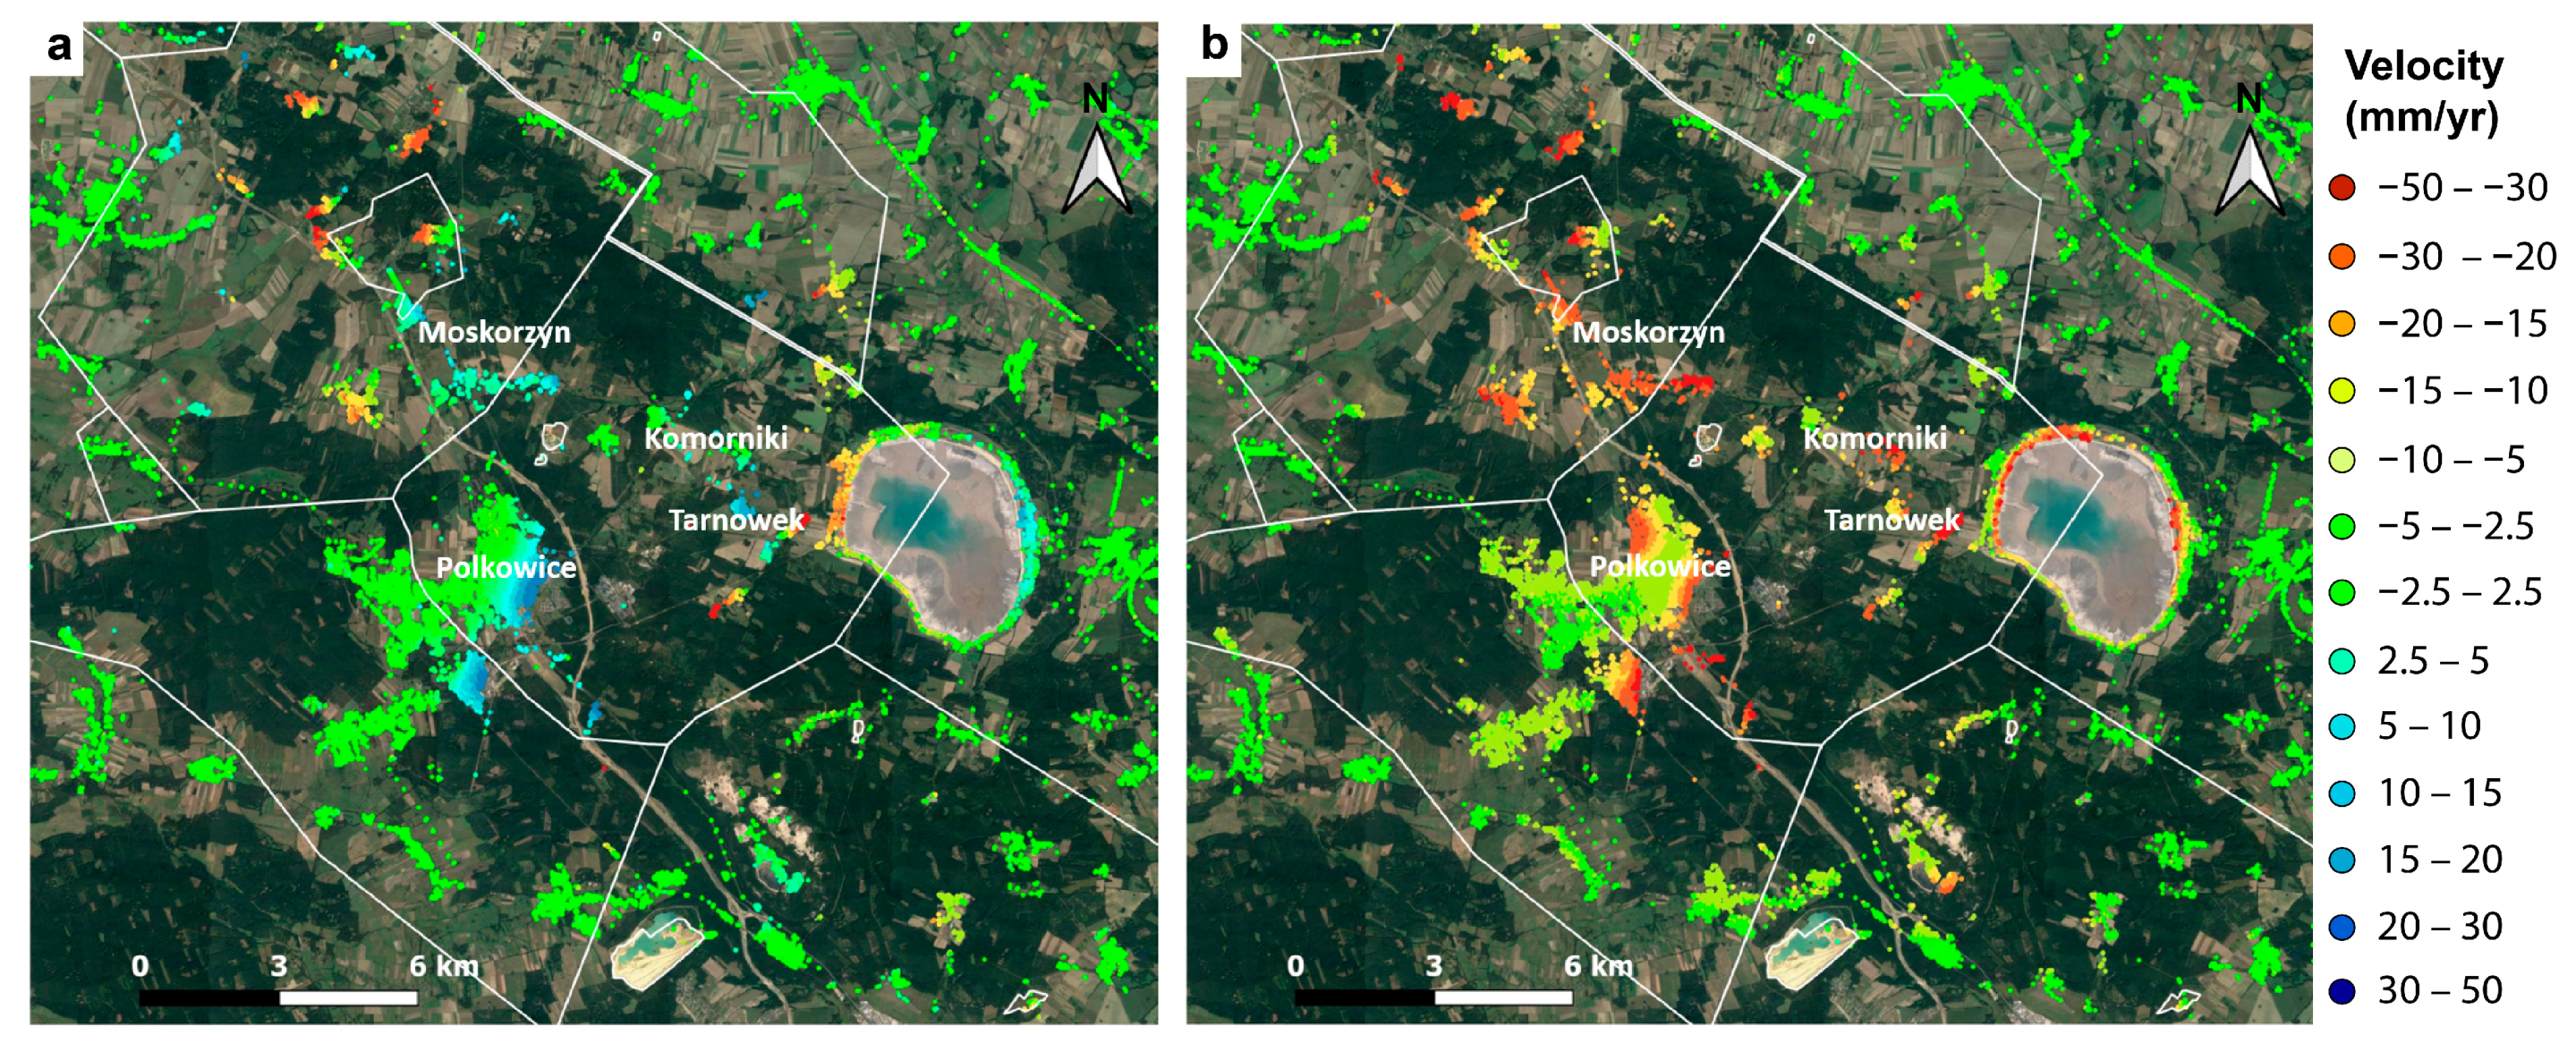
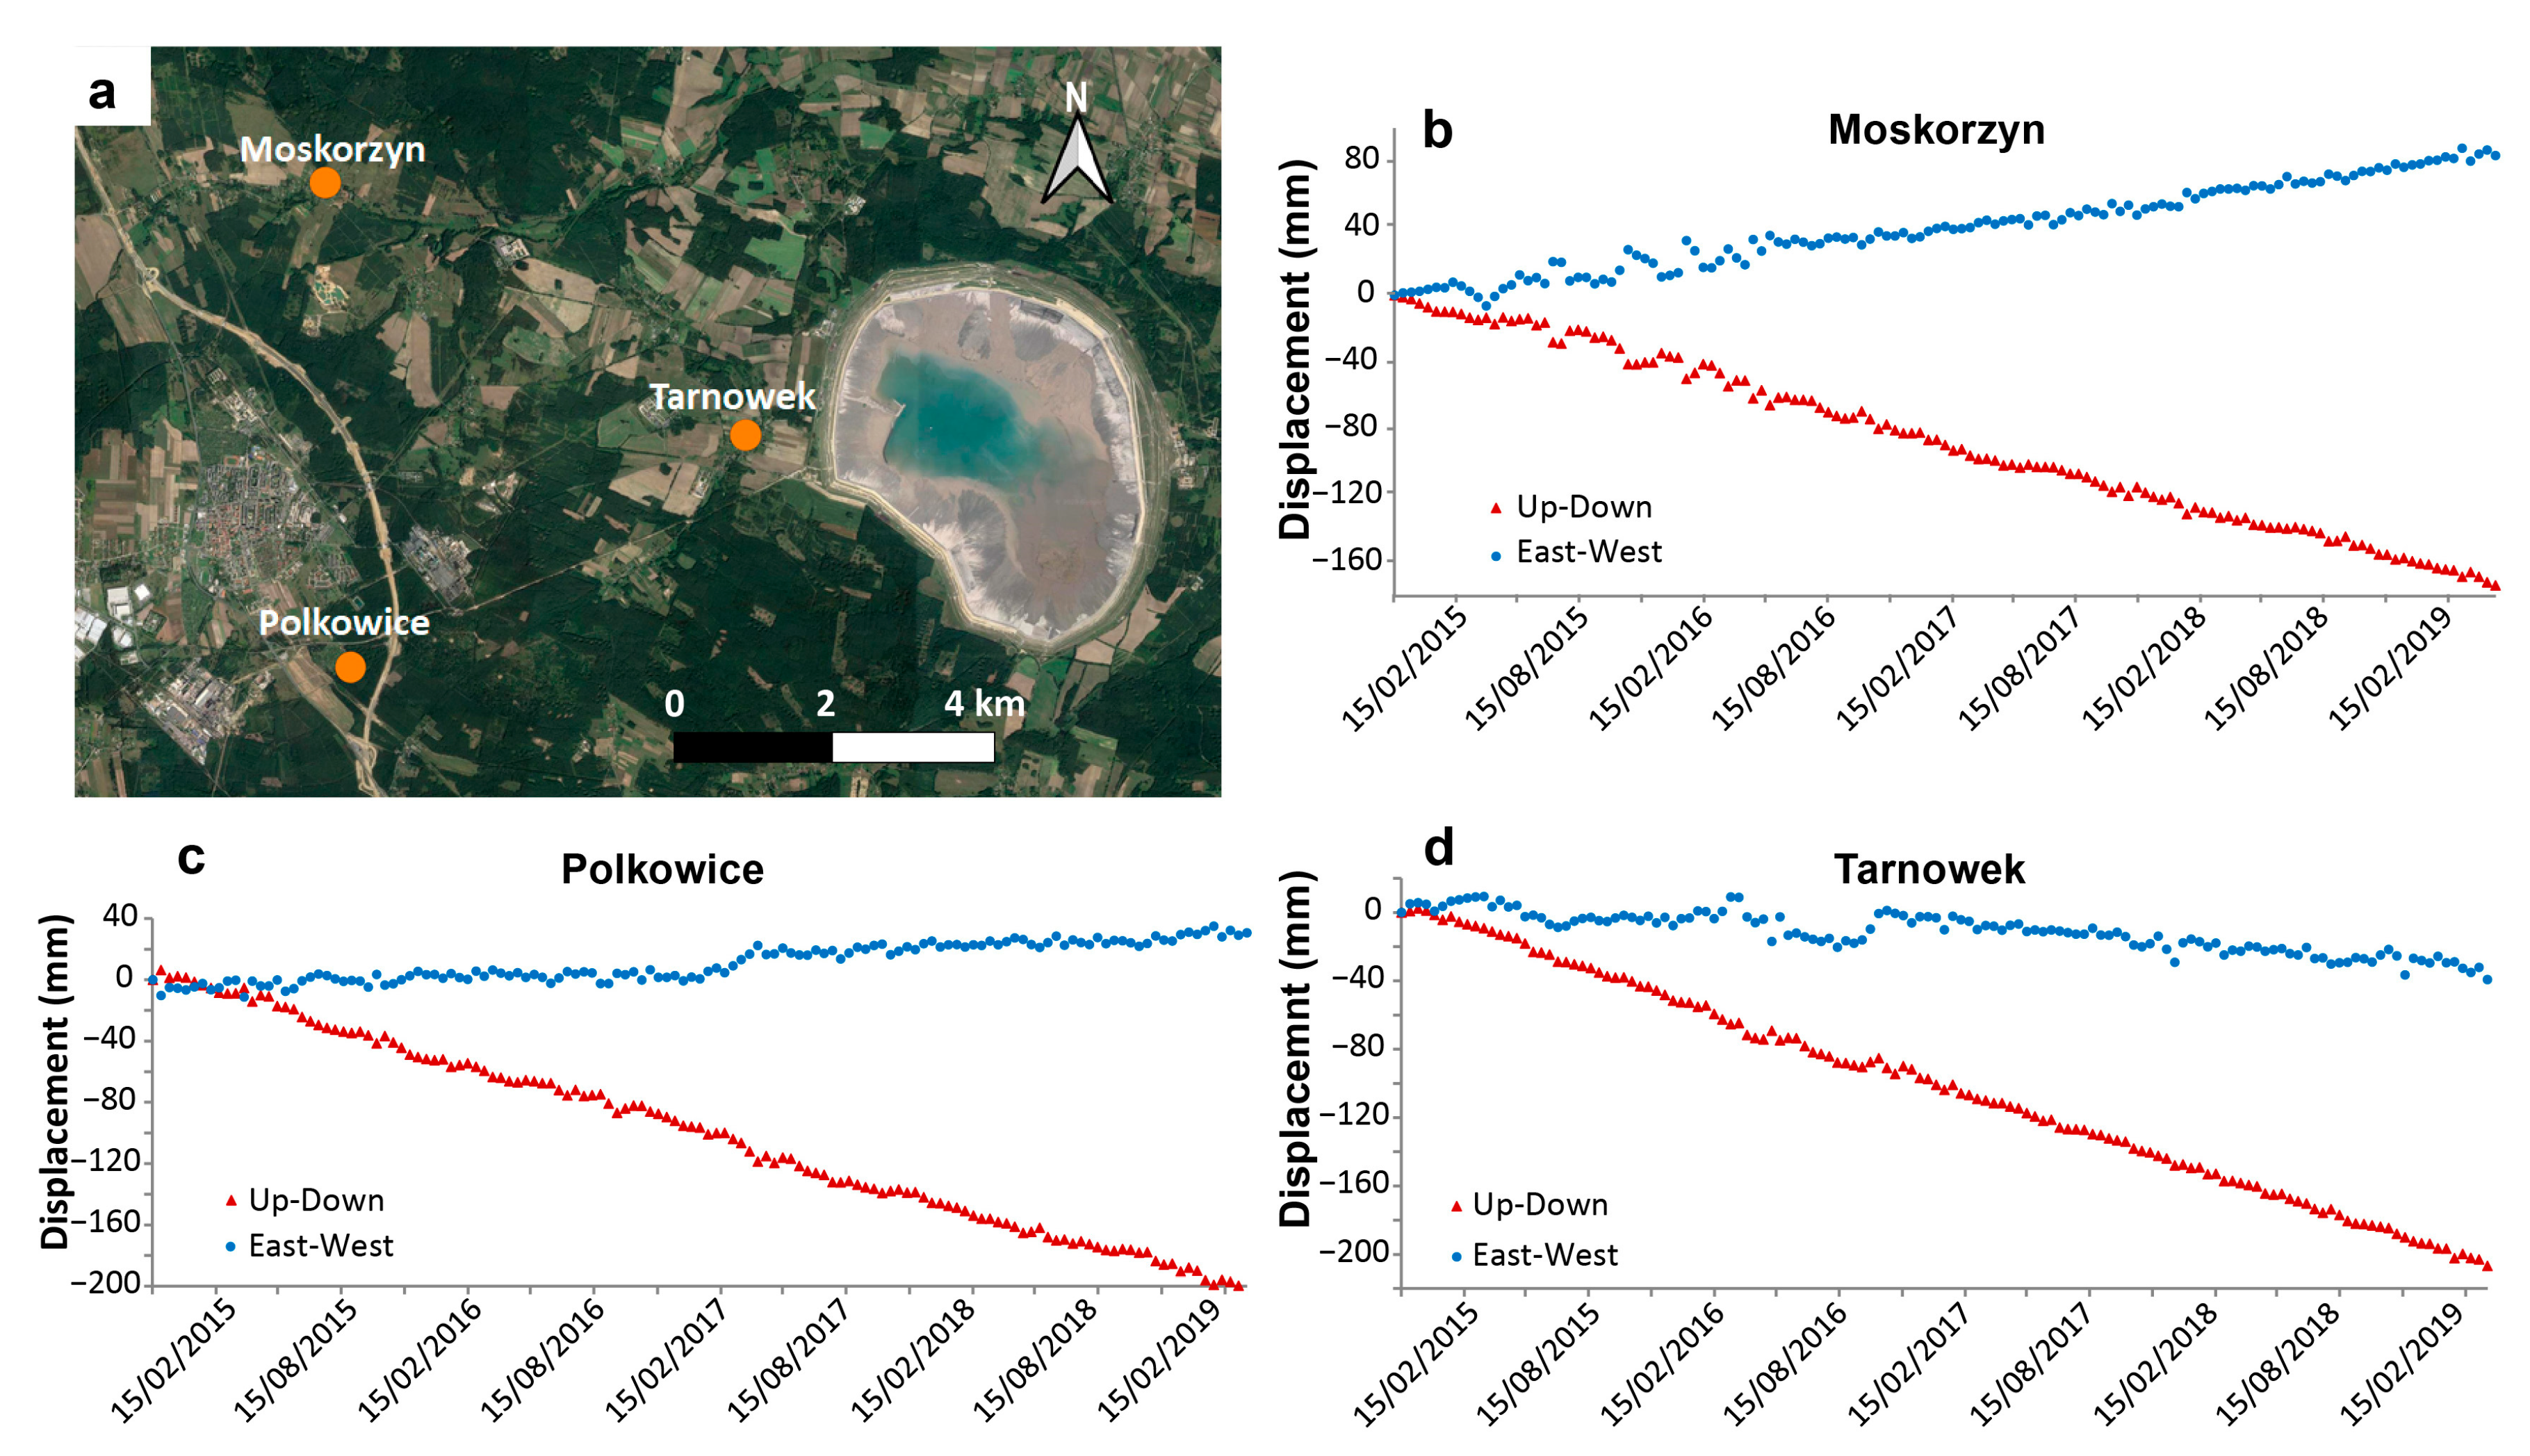
3. Results
4. Discussion
5. Conclusions
Author Contributions
Funding
Institutional Review Board Statement
Informed Consent Statement
Data Availability Statement
Conflicts of Interest
References
- Jung, H.C.; Kim, S.W.; Jung, H.S.; Min, K.D.; Won, J.S. Satellite observation of coal mining subsidence by persistent scatterer analysis. Eng. Geol. 2007, 92, 1–13. [Google Scholar] [CrossRef]
- Ge, L.; Chang, H.C.; Rizos, C. Mine subsidence monitoring using multi-source satellite SAR images. Photogramm. Eng. Remote Sens. 2007, 73, 259–266. [Google Scholar] [CrossRef]
- Pawluszek-Filipiak, K.; Borkowski, A. Integration of DInSAR and SBAS techniques to determine mining-related deformations using Sentinel-1 data: The case study of rydultowy mine in Poland. Remote Sens. 2020, 12, 242. [Google Scholar] [CrossRef]
- Liu, Z.G.; Bian, Z.F.; Lei, S.G.; Liu, D.L.; Sowter, A. Evaluation of PS-DInSAR technology for subsidence monitoring caused by repeated mining in mountainous area. Trans. Nonferrous Met. Soc. China 2014, 24, 3309–3315. [Google Scholar] [CrossRef]
- Przylucka, M.; Herrera, G.; Graniczny, M.; Colombo, D.; Béjar-Pizarro, M. Combination of conventional and advanced DInSAR to monitor very fast mining subsidence with TerraSAR-X data: Bytom City (Poland). Remote Sens. 2015, 7, 5300–5328. [Google Scholar] [CrossRef]
- Ng, A.H.-M.; Ge, L.; Du, Z.; Wang, S.; Ma, C. Satellite radar interferometry for monitoring subsidence induced by longwall mining activity using Radarsat-2, Sentinel-1 and ALOS-2 data. Int. J. Appl. Earth Obs. Geoinf. 2017, 61, 92–103. [Google Scholar] [CrossRef]
- Du, Z.; Ge, L.; Li, X.; Ng, A.H.M. Subsidence monitoring in the Ordos basin using integrated SAR differential and time-series interferometry techniques. Remote Sens. Lett. 2016, 7, 180–189. [Google Scholar] [CrossRef]
- Krawczyk, A.; Grzybek, R. An evaluation of processing InSAR Sentinel-1A/B data for correlation of mining subsidence with mining induced tremors in the Upper Silesian Coal Basin (Poland). E3S Web Conf. 2018, 26, 1–5. [Google Scholar] [CrossRef]
- Milillo, P.; Bürgmann, R.; Lundgren, P.; Salzer, J.; Perissin, D.; Fielding, E.; Biondi, F.; Milillo, G. Space geodetic monitoring of engineered structures: The ongoing destabilization of the Mosul dam, Iraq. Sci. Rep. 2016, 6, 1–7. [Google Scholar] [CrossRef] [PubMed]
- Lumbroso, D.; McElroy, C.; Goff, C.; Collell, M.R.; Petkovsek, G.; Wetton, M. The potential to reduce the risks posed by tailings dams using satellite-based information. Int. J. Disaster Risk Reduct. 2019, 38, 101209. [Google Scholar] [CrossRef]
- Du, Z.; Ge, L.; Ng, A.H.M.; Zhu, Q.; Horgan, F.G.; Zhang, Q. Risk assessment for tailings dams in Brumadinho of Brazil using InSAR time series approach. Sci. Total Environ. 2020, 717, 137125. [Google Scholar] [CrossRef]
- Moise, C.; Negula, I.D.; Mihalache, C.E.; Lazar, A.M.; Dedulescu, A.L.; Rustoiu, G.T.; Inel, I.C.; Badea, A. Remote sensing for cultural heritage assessment and monitoring: The case study of alba iulia. Sustainability 2021, 13, 1406. [Google Scholar] [CrossRef]
- Bozzano, F.; Esposito, C.; Mazzanti, P.; Patti, M.; Scancella, S. Imaging multi-age construction settlement behaviour by advanced SAR interferometry. Remote Sens. 2018, 10, 1137. [Google Scholar] [CrossRef]
- Di Lisa, M.; Ali, H.E.A.; Mazzanti, P.; Moretto, S. Inferring the creep settlement behavior of rockfill in reclaimed lands by advanced SAR interferometry and numerical modeling: An example from Arabian Gulf. Remote Sens. 2020, 12, 527. [Google Scholar] [CrossRef]
- Bozzano, F.; Mazzanti, P.; Perissin, D.; Rocca, A.; De Pari, P.; Discenza, M.E. Basin scale assessment of landslides geomorphological setting by advanced InSAR analysis. Remote Sens. 2017, 9, 267. [Google Scholar] [CrossRef]
- Moretto, S.; Bozzano, F.; Esposito, C.; Mazzanti, P.; Rocca, A. Assessment of landslide pre-failure monitoring and forecasting using satellite SAR interferometry. Geosciences 2017, 7, 36. [Google Scholar] [CrossRef]
- Urbini, S.; Bianchi-Fasani, G.; Mazzanti, P.; Rocca, A.; Vittuari, L.; Zanutta, A.; Girelli, V.A.; Serafini, M.; Zirizzotti, A.; Frezzotti, M. Multi-Temporal investigation of the Boulder Clay Glacier and Northern Foothills (Victoria Land, Antarctica) by integrated surveying techniques. Remote Sens. 2019, 11, 1501. [Google Scholar] [CrossRef]
- Rouyet, L.; Lauknes, T.R.; Christiansen, H.H.; Strand, S.M.; Larsen, Y. Seasonal dynamics of a permafrost landscape, Adventdalen, Svalbard, investigated by InSAR. Remote Sens. Environ. 2019, 231, 111236. [Google Scholar] [CrossRef]
- Gogolewska, A.B.; Strzeszynska, J. Factors Influencing Rock Burst Hazard in Deep Copper Ore Mine, SW Poland. IOP Conf. Ser. Earth Environ. Sci. 2019, 362. [Google Scholar] [CrossRef]
- Yu, Y.; Chen, S.E.; Deng, K.Z.; Fan, H.D. Long-term stability evaluation and pillar design criterion for room-and-pillar mines. Energies 2017, 10, 1644. [Google Scholar] [CrossRef]
- Malinowska, A.A.; Witkowski, W.T.; Guzy, A.; Hejmanowski, R. Mapping ground movements caused by mining-induced earthquakes applying satellite radar interferometry. Eng. Geol. 2018, 246, 402–411. [Google Scholar] [CrossRef]
- Wang, L.; Deng, K.; Zheng, M. Research on ground deformation monitoring method in mining areas using the probability integral model fusion D-InSAR, sub-band InSAR and offset-tracking. Int. J. Appl. Earth Obs. Geoinf. 2020, 85, 101981. [Google Scholar] [CrossRef]
- Fan, H.; Wang, L.; Wen, B.; Du, S. A New Model for three-dimensional Deformation Extraction with Single-track InSAR Based on Mining Subsidence Characteristics. Int. J. Appl. Earth Obs. Geoinf. 2021, 94, 102223. [Google Scholar] [CrossRef]
- Lizurek, G.; Lasocki, S. Clustering of mining-induced seismic events in equivalent dimension spaces. J. Seismol. 2014, 18, 543–563. [Google Scholar] [CrossRef]
- Rudzinski, Ł.; Cesca, S.; Lizurek, G. Complex rupture process of the 19 March 2013, Rudna mine (Poland) induced seismic event and collapse in the light of local and regional moment tensor inversion. Seismol. Res. Lett. 2016, 87, 274–284. [Google Scholar] [CrossRef]
- Hejmanowski, R.; Malinowska, A.A.; Witkowski, W.T.; Guzy, A. An analysis applying inSAR of subsidence caused by nearby mining-induced earthquakes. Geosciences 2019, 9, 490. [Google Scholar] [CrossRef]
- Crosetto, M.; Monserrat, O.; Devanthéry, N.; Cuevas-González, M.; Barra, A.; Crippa, B. Persistent scatterer interferometry using Sentinel-1 data. Int. Arch. Photogramm. Remote Sens. Spat. Inf. Sci. 2016, 41, 835–839. [Google Scholar] [CrossRef]
- Ng, A.H.M.; Ge, L.; Yan, Y.; Li, X.; Chang, H.C.; Zhang, K.; Rizos, C. Mapping accumulated mine subsidence using small stack of SAR differential interferograms in the Southern coalfield of New South Wales, Australia. Eng. Geol. 2010, 115, 1–15. [Google Scholar] [CrossRef]
- Ilieva, M.; Polanin, P.; Borkowski, A.; Gruchlik, P.; Smolak, K.; Kowalski, A.; Rohm, W. Mining deformation life cycle in the light of InSAR and deformation models. Remote Sens. 2019, 11, 745. [Google Scholar] [CrossRef]
- Berardino, P.; Fornaro, G.; Lanari, R.; Sansosti, E. A new algorithm for surface deformation monitoring based on small baseline differential SAR interferograms. IEEE Trans. Geosci. Remote Sens. 2002, 40, 2375–2383. [Google Scholar] [CrossRef]
- Perski, Z. The inerpretation of ERS-1 and ERS-2 INSAR data for the mining subsidence monitoring in upper silesian coal Basin, Poland. Int. Arch. Photogramm. Remote Sens. Spat. Inf. Sci. 2000, 33, 1137–1141. [Google Scholar]
- Szczerbowski, Z. High-energy seismic events in Legnica–Głogów Copper District in light of ASG-EUPOS data. Rep. Geod. Geoinformatics 2019, 107, 25–40. [Google Scholar] [CrossRef]
- Poszytek, A.; Rybak-Ostrowska, B.; Łukaszewski, P.; Włodarczyk, M. Gas trap stability in the Zechstein Limestone from the Rudna Copper Mine (SW Poland). Int. J. Earth Sci. 2020, 109, 439–463. [Google Scholar] [CrossRef]
- Borg, G.; Piestzynski, A.; Bachmann, G.H.; Puttman, W.; Walther, S.; Fiedler, M. Chapter 18 Digital Appendices An Overview of the European Kupferschiefer Deposits. Econ. Geol. Spec. Publ. 2012, 16, 1–8. [Google Scholar]
- Butra, J.; Kudełko, J. Rockburst hazard evaluation and prevention methods in Polish copper mines. Cuprum 2011, 61, 5–20. [Google Scholar]
- Burtan, Z. The influence of regional geological settings on the seismic hazard level in copper mines in the Legnica-Głogów Copper Belt Area (Poland). In E3S Web of Conferences, 2017; EDP Sciences: Les Ulis, France, 2017; Volume 24, p. 01004. [Google Scholar] [CrossRef]
- Massonnet, D.; Feigl, K.L. Radar interferometry and its application to changes in the earth’s surface. Rev. Geophys. 1998, 36, 441–500. [Google Scholar] [CrossRef]
- Bignami, C.; Burrato, P.; Cannelli, V.; Chini, M.; Falcucci, E.; Ferretti, A.; Gori, S.; Kyriakopoulos, C.; Melini, D.; Moro, M.; et al. Coseismic deformation pattern of the Emilia 2012 seismic sequence imaged by Radarsat-1 interferometry. Ann. Geophys. 2012, 55, 789–795. [Google Scholar] [CrossRef]
- Cheloni, D.; De Novellis, V.; Albano, M.; Antonioli, A.; Anzidei, M.; Atzori, S.; Avallone, A.; Bignami, C.; Bonano, M.; Calcaterra, S.; et al. Geodetic model of the 2016 Central Italy earthquake sequence inferred from InSAR and GPS data. Geophys. Res. Lett. 2017, 44, 6778–6787. [Google Scholar] [CrossRef]
- Valerio, E.; Tizzani, P.; Carminati, E.; Doglioni, C.; Pepe, S.; Petricca, P.; De Luca, C.; Bignami, C.; Solaro, G.; Castaldo, R.; et al. Ground deformation and source geometry of the 30 October 2016M w 6.5 norcia earthquake (Central Italy) investigated through seismological data, DInSAR measurements, and numerical modelling. Remote Sens. 2018, 10, 1901. [Google Scholar] [CrossRef]
- Antonielli, B.; Monserrat, O.; Bonini, M.; Righini, G.; Sani, F.; Luzi, G.; Feyzullayev, A.A.; Aliyev, C.S. Pre-eruptive ground deformation of Azerbaijan mud volcanoes detected through satellite radar interferometry (DInSAR). Tectonophysics 2014, 637, 163–177. [Google Scholar] [CrossRef]
- Euillades, L.D.; Euillades, P.A.; Riveros, N.C.; Masiokas, M.H.; Ruiz, L.; Pitte, P.; Elefante, S.; Casu, F.; Balbarani, S. Detection of glaciers displacement time-series using SAR. Remote Sens. Environ. 2016, 184, 188–198. [Google Scholar] [CrossRef]
- Samsonov, S. Three-dimensional deformation time series of glacier motion from multiple-aperture DInSAR observation. J. Geod. 2019, 93, 2651–2660. [Google Scholar] [CrossRef]
- Rocca, A.; Mazzanti, P.; Perissin, D.; Bozzano, F. Detection of past slope activity in a desert area using multi-temporal DInSAR with ALOS PALSAR data. Ital. J. Eng. Geol. Environ. 2014, 1, 35–50. [Google Scholar] [CrossRef]
- Barra, A.; Monserrat, O.; Mazzanti, P.; Esposito, C.; Crosetto, M.; Scarascia Mugnozza, G. First insights on the potential of Sentinel-1 for landslides detection. Geomat. Nat. Hazards Risk 2016, 7, 1874–1883. [Google Scholar] [CrossRef]
- Antonielli, B.; Mazzanti, P.; Rocca, A.; Bozzano, F.; Cas, L.D. A-DInSAR performance for updating landslide inventory in mountain areas: An example from lombardy region (Italy). Geosciences 2019, 9, 364. [Google Scholar] [CrossRef]
- Bozzano, F.; Esposito, C.; Franchi, S.; Mazzanti, P.; Perissin, D.; Rocca, A.; Romano, E. Understanding the subsidence process of a quaternary plain by combining geological and hydrogeological modelling with satellite InSAR data: The Acque Albule Plain case study. Remote Sens. Environ. 2015, 168, 219–238. [Google Scholar] [CrossRef]
- Stramondo, S.; Bozzano, F.; Marra, F.; Wegmuller, U.; Cinti, F.R.; Moro, M.; Saroli, M. Subsidence induced by urbanisation in the city of Rome detected by advanced InSAR technique and geotechnical investigations. Remote Sens. Environ. 2008, 112, 3160–3172. [Google Scholar] [CrossRef]
- Perissin, D.; Piantanida, R.; Piccagli, D.; Rocca, F. Landslide in Dossena (BG): Comparison between interferometric techniques. Biogeosar 2007, 9, 1–7. [Google Scholar]
- Costantini, M. Based on Network Programming. October 1998, 36, 813–821. [Google Scholar]
- Chen, C.W.; Zebker, H.A. Two-dimensional phase unwrapping with use of statistical models for cost functions in nonlinear optimization. J. Opt. Soc. Am. A 2001, 18, 338. [Google Scholar] [CrossRef] [PubMed]
- Goldstein, R.M.; Werner, C.L. Radar interferogram filtering for geophysical applications. Geophys. Res. Lett. 1998, 25, 4035–4038. [Google Scholar] [CrossRef]
- Ferretti, A.; Prati, C.; Rocca, F. Nonlinear subsidence rate estimation using permanent scatterers in differential SAR interferometry. IEEE Trans. Geosci. Remote Sens. 2000, 38, 2202–2212. [Google Scholar] [CrossRef]
- Ferretti, A.; Prati, C.; Rocca, F. Permanent scatterers in SAR interferometry. IEEE Trans. Geosci. Remote Sens. 2001, 39, 8–20. [Google Scholar] [CrossRef]
- Hanssen, R.F. Satellite radar interferometry for deformation monitoring: A priori assessment of feasibility and accuracy. Int. J. Appl. Earth Obs. Geoinf. 2005, 6, 253–260. [Google Scholar] [CrossRef]
- Kampes, B.M. Radar Interferometry: Persistent Scatterer Technique; Springer: Dordrecht, The Netherlands, 2006; Volume 12, ISBN 140204576X. [Google Scholar]
- Perissin, D.; Wang, Z.; Wang, T. The SARPROZ InSAR tool for urban subsidence/manmade structure stability monitoring in China. In Proceedings of the 34th International Symposium on Remote Sensing of Environment (ISRSE), Sidney, Australia, 10–15 April 2011. [Google Scholar]
- Samieie-Esfahany, S.; Hanssen, R.F.; Van Thienen-visser, K.; Muntendam-bos, A.; Samiei-Esfahany, S.; Hanssen, R.F.; Van Thienen-visser, K.; Muntendam-bos, A. On the effect of horizontal deformation on InSAR subsidence estimates. Proc. Fringe 2009 Workshop 2010, 2009, 1–7. [Google Scholar]
- Sui, L.; Ma, F.; Chen, N. Mining subsidence prediction by combining support vector machine regression and interferometric synthetic aperture radar data. ISPRS Int. J. Geo Inf. 2020, 9, 390. [Google Scholar] [CrossRef]
- Szczerbowski, Z.; Jura, J. Mining induced seismic events and surface deformations monitored by GPS permanent stations. Acta Geodyn. Geomater. 2015, 12, 237–248. [Google Scholar] [CrossRef]
- Popiolek, E.; Hejmannowski, R.; Krawczyk, A.; Perski, Z. Application of Satellite Radar Interferometry to the examination of the areas of mining exploitation. Surf. Min. Braunkhole Other Min. 2002, 54, 74–82. [Google Scholar]
- Skrzypkowski, K. Case studies of rock bolt support loads and rock mass monitoring for the room and pillar method in the legnica-głogów copper district in Poland. Energies 2020, 13, 2998. [Google Scholar] [CrossRef]
- Bell, F.G.; Stacey, T.R.; Genske, D.D. Mining subsidence and its effect in the environment: Some differing examples. Environ. Geol. 2000, 40, 135–152. [Google Scholar] [CrossRef]
- Milczarek, W. Investigation of post inducted seismic deformation of the 2016 Mw4.2 tarnowek Poland mining tremor based on Dinsar and SBAS methods. Acta Geodyn. Geomater. 2019, 16, 183–193. [Google Scholar] [CrossRef]
- Eneva, M. Detection of Surface Deformation at Mining and Geothermal Sites Using Satellite Radar Interferometry (InSAR). In Proceedings of the 44th U.S. Rock Mechanics Symposium and 5th U.S.-Canada Rock Mechanics Symposium, Salt Lake City, UT, USA, 27–30 June 2010. [Google Scholar]
- Owczarz, K.; Blachowski, J. Application of satellite radar interferometry in study of the relation between surface deformation and seismic event of the 15th September 2018 in the Rudna copper mine, Poland. Geokinematischer Tag TU Bergakademie Freiberg 2019, 20, 93–104. [Google Scholar]
- Gee, D.; Bateson, L.; Sowter, A.; Grebby, S.; Novellino, A.; Cigna, F.; Marsh, S.; Banton, C.; Wyatt, L. Ground motion in areas of abandoned mining: Application of the intermittent SBAS (ISBAS) to the Northumberland and Durham Coalfield, UK. Geosciences 2017, 7, 85. [Google Scholar] [CrossRef]
- Dong, L.; Wang, C.; Tang, Y.; Tang, F.; Zhang, H.; Wang, J.; Duan, W. Time Series InSAR Three-Dimensional Displacement Inversion Model of Coal Mining Areas Based on Symmetrical Features of Mining Subsidence. Remote Sens. 2021, 13, 2143. [Google Scholar] [CrossRef]
- Kendorski, F.S.; President, V.; Associates, A. 25th International Conference on Ground Control in Mining. In Proceedings of the 25th International Conference on Ground Control in Mining, Morgantown, WV, USA, 1–3 August 2006; pp. 325–334. [Google Scholar]
- Salmi, E.F.; Nazem, M.; Karakus, M. The effect of rock mass gradual deterioration on the mechanism of post-mining subsidence over shallow abandoned coal mines. Int. J. Rock Mech. Min. Sci. 2017, 91, 59–71. [Google Scholar] [CrossRef]
- Esterhuizen, G.S.; Dolinar, D.R.; Ellenberger, J.L. Pillar strength in underground stone mines in the United States. Int. J. Rock Mech. Min. Sci. 2011, 48, 42–50. [Google Scholar] [CrossRef]
- Castellanza, R.; Gerolymatou, E.; Nova, R. An attempt to predict the failure time of abandoned mine pillars. Rock Mech. Rock Eng. 2008, 41, 377–401. [Google Scholar] [CrossRef]
- De, E.; Blanco, R.; Behrens, J.R.; Corbin, B.A.; Green, E.K.; Picard, A.J. Global Trends in Small Satellites; Virginia Lal, B., Ed.; IDA Science and Technology Policy Institute: Alexandria, Egypt, 2017. [Google Scholar]
- Ignatenko, V.; Laurila, P.; Radius, A.; Lamentowski, L.; Antropov, O.; Muff, D. ICEYE Microsatellite SAR Constellation Status Update: Evaluation of First Commercial Imaging Modes. Int. Geosci. Remote Sens. Symp. 2020, 3581–3584. [Google Scholar] [CrossRef]
- Farquharson, G.; Space, C.; Francisco, S. Radar Description Radar System. In Proceedings of the EUSAR 2018-12th European Conference on Synthetic Aperture Radar, Aachen, Germany, 4–7 June 2018; pp. 1245–1249. [Google Scholar]


| Sentinel-1 | Ascending | Descending |
|---|---|---|
| Nr of scenes | 206 | 205 |
| Start date | 15 November 2014 | 7 October 2014 |
| End date | 5 May 2019 | 14 April 2019 |
| Look angle (°) | 39.05 | 38.96 |
Publisher’s Note: MDPI stays neutral with regard to jurisdictional claims in published maps and institutional affiliations. |
© 2021 by the authors. Licensee MDPI, Basel, Switzerland. This article is an open access article distributed under the terms and conditions of the Creative Commons Attribution (CC BY) license (https://creativecommons.org/licenses/by/4.0/).
Share and Cite
Antonielli, B.; Sciortino, A.; Scancella, S.; Bozzano, F.; Mazzanti, P. Tracking Deformation Processes at the Legnica Glogow Copper District (Poland) by Satellite InSAR—I: Room and Pillar Mine District. Land 2021, 10, 653. https://doi.org/10.3390/land10060653
Antonielli B, Sciortino A, Scancella S, Bozzano F, Mazzanti P. Tracking Deformation Processes at the Legnica Glogow Copper District (Poland) by Satellite InSAR—I: Room and Pillar Mine District. Land. 2021; 10(6):653. https://doi.org/10.3390/land10060653
Chicago/Turabian StyleAntonielli, Benedetta, Alessandra Sciortino, Stefano Scancella, Francesca Bozzano, and Paolo Mazzanti. 2021. "Tracking Deformation Processes at the Legnica Glogow Copper District (Poland) by Satellite InSAR—I: Room and Pillar Mine District" Land 10, no. 6: 653. https://doi.org/10.3390/land10060653
APA StyleAntonielli, B., Sciortino, A., Scancella, S., Bozzano, F., & Mazzanti, P. (2021). Tracking Deformation Processes at the Legnica Glogow Copper District (Poland) by Satellite InSAR—I: Room and Pillar Mine District. Land, 10(6), 653. https://doi.org/10.3390/land10060653