Article

Attribution Analysis of Climate and Anthropic Factors on Runoff and Vegetation Changes in the Source Area of the Yangtze River from 1982 to 2016

1
College of Resources and Environmental Sciences, Henan Agricultural University, Zhengzhou 450002, China
2
Key Research Institute of Yellow River Civilization and Sustainable Development & Collaborative Innovation Center on Yellow River Civilization jointly built by Henan Province and Ministry of Education, Henan University, Kaifeng 475001, China
*
Author to whom correspondence should be addressed.
Land 2021, 10(6), 612; https://doi.org/10.3390/land10060612
Submission received: 6 May 2021 / Revised: 1 June 2021 / Accepted: 4 June 2021 / Published: 8 June 2021

Abstract

:
Analyzing the temporal variation of runoff and vegetation and quantifying the impact of anthropic factors and climate change on vegetation and runoff variation in the source area of the Yangtze River (SAYR), is of great significance for the scientific response to the ecological protection of the region. Therefore, the Budyko hypothesis method and multiple linear regression method were used to quantitatively calculate the contribution rates of climate change and anthropic factors to runoff and vegetation change in the SAYR. It was found that: (1) The runoff, NDVI, precipitation, and potential evaporation in the SAYR from 1982 to 2016 all showed an increasing trend. (2) The mutation year of runoff data from 1982 to 2016 in the SAYR is 2004, and the mutation year of NDVI data from 1982 to 2016 in the SAYR is 1998. (3) The contribution rates of precipitation, potential evaporation and anthropic factors to runoff change of the SAYR are 75.98%, −9.35%, and 33.37%, respectively. (4) The contribution rates of climatic factors and anthropic factors to vegetation change of the SAYR are 38.56% and 61.44%, respectively.

1. Introduction

The source area of the Yangtze River (SAYR) is located in the hinterland of the Qinghai Tibet Plateau, which is an important ecological barrier in China [1]. It has the ecological functions of maintaining the ecological security of the Yangtze River Basin [2]. At the same time, it is also one of the most sensitive and fragile regions in the global ecological environment [3,4]. Due to the joint impact of climate change and anthropic factors (indiscriminating felling of trees, disafforestation, overgrazing, mining, and digging), the ecological environment of the SAYR is deteriorating, and the function of water conservation is weakening [5,6]. Additionally, the problems of grassland degradation, wetland shrinkage, glacier retreat, soil erosion, and biodiversity decline are becoming increasingly prominent. These issues highlight the threats to the water resources and ecological security of the whole basin.
The impact of climate change has been embodied in the components of the hydrological cycle, including precipitation [7], evapotranspiration [8], and runoff [9]. Most of the literature has focused on precipitation and evapotranspiration worldwide [10,11], and runoff has taken less attention. Nevertheless, runoff remains one of the most important water resources and has a great influence on the formation of geomorphology, the development of soil, and the growth of plants [12]. It is an important condition for the regional industrial and agricultural water supply and plays an important role in the development of social economy.
In recent years, under the joint influence of climate change and anthropic factors, the problems of climate, ecology, and hydrology in the SAYR have been a cause for concern. Therefore, numerous programs have been carried out to improve the eco-hydrological environment, among which Grain for Green proposed by the Chinese government in 1998 is the most well-known. In this context, monitoring the dynamic changes of runoff and vegetation and assessing the impacts of anthropic factors and climate change on runoff and vegetation change are of great practical value for formulating rational adaptive management countermeasures [13,14,15,16,17,18,19].
Previous studies have focused on the relationship between runoff and vegetation change and its influencing factors in the SAYR. Chen et al. analyzed the temporal and spatial change of vegetation cover in the SAYR from 1982 to 2003 and analyzed the influence of topography and human factors on the vegetation change [20]. Yao et al. analyzed the spatiotemporal variation characteristics of vegetation net primary productivity in the SAYR from 1959 to 2008 and analyzed the relationship between vegetation change and climate factors (temperature, relative humidity, precipitation, wind speed, and sunshine hours) [21]. Liu et al. analyzed the spatiotemporal variation characteristics of vegetation coverage in the SAYR from 1997 to 2012 and believed that the improvement of vegetation status in the SAYR benefited from the joint influences of climate humidification and ecological engineering [22]. Qian et al., Li et al., and Luo et al. studied the variation regularities of runoff in the source area from 1957 to 2009, 1961 to 2011, and 1961 to 2016, respectively, and pointed out that the annual surface water resources in the SAYR all showed an increasing trend [23,24,25]. Xu et al. analyzed the runoff variation characteristics and the degree of human impact in the SAYR from 1956 to 2004 [26]. Liu et al. separated the influences of climate and anthropic factors on runoff in the SAYR based on the Budyko hypothesis [27]. These research results have important scientific value for understanding the regularities of runoff and vegetation change in the SAYR, but there are few studies on the assessment and quantitative analysis of climate change and the contribution rate of anthropic factors to runoff and vegetation change in the SAYR [27,28].
The objective of this study was to quantify the impact of anthropic factors and climate change on vegetation and runoff variation in the SAYR by following three steps: (1) analyzing the temporal variation regularities of runoff and vegetation in the SAYR; (2) distinguishing the mutation year of runoff and NDVI data with the Mann–Kendall mutation analysis method; and (3) quantifying the contribution rate of climatic and anthropic factors to vegetation and runoff in the SAYR.

2. Study Area and Data

2.1. Study Area

The source region of the Yangtze River is located between 90°43′ and 96°45′ E, 32°30′ and 35°35′ N, with an area of about 13.77 × 10⁴ km2 (Figure 1). Its annual average runoff is about 129.17 × 10⁸ m3, and it affects the interannual fluctuation, long-term evolution trend, and the sustainable utilization of water resources in the Yangtze River Basin. The landform is mainly high plains and hills, with an average altitude of more than 4000 m. Its climate type belongs to the semi-humid and semi-arid region of the plateau frigid zone, with abundant sunshine and large temperature difference between day and night. Temperatures are generally low throughout the year in the Yangtze River source area. The month with the lowest precipitation is December, the month with the highest precipitation is July, and the annual precipitation is concentrated in May–September, which accounts for more than 85% of the annual precipitation [29].

2.2. Data Sources

The data used in this study consist of three parts: (1) The annual runoff observation data of Zhimenda station from 1982 to 2016 were all from the Yangtze River Water Conservancy Commission (http://www.cjw.gov.cn/, accessed on 1 January 2021); (2) the climate station data in and around the source region of the Yangtze River Basin from 1982 to 2016 were obtained from the China Meteorological Administration (http://www.cma.gov.cn, accessed on 1 January 2021). First, the daily potential evaporation of 25 meteorological stations was calculated using the Penman–Monteith equation, and then the monthly precipitation and potential evaporation of 25 meteorological stations were calculated. Finally, the monthly precipitation and potential evaporation were interpolated from data of 25 meteorological stations in and around the SRYR by kriging. Annual precipitation and potential evaporation were obtained by adding monthly scale data. (3) The NDVI data of the source region of the Yangtze River Basin from 1982 to 2016 were obtained from the NOAA CDR AVHRR NDVI: Normalized Difference Vegetation Index, Version 5 (https://www.ncdc.noaa.gov/cdr/terrestrial/normalized-difference-vegetation-index, accessed on 1 January 2021). The time resolution is daily, and the spatial resolution is 0.05° × 0.05°. The monthly NDVI and annual NDVI were extracted with the maximum combination method.

3. Research Methods

3.1. Trend Analysis Method

In this study, the univariate linear regression method (Slope) was used to analyze the variation trend of runoff, precipitation, potential evaporation, and NDVI in the study period; time t was taken as the independent variable. The calculation equation is as follows [30,31,32]:
S l o p e = n i = 1 n i X i i = 1 n i i = 1 n X i n i = 1 n i 2 i = 1 n i 2
where Slope is the simple linear regression coefficient of runoff, precipitation, potential evaporation, and NDVI from 1982 to 2016. If Slope is positive, it means that the variable has an upward trend in the study period, whereas a negative value represents a downward trend; n is the number of years of the study period, i is 1 to n, n is 35, and X represents the annual runoff, precipitation, potential evaporation, and NDVI in the study area.

3.2. Mann–Kendall Mutation Analysis Method

Mann–Kendall (MK) mutation analysis has been widely used to test the abrupt point of hydro-meteorological elements due to its advantages of minimized interference from outliers and simple calculation [33,34].
For X with n data, a rank sequence is constructed, as shown in Equations (2) and (3):
S k = i = 1 k r i   ( k = 2 ,   3 ,   ,   i )
r i = + 1 x i > x j 0 x i x j   ( j = 2 ,   3 ,   ,   i )
The UFk statistics can be calculated by Equation (4):
U F k = s k E s k V a r s k ( k = 1 ,   2 ,   ,   n )
where UF1 = 0, E(sk) and Var(sk) represent the mean and variance of sk, respectively. The calculation equations are as follows:
E s k = n n + 1 4 2 k n
V a r s k = n n 1 2 n + 5 72 2 k n
The inverse order of X is calculated again, and at the same time, UBk = UFk (k = n, n − 1, …,1), UB1 = 0, then the UBk curve can be calculated. When the two lines (UF curve and UB curve) intersect, and the intersection point is within the range of the 0.05 significance level, the intersection point can be considered as the mutation year.

3.3. Budyko Hypothesis

There are three assumptions in the attribution analysis of runoff change using the Budyko hypothesis: (1) Human activities and climate change do not affect each other and are independent factors. (2) For multi-year water balance, the change of water storage is usually negligible compared with the average annual precipitation depth. Therefore, the change of catchment storage water for multi-year water balance is assumed as 0; (3) The base period is only affected by climate change. Therefore, except for climate change, other factors affecting runoff change are classified as human activities.
The water balance equation of the basin is expressed as follows:
R = P - E T - Δ S
R is the runoff depth; P is precipitation; ET is the actual evapotranspiration; and ΔS is the change of water storage. For multi-year water balance, the change of water storage is usually negligible compared with the average annual precipitation depth. Therefore, in the study of long-term hydrological data, it is generally considered that ΔS is 0.
The Budyko hypothesis, based on an assumption that the change of catchment storage water for multi-year water balance is considered as 0, is widely applied to quantitatively calculate the impact of climate change and anthropic factors on long-term annual runoff change [35,36,37,38,39]. ET can be calculated according to the Budyko hypothesis, the calculation equation of which is as follows [40,41]:
E T =   P × E T 0 P ω + E T 0 ω 1 / ω
ET0 is the annual average potential evapotranspiration (mm); ω indicates characteristic parameters of underlying surface.
ET0 can be calculated using the Penman–Monteith equation.
E T 0 = 0.408 Δ R n G + γ 900 T + 273 U 2 e a e d Δ + γ 1 + 0.34 U 2
Equation (7) can be transformed into Equation (10):
R = P   P × E T 0 P ω + E T 0 ω 1 / ω
where R, P, and ET0 are known, and parameter ω can be calculated by the “fsolve” function of MATLAB.
Based on Equation (10), the elastic coefficients of precipitation ( ε P ), potential evaporation ( ε E T 0 ), and underlying surface parameters ( ε ω ) to runoff can be calculated by the following equations [42]. The concept of elastic coefficient is shown in Appendix A.
ε P = 1   +   ϕ ω 1 / ω + 1 ϕ ω + 1 1   +   ϕ ω 1   +   ϕ ω 1 / ω ϕ
ε E T 0 = 1 1   +   ϕ ω 1 1   +   ϕ ω 1 / ω
ε ω = ln 1   +   ϕ ω   +   ϕ ω ln 1   +   ϕ ω ω 1   +   ϕ ω 1 1   +   ϕ ω 1 / ω
ϕ = E T 0 P
The runoff variation amount caused by the annual average precipitation change ( Δ R P ), annual average potential evaporation change ( Δ R E T 0 ), and underlying surface parameter change ( Δ R ω ) can be calculated by the following Equations (15)–(17):
Δ R P = ε P R P × Δ P
Δ R ET 0 = ε E T 0 R E T 0 × Δ E T 0
Δ R ω = ε ω R ω × Δ ω
On this basis, the contribution rate of precipitation ( η R p ), potential evaporation, ( η R E T 0 ) and anthropic factor ( η R H ) to runoff changes can be calculated using Equations (19)–(21):
Δ R = Δ R P + Δ R E T 0 + Δ R ω
η R P = Δ R P / Δ R × 100 %
η R E T 0 = Δ R E T 0 / Δ R × 100 %
η R H = Δ R ω / Δ R × 100 %

3.4. Attribution Analysis of Climate and Anthropic Factors to Vegetation Change

There are two assumptions in the attribution analysis of vegetation change using this method: (1) Human activities and climate change do not affect each other and are independent factors. (2) The base period is only affected by climate change. Therefore, except for climate change, other factors affecting vegetation change are classified as human activities.
According to the mutation analysis results of NDVI time series data, the NDVI data are divided into two parts: base period (T1) and change period (T2). On this basis, the change of average NDVI in the two periods ( N D V I ¯ ) can be calculated as follows:
N D V I ¯ = N D V I T 2 ¯ N D V I T 1 ¯
where N D V I T 1 ¯ and N D V I T 2 ¯   are the average NDVI values in the base period (T1) and change period (T2), respectively. This method assumes that NDVI in the base period is only affected by climate change. Therefore, the NDVI difference between the base period and change period can be attributed to climatic factors ( N D V I C ¯ ) and anthropogenic factors ( N D V I H ¯ ).
The monthly NDVI values are quantitatively correlated with monthly precipitation and potential evapotranspiration [43,44]. Therefore, a multiple linear regression equation between monthly NDVI, monthly precipitation, and monthly potential evapotranspiration in the base period (T1) can be established:
N D V I T 1 ¯ = a P T 1 + b E T 0 T 1 + c
The monthly precipitation (PT2) and potential evapotranspiration (ET0T2) in the T2 period are known, and the simulated NDVI in the T2 period ( N D V I T 2 , S ¯ ) can be calculated by Equation (24).
N D V I T 2 , S ¯ = a P T 2 + b E T 0 T 2 + c
This method assumes that NDVI in the base period ( N D V I T 1 ¯ ) is only affected by climate change. Therefore, N D V I T 2 , S ¯ in the T2 period calculated by Equation (24) is only affected by climate change. N D V I T 2 ¯ is the average value of NDVI observation in the T2 period, which is affected by the combination of climate change and human activities.
The contribution rates of anthropic factor ( η N D V I H ) and climate change ( η N D V I C ) to NDVI can be calculated separately by Equations (25)–(28):
N D V I H ¯ = N D V I T 2 ¯ N D V I T 2 , S ¯
N D V I C ¯ = N D V I T 2 , S ¯ N D V I T 1 ¯
η N D V I H = N D V I H ¯ / N D V I ¯
η N D V I C = N D V I C ¯ / N D V I ¯

4. Results and Analysis

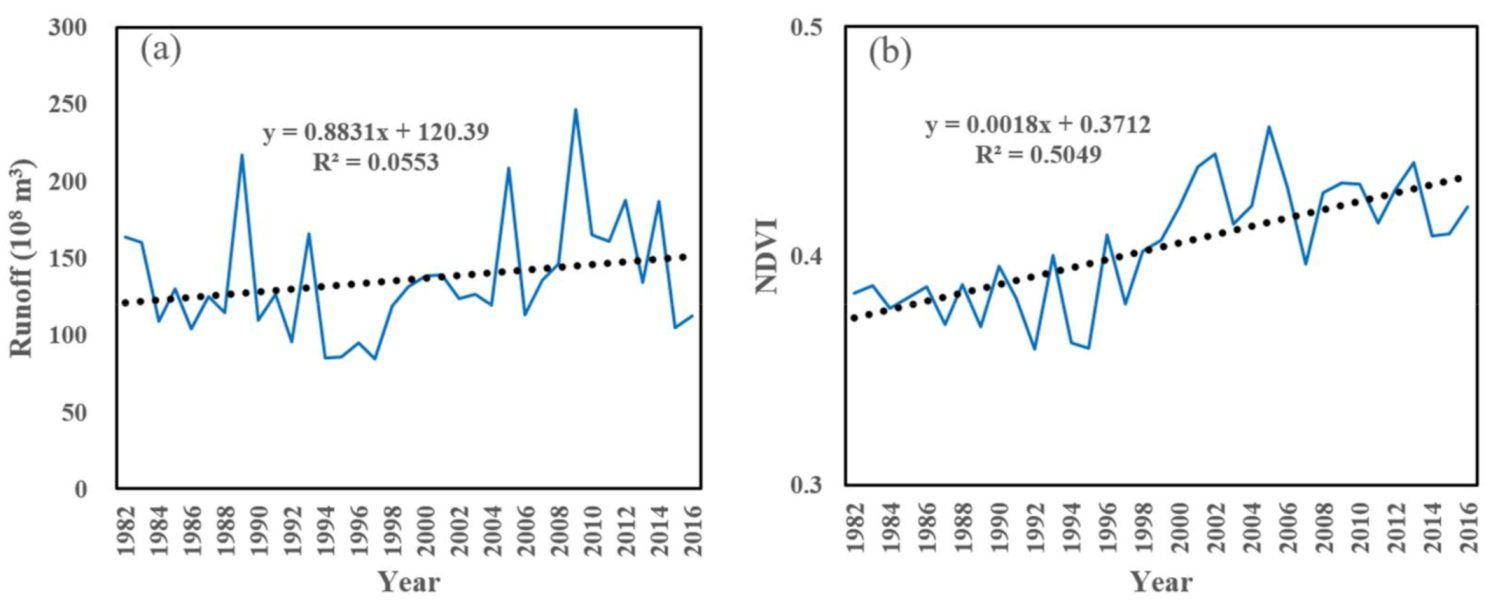
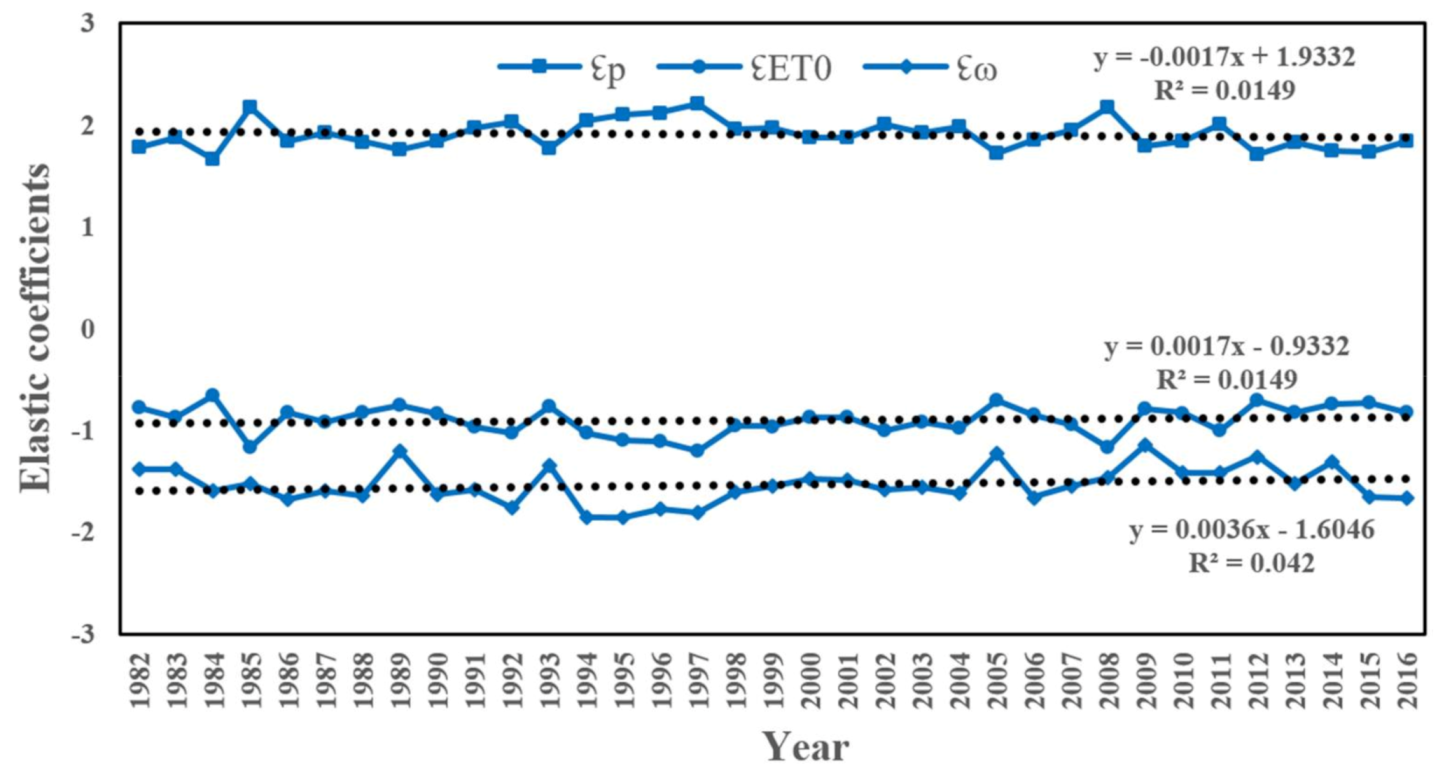
4.1. Trends Analysis of Runoff, NDVI, and Climate Factors

Figure 2 displays the change trend of the annual runoff in Zhimenda hydrological station and NDVI in the SAYR. It can be found that the annual runoff of Zhimenda hydrological station shows an increasing trend from 1982 to 2018, with an average annual increase of 0.8831 × 10⁸ m3. The NDVI value in the SAYR showed a significant growth trend from 1982 to 2016, with an average annual growth of 0.0018.
Figure 3 displays the change trend of average annual precipitation and annual potential evaporation in the SAYR. It can be found from Figure 3a that the annual average precipitation in the SAYR showed an increasing trend from 1982 to 2016, with an average annual increase of 1.2394 mm. Figure 3b displays that the average annual potential evaporation in the SAYR also showed an upward trend from 1982 to 2016, with an average annual increase of 0.5965 mm.

4.2. Mutation Analysis of Runoff and NDVI

In this study, the Mann–Kendall method was used to analyze runoff and NDVI data in the SAYR, and the results are shown in Figure 4 and Figure 5.
It can be found from Figure 4 that the UF and UB curve calculated from the runoff time series data in the SAYR intersected in 2004, and this intersection point was within the range of the 0.05 significance level, indicating that 2004 was the abrupt change year of runoff in the SAYR from 1982 to 2016.
It can be found from Figure 5 that UF and UB curve calculated from the NDVI time series data in the SAYR intersected in 1998, and this intersection point was within the range of the 0.05 significance level, indicating that 1998 was abrupt change year of NDVI in the SAYR from 1982 to 2016. This may be because Grain for Green was proposed by Chinese government in 1998, and the impact of human activities on vegetation change has increased since 1999.

4.3. Assessment of the Contribution Rates of Climate and Anthropic Factors to Runoff and Vegetation Changes

Identifying the abrupt change year of runoff and NDVI was the premise for dividing time series data into different periods (i.e., base period and changing period). If there was no abrupt change year of runoff and NDVI data, we did not divide time series data into different periods.
According to mutation analysis results of runoff time series data at Zhimenda hydrological station from 1982 to 2016, the Zhimenda hydrological station 1982–2016 data were divided into two periods: the base period (1982–2004) and the change period (2005–2016), and the eigenvalues of meteorological and hydrological variables for different periods in the Zhimenda hydrological station were calculated (Table 1).
In order to further evaluate the temporal evolution characteristics of the impact of climate factors and underlying surface parameters on runoff, according to Equations (11)–(13), the elastic coefficients of precipitation, potential evaporation, and underlying surface characteristic parameters in different years on runoff change of Zhimenda hydrological station were calculated (Figure 6).
It can be seen from Figure 6 that the absolute values of ε P , ε ET 0 , and   ε ω in for Zhimenda hydrological station all showed a decreasing trend, indicating that the sensitivity of runoff change in the SAYR to climate factors and underlying surface parameters is decreasing.
According to Table 1, the differences of average annual precipitation, potential evaporation, and underlying surface parameter in the base period (1982–2004) and change period (2005–2016) were calculated and are displayed in Table 2. Then, according to Equations (15)–(17), the runoff variation amount for Zhimenda hydrological station caused by climate factors (precipitation, potential evaporation) and underlying surface condition change were calculated, as displayed in Table 2. Finally, the contribution rate of climate (precipitation, evaporation) and anthropic factors to runoff change of Zhimenda hydrological station was calculated according to Equations (18)–(21), as shown in Table 2.
The contribution rates of climate and anthropic factors to runoff variation in Zhimenda hydrological station are 66.63% and 33.37%, respectively. In general, climate change plays a major role in increasing runoff, and precipitation has a more significant effect on runoff increase than the reference evapotranspiration.
This conclusion is similar to that of Liu et al. [27]. However, there are some differences in the specific contribution rate value, and this may be due to the following factors: (1) The time ranges of runoff data are different; (2) different methods are used to calculate the contribution rate of climatic (precipitation, potential evaporation) and anthropic factors to runoff variation.
According to the abrupt analysis results of NDVI data of the SAYR from 1982 to 2016, the NDVI data in the SAYR from 1982 to 2016 can be divided into two periods: the base period (1982–1998) and the change period (1999–2016). Previous studies have found that monthly NDVI is closely related to monthly precipitation and potential evaporation [43,44], and NDVI change can be used to characterize vegetation change. Referring to the method proposed by Li et al. [45], this study first established the multiple linear regression equation between monthly NDVI, monthly precipitation, and monthly potential evapotranspiration in the period of 1982–1998, and then the contribution rate of climate change and anthropic factors to vegetation change was quantitatively analyzed according to Equations (25)–(28) (Table 3). The results showed that compared to the period of 1982–1998, anthropic factors played a major role in increasing vegetation coverage in the period of 1999–2016, with a contribution rate of 61.44%, and the contribution rate of climate factors was 38.56%.

5. Discussion

Although the change trend and mutation characteristics of runoff and vegetation in the SAYR were analyzed, and the impact of climate change and anthropic factors on runoff and vegetation change were calculated, there are still some uncertainties. The data of precipitation and potential evaporation in the study area are interpolated from low-density meteorological station data in and around the SAYR, but there are still some deviations between the interpolation results and their actual distribution. The change of catchment storage water for multi-year water balance is assumed as 0, and we assumed that human activities and climate change do not affect each other and are independent factors. This study also assumed that the base period is only affected by climate change. All of these factors will lead to some uncertainties in the research results.

6. Conclusions

This study revealed the change trend and mutation characteristics of runoff and vegetation in the SAYR, and the contribution rates of climate change and anthropic factors to runoff change in the SAYR were quantitatively calculated using the Budyko hypothesis and multiple linear regression method, which provides theoretical support for water resource management and ecological protection in the SAYR.
The results showed that the runoff, NDVI, precipitation, and potential evaporation in the SAYR from 1982 to 2016 all showed an increasing trend. The abrupt change years of runoff and NDVI data in the SAYR from 1982 to 2016 were 2004 and 1998, respectively. Anthropic factors play a major role in annual runoff and vegetation change, with contribution rates of 75.98% and 61.44%. In the follow-up study, we will try to quantitatively analyze the contribution rate of climate and human factors to vegetation and runoff changes in different seasons.

Author Contributions

Conceptualization, G.J. and L.W.; Data curation, G.J., H.S. and H.W.; Funding acquisition, L.W. and H.W.; Methodology, G.J. and H.S.; Project administration, L.W. and H.W.; Writing—original draft, G.J., H.S. and L.W.; Writing—review and editing, G.J., H.W. and L.W. All authors have read and agreed to the published version of the manuscript.

Funding

This research was funded by the National Natural Science Foundation of China (Grant No. 41901239), Second Tibetan Plateau Scientific Expedition and Research Program (Grant No. 2019QZKK0608), Soft Science Research of Technology Development Projects of Henan Province (Grant No. 192400410085) and China Postdoctoral Science Foundation (Grant No. 2018M640670).

Institutional Review Board Statement

Not applicable.

Informed Consent Statement

Not applicable.

Data Availability Statement

Not applicable.

Conflicts of Interest

The authors declare no conflict of interest.

Appendix A

Based on the abrupt change years of runoff in the SAYR, the runoff time series data are divided into two periods: the base period and the change period. The average annual precipitation in the base period is expressed as P1, and the average annual precipitation in the change period is expressed as P2. The variation of annual precipitation can be expressed as:
Δ P = P 2 P 1
Similarly, the variation of the potential evaporation ( Δ E T 0 ) and characteristic parameters of underlying surface ( Δ ω ) can be calculated by Equations (A2) and (A3):
Δ E T 0 = E T 0 2 E T 0 1
Δ ω = ω 2 ω 1
The elasticity coefficient is the ratio of the change rate of two interrelated indexes in a certain period. The elastic coefficients of precipitation ( ε P ), potential evaporation ( ε E T 0 ), and underlying surface parameters ( ε ω ) to runoff can be expressed by Equations (A4)–(A6), respectively.
ε P = Δ P P / Δ R R
ε E T 0 = Δ E T 0 E T 0 / Δ R R
ε ω = Δ ω ω / Δ R R

References

  1. Highland, L.M. Geographical Overview of the Three Gorges Dam and Reservoir, China—Geologic Hazards and Environmental Impacts. U.S. Geological Survey, Commonwealth of Virginia, 2008. Available online: https://pubs.usgs.gov/of/2008/1241/ (accessed on 5 June 2021).
  2. Li, Z.; Li, Z.; Song, L.; Ma, J. Characteristic and factors of stable isotope in precipitation in the source region of the Yangtze River. Agric. For. Meteorol. 2020, 281, 107825. [Google Scholar]
  3. Shao, Q.; Zhao, Z.; Liu, J.; Fan, J. The characteristics of land cover and macroscopical ecology changes in the Source Region of Three Rivers in Qinghai-Tibet plateau during last 30 years. Geogr. Res. 2010, 29, 363–366. (In Chinese) [Google Scholar]
  4. Wu, D.; Zhao, X.; Liang, S.; Tao, Z.; Zhao, W. Time-lag effects of global vegetation responses to climate change. Glob. Chang. Biol. 2015, 21, 3520–3531. [Google Scholar] [CrossRef]
  5. Zheng, H. Birth of the Yangtze River: Age and tectonic-geomorphic implications. Natl. Sci. Rev. 2015, 2, 438–453. [Google Scholar] [CrossRef]
  6. Yang, J.; Wang, Y.; Luo, G.; Xue, D.; Gang, H. Patterns and Structures of Land Use Change in the Three Rivers Headwaters Region of China. PLoS ONE 2015, 10, e0119121. [Google Scholar] [CrossRef] [Green Version]
  7. Kusunoki, S.; Ose, T.; Hosaka, M. Emergence of unprecedented climate change in projected future precipitation. Sci. Rep. 2020, 10, 1–8. [Google Scholar] [CrossRef] [Green Version]
  8. Niyogi, D.; Jamshidi, S.; Smith, D.; Kellner, O. Evapotranspiration Climatology of Indiana Using In Situ and Remotely Sensed Products. J. Appl. Meteorol. Climatol. 2020, 59, 2093–2111. [Google Scholar] [CrossRef]
  9. Li, Z.; Huang, S.; Liu, D.; Leng, G.; Zhou, S.; Huang, Q. Assessing the effects of climate change and human activities on runoff variations from a seasonal perspective. Stoch. Environ. Res. Risk Assess. 2020, 34, 575–592. [Google Scholar] [CrossRef]
  10. Jamshidi, S.; Zand-Parsa, S.; Naghdyzadegan Jahromi, M.; Niyogi, D. Application of a simple Landsat-MODIS fusion model to estimate evapotranspiration over a heterogeneous sparse vegetation region. Remote Sens. 2019, 11, 741. [Google Scholar] [CrossRef] [Green Version]
  11. Jamshidi, S.; Zand-parsa, S.; Pakparvar, M.; Niyogi, D. Evaluation of evapotranspiration over a semiarid region using multiresolution data sources. J. Hydrometeorol. 2019, 20, 947–964. [Google Scholar] [CrossRef]
  12. Zhou, Y.; Lai, C.; Wang, Z.; Chen, X.; Zeng, Z.; Chen, J.; Bai, X. Quantitative evaluation of the impact of climate change and human activity on runoff change in the Dongjiang River Basin, China. Water 2018, 10, 571. [Google Scholar] [CrossRef] [Green Version]
  13. Tietjen, B.; Schlaepfer, D.R.; Bradford, J.B.; Lauenroth, W.K.; Hall, S.A.; Duniway, M.C.; Hochstrasser, T.; Jia, G.; Munson, S.M.; Pyke, D.A.; et al. Climate change-induced vegetation shifts lead to more ecological droughts despite projected rainfall increases in many global temperate drylands. Glob. Chang. Biol. 2017, 23, 2743–2754. [Google Scholar] [CrossRef]
  14. Chen, B.; Zhang, X.; Tao, J.; Wu, J.; Wang, J.; Shi, P.; Zhang, Y.; Yu, C. The impact of climate change and anthropogenic activities on alpine grassland over the Qinghai-Tibet Plateau. Agric. For. Meteorol. 2014, 189, 11–18. [Google Scholar] [CrossRef]
  15. Sun, Q.; Li, B.; Zhou, C.; Li, F.; Zhang, Z.; Ding, L.; Zhang, T.; Xu, L. A systematic review of research studies on the estimation of net primary productivity in the Three-River Headwater Region. China J. Geogr. Sci. 2017, 27, 161–182. [Google Scholar] [CrossRef]
  16. Jiang, L.; Jiapaer, G.; Bao, A.; Guo, H.; Ndayisaba, F. Vegetation dynamics and responses to climate change and human activities in Central Asia. Sci. Total Environ. 2017, 599, 967–980. [Google Scholar] [CrossRef] [PubMed]
  17. Yan, D.; Lai, Z.; Ji, G. Using Budyko-Type Equations for Separating the Impacts of Climate and Vegetation Change on Runoff in the Source Area of the Yellow River. Water 2020, 12, 3418. [Google Scholar] [CrossRef]
  18. Ji, G.; Lai, Z.; Xia, H.; Liu, H.; Wang, Z. Future Runoff Variation and Flood Disaster Prediction of the Yellow River Basin Based on CA-Markov and SWAT. Land 2021, 10, 421. [Google Scholar] [CrossRef]
  19. Liu, H.; Wang, Z.; Ji, G.; Yue, Y. Using Budyko-Type Equations for Separating the Impacts of Climate and Vegetation Change on Runoff in the Source Area of the Yellow River. Water 2020, 12, 3501. [Google Scholar] [CrossRef]
  20. Chen, T.; Liang, S.; Qian, K.; Wan, L. Regularity and cause of vegetation coverage changes in the headwaters of the Changjiang River over the last 22 years. Earth Sci. Front. 2008, 15, 323–331. (In Chinese) [Google Scholar]
  21. Yao, Y.; Yang, J.; Wang, R.; Lu, D.; Zhang, X. Responses of net primary productivity of natural vegetation to climatic change over source regions of Yangtze River in 1959–2008. J. Glaciol. Geocryol. 2011, 33, 1286–1293. (In Chinese) [Google Scholar]
  22. Liu, L.; Cao, W.; Shao, Q. Change of ecological condition in the headwater of the Yangtze River before and after the implementation of the ecological conservation and construction project. J. Geo-Inf. Sci. 2016, 18, 1069–1076. (In Chinese) [Google Scholar]
  23. Qian, K.; Wang, X.; Lv, J.; Li, W. The wavelet correlative analysis of climatic impacts on runoff in the source region of Yangtze River, in China. Int. J. Climatol. 2014, 34, 2019–2032. [Google Scholar] [CrossRef]
  24. Li, L.; Shen, H.; Dai, S.; Li, H.; Xiao, J. Response of water resources to climate change and its future trend in the source region of the Yangtze River. J. Geogr. Sci. 2013, 23, 208–218. [Google Scholar] [CrossRef]
  25. Luo, Y.; Qin, N.; Zhou, B.; Li, J.; Liu, J.; Wang, C.; Pang, Y. Changes of runoff in the source region of the Yangtze River from 1961 to 2016. Soil Water Conserv. Res. 2019, 26, 123–128. (In Chinese) [Google Scholar]
  26. Xu, X.; Yan, J.; Liang, X. Characteristics of runoff variation and degree of human influence in the Three-River Headwaters Region. Arid Area Study 2009, 26, 88–93. (In Chinese) [Google Scholar]
  27. Liu, J.; Chen, J.; Xu, J.; Lin, Y.; Yuan, Z.; Zhou, M. Attribution of Runoff Variation in the Headwaters of the Yangtze River Based on the Budyko Hypothesis. Int. J. Environ. Res. Public Health 2019, 16, 2506. [Google Scholar] [CrossRef] [PubMed] [Green Version]
  28. Li, H.; Liu, G.; Fu, B. Response of vegetation to climate change and human activity based on NDVI in theThree-River Headwaters region. Acta Ecol. Sin. 2011, 31, 5495–5504. (In Chinese) [Google Scholar]
  29. Li, Y.; Li, Q.; Liu, X.; Duan, S.; Cai, Y. Analysis of Runoff Variation in Source Region of Yangtze River. J. China Hydrol. 2017, 37, 92–95. (In Chinese) [Google Scholar]
  30. Su, Y.; Chen, X.; Li, Y.; Liao, J.; Ye, Y.; Zhang, H.; Huang, N.; Kuang, Y. China’s 19-year city-level carbon emissions of energy consumptions, driving forces and regionalized mitigation guidelines. Renew. Sustain. Energy Rev. 2014, 35, 231–243. [Google Scholar] [CrossRef]
  31. Wang, H.; Ji, G.; Xia, J. Analysis of Regional Differences in Energy-Related PM2.5 Emissions in China: Influencing Factors and Mitigation Countermeasures. Sustainability 2019, 11, 1409. [Google Scholar] [CrossRef] [Green Version]
  32. Xia, H.; Wang, H.; Ji, G. Regional Inequality and Influencing Factors of Primary PM Emissions in the Yangtze River Delta, China. Sustainability 2019, 11, 2269. [Google Scholar] [CrossRef] [Green Version]
  33. Zeng, Z.; Liu, J.; Savenije, H.H. A simple approach to assess water scarcity integrating water quantity and quality. Ecol. Indic. 2013, 34, 441–449. [Google Scholar] [CrossRef]
  34. Yan, X.; Bao, Z.; Zhang, J.; Wang, G.; He, R.; Liu, C. Quantifying contributions of climate change and local human activities to runoff decline in the upper reaches of the Luanhe River basin. J. Hydro-Environ. Res. 2020, 28, 67–74. [Google Scholar] [CrossRef]
  35. Caracciolo, D.; Pumo, D.; Viola, F. Budyko’s based method for annual runoff characterization across different climatic areas: An application to United States. Water Resour. Manag. 2018, 32, 3189–3202. [Google Scholar] [CrossRef]
  36. Ji, G.; Wu, L.; Wang, L.; Yan, D.; Lai, Z. Attribution Analysis of Seasonal Runoff in the Source Region of the Yellow River Using Seasonal Budyko Hypothesis. Land 2021, 10, 542. [Google Scholar] [CrossRef]
  37. Zhang, X.; Dong, Q.; Cheng, L.; Xia, J. A Budyko-based framework for quantifying the impacts of aridity index and other factors on annual runoff. J. Hydrol. 2019, 579, 124224. [Google Scholar] [CrossRef]
  38. Wu, J.; Miao, C.; Wang, Y.; Duan, Q.; Zhang, X. Contribution analysis of the long-term changes in seasonal runoff on the Loess Plateau, China, using eight Budyko-based methods. J. Hydrol. 2017, 545, 263–275. [Google Scholar] [CrossRef]
  39. Zhang, D.; Cong, Z.; Ni, G.; Yang, D.; Hu, S. Effects of snow ratio on annual runoff within the Budyko framework. Hydrol. Earth Syst. Sci. 2015, 19, 1977. [Google Scholar] [CrossRef] [Green Version]
  40. Choudhury, B.J. Evaluation of an empirical equation for annual evaporation using field observations and results from a biophysical model. J. Hydrol. 1999, 216, 99–110. [Google Scholar] [CrossRef]
  41. Yang, H.; Yang, D.; Lei, Z.; Sun, F. New analytical derivation of the mean annual water-energy balance equation. Water Resour. Res. 2008, 44, W03410. [Google Scholar] [CrossRef]
  42. Xu, X.; Yang, D.; Yang, H.; Lei, H. Attribution analysis based on the Budyko hypothesis for detecting the dominant cause of runoff decline in Haihe basin. J. Hydrol. 2014, 510, 530–540. [Google Scholar] [CrossRef]
  43. Gao, J.; Jiao, K.; Wu, S. Investigating the spatially heterogeneous relationships between climate factors and NDVI in China during 1982 to 2013. J. Geogr. Sci. 2019, 29, 1597–1609. [Google Scholar] [CrossRef] [Green Version]
  44. Guo, L.; Zuo, L.; Gao, J.; Jiang, Y.; Zhang, Y.; Ma, S.; Zou, Y.; Wu, S. Revealing the Fingerprint of Climate Change in Interannual NDVI Variability among Biomes in Inner Mongolia, China. Remote Sens. 2020, 12, 1332. [Google Scholar] [CrossRef] [Green Version]
  45. Li, J.; Peng, S.; Li, Z. Detecting and attributing vegetation changes on China’s Loess Plateau. Agric. For. Meteorol. 2017, 247, 260–270. [Google Scholar] [CrossRef]
Figure 1. The location of hydrological and meteorological stations in and around the source region of the Yangtze River Basin.
Land 10 00612 g001
Figure 2. Change trend of annual runoff (a) at Zhimenda hydrological station and NDVI (b) in the SAYR.
Land 10 00612 g002
Figure 3. Variation trend of average precipitation (a) and average potential evaporation (b) in the SAYR.
Land 10 00612 g003
Figure 4. Mann–Kendall mutation test result of runoff in the SAYR from 1982 to 2016.
Land 10 00612 g004
Figure 5. Mann–Kendall mutation test result of NDVI in the SAYR from 1982 to 2016.
Land 10 00612 g005
Figure 6. Change trend of precipitation elasticity, potential evapotranspiration elasticity, and underlying surface parameter elasticity of runoff in the SAYR from 1982–2016.
Land 10 00612 g006
Table 1. Eigenvalues of meteorological and hydrological variables in the SAYR.
Hydrological StationPeriodET0/mmR/mmP/mm ω R/PET0/P
Zhimenda1982–2004831.7490.57386.351.250.232.15
2005–2016852.93115.06425.291.180.272.01
Table 2. Attribution analysis of runoff variation in the SAYR.
Hydrological StationεPεET0εω Δ R ΔP ΔET0 Δω ΔRP ΔRET0 ΔRLηRPηRET0ηRH
Zhimenda1.90−0.90−1.5424.4938.9421.19−0.0718.34−2.2624.1475.98%−9.35%33.37%
Table 3. Attribution analysis of vegetation change in the SAYR.
Fitting Equation N D V I ¯ N D V I T 1 ¯ N D V I T 2 , S ¯ N D V I T 2 ¯ η N D V I C   ( % ) η N D V I H   ( % )
NDVI = 1.7912 × 10⁻³P + 7.1204 × 10⁻⁴ET0 + 0.1057 (R2 = 0.68)0.01970.21220.21980.231938.5661.44
Publisher’s Note: MDPI stays neutral with regard to jurisdictional claims in published maps and institutional affiliations.

