Article

Cultivated Land Use Zoning Based on Soil Function Evaluation from the Perspective of Black Soil Protection

1
School of Land Science and Technology, China University of Geosciences, Beijing 100083, China
2
College of Resources and Environment, Shandong Agricultural University, Taian 271018, China
3
Key Laboratory of Land Consolidation and Rehabilitation, Ministry of Natural Resources, Beijing 100035, China
4
Technology Innovation Center of Land Engineering, Ministry of Natural Resources, Beijing 100083, China
*
Author to whom correspondence should be addressed.
These authors contributed equally to this work.
Land 2021, 10(6), 605; https://doi.org/10.3390/land10060605
Submission received: 28 April 2021 / Revised: 2 June 2021 / Accepted: 4 June 2021 / Published: 7 June 2021
(This article belongs to the Special Issue Soil Management for Sustainability)

Abstract

:
Given that cultivated land serves as a strategic resource to ensure national food security, blind emphasis on improvement of food production capacity can lead to soil overutilization and impair other soil functions. Therefore, we took Heilongjiang province as an example to conduct a multi-functional evaluation of soil at the provincial scale. A combination of soil, climate, topography, land use, and remote sensing data were used to evaluate the functions of primary productivity, provision and cycling of nutrients, provision of functional and intrinsic biodiversity, water purification and regulation, and carbon sequestration and regulation of cultivated land in 2018. We designed a soil function discriminant matrix, constructed the supply-demand ratio, and evaluated the current status of supply and demand of soil functions. Soil functions demonstrated a distribution pattern of high grade in the northeast and low grade in the southwest, mostly in second-level areas. The actual supply of primary productivity functions in 71.32% of the region cannot meet the current needs of the population. The dominant function of soil in 34.89% of the area is water purification and regulation, and most of the cultivated land belongs to the functional balance region. The results presented herein provide a theoretical basis for optimization of land patterns and improvement of cultivated land use management on a large scale, and is of great significance to the sustainable use of black soil resources and improvement of comprehensive benefits.

1. Introduction

Soil provides basic services for maintaining and guaranteeing agricultural production, plant growth, animal habitats, biodiversity, and environmental quality, and is one of the core elements linking the entire natural ecosystem [1]. Soil is the key foundation for cultivated land to perform its functions, a limited resource essential to the maintenance and sustainable use of land, and essential for cultivated land to have multifunctional roles [2]. Agriculture is facing the challenge of increasing primary productivity to meet the growing global demand for food security [3]. However, most of the soil resources in the world are in a barren or worse state, and one third of cultivated land is moderately or highly degraded [4]. The total amount of cultivated land resources in China is only 135 million ha, and the per capita cultivated land is only 0.30 ha, which is lower than the world’s per capita level of 0.37 ha; thus, China is facing a serious shortage of cultivated land [5]. The cultivated land area of black soil in Northeast China accounts for 27% of China’s total cultivated land [6], and the total grain output accounts for 25% of China’s total output. However, commodity grain accounts for 33% of China’s agricultural production. Because of long-term and high-intensity utilization, cultivated land resources in the black soils area have been overdrawn for a long time, and the excessive input of chemical fertilizers and pesticides has broken the original stable micro-ecological system of the black soils. The degradation of soil functions like soil biodiversity, nutrient maintenance, carbon storage, buffering, and water purification and regulation has become a shortcoming that restricts the improvement of regional food production capacity and sustainable agricultural development and poses a serious threat to national food security in Heilongjiang province [7]. In China, the Ministry of Natural Resources conducts surveys and evaluations of the quality of agricultural land and the Ministry of Agriculture and Rural Affairs evaluates the quality of cultivated land. These agencies have formed a farmland resource evaluation system that takes the county as the project unit and the field as the evaluation unit and summarizes the results at the provincial and national scales, providing a solid foundation for the utilization and management of cultivated land. However, these tasks were restricted by the scientific methods and protection concepts of the time. This is because they ignored the general principle of scales in land quality evaluation. Specifically, there were problems of mixed scales, and it was difficult to describe scales accurately and quickly above the county level. This situation cannot meet the management needs of different levels. Additionally, the two sets of plans mainly characterize the production potential and serve cultivation. However, they have insufficient consideration of soil function and soil environmental conditions, and the research results have a single effect, which makes it difficult to serve the current multi-target soil health management and protection. As a result, a relatively new practice to fulfil this goal has emerged in which researchers have begun to calculate multiple soil functions to guide the sustainable use of cultivated land [8].
Soil function indicates a soil-based ecosystem service that consists of a series of soil processes that support the provision of ecosystem services and contribute to the production of goods and services that are beneficial to human social requirements and the environment [9]. The carbon, nitrogen, water, and biological reservoirs in soil make a significant contribution to the sustainability of the earth [10]. The core of ecosystem processes is the biogeochemical cycles of carbon, nitrogen, and water. Understanding and evaluating the natural capital savings of soil from the perspective of ecosystem service functions can improve the resource utilization efficiency of production activities [11]. The core of ecosystem processes is the biogeochemical cycle of carbon, nitrogen and water. Understanding and evaluating the natural capital savings of soil from the perspective of ecosystem service functions can improve the resource utilization efficiency of production activities [12], by increasing the ability of soil to retain water and fertilizer and preventing soil erosion, both of which increase and stabilize crop yields. In addition, increasing soil carbon storage helps slow climate change [13]. The nutrient cycle represented by the nitrogen cycle provides nutrient support for the production of biomass [14]. Ecosystem services related to the soil water cycle include food and water security supply services, soil storage water and purification water flow regulation services and support services [15]. Soil biodiversity is closely related to the formation of ecosystem services [16]. Soil ecological services comprise supporting services for biological production, habitat, species, and genetic diversity, services providing nutrients, water, and mineral raw materials, and services that regulate water, the carbon cycle, and greenhouse gas emissions, as well as services that preserve the soil landscape and cultural relics [17]. Therefore, the ability of soils to provide multiple ecosystem functions simultaneously is known as soil ecosystem multifunctionality [18,19], which provides a simple metric to assess the overall functioning of ecosystems or treatments [20]. However, there is still no consensus on the quantitative standards and methods for the versatility of ecosystems. This is mainly because of the structural complexity and functional diversity of ecosystems [21]. Soil function and its ecosystem service are used when evaluating soil quality for land use and management [9]. If one or more soil functions are restricted, soil quality may be threatened by compaction, erosion, loss of biodiversity and organic matter, salinization, pollution, or desertification, which influences the rational utilization and protection of the soil.
There is currently no soil function classification and evaluation system in the world. The European Commission’s soil protection strategy was an important initiative that brought the concept of soil functions to the attention of the wider public and placed the concept on the political agenda. Seven soil functions were defined in the strategy: (i) production of food and biomass, (ii) storage, filtering, and transformation of compounds, (iii) habitats for living creatures and gene pools, (iv) the physical and cultural environment, (v) a source of raw materials, (vi) a carbon pool, and (vii) archives of geological and archaeological heritage [22]. Guerra et al. described and analyzed four soil ecosystem functions across soil macroecological studies and 17,186 sampling sites: (i) decomposition, (ii) soil respiration, (iii) nutrient cycling, and (iv) water infiltration [23]. Schulte et al. classified soil functions into five categories: primary productivity, water purification and regulation, carbon sequestration and regulation, provision of functional and intrinsic biodiversity, and nutrient supply and circulation [24]. In 1997, Zhao Qiguo et al. pointed out that soil quality evaluation in agricultural systems should take soil function as a central task, but mainly focus on the evaluation of soil production functions [5]. Based on the classification of ecosystem service function types, the classification of soil functions can be continuously improved, the characterization indicators of soil functions can be selected, and the indicators can be classified and interpreted [25,26]. Under the precondition of being in favor of protection of soil functions, most soil evaluations conducted to date have been based on individual or comprehensive evaluations of soil functions through reasonable selection of evaluation methods [27,28,29,30]. For example, Thoumazeau et al. proposed an integrated indicator set, Biofunctool®, to evaluate the impact of agricultural land management on soil functions. This set consists of 12 rapid and economical field indicators, including soil active organic carbon, soil basic respiration, earthworm activity, available nitrogen, and infiltration rate and stability of soil aggregates, to assess three dynamic soil functions; namely, carbon conversion, nutrient cycling, and structure maintenance [31,32]. In terms of the integration of multiple function evaluation results, Schulte et al. conceptually described the cooperative weighing of soil functions of various land use types such as cultivated land, forest land, and grassland based on the theory of functional soil management [24,33]. Land use types have different requirements for various soil functions. In terms of evaluation indicators and their weights, prior knowledge such as literature and expert experience is important for the selection of indicators and determination of weights [3]. The Delphi method and analytic hierarchy process commonly used in previous studies are typical applications of traditional expert systems. However, these methods are often criticized for being more subjective [34]. Poorly subjective methods can also be used in practical applications, such as meta-analysis or structural equation modeling [23,35]. The soil functions of cultivated land mainly involve five aspects that contribute to increased agricultural productivity and provide other regulatory and supportive ecosystem services: primary productivity, provision and cycling of nutrients, provision of functional and intrinsic biodiversity, water purification and regulation, and carbon sequestration and regulation [8]. In other countries, the theoretical framework, index selection, and standardization of soil function evaluation, and the mapping method of evaluation results have been relatively systematic [36,37], providing a reference for the development of soil multifunctionality evaluation and change analysis in China [38,39,40,41,42,43,44]. Existing studies on large scale soil function are still slightly inadequate in China. Therefore, we have taken Heilongjiang province as our research area, selecting evaluation indicators according to local conditions, establishing a soil function evaluation model to reveal regional differences in soil functions and providing references for the sustainable use of land resources and the formulation of cultivated land protection policies based on evaluation of the supply and demand of soil functions. The specific purposes of this article are to: (A) evaluate the soil function of paddy fields and dry land in Heilongjiang province and the current situation of supply and demand by using the multi-factor comprehensive evaluation method and analyzing the main restrictive factors of the soil function in each region; and (B) divide the cultivated land use function region guided by the dominant function of soil, combine this with analysis of soil function restriction, and put forward corresponding utilization optimization and regulation suggestions for different areas. The research frame diagram is shown in Figure 1.

2. Materials and Methods

2.1. Study Area

Being in the northernmost location and highest latitude in China (Figure 2), Heilongjiang province is a vast area, with a high biodiversity environment, diverse landform types, rich natural resources, and a large area of fertile black soil. The province has a total land area of 47.07 million ha, which accounts for 4.9% of China, making it the sixth largest province in the country. Because of its large area of cultivated land per capita, Heilongjiang province is an important agricultural province in China. Given that the plains are flat and open with high soil nutrient content, good agricultural cultivation conditions, and high concentrated and contiguous cultivated land, the region is suitable for large-scale mechanized operations [45]. The cultivated land quality in the Songnen Plain and Sanjiang Plain ranks first in China, with the black soil area accounting for about 33% [46]. Heilongjiang province contains the highest proportion of black soil in China, and nearly 30% of the high-quality cultivated land is located in the black soil area of Northeast China. It is primarily underlaid by Black soil, Meadow soil, Dark brown soil, Albic soil, Chernozem soil, and Chestnut soil. The black soil is loose and high in organic matter content, making it suitable for cultivation. Nevertheless, the recent rapid development of urbanization in Heilongjiang province has had adverse effects on land in the region, causing serious erosion and desertification [47]. Moreover, because of the vast area and the unreasonable structure of cultivated land utilization, the cultivated land use pattern urgently needs to be optimized.

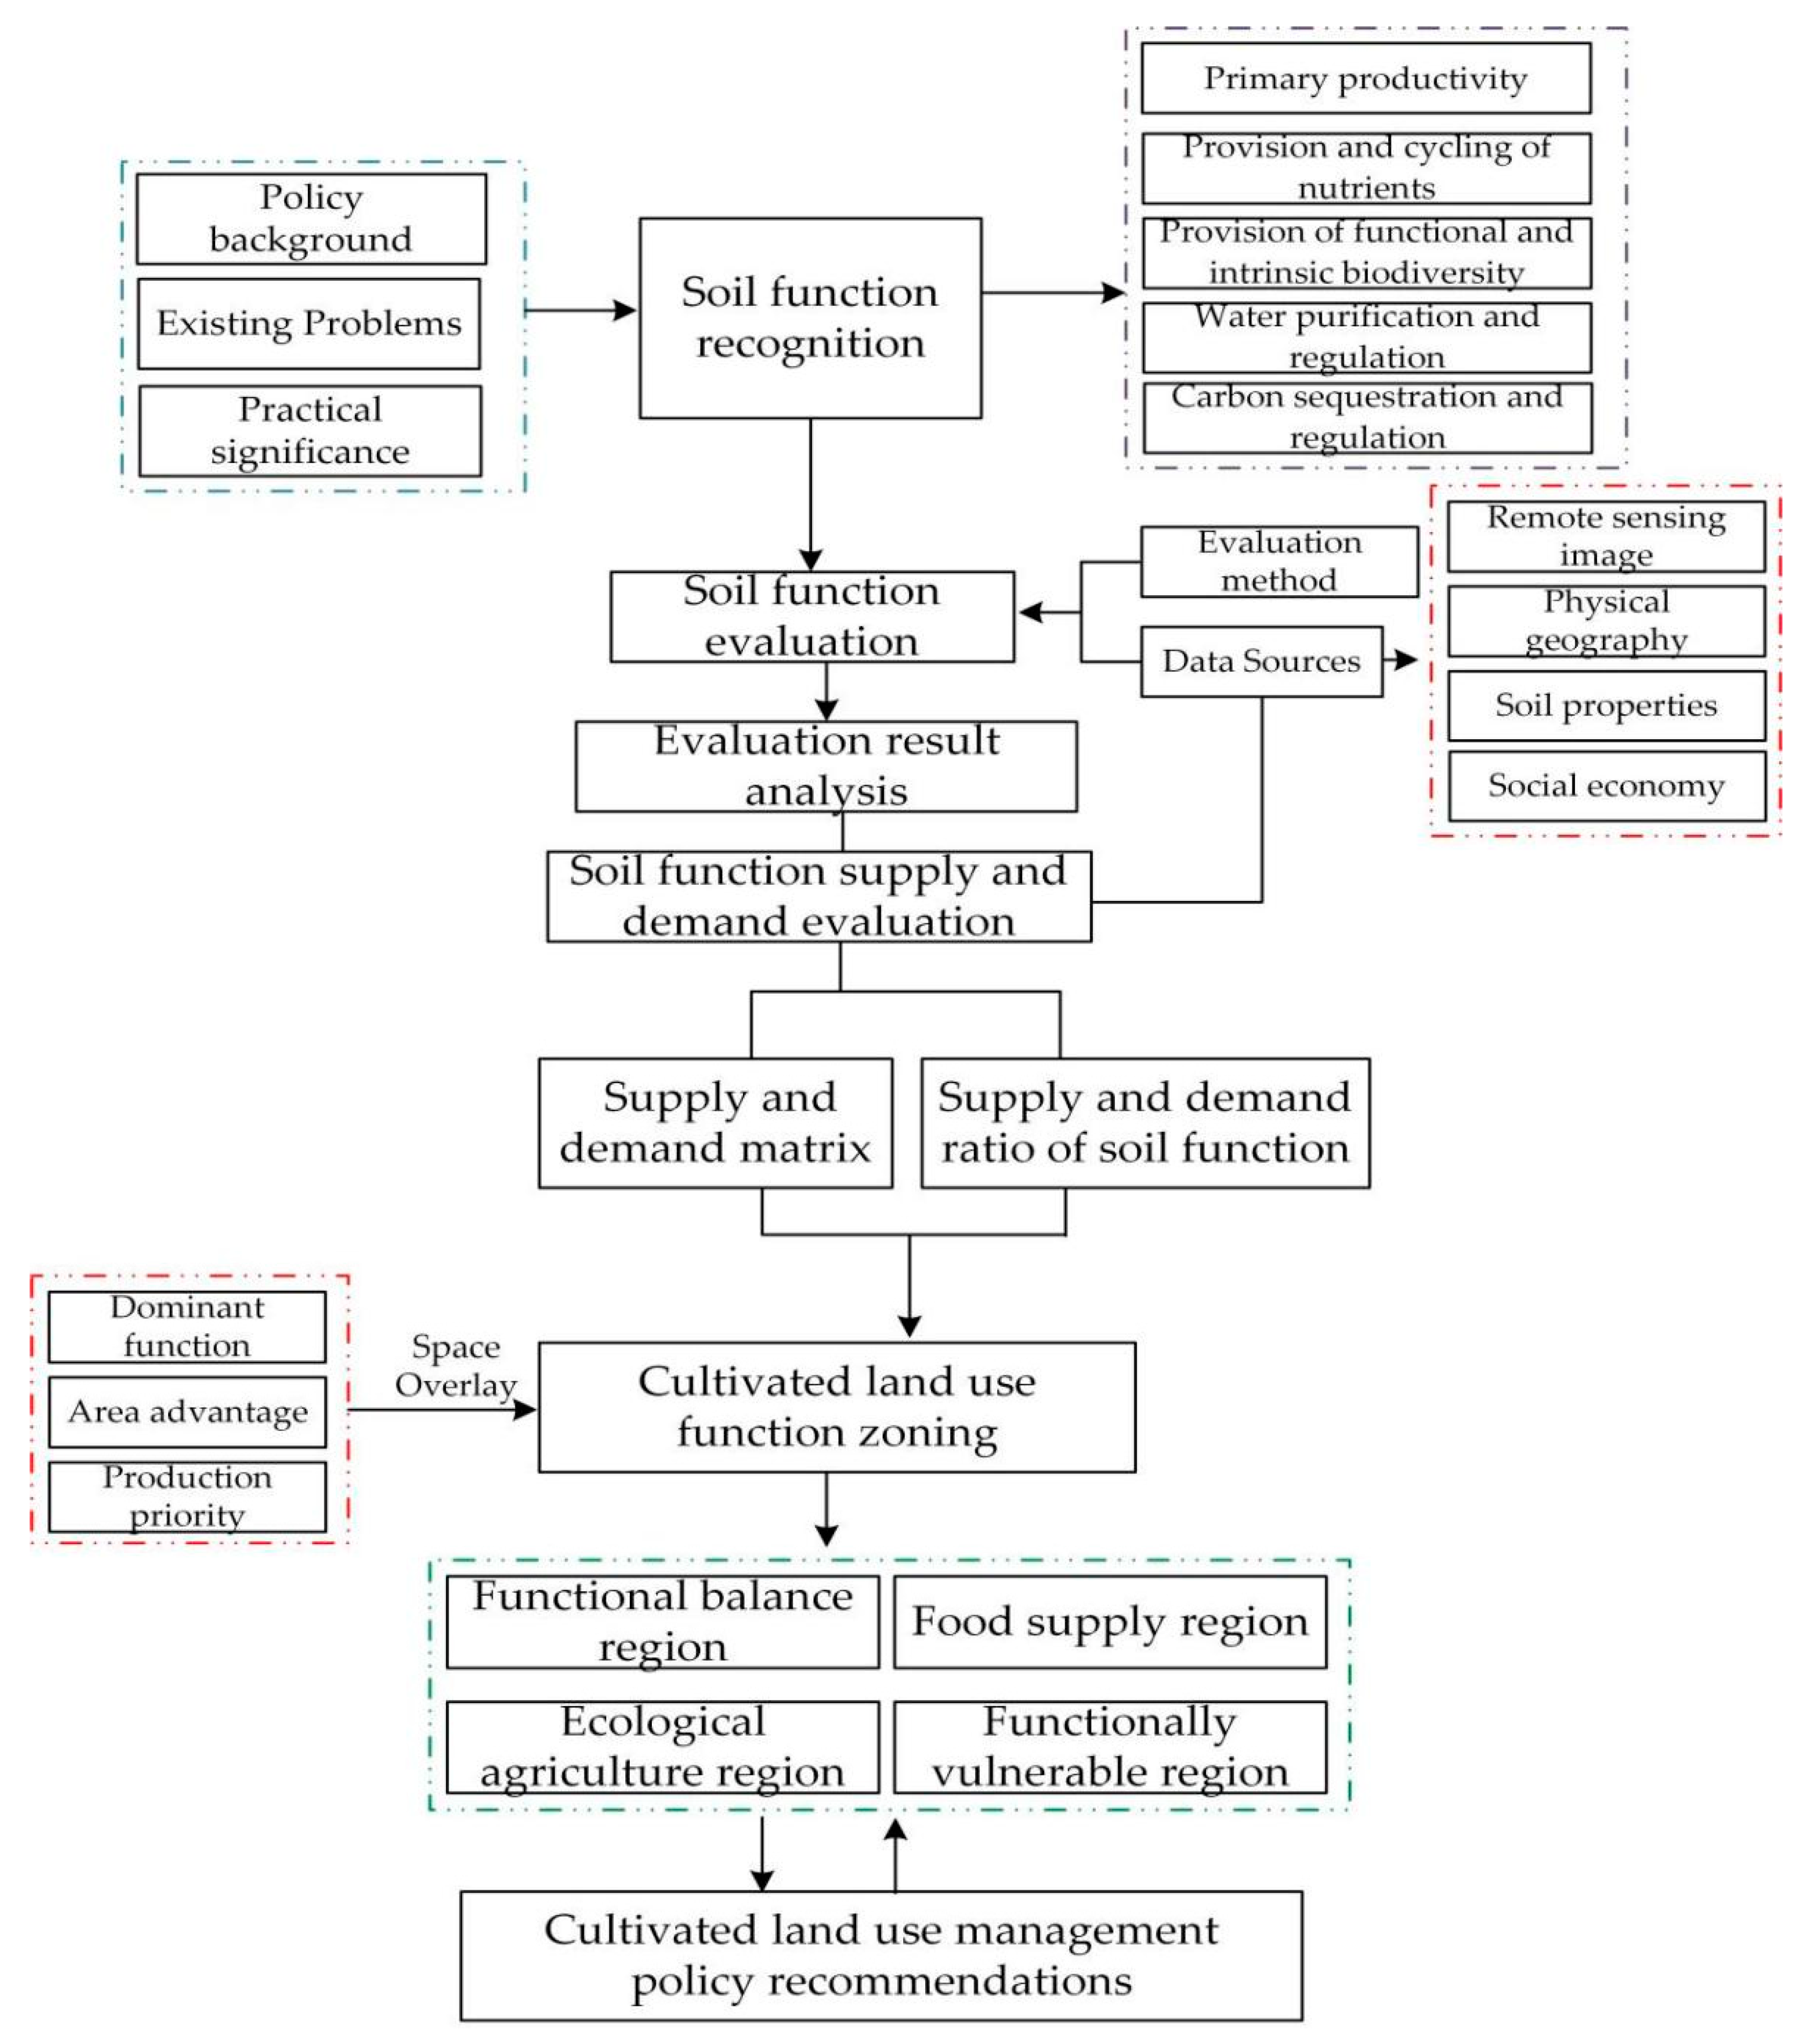
2.2. Construction of an Evaluation Method System of Soil Function

2.2.1. Construction of Evaluation Indicator System at the Provincial Scale

The primary productivity function is the ability of soil to produce plant biomass for human use and to provide food, feed, fiber, and fuel within the boundaries of natural or managed ecosystems [48]. The water purification and regulation function is the ability of the soil to absorb, store, and transport water for later use, prevent long-term drought, floods, and soil erosion, and remove harmful compounds from water [49]. The carbon sequestration and regulation function is the ability of soil to store carbon in an unstable form with the purpose of slowing down the increase in the concentration of carbon dioxide in the atmosphere [50]. The provision of functional and intrinsic biodiversity function includes numerous soil biological processes. Soil can provide habitats for animals, plants, and microorganisms, supporting their life activities and protecting biodiversity [51]. The function of provision and cycling of nutrients indicates the ability of soil to absorb and maintain nutrients, produce and retain the nutrients absorbed by crops, promote soil biochemical processes, and provide and retain nutrients [52]. We constructed a provincial-scale soil function evaluation indicator system for cultivated land (Table 1) based on existing large- and medium-scale soil function evaluation indicator systems [53,54,55] that considered the availability of data and was founded on the principles of stability, dominance, spatial variability, regionality, and systemicity [56,57]. Due to difficulty obtaining soil biological data, we indirectly characterized the large-scale soil biological diversity from the perspective of the suitability of the soil biological habitat and the suitable soil conditions for biological survival [58,59]. However, during practical evaluation and application, these indicators can be combined with necessary supplements or simplifications according to the actual data collection of the study area. It is important to note that the five soil function models show overlap in terms of data input. For example, soil organic carbon supports multiple soil ecosystem functions that are underpinned by processes such as C sequestration, N mineralization, aggregation, promotion of plant health, and compound retention [60]. Soil organic carbon is considered to be an important indicator for monitoring soil degradation and soil erosion because it affects soil aggregation and stability [61], and is the primary component influencing soil fertility [62]. Soils with higher organic carbon contents have better buffering and a stronger capacity to preserve soil water and fertilizer [63], and the amount of soil carbon sequestration is principally reflected in the soil organic carbon content [64]. In addition, increasing soil organic carbon in agricultural soils can enhance a myriad soil biological processes [60]. Therefore, soil organic carbon is input into all five function models. This creates interconnections between soil functions as observed in the field; however, the threshold values and decision rules used to assess the input attributes are unique for each model [65]. As several indicators use the same input variables, statistical correlations among indicators are expected.

2.2.2. System for Evaluation of Soil Function Supply and Demand

Soil function is transferred from cultivated land ecosystems to social economic systems for utilization by humans, and the functional service flow is considered the actual supply. Human demand is formed by the consumption and use of products and services produced by soil functions. When there is small human demand or a high soil function, the soil function enables satisfaction of human demand (actual supply is greater than or equal to human demand). When human demand for the utilization of soil function is beyond its capacity, the actual supply will be less than or equal to human needs. The actual supply of soil functions can be employed by human society. To meet human requirements, however, the actual supply of soil functions may exceed its own capacity. A demand matrix was then assigned through the supply capacity of soil functions and human demand for soil functions to spatially support evaluation of the status of the supply and demand of soil functions, and select the indicator of “supply-demand ratio” to explain the surplus relationship between actual supply and demand, that is, whether the actual supply of soil functions enables us to meet the current requirements of human society [8].

2.3. Collection and Processing of Basic Data

Remote sensing data primarily consisted of Landsat satellite remote sensing data and the Normalized Differential Vegetation Index (NDVI). The remote sensing data of Heilongjiang land use stems from the geospatial data cloud, and collected Landsat 8 remote sensing data from September 2018. After acquiring the images, the ENVI 5.1 software was applied for splicing, radiometric calibration, atmospheric correction, geometric correction, mosaic cutting, remote sensing interpretation, and supervision classification of images to six types of land use: cultivated land, woodland, grassland, water area, urban and rural, industrial and mining, residential, and unused with the Kappa coefficients of 0.84 to meet the demand for accuracy [66]. NDVI data originated from NASA, and vegetation index data was processed in a linear manner to acquire the standard vegetation index. Meteorological data such as rainfall and accumulated temperature originated from the National Meteorological Science Data Sharing Service Platform, while soil data including the CEC, pH, gravel content, soil organic carbon, and bulk density were acquired from SoilGrids (https://soilgrids.org), while soil texture, soil thickness, available soil moisture, and base saturation were obtained from the Harmonized World Soil Database. Terrain data were mainly digital elevation data (DEM) derived from the geospatial data cloud. The grid method was applied to divide the evaluation unit in the research, and the cultivated land spot was extracted from the land use status map in 2018 after image interpretation, with a 1 × 1 km grid to sample the study area at equal intervals. ArcGIS 10.6 was employed to merge small map spots to generate 134,449 evaluation units. To facilitate subsequent evaluation and analysis, each unit was given a unique identification code.

2.4. Evaluation Indicator Gradation System

The optimal gradation and assignment of each indicator lies in a value of 100 points, with the worst value being 60 points, and the others referring to the classification standards of cultivated land quality in the northeast reported in “Cultivated Land Quality Gradation” (GB/T 33469-2016), “Agricultural Land Quality Gradation Regulations” (GB/T 28407-2012), and the gradation and assignment methods described in related studies [67,68,69]. The value was assigned in accordance with the degree of impact of indicators on soil functions and adjusted based on the foundation of the actual situation of the study area. The soil function supply matrix proposed by Coyle et al. represents the supply proportion (grid size) of five soil functions of different land use types [70], with the horizontal axis indicating land use type and the vertical axis five soil functions, white for primary productivity, purple for provision and cycling of nutrients, blue for water purification and regulation, green for provision of functional and intrinsic biodiversity, and dark gray for carbon sequestration and regulation (Figure 3). This matrix was used as a reference to determine the proportion of cultivated soil functions in this study.
The importance between two indicators was determined in combination with the opinions of five experts and the differences in accordance with the relevant literature. The solution to the article was to use a weighted average to assign the scoring value of each level of expert, and constructed the judgment matrix to ensure that the restrictions of each indicator and the total sorts and the single hierarchical arrangement passed the consistency test (random conformance rate, CR < 0.1) to gain the gradation and assignment and weight of evaluation indicators shown in Table 2.

2.5. Soil Function Evaluation Model

The multi-factor comprehensive evaluation method was employed to establish a soil function evaluation model of cultivated land:
C i = i = 1 n F ij   W ij
where Ci indicates the comprehensive evaluation score of the i-th evaluation unit; Fij is the score of the j-th evaluation indicator of the i-th evaluation unit; Wij is the weight of the j-th evaluation factor of the i-th evaluation unit. The soil function evaluation results were divided into three levels using Jenks natural breaks classification, with the highest quality being the first-level function and the worst quality the third-level function.

2.6. Supply and Demand Ratio of Soil Function

The supply and demand matrix of soil function was established with reference to the ecosystem service matrix method, with the soil function evaluation results as the actual supply of soil functions and application of the following five-point system to the supply of paddy fields and dry land: 1 = low supply capacity, 2 = general supply capacity, 3 = medium supply capacity, 4 = high supply capacity, 5 = very high supply capacity.
First-level soil function supply is assigned 5 points, second-level 3 points, and third-level 1 point. By employing the ecosystem service valuation method and the Delphi method [71], a five-point system was assigned to the soil function requirements of the two types of cultivated land (dryland and paddy field) based on expert knowledge, targeting interviews, and statistical data, with 1 to 5 representing low to high demand. In accordance with the results of supply and demand assignments, a supply and demand evaluation matrix of cultivated soil function was then constructed (Figure 4).
The supply-demand ratio refers to whether the total amount of soil function in a certain area can meet the demand, reflecting the balance between the actual supply and demand of soil function. The supply and demand of cultivated land function is classified into three types based on the supply-demand ratio: full satisfaction, general satisfaction, and dissatisfaction.
The supply–demand ratio of soil function = human needs/actual supply
A supply-demand ratio of soil function of less than 1 suggests a surplus state in which the supply of soil function can meet the demand, while a supply-demand ratio of 1 indicates a balanced condition in which the supply of soil function enables basic satisfaction of the demand, and a supply-demand ratio of more than 1 indicates a loss status in which the function of soil supply is unable to meet the demand.

3. Results

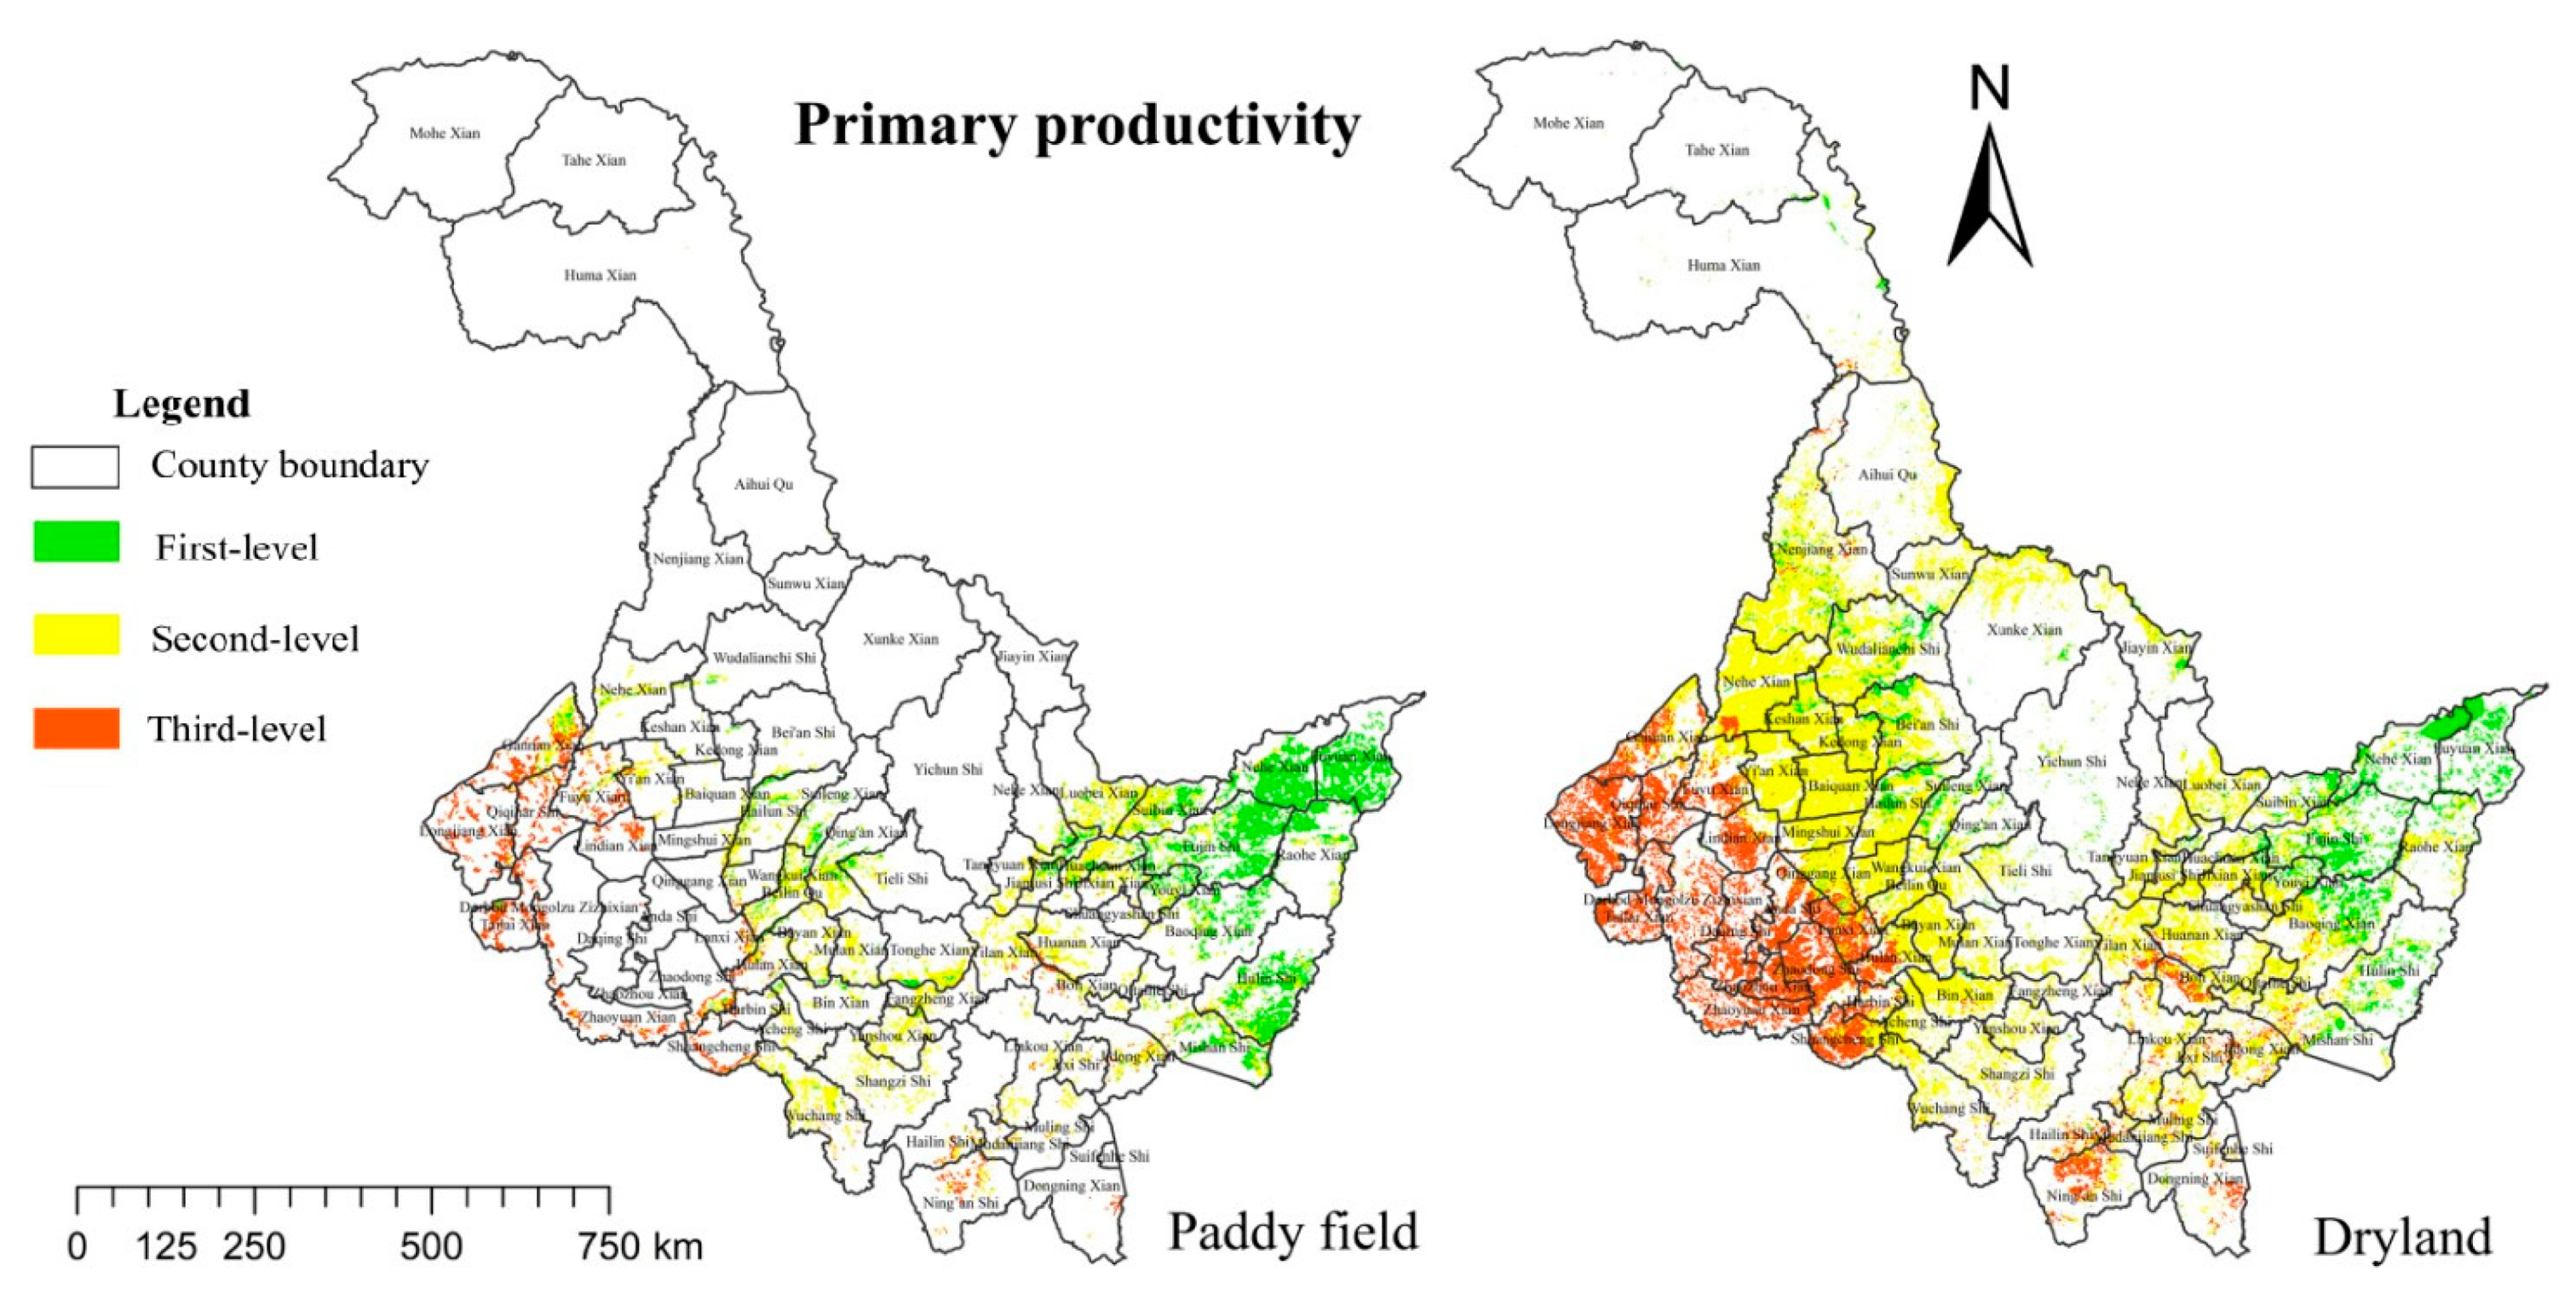
3.1. Analysis of Evaluation Results of Cultivated Land Soil Function

(1) The function of primary productivity
The second-level function dominated the paddy fields and drylands, accounting for 46.36% and 53.52%, respectively. As shown in Figure 5, there were second-level function areas scattered in the central part and some counties and cities in the south and north, first-level areas located in the cities of Hulin, Baoqing, Fujin, Raohe, Tongjiang, and Fuyuan County in the northeast, as well as parts of Suileng County, Hailun, and Bei’an in the central part, and third-level districts concentrated in the 15 counties and cities in the southwest and a small area of Ning’an and Dongning County in the southwest. The primary productivity was found to be principally influenced by indicators of slope, soil texture, soil thickness, and pH. Owing to the sticky soil texture, poor drainage, and excessive soil moisture in the southwestern region, the available nutrients are not easily released, resulting in low soil fertility and the accumulation of salt in the soil surface. This leads to intensified soil salinization, high pH, and alkaline soil [72]. There are more sandstorms and droughts in the western region, which causes serious soil erosion and a thin soil layer, resulting in soils not conducive to cultivated production [73]. The southeast is hilly, and most of the cultivated land has a slope of more than 5°, which is subject to sloping ridge-tillage and longitudinal ridge-tillage. This practice, coupled with excessive development and utilization by humans, has resulted in serious soil erosion in the southeast region, therefore, the soil is characterized by stripped topsoil, a thin soil layer, and descending fundamental fertility.
(2) The function of provision and cycling of nutrients
Most land in paddy fields and dry land were second-level function, followed by first-level function, and then third-level function. The third-level zone is distributed in the southwest, and the main influencing factor is CEC, that is, soil with high CEC enables the retention of more nutrients and exertion of better cushioning performance than that with low CEC (Figure 6). There were some third-level zones, especially in the area bordering Inner Mongolia, which is characterized by frequent windy weather year round, a dry climate, and low rainfall. In recent years, deforestation and overgrazing have resulted in serious soil desertification and low CEC in desertified areas, which has impacted the circulation and storage of soil nutrients [74].
(3) The function of provision of functional and intrinsic biodiversity
The provision of functional and intrinsic biodiversity in paddy fields and drylands demonstrated a decreasing spatial distribution pattern from northeast to southwest (Figure 7). This function was primarily affected by pH and annual accumulated precipitation, and the suitable pH range is an imperative condition for the survival of animals and plants. The soil types in the southwestern part consisted of meadow chernozem, hydrochloride meadow soil, and hydrochloride chernozem, with the average pH ranging from 8 to 8.5, showing strong alkalinity and low nutrient content. Additionally, the low annual accumulated precipitation in the southwest is unable to meet the requirements of animal and plant survival. Land utilization methods influence the composition of soil biological communities [74], and paddy soil can provide soil organisms with a more stable source of nutrients such as water and organic carbon sources. In addition, paddy soil holds more soil biomass than dry land soil, which suggests that paddy soil biodiversity is slightly better than that of dry soil [75].
(4) The function of water purification and regulation
Water purification and regulation functions in most areas of paddy fields and dry land are at a high level (Figure 8). The first-level area had the widest range, primarily distributed in the central, northeastern, and most of the northwestern areas of the province. The second and third-level area was mainly scattered in the north of Ning’an, the east of Shuangcheng, the middle of Boli County, the west of Longjiang County, and the northeast of Fuyu County. As the prime factor, soil organic carbon and available soil moisture were the main influencing factors, and higher organic carbon content contributes to the purification and buffering function [76]. When compared with dryland soil, paddy field soil has stronger carbon sequestration ability and organic carbon content, as well as more stable soil natural water content. The content of organic carbon and available soil moisture in the southwest was lower than the overall average level of the study area, and the unequal water and heat and seasonal rainfall have caused serious soil erosion, desertification, and thinning of the soil layer, which will affect the functional performance of water purification and regulation.
(5) The function of carbon sequestration and regulation
The first-level of carbon sequestration and regulation districts were principally distributed in the cities of Tongjiang, Fujin, Hulin, and Mishan, as well as Raohe County, Fuyuan County, and Baoqing County in the northeast, and part of the cities of Wudalianchi, Bei’an, and Hailun as well as Suileng County in the middle. The second-level area was concentrated in the middle, south, and north, while the third-level area includes most of the southwest and a small part of the south (Figure 9). Cultivated land utilization is an important factor of human activities that affects the carbon cycle of soil ecosystems, and there are significant differences in soil organic carbon content under different cultivated methods. Some studies have shown that rice has the best ability to absorb carbon and produce oxygen among the main crops per unit area, resulting in an obvious carbon sequestration effect of paddy soil and high organic carbon content [77,78], and the organic carbon content serves as a significant factor. Sanjiang Plain is located in the northeast, where the soil conditions are better than those in the southwest because there is a large area of meadow soil and black soil that is soft, fertile, and rich in organic matter. Organic matter with high content can improve the structure of soil aggregates, increase the exchange capacity of soil ions, and strengthen the ability of soil to fix carbon and release oxygen. There is serious soil erosion in the southwestern region, and the existing research demonstrates that the low organic matter content and clay particles of eroded soil lead to the 20% lower carbon sequestration capacity than that of high-quality soil. Therefore, the spatial distribution law gradually decreased from northeast to southwest.
(6) Comprehensive Evaluation Results of Soil Function
The soil function gradation presented a spatial distribution pattern of high in the northeast and low in the southwest, with the third-level area distributed in a small portion in the south (Figure 10). This function predominated by the second-level area of soil function, which accounts for 46.59% of land area. The first-level area was mainly distributed in the east and northeast, and as well as in a small portion of the central part in strips, accounting for 28.56% with comprehensively unrestricted or low indicators and highly functional soil. The third-level area was scattered in 17 counties and cities in the southwest of Ning’an, the eastern part of Dongning County, and the intersecting part of the northern area of Boli County and the eastern part of Yilan County. The dry climate, low rainfall, and frequent windy weather year-round in the southwestern part has caused serious soil erosion and desertification. The soil types in this area include meadow chernozem, hydrochloride meadow soil, and hydrochloride chernozem, which have a high calcium carbonate content, average pH of more than 8, and strong alkalinity, as well as a low content of organic matter and micronutrient elements that influence the performance of soil function [79]. The northeast region is located in the Sanjiang Plain, which is characterized by small slopes, flat terrain, and balanced water and heat resources. The soil types in this region primarily consist of meadow soil and black soil, which are thick and fertile.

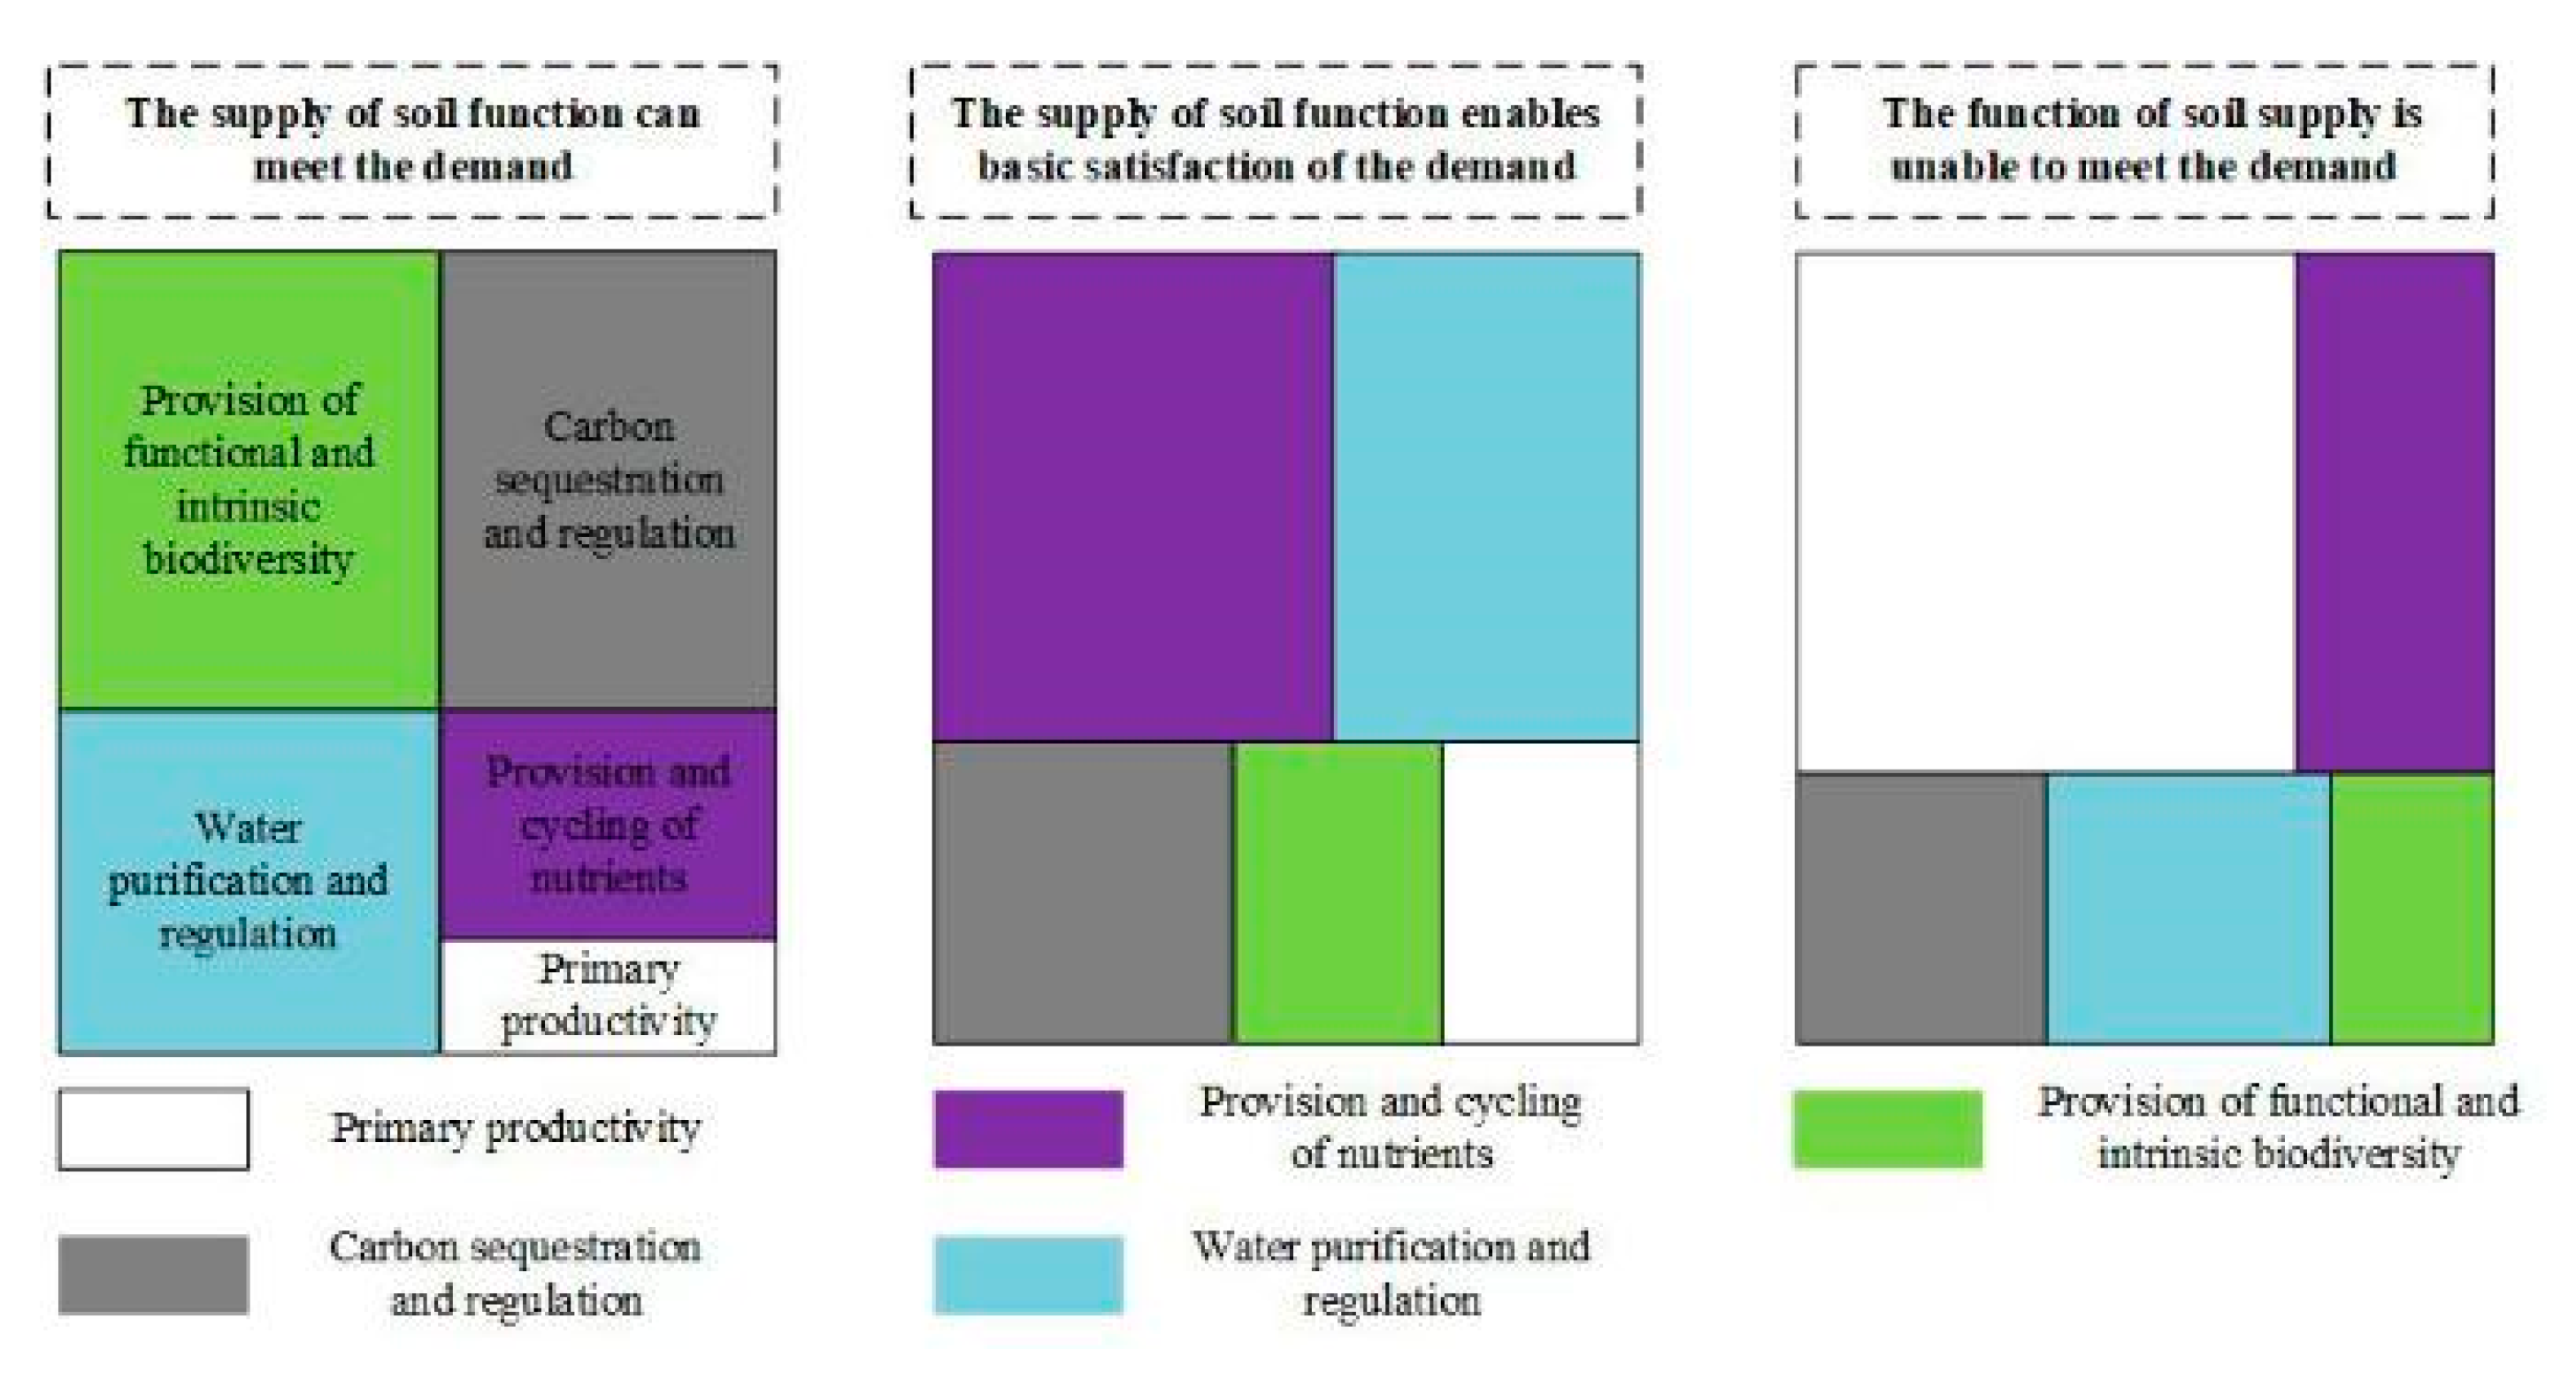
3.2. Soil Function Supply-Demand Ratio

Through regional statistics (Figure 11 and Figure 12), the supply and demand of primary productivity function was predominated by functional dissatisfaction, which accounted for 71.32%. This was followed by the functional satisfaction area, which was scattered in the east and occupies 17.00%. The spatial pattern of provision and cycling of nutrient functions showed a gradual increase from southwest to northeast, and the functional satisfaction area is primarily distributed in the northeast, which accounted for 39.39%. The zone of general satisfaction was found to be roughly the same as that of dissatisfaction, accounting for 29.03% and 31.58%, respectively, and this zone was concentrated in the southwest. The functional and intrinsic biodiversity function of 72.53% can satisfy the requirements of human society, while 13.00% scattered in the central and southern can basically meet this demand, and 14.47% was the functional dissatisfaction area, which was mainly distributed in the southwest. The spatial distribution of water purification and regulation functions and carbon sequestration and regulation functions showed the same trend, presenting a spatial pattern of high in the middle and low in the surrounding area. Overall, more than 50% had strong supply capacity to enable a surplus, while most of the southwestern region and a small part of the south had inferior supply capacity that resulted in a state of insufficient supply and weak functionality.
From a spatial point of view, the supply capacity of the five soil functions in the northeast was relatively strong and in a surplus state, while the supply and demand in the southwest and a small part of the southeast are out of balance and cannot meet the functional requirements. The main reason for this spatial distribution was that the northeast portion is in the Sanjiang Plain, where there is uniform water and heat, flat terrain, less erosion and soil-water loss, and a deep soil layer. Moreover, the region is dominated by a large area of black soil and meadow soil with a balanced acidity-alkalinity, rich nutrient storage, high organic carbon content, and strong water storage and fertilizer retention capacity, which is beneficial to the growth of animals and plants [80]. The main soil types in the southwestern region are aeolian sandy soil and saline-alkali soil. In some low-lying areas, standing water lies in the large area of sodic alkaline soil that bears high salt content and soil alkalinity as well as poor ventilation and water permeability, and is unsuitable for animal and plant growth. Additionally, the border with inner Mongolia is characterized by strong winds throughout the year and little rainfall, making the region susceptible to wind erosion and drought, prominent soil sandification problems, and poor water and fertility retention. As a mountainous area, the southeastern region is characterized by large slopes, serious soil erosion, and water-soil loss, resulting in thin cultivated soil layers, loss of soil nutrients, low soil fertility, susceptibility to drought and waterlogging, and inferior functionality.

3.3. Identification of Dominant Soil Function of Cultivated Land

Soil has a variety of functional attributes and states, which are usually characterized by a combination of functions. Therefore, we determined the best soil function in the evaluation unit as the dominant function (Figure 13). The largest area of dominant function was water purification and regulation, with 6.11 million ha, or 34.89% of the total area. This was mainly distributed in Suibin County and Luobei County in the northwest and northeast. Soil has a strong ability to absorb and store water, and can therefore effectively prevent natural disasters such as droughts and floods in the region. The second largest area of dominant function was the carbon sequestration and regulation function area, which accounted for about 29.57% of the total and was mainly distributed in the southwest. This area was characterized by a high capacity to store carbon in an unstable form, which can effectively slow the release of carbon dioxide into the atmosphere and adjust the field microclimate. The provision and cycling of nutrients and provision of functional and intrinsic biodiversity were slightly less distributed, while the dominant function with the smallest area was the primary productivity, which had an area of only 0.24 million ha, or 1.35% of the total. This area was mainly distributed in Fujin in the east of the study area and Hailun in the center of the area.

3.4. Cultivated Land Use Zoning Based on Soil Functions

To clarify the dominant soil functions and functionalities and combine these with the evaluation results for the five soil functions while ensuring the spatial continuity and integrity of the division, the county and city are set as the basic units and the soil function supply and demand evaluation results are superimposed on the basis of the dominant function of the soil to divide the cultivated land into use function zones (Figure 14).
(1) Functional balance region
Most areas in Heilongjiang province were functionally balanced. The five soil functions were in a balanced development, and the compound value of the soil was relatively high. Based on the favorable soil functional conditions, it is necessary to strictly protect and expand the high-yield and stable cultivated land. While maintaining the soil function of the existing cultivated land, deep ploughing is used to break the bottom of the soil plow and increase the permeability of the soil, improve the water storage capacity and water retention capacity of the soil, and promote increased crop production [81]. In the functional balance region, we suggest the characteristics of agricultural production be highlighted with special attention given to various functions such as farmland production ecology. Additionally, the layout of farmland should be optimized and the development of ecological agriculture promoted. To avoid destroying the soil, the requirements of "hiding grain in the ground" should be followed to develop ecological fertile land. The compound functions of farmland soil agricultural production, water conservation, and biodiversity should be considered. Additionally, construction of an agro-ecological leisure tourism complex to guide the rational and compound use of farmland space and further enhance its versatility is suggested [82].
(2) Food supply region
Food supply regions were dominated by the functions of primary productivity and nutrient cycling and supply. The terrain in these areas is mainly valley plains, hilly plains, and slightly inclined high plains, and these areas are characterized by abundant surface water, fertile black soil, high natural fertility, rich mineral nutrients, moderate texture, good agricultural utilization conditions, large and concentrated cultivated land, and high productivity. However, this region was densely populated with a limited amount of cultivated land. The region was also affected by restrictions such as urban construction and poor ecological soil functions. The food supply region could benefit from increased road construction to increase the accessibility of field roads, as well as improved cultivated land irrigation and drainage equipment to ensure the water conditions required for crop growth are met. Additionally, farming conditions should be improved through measures such as land consolidation and land development. This area could also be enhanced by adopting agricultural modern management measures [72]. Food supply regions are considered key areas for high-standard farmland construction. In such regions, it is important to promote measures to return straw to the field, increase the number of soil aggregates, increase soil porosity, and reduce soil compactness [83]. At the same time, these areas can adopt agricultural modernization management measures to enhance the overall utilization efficiency of farming, promote agricultural production mechanization and industrialization, improve farming techniques, strengthen agricultural training and guidance for farmers, and introduce characteristic cash crops based on regional characteristics. It is also possible to mobilize farmers’ production enthusiasm through the implementation of agricultural subsidies to ensure high and stable grain production in the region [84]. Based on the original land, we suggest implementation of cultivated land utilization and protection measures, promotion of biological control measures, optimization of farming methods, and promotion of cultivated land rotation while avoiding long-term overload cultivation. Finally, soil can be improved through various utilization measures such as rotation, allowing fields to lay fallow, and alternative planting ecological quality [85].
(3) Ecological agriculture region
The north-central and southeastern parts of Heilongjiang province are typical ecological agricultural regions. The terrain in the north-central part is characterized by hills and undulating mountains. The complex terrain is not conducive to agricultural farming, and there are serious water and soil erosion phenomena in the region [86]. This is mainly because part of the cultivated land was woodland and grassland before reclamation, and the soil was fertile. However, because large areas have been subject to land reclamation for many years, the original forest belt was cut down by farmers and the vegetation coverage rate declined, causing gully erosion to become more serious and soil fertility to decrease annually. As a result, the functions of primary productivity and nutrient supply and circulation are weak [87]. However, the climate is suitable and rainfall is sufficient. For cultivated land with a larger slope, the farming method can be improved. Alternatively, some fruit trees with higher economic benefits can be selected according to local climatic conditions, and a combination of trees should be adopted by fruit farmers. The planting mode takes advantage of the developed root system of fruit trees to reduce soil erosion, consolidate soil, store water, and improve the ecological environment. For some difficult-to-use hills and sloping lands, it is possible to return farmland to grassland, rotate crops and pastures, or plant multiple crops, all of which can improve soil fertility and increase the economic benefits of farmers [88]. Because of the characteristics of the regional topography and the advantages of mountain landscapes, biodiversity can be protected and mountain tourism and agricultural areas can be developed.
(4) Functionally vulnerable region
Functionally vulnerable regions were mainly distributed in counties and cities in the southwest, which is characterized by low-lying, poorly drained, and poor climatic conditions. These regions border Inner Mongolia and are affected by the Siberian dry monsoon, which is characterized by little rainfall and high evaporation. These conditions eventually lead to soil water storage. In these regions, poor capacity and serious soil salinization have led to soil fertility loss, soil stickiness, soil compaction, and difficulty in utilization. These areas have also long been subject to erroneous production activities such as blind land reclamation, improper irrigation and drainage, and over-grazing, which have caused serious soil desertification, fragile ecological functions, and restricted use of soil functions. Focusing on soil improvement, we suggest advanced irrigation and drainage technology be introduced, and that reasonable irrigation and drainage be used to promote soil desalination. Additionally, the groundwater level should be controlled to a critical depth to effectively prevent salt reverse. It is also important to choose salt-tolerant crops and promote the planting of salt-tolerant or salt-resistant crops, as well as to encourage the return of straw to the field, increase the application of organic fertilizers and soil nutrients, improve soil physical and chemical properties, reduce soil water evaporation, promote soil aggregation, and stabilize soil in these regions [89]. Integrating fragmented land and developing innovative agricultural planting technology will help break through the limitations of climate and water resources. For soil desertification areas, ecological conservation can be adopted, starting with protection of the land ecosystem, as well as adjusting the planting structure and layout [90].

4. Discussion and Prospects

The establishment of macro-scale soil function evaluation theories and methods is a bottleneck that needs to be broken through in the field of natural resource management in China [3]. This article describes an evaluation method that is pertinent for the study area. However, the method described herein would be difficult to apply to other areas, especially while large-scale soil biodiversity surveys in China are still in their infancy. Large-scale evaluation of cultivated land soil function is a complex and comprehensive process. The availability of indicators and data quality are essential to soil function evaluation. Here, we discuss some limitations of our study dataset and then look in depth at how the evidence supports our research hypotheses. The protection of national food security is inseparable from the management and protection of soil health. It is important to re-evaluate the properties and functions of soil, and to plan and expand the mission of soil science. Based on this, the present article discusses the current key research directions, provides a reference for future studies, and provides guidance for agricultural production.

4.1. Soil Function Evaluation Scale and Indicator

Soil function assessments have evolved over time with changes in the objectives, tools, methods, and indicators of these assessments [91]. For example, the main objective of assessments before the 1970s was determining the suitability of soils for crop growth, while after 2010 the objective changed to evaluation of multi-functionality, ecosystem services, resistance, and resilience of soils. This change in objectives has resulted in more advanced methods and novel indicators for determination of soil function being developed (Table 3).
Soil is an ecosystem that has different states under different spatial scopes, different time frames, and different management methods [92]. Conducting analyses on different scales solves different problems. Additionally, soil is the result of the combined effects of soil-forming factors at different scales [93]. At the national scale, policy makers need to analyze the overall quality and trends of soil resources to ensure national food security. At the watershed scale, the general public hopes to maintain a healthy production and living environment in the region. At the field scale, farmland managers are concerned about the productivity and sustainability of the soil. The existing literature mainly focuses on the evaluation of soil quality at small and medium spatial scales under specific land use or agricultural land conditions. However, there is almost no related research on cross-spatial scales or multi-functional dimensions [94], which makes it difficult to satisfy different levels of soil health protection decision-making and management behavior needs. Therefore, soil protection needs to be controlled at the macro level, but also implemented at the micro level. China’s land resource management and utilization decision-making levels include townships, counties, cities, provinces, and countries. The indicators, units, methods, and applications of soil function evaluations at different scales have their own characteristics [3]. The soil function evaluation indicators and importance of different scales are not fixed, but should be adjusted according to the temporal and spatial change in characteristics of indicators and the purpose of soil management. Data conditions are the main factor restricting the selection of indicators; however, from the perspective of scale differentiation, the availability of data and the selection of indicators are consistent. The large spatial scale mainly focuses on the endogenous potential and evolution trends of soil functions, and static indicators that can reflect the inherent properties of the soil should be used and be relatively consistent with the results of wide-area digital soil mapping. The small spatial scale mainly focuses on the performance of soil functions in the current state. It is necessary to adopt dynamic indicators that can respond to farmland management measures and be obtained through sampling tests [95,96]. Because China has a vast territory and large geographical differences, it is possible to select representative plots under different soil types, land use types, ecological environments, and soil management scenarios to reveal the law of spatial differentiation characteristics of soil functional supply capacity at different scales, and to establish a minimum indicator set for soil function evaluation in different regions [97].

4.2. Classification and Evaluation of Soil Ecosystem Service Function

The soil system is a living system that performs soil functions that provide various ecosystem services [98]. Soils provide a wide range of goods and services that are important for human well-being and sustainable socio-economic development, which are collectively known as ecosystem services [26,99]. However, in recent years, soil function has declined sharply due to the influence of climate change and human activities, seriously threatening the survival and development of human beings [100]. Soil ecosystem services are terminal services formed by soil ecosystems under the effect of human value orientation and the direct contributions of ecosystems to human benefits [101]; accordingly, each soil ecosystem service reflects different soil functions [102]. The various divisions of soil functions have made people realize the multiple uses of soil, as well as the effects that environmental interference and anthropogenic activities have on soil functions. Currently, one of the greatest challenges is determining how to quantify soil ecosystem services [103]. Some unsustainable management measures such as traditional farming, unreasonable fertilization, and blind use of herbicides and pesticides have led to the devaluation and degradation of soil ecosystem services. Conversely, sustainable soil management measures such as conservation tillage, organic agriculture, cover crops, and crop diversification have positive effects on soil ecosystem services [104]. Soil function evaluation has shifted from focusing only on soil production functions in the early days to comprehensive soil multi-function evaluation. Comprehensive coordination and weighing of the diversity of soil ecosystem services are conducted through comprehensive evaluation of soil functions to achieve sustainable soil management and use [105]. However, the comprehensive evaluation of soil functions cannot be simply additive, as soil is suitable for plant habitat and crop production functions simultaneously. Therefore, when conducting a comprehensive evaluation, attention should be paid to the correlation between various soil functions [106]. The soil system integrates physical, chemical, and biological factors and processes, soil properties that are key to providing a particular soil ecosystem service are identified and related to context-specific environmental variables. Thus, soil ecosystem services assessments can benefit from research into dynamic spatio-temporal modelling of soil properties and processes [107].

4.3. Pay More Attention to Soil Biodiversity

Biodiversity not only provides humans with abundant food resources, but also plays an essential role in maintenance of water and soil, climate regulation, water conservation, and air purification [108,109]. Ecologists often pay more attention to above-ground biodiversity than soil biodiversity [110]. However, these two types of diversity are closely related, and soil biodiversity significantly affects the function of ecosystems [111,112]. In addition, Cameron et al. found that areas of mismatch between aboveground and soil biodiversity cover 27% of the terrestrial surface of the Earth [113]. The soil acts as a composite living entity [114], and a more diverse soil biome is conducive to increasing the nutrients needed to produce high-yield and high-quality crops, as well as to protecting crops from pests, pathogens, and weeds. Long-term application of organic fertilizers and chemical fertilizers can be properly combined to increase the community diversity of key soil groups [115]. However, the input of a large number of chemicals and unreasonable management during intensive agricultural production can lead to decreased soil biodiversity, an imbalance in microbial flora, simplification of soil food webs, increased occurrence of pests and diseases, and severe reductions in crop yields [116]. Indeed, the quantity of soil organisms and their activities can sensitively reflect changes in soil health and human management, and can therefore be used as an ecological indicator of soil changes. Soil biodiversity indicators mainly include microbial biomass, soil microorganisms, pathogens, large and medium-sized soil animals, soil enzymes and plants. The EcoFinders (Ecological Function and Biodiversity Indicators in European Soils) project of the European Union has been trying to identify indicators that can comprehensively reflect soil biodiversity, including soil biological community structure and functional gene expression [117]. However, this project is challenged by the following: (1) measurement of most biological indicators takes a long time and the technical requirements and costs are high [118]; (2) there are many types, individuals, and rapid changes among soil organism populations, as well as a certain amount of functional redundancy [99]; (3) a high-resolution, quantitative understanding of the abundance or functional composition of active soil organisms has not been developed to date [119]. Soil is a challenging habitat, and finding clear and unambiguous relationships between soil characteristics and the overall soil biodiversity is very difficult. At a large scale, it is possible to indirectly characterize soil biological diversity from the perspective of suitability of the soil biological habitat and the suitable soil conditions for biological survival. The most important drivers of soil biodiversity on a global scale have been found to be aridity, mean annual temperature, plant richness and cover, soil pH, C content, and clay percentage [120].

4.4. Utilization and Protection of Black Soil Cultivated Land

Black soil is the most fertile and productive soil, which makes it suitable for farming. Strengthening the protection of black soil has become a great concern to all sectors of society [121]. The Great Plains of Ukraine, the Mississippi River Basin in North America, the Black Soil Region of the Northeast Plain of China, and the Pampas Prairie of South America are the four largest black soil regions in the world. Heilongjiang province is located at the core of the Black Soil Region of Northeast China. Since the reclamation of black soil in China, there have been several periods of rotation and fallow, low-intensity utilization by humans and livestock, and high-intensity utilization of mechanization. The natural fertility of black soil has declined annually, the soil has degraded, the organic matter content has been sharply reduced, the cultivation layer has become thin, and the plow bottom has thickened [45]. Because of long-term and unreasonable soil management techniques such as soil plowing, allowing cultivated layers to remain bare, and wanton land reclamation, the original stable micro-ecosystem of black soil in this region has been broken, resulting in soil biodiversity, nutrient maintenance, carbon storage, water purification and water regulation degradation [122,123]. Protection of black soil requires engineering, agronomic, biological, and other measures to create a deep and fertile cultivated layer that stabilizes and increases crop yields. After several years of cultivation, fertilization plans need to be developed to maintain and improve soil fertility [6]. Soil fertilization measures include organic fertilizer application and crop rotation [120]. Returning more than 80% of agricultural production waste to the field after the harmless treatment can ensure that the soil organic matter does not decrease, and may even lead to its slowly increasing. Additionally, straw deep return protection technology can be used to maintain and increase the organic matter content of the 0–20 cm black soil layer [124]. It is worth noting that although plowing is conducive to the release of soil microbial activities and soil nutrients, as well as the mineralization of soil materials, plowing also loosens the topsoil, which accelerates the wind and water erosion of the soil and accelerates the decomposition rate of soil organic matter. No-tillage straw mulch is a typical protective tillage measure, but it is still not clear if no-tillage, no mulch, or less tillage is the best protective tillage measure [125].

5. Conclusions

Here, an evaluation system for the five functions of primary productivity (provision and cycling of nutrients, provision of functional and intrinsic biodiversity, water purification and regulation, and carbon sequestration and regulation) was developed based on soil attribute data. Using the soil function discriminant matrix method, soil functions based on supply-demand ratios were constructed to evaluate the current status of supply and demand of soil functions. The comprehensive evaluation results of soil functions in Heilongjiang province demonstrated a distribution pattern of high grade in the northeast and low grade in the southwest, mostly in second-level areas. The paddy fields and dry land showed similar primary productivity functions as well as provision and cycling of nutrient functions, while the intrinsic biodiversity, water purification and regulation, and carbon sequestration and regulation functions of paddy fields are better than those of dry land. The actual supply of primary productivity functions in 71.32% of the region cannot meet the current needs of life. The dominant function of soil in 34.89% of the area is water purification and regulation, and most of the cultivated land belongs to the functional balance region. Cultivated land use zoning and optimization research ideas based on soil multifunctionality make up for the lack of research on large-scale agricultural soil health management and protection in China, and are of great importance to the targeted protection and utilization of black soil.

Author Contributions

Conceptualization, K.W. and R.Z.; methodology, K.W. and R.Z.; validation, J.L.; formal analysis, R.Z. and J.L.; investigation, K.W.; resources, K.W.; data curation, R.Z. and J.L.; writing—original draft preparation, R.Z.; writing—review and editing, K.W. and R.Z.; visualization, R.Z. and L.K.; supervision, K.W.; project administration, K.W.; funding acquisition, K.W. All authors have read and agreed to the published version of the manuscript.

Funding

This study was supported by the National Key R&D Program of China (No. 2018YFE0107000).

Institutional Review Board Statement

Not applicable.

Informed Consent Statement

Not applicable.

Data Availability Statement

The datasets used and/or analyzed during the current study are available from the corresponding author upon reasonable request.

Acknowledgments

Thanks for research assistance from Ganlin Zhang, Fengrong Zhang, Weidong Shan, Baiming Chen, and Wenju Yun. The insightful and constructive comments of the anonymous reviewers are appreciated.

Conflicts of Interest

The authors declare that they have no conflicts of interest.

References

  1. Robinson, D.A.; Fraser, I.; Dominati, E.; Davíðsdóttir, B.; Jónsson, J.O.G.; Jones, L.; Jones, S.B.; Tuller, M.; Lebron, I.; Bristow, K.L.; et al. On the Value of Soil Resources in the Context of Natural Capital and Ecosystem Service Delivery. Soil Sci. Soc. Am. J. 2014, 78, 685–700. [Google Scholar] [CrossRef] [Green Version]
  2. Brevik, E.C.; Sauer, T.J. The past, present, and future of soils and human health studies. Soil 2015, 1, 35–46. [Google Scholar] [CrossRef] [Green Version]
  3. Wu, K.N.; Yang, Q.J.; Zhao, R. A discussion on soil health assessment of arable land in China. Acta Pedol. Sin. 2021, 58, 537–544. [Google Scholar] [CrossRef]
  4. FAO; ITPS. Status of the World’s Soil Resources (SWSR)—Main Report; Food and Agriculture Organization of the United Nations and Intergovernmental Technical Panel on Soils: Rome, Italy, 2015; Available online: http://www.fao.org/3/a-i5199e.pdf (accessed on 31 January 2015).
  5. Zhao, Q.G.; Sun, B. Soil quality and sustainable environment: The definition and evaluation method of I. Soil quality. Soils 1997, 29, 113–120. [Google Scholar] [CrossRef]
  6. Han, X.Z.; Zhou, W.X. Research perspectives and footprint of utilization and protection of black soil in northeast China. Acta Pedol. Sin. 2021. Available online: https://kns.cnki.net/kcms/detail/32.1119.P.20210416.1456.002.html (accessed on 19 April 2021).
  7. Wang, J.K.; Xu, X.R.; Pei, J.B.; Li, S.Y. Current situations of black soil quality and facing opportunities and challenges in northeast China. Chin. J. Soil Sci. 2021, 1–7. [Google Scholar] [CrossRef]
  8. Zhao, R.; Wu, K.N.; Yang, Q.J.; Feng, Z.; Zhao, H.F.; Zhang, Z. Farmland Soil Health Evaluation Method Based on Soil Function and Soil Threat. Trans. Chin. Soc. Agric. Mach. 2021. Available online: https://kns.cnki.net/kcms/detail/11.1964.s.20210408.1602.023.html (accessed on 9 April 2021).
  9. Paul, C.; Kuhn, K.; Steinhoff-Knopp, B.; Weißhuhn, P.; Helming, K. Towards a standardization of soil-related ecosystem service assessments. Eur. J. Soil Sci. 2020, 1–16. [Google Scholar] [CrossRef]
  10. Banwart, S. Save our soils. Nat. Cell Biol. 2011, 474, 151–152. [Google Scholar] [CrossRef] [Green Version]
  11. Boyd, J.; Banzhaf, S. What are ecosystem services? The need for standardized environmental accounting units. Ecol. Econ. 2007, 63, 616–626. [Google Scholar] [CrossRef] [Green Version]
  12. Milne, E.; Banwart, S.A.; Noellemeyer, E.; Abson, D.J.; Ballabio, C.; Bampa, F.; Bationo, A.; Batjes, N.H.; Bernoux, M.; Bhattacharyya, T.; et al. Soil carbon, multiple benefits. Environ. Dev. 2015, 13, 33–38. [Google Scholar] [CrossRef] [Green Version]
  13. Goss, M.J. Sustaining Soil Productivity in Response to Global Climate Change: Science, Policy, and Ethics. Can. J. Soil Sci. 2013, 93, 393–395. [Google Scholar] [CrossRef] [Green Version]
  14. Galloway, J.N.; ATownsend, A.R.; Erisman, J.W.; Bekunda, M.; Cai, Z.; Freney, J.R.; Martinelli, L.A.; Seitzinger, S.P.; Sutton, M.A. Transformation of the Nitrogen Cycle: Recent Trends, Questions, and Potential Solutions. Science 2008, 320, 889–892. [Google Scholar] [CrossRef] [PubMed] [Green Version]
  15. Adhikari, K.; Hartemink, A.E. Linking soils to ecosystem services—A global review. Geoderma 2016, 262, 101–111. [Google Scholar] [CrossRef]
  16. Sandifer, P.A.; Sutton-Grier, A.E.; Ward, B.P. Exploring connections among nature, biodiversity, ecosystem services, and human health and well-being: Opportunities to enhance health and biodiversity conservation. Ecosyst. Serv. 2015, 12, 1–15. [Google Scholar] [CrossRef] [Green Version]
  17. Dangi, S.R. Soil Ecology and Ecosystem Services. Soil Sci. Soc. Am. J. 2014, 78, 335. [Google Scholar] [CrossRef]
  18. Delgado-Baquerizo, M.; Maestre, F.T.; Reich, P.B.; Jeffries, T.; Gaitan, J.; Encinar, D.; Berdugo, M.; Campbell, C.D.; Singh, B. Microbial diversity drives multifunctionality in terrestrial ecosystems. Nat. Commun. 2016, 7, 10541. [Google Scholar] [CrossRef] [Green Version]
  19. Garland, G.; Banerjee, S.; Edlinger, A.; Oliveira, E.M.; Herzog, C.; Wittwer, R.; Philippot, L.; Maestre, F.T.; van der Heijden, M.G. A closer look at the functions behind ecosystem multifunctionality: A review. J. Ecol. 2021, 109, 600–613. [Google Scholar] [CrossRef]
  20. Manning, P.; Van Der Plas, F.; Soliveres, S.; Allan, E.; Maestre, F.T.; Mace, G.; Whittingham, M.J.; Fischer, M. Publisher Correction: Redefining ecosystem multifunctionality. Nat. Ecol. Evol. 2018, 2, 1515. [Google Scholar] [CrossRef]
  21. Xu, W.; Ma, Z.; Jing, X.; He, J.-S. Biodiversity and ecosystem multifunctionality: Advances and perspectives. Biodivers. Sci. 2016, 24, 55–71. [Google Scholar] [CrossRef]
  22. Greiner, L.; Keller, A.; Grêt-Regamey, A.; Papritz, A. Soil function assessment: Review of methods for quantifying the contributions of soils to ecosystem services. Land Use Policy 2017, 69, 224–237. [Google Scholar] [CrossRef]
  23. Guerra, C.A.; Heintz-Buschart, A.; Sikorski, J.; Chatzinotas, A.; Guerrero-Ramírez, N.; Cesarz, S.; Beaumelle, L.; Rillig, M.C.; Maestre, F.T.; Delgado-Baquerizo, M.; et al. Blind spots in global soil biodiversity and ecosystem function research. Nat. Commun. 2020, 11, 3870. [Google Scholar] [CrossRef]
  24. Schulte, R.P.O.; Ebampa, F.; Ebardy, M.; Ecoyle, C.; Creamer, R.E.; Efealy, R.; Egardi, C.; Ghaley, B.B.; Ejordan, P.; Elaudon, H.; et al. Making the Most of Our Land: Managing Soil Functions from Local to Continental Scale. Front. Environ. Sci. 2015, 3, 85–91. [Google Scholar] [CrossRef]
  25. Jiang, M.; Lv, X.G.; Yang, Q. Wetland soil and its system of environment function assessment. Wetl. Sci. 2006, 3, 168–173. (In Chinese) [Google Scholar] [CrossRef]
  26. Costanza, R.; d’Arge, R.; de Groot, R.; Farber, S.; Grasso, M.; Hannon, B.; Limburg, K.; Naeem, S.; O’Neill, R.V.; Paruelo, J.; et al. The value of the world’s ecosystem services and natural capital. Nature 1997, 387, 253–260. [Google Scholar] [CrossRef]
  27. Tzilivakis, J.; Lewis, K.; Williamson, A. A prototype framework for assessing risks to soil functions. Environ. Impact Assess. Rev. 2005, 25, 181–195. [Google Scholar] [CrossRef]
  28. Burauel, P.; Bassmann, F. Soils as filter and buffer for pesticides—Experimental concepts to understand soil functions. Environ. Pollut. 2005, 133, 11–16. [Google Scholar] [CrossRef] [PubMed]
  29. Rabot, E.; Wiesmeier, M.; Schlüter, S.; Vogel, H.-J. Soil structure as an indicator of soil functions: A review. Geoderma 2018, 314, 122–137. [Google Scholar] [CrossRef]
  30. Jost, E.; Schnhart, M.; Skalsk, R.; Balkovi, J.; Mitter, H. Dynamic soil functions assessment employing land use and climate scenarios at regional scale. J Environ Manag. 2021, 287, 112318. [Google Scholar] [CrossRef]
  31. Thoumazeau, A.; Bessou, C.; Renevier, M.-S.; Trap, J.; Marichal, R.; Mareschal, L.; Decaëns, T.; Bottinelli, N.; Jaillard, B.; Chevallier, T.; et al. Biofunctool®: A new framework to assess the impact of land management on soil quality. Part A: Concept and validation of the set of indicators. Ecol. Indic. 2019, 97, 100–110. [Google Scholar] [CrossRef]
  32. Thoumazeau, A.; Bessou, C.; Renevier, M.-S.; Panklang, P.; Puttaso, P.; Peerawat, M.; Heepngoen, P.; Polwong, P.; Koonklang, N.; Sdoodee, S.; et al. Biofunctool®: A new framework to assess the impact of land management on soil quality. Part B: Investigating the impact of land management of rubber plantations on soil quality with the Biofunctool® index. Ecol. Indic. 2019, 97, 429–437. [Google Scholar] [CrossRef]
  33. Schulte, R.; Creamer, R.; Donnellan, T.; Farrelly, N.; Fealy, R.; O’Donoghue, C.; O’Huallachain, D. Functional land management: A framework for managing soil-based ecosystem services for the sustainable intensification of agriculture. Environ. Sci. Policy 2014, 38, 45–58. [Google Scholar] [CrossRef] [Green Version]
  34. Wu, K.N.; Yang, Q.J.; Chen, J.Y.; Wu, J.F. Soil quality and functions: From science to experiences—A reviewof the wageningen soil conference 2019. Chin. J. Soil Sci. 2020, 51, 241–244. [Google Scholar] [CrossRef]
  35. Angelini, M.E.; Heuvelink, G.B.M.; Kempen, B. Multivariate mapping of soil with structural equation modelling. Eur. J. Soil Sci. 2017, 68, 575–591. [Google Scholar] [CrossRef] [Green Version]
  36. Mahajan, G.; Das, B.; Morajkar, S.; Desai, A.; Murgaokar, D.; Kulkarni, R.; Sale, R.; Patel, K. Soil quality assessment of coastal salt-affected acid soils of India. Environ. Sci. Pollut. Res. 2020, 27, 26221–26238. [Google Scholar] [CrossRef]
  37. Obade, V.D.P.; Lal, R. Towards a standard technique for soil quality assessment. Geoderma 2016, 265, 96–102. [Google Scholar] [CrossRef]
  38. Chen, Q.-L.; Ding, J.; Zhu, D.; Hu, H.-W.; Delgado-Baquerizo, M.; Ma, Y.-B.; He, J.-Z.; Zhu, Y.-G. Rare microbial taxa as the major drivers of ecosystem multifunctionality in long-term fertilized soils. Soil Biol. Biochem. 2020, 141, 107686. [Google Scholar] [CrossRef]
  39. Luo, G.; Rensing, C.; Chen, H.; Liu, M.; Wang, M.; Guo, S.; Ling, N.; Shen, Q. Deciphering the associations between soil microbial diversity and ecosystem multifunctionality driven by long-term fertilization management. Funct. Ecol. 2018, 32, 1103–1116. [Google Scholar] [CrossRef]
  40. Li, J.; Delgado-Baquerizo, M.; Wang, J.-T.; Hu, H.-W.; Cai, Z.-J.; Zhu, Y.-N.; Singh, B. Fungal richness contributes to multifunctionality in boreal forest soil. Soil Biol. Biochem. 2019, 136, 107526. [Google Scholar] [CrossRef]
  41. Guo, Y.; Luo, H.; Wang, L.; Xu, M.; Wan, Y.; Chou, M.; Shi, P.; Wei, G. Multifunctionality and microbial communities in agricultural soils regulate the dynamics of a soil-borne pathogen. Plant Soil 2021, 461, 309–322. [Google Scholar] [CrossRef]
  42. Cui, H.; Sun, W.; Delgado-Baquerizo, M.; Song, W.; Ma, J.-Y.; Wang, K.; Ling, X. Phosphorus addition regulates the responses of soil multifunctionality to nitrogen over-fertilization in a temperate grassland. Plant Soil 2020, 1–15. [Google Scholar] [CrossRef]
  43. Qiu, L.; Zhang, Q.; Zhu, H.; Reich, P.B.; Banerjee, S.; van der Heijden, M.G.A.; Sadowsky, M.J.; Ishii, S.; Jia, X.; Shao, M.; et al. Erosion reduces soil microbial diversity, network complexity and multifunctionality. ISME J. 2021, 1–16. [Google Scholar] [CrossRef]
  44. Su, Y.; Liu, J.; Zhang, Y.; Huang, G. More drought leads to a greater significance of biocrusts to soil multifunctionality. Funct. Ecol. 2021, 35, 989–1000. [Google Scholar] [CrossRef]
  45. Han, X.Z.; Li, N. Research progress of black soil in northeast China. Sci. Geogr. Sin. 2018, 38, 1032–1041. [Google Scholar]
  46. Xin, J.S.; Wang, J.K.; Xue, Y.D. Dongbei Heituqu Gengdi Zhiliang Pingjia; China Agriculture Press: Beijing, China, 2017; pp. 8–37. [Google Scholar]
  47. Liu, B.Y. Issue discussion of sustainable utilization and soil degradation in typical black soil region. Soil Water Conserv. China 2003, 12, 31–32. [Google Scholar] [CrossRef]
  48. Mueller, L.; Schindler, U.; Mirschel, W.; Shepherd, T.G.; Ball, B.C.; Helming, K.; Rogasik, J.; Eulenstein, F.; Wiggering, H. Assessing the productivity function of soils. A review. Agron. Sustain. Dev. 2010, 30, 601–614. [Google Scholar] [CrossRef]
  49. Skaalsveen, K.; Ingram, J.; Clarke, L.E. The effect of no-till farming on the soil functions of water purification and retention in north-western Europe: A literature review. Soil Tillage Res. 2019, 189, 98–109. [Google Scholar] [CrossRef]
  50. Lin, D.; McCulley, R.L.; Nelson, J.A.; Jacobsen, K.L.; Zhang, D. Time in pasture rotation alters soil microbial community composition and function and increases carbon sequestration potential in a temperate agroecosystem. Sci. Total Environ. 2020, 698, 134233. [Google Scholar] [CrossRef] [PubMed]
  51. Tibbett, M.; Fraser, T.D.; Duddigan, S. Identifying potential threats to soil biodiversity. PeerJ 2020, 8, e9271. [Google Scholar] [CrossRef]
  52. Chen, Q.; Liu, Z.; Zhou, J.; Xu, X.; Zhu, Y. Long-term straw mulching with nitrogen fertilization increases nutrient and microbial determinants of soil quality in a maize–wheat rotation on China’s Loess Plateau. Sci. Total Environ. 2021, 775, 145930. [Google Scholar] [CrossRef]
  53. Sandén, T.; Trajanov, A.; Spiegel, H.; Kuzmanovski, V.; Saby, N.P.A.; Picaud, C.; Henriksen, C.B.; Debeljak, M. Development of an Agricultural Primary Productivity Decision Support Model: A Case Study in France. Front. Environ. Sci. 2019, 7, 58. [Google Scholar] [CrossRef] [Green Version]
  54. Ghaley, B.B.; Rusu, T.; Sandén, T.; Spiegel, H.; Menta, C.; Visioli, G.; O’Sullivan, L.; Gattin, I.T.; Delgado, A.; Liebig, M.A.; et al. Assessment of Benefits of Conservation Agriculture on Soil Functions in Arable Production Systems in Europe. Sustainability 2018, 10, 794. [Google Scholar] [CrossRef] [Green Version]
  55. Van Leeuwen, J.P.; Saby, N.P.A.; Jones, A.; Louwagie, G.; Micheli, E.; Rutgers, M.; Schulte, R.P.O.; Spiegel, H.; Toth, G.; Creamer, R.E. Gap assessment in current soil monitoring networks across Europe for measuring soil functions. Environ. Res. Lett. 2017, 12, 124007. [Google Scholar] [CrossRef]
  56. Glæsner, N.; Helming, K.; De Vries, W. Do Current European Policies Prevent Soil Threats and Support Soil Functions? Sustainability 2014, 6, 9538–9563. [Google Scholar] [CrossRef] [Green Version]
  57. Velasquez, E.; Lavelle, P.; Andrade, M. GISQ, a multifunctional indicator of soil quality. Soil Biol. Biochem. 2007, 39, 3066–3080. [Google Scholar] [CrossRef]
  58. Van den Putte, A.; Govers, G.; Diels, J.; Gillijns, K.; Demuzere, M. Assessing the effect of soil tillage on crop growth: A meta-regression analysis on European crop yields under conservation agriculture. Eur. J. Agron. 2010, 33, 231–241. [Google Scholar] [CrossRef]
  59. Qi, X.; Fu, Y.; Wang, R.Y.; Ng, C.N.; Dang, H.; He, Y. Improving the sustainability of agricultural land use: An integrated framework for the conflict between food security and environmental deterioration. Appl. Geogr. 2018, 90, 214–223. [Google Scholar] [CrossRef]
  60. Hoffland, E.; Kuyper, T.W.; Comans, R.N.J.; Creamer, R.E. Eco-functionality of organic matter in soils. Plant Soil 2020, 455, 1–22. [Google Scholar] [CrossRef]
  61. Obalum, S.; Chibuike, G.; Peth, S.; Ouyang, Y. Soil organic matter as sole indicator of soil degradation. Environ. Monit. Assess. 2017, 189, 176. [Google Scholar] [CrossRef] [PubMed]
  62. Oldfield, E.E.; Wood, S.A.; Bradford, M. Direct effects of soil organic matter on productivity mirror those observed with organic amendments. Plant Soil 2018, 423, 363–373. [Google Scholar] [CrossRef]
  63. Schiefer, J.; Lair, G.J.; Blum, W.E. Indicators for the definition of land quality as a basis for the sustainable intensification of agricultural production. Int. Soil Water Conserv. Res. 2015, 3, 42–49. [Google Scholar] [CrossRef] [Green Version]
  64. Shirato, Y. Use of models to evaluate carbon sequestration in agricultural soils. Soil Sci. Plant Nutr. 2019, 66, 21–27. [Google Scholar] [CrossRef]
  65. Zwetsloot, M.J.; van Leeuwen, J.; Hemerik, L.; Martens, H.; Simó Josa, I.; Van de Broek, M.; Debeljak, M.; Rutgers, M.; Sandén, T.; Wall, D.P.; et al. Soil multifunctionality: Synergies and trade-offs across European climatic zones and land uses. Eur. J. Soil Sci. 2020, 1–15. [Google Scholar] [CrossRef]
  66. Ellis, E.A.; Baerenklau, K.A.; Marcos-Martinez, R.; Chávez, E. Land use/land cover change dynamics and drivers in a low-grade marginal coffee growing region of Veracruz, Mexico. Agrofor. Syst. 2010, 80, 61–84. [Google Scholar] [CrossRef] [Green Version]
  67. Pheap, S.; Lefèvre, C.; Thoumazeau, A.; Leng, V.; Boulakia, S.; Koy, R.; Hok, L.; Lienhard, P.; Brauman, A.; Tivet, F. Multi-functional assessment of soil health under Conservation Agriculture in Cambodia. Soil Tillage Res. 2019, 194, 104349. [Google Scholar] [CrossRef]
  68. Al-Shammary, A.A.G.; Kouzani, A.Z.; Kaynak, A.; Khoo, S.Y.; Norton, M.; Gates, W. Soil Bulk Density Estimation Methods: A Review. Pedosphere 2018, 28, 581–596. [Google Scholar] [CrossRef]
  69. Liu, L.; Zhou, D.; Chang, X.; Lin, Z. A new grading system for evaluating China’s cultivated land quality. Land Degrad. Dev. 2020, 31, 1482–1501. [Google Scholar] [CrossRef]
  70. Coyle, C.; Creamer, R.; Schulte, R.; O’Sullivan, L.; Jordan, P. A Functional Land Management conceptual framework under soil drainage and land use scenarios. Environ. Sci. Policy 2016, 56, 39–48. [Google Scholar] [CrossRef] [Green Version]
  71. Burkhard, B.; Kroll, F.; Nedkov, S.; Müller, F. Mapping ecosystem service supply, demand and budgets. Ecol. Indic. 2012, 21, 17–29. [Google Scholar] [CrossRef]
  72. Han, X.Z.; Zou, W.X. Effects and suggestions of black soil protection and soil fertility increase in northeast China. Bull. Chin. Acad. Sci. 2018, 33, 206–212. [Google Scholar]
  73. Fan, H.M.; Cai, Q.G.; Wang, H.S. Condition of soil erosion in phaeozem region of northeast China. J. Soil Water Conserv. 2004, 18, 66–70. [Google Scholar]
  74. Yang, D.W.; Zhang, M.K.; Zhang, P.Q.; Yang, Y.D. Evolution of soil in microbiology after reclamation of paddy into orchard. Acta Pedol. Sin. 2018, 55, 182–193. (In Chinese) [Google Scholar] [CrossRef]
  75. Yan, B.; Zhang, Y.; Zang, S.; Chen, Q.; Sun, L. Distributions of Particle Sizes in Black Soil and Their Environmental Significance in Northeast China. Sustainability 2021, 13, 3706. [Google Scholar] [CrossRef]
  76. Yuan, Z.; Jin, X.; Guan, Q.; Meshack, A.O. Converting cropland to plantation decreases soil organic carbon stock and liable fractions in the fertile alluvial plain of eastern China. Geoderma Reg. 2021, 24, e00356. [Google Scholar] [CrossRef]
  77. Liu, H.Y.; Zhou, P.; Zhu, H.H.; Wu, J.S.; Zhou, D.S. Effect of land use change on topsoil organic carbon storage of paddy soil in a hilly landscape of Red Earth Region. Agric. Mod. Res. 2012, 33, 359–362. (In Chinese) [Google Scholar] [CrossRef]
  78. Huang, J.F.; Cao, Z.H.; Shi, Y.P.; Ni, X.W. Agricultural and forestry carbon sequestration function analysis and its affection by land use change in Jiaxing Plain, China. Agric. Environ. Dev. 2013, 4, 23–27. (In Chinese) [Google Scholar] [CrossRef]
  79. Li, M.; Han, X.; Du, S.; Li, L.-J. Profile stock of soil organic carbon and distribution in croplands of Northeast China. Catena 2019, 174, 285–292. [Google Scholar] [CrossRef]
  80. Liu, Y.S.; Zhang, Z.W.; Wang, J.Y. Regional differentiation and comprehensive regionalization scheme of modern agriculture in China. Acta Geogr. Sin. 2018, 73, 203–218. (In Chinese) [Google Scholar] [CrossRef]
  81. Schneider, F.; Don, A.; Hennings, I.; Schmittmann, O.; Seidel, S.J. The effect of deep tillage on crop yield—What do we really know? Soil Tillage Res. 2017, 174, 193–204. [Google Scholar] [CrossRef]
  82. Zhang, C.; Qiao, M.; Yun, W.J.; Liu, J.J.; Zhu, D.H.; Yang, J.Y. Trinity comprehensive regulatory system about quantity, quality and ecology of cultivated land. Trans. Chin. Soc. Agric. Mach. 2017, 48, 1–6. [Google Scholar] [CrossRef]
  83. Tian, P.; Lian, H.; Wang, Z.; Jiang, Y.; Li, C.; Sui, P.; Qi, H. Effects of Deep and Shallow Tillage with Straw Incorporation on Soil Organic Carbon, Total Nitrogen and Enzyme Activities in Northeast China. Sustainability 2020, 12, 8679. [Google Scholar] [CrossRef]
  84. Liu, J.; Lu, Y.F.; Xu, Q. Agricultural subsidy, old-age security and farmland transfer. J. Agrotech. Econ. 2020, 12, 23–37. (In Chinese) [Google Scholar] [CrossRef]
  85. Obour, A.; Holman, J.; Simon, L.; Schlegel, A. Strategic Tillage Effects on Crop Yields, Soil Properties, and Weeds in Dryland No-Tillage Systems. Agronomy 2021, 11, 662. [Google Scholar] [CrossRef]
  86. Sun, J.H.; He, J.M. Hilly field erosion regulation in low mountain region of northern Liaoning. Res. Soil Water Conserv. 1997, 4, 65–74. (In Chinese) [Google Scholar]
  87. Han, X.Z.; Wang, S.Y.; Song, C.Y.; Qiao, Y.F. Effects of land use and cover change on ecological environment in black soil region. Sci. Geogr. Sin. 2005, 25, 203–208. (In Chinese) [Google Scholar]
  88. Mao, Y.-T.; Hu, W.; Chau, H.W.; Lei, B.-K.; Di, H.-J.; Chen, A.-Q.; Hou, M.-T.; Whitley, S. Combined Cultivation Pattern Reduces Soil Erosion and Nutrient Loss from Sloping Farmland on Red Soil in Southwestern China. Agronomy 2020, 10, 1071. [Google Scholar] [CrossRef]
  89. Severini, S.; Castellari, M.; Cavalli, D.; Pecetti, L. Economic Sustainability and Riskiness of Cover Crop Adoption for Organic Production of Corn and Soybean in Northern Italy. Agronomy 2021, 11, 766. [Google Scholar] [CrossRef]
  90. Han, C.; Chen, S.; Yu, Y.; Xu, Z.; Zhu, B.; Xu, X.; Wang, Z. Evaluation of Agricultural Land Suitability Based on RS, AHP, and MEA: A Case Study in Jilin Province, China. Agriculture 2021, 11, 370. [Google Scholar] [CrossRef]
  91. Bünemann, E.K.; Bongiorno, G.; Bai, Z.; Creamer, R.; De Deyn, G.; Goede, R.; Fleskens, L.; Geissen, V.; Kuyper, T.W.; Mäder, P.; et al. Soil quality—A critical review. Soil Biol. Biochem. 2018, 120, 105–125. [Google Scholar] [CrossRef]
  92. Powlson, D.S. Soil health—Useful terminology for communication or meaningless concept? Or both? Front. Agric. Sci. Eng. 2020, 7, 246–250. [Google Scholar] [CrossRef] [Green Version]
  93. Karlen, D.; Andrews, S.; Doran, J. Soil quality: Current concepts and applications. Adv. Agron. 2001, 74, 1–40. [Google Scholar] [CrossRef]
  94. Grunwald, S.; Thompson, J.A.; Boettinger, J.L. Digital soil mapping and modeling at continental scales: Finding solutions for global issues. Soil Sci. Soc. Am. J. 2011, 75, 1201–1213. [Google Scholar] [CrossRef]
  95. Vogel, H.-J.; Eberhardt, E.; Franko, U.; Lang, B.; Ließ, M.; Weller, U.; Wiesmeier, M.; Wollschläger, U. Quantitative Evaluation of Soil Functions: Potential and State. Front. Environ. Sci. 2019, 7, 164. [Google Scholar] [CrossRef]
  96. Craheix, D.; Angevin, F.; Doré, T.; de Tourdonnet, S. Using a multicriteria assessment model to evaluate the sustainability of conservation agriculture at the cropping system level in France. Eur. J. Agron. 2016, 76, 75–86. [Google Scholar] [CrossRef]
  97. Obade, V.D.P. Integrating management information with soil quality dynamics to monitor agricultural productivity. Sci. Total Environ. 2019, 651, 2036–2043. [Google Scholar] [CrossRef]
  98. Glenk, K.; McVittie, A.; Moran, D. Deliverable D3.1: Soil and Soil Organic Carbon within an Ecosystem Service Approach Linking Biophysical and Economic Data. Report for EU FP7 SmartSOIL. 2012. Available online: http://smartsoil.eu/ (accessed on 8 October 2012).
  99. Zhang, G.L.; Wu, H.Y. From “problems” to “solutions”: Soil functions for realization of sustainable development goals. Bull. Chin. Acad. Sci. 2018, 33, 124–134. (In Chinese) [Google Scholar] [CrossRef]
  100. Ellili-Bargaoui, Y.; Walter, C.; Lemercier, B.; Michot, D. Assessment of six soil ecosystem services by coupling simulation modelling and field measurement of soil properties. Ecol. Indic. 2021, 121, 107211. [Google Scholar] [CrossRef]
  101. Rinot, O.; Levy, G.J.; Steinberger, Y.; Svoray, T.; Eshel, G. Soil health assessment: A critical review of current methodologies and a proposed new approach. Sci. Total Environ. 2019, 648, 1484–1491. [Google Scholar] [CrossRef]
  102. Zhao, R.; Wu, K.N.; Liu, Y.N.; Feng, Z. Soil Health Evaluation at a County level Based on Ecosystem Service Function. Chin. J. Soil Sci. 2020, 51, 269–279. [Google Scholar] [CrossRef]
  103. Hauck, J.; Albert, C.; Fürst, C.; Geneletti, D.; La Rosa, D.; Lorz, C.; Spyra, M. Developing and applying ecosystem service indicators in decision-support at various scales. Ecol. Indic. 2016, 61, 1–5. [Google Scholar] [CrossRef]
  104. Kragt, M.E.; Robertson, M. Quantifying ecosystem services trade-offs from agricultural practices. Ecol. Econ. 2014, 102, 147–157. [Google Scholar] [CrossRef]
  105. Pereira, P.; Bogunovic, I.; Muñoz-Rojas, M.; Brevik, E.C. Soil ecosystem services, sustainability, valuation and management. Curr. Opin. Environ. Sci. Health 2018, 5, 7–13. [Google Scholar] [CrossRef]
  106. Yang, Q.J.; Wu, K.N.; Feng, Z.; Zhao, R.; Zhang, X.D.; Li, X.L. Soil quality assessment on large spatial scales: Dvancement and revelation. Acta Pedol. Sin. 2020, 57, 565–578. [Google Scholar] [CrossRef]
  107. Calzolari, C.; Ungaro, F.; Filippi, N.; Guermandi, M.; Malucelli, F.; Marchi, N.; Staffilani, F.; Tarocco, P. A methodological framework to assess the multiple contributions of soils to ecosystem services delivery at regional scale. Geoderma 2016, 261, 190–203. [Google Scholar] [CrossRef]
  108. Yang, X.; Zheng, Q. Progress of agricultural biodiversity conservation in China. Biodivers. Sci. 2021, 29, 167–176. [Google Scholar] [CrossRef]
  109. Benton, T.G.; Vickery, J.A.; Wilson, J.D. Farmland biodiversity: Is habitat heterogeneity the key? Trends Ecol. Evol. 2003, 18, 182–188. [Google Scholar] [CrossRef]
  110. Zhang, J.L.; Zhang, J.Z.; Shen, J.B.; Tian, J.; Jin, K.; Zhang, F.S. Soil health and agriculture green development: Opportunities and challenge. Acta Pedol. Sin. 2020, 57, 783–796. [Google Scholar] [CrossRef]
  111. De Deyn, G.B.; van der Putten, W. Linking aboveground and belowground diversity. Trends Ecol. Evol. 2005, 20, 625–633. [Google Scholar] [CrossRef]
  112. Bardgett, R.D.; van der Putten, W. Belowground biodiversity and ecosystem functioning. Nat. Cell Biol. 2014, 515, 505–511. [Google Scholar] [CrossRef]
  113. Cameron, E.K.; Martins, I.S.; Lavelle, P.; Mathieu, J.; Tedersoo, L.; Bahram, M.; Gottschall, F.; Guerra, C.A.; Hines, J.; Patoine, G.; et al. Global mismatches in aboveground and belowground biodiversity. Conserv. Biol. 2019, 33, 1187–1192. [Google Scholar] [CrossRef]
  114. Lehman, R.M.; Cambardella, C.A.; Stott, D.E.; Acosta-Martinez, V.; Manter, D.K.; Buyer, J.S.; Maul, J.E.; Smith, J.L.; Collins, H.P.; Halvorson, J.J.; et al. Understanding and Enhancing Soil Biological Health: The Solution for Reversing Soil Degradation. Sustainability 2015, 7, 988–1027. [Google Scholar] [CrossRef] [Green Version]
  115. Fan, K.; Delgado-Baquerizo, M.; Guo, X.; Wang, D.; Zhu, Y.-G.; Chu, H. Biodiversity of key-stone phylotypes determines crop production in a 4-decade fertilization experiment. ISME J. 2021, 15, 550–561. [Google Scholar] [CrossRef] [PubMed]
  116. Wall, D.H.; Nielsen, U.N.; Six, J. Soil biodiversity and human health. Nat. Cell Biol. 2015, 528, 69–76. [Google Scholar] [CrossRef] [PubMed]
  117. Pulleman, M.; Creamer, R.; Hamer, U.; Helder, J.; Pelosi, C.; Pérès, G.; Rutgers, M. Soil biodiversity, biological indicators and soil ecosystem services—An overview of European approaches. Curr. Opin. Environ. Sustain. 2012, 4, 529–538. [Google Scholar] [CrossRef]
  118. Wagg, C.; Bender, S.F.; Widmer, F.; van der Heijden, M.G.A. Soil biodiversity and soil community composition determine ecosystem multifunctionality. Proc. Natl. Acad. Sci. USA 2014, 111, 5266–5270. [Google Scholar] [CrossRef] [PubMed] [Green Version]
  119. Van den Hoogen, J.; Geisen, S.; Routh, D.; Ferris, H.; Traunspurger, W.; Wardle, D.A.; De Goede, R.G.M.; Adams, B.J.; Ahmad, W.; Andriuzzi, W.S.; et al. Soil nematode abundance and functional group composition at a global scale. Nat. Cell Biol. 2019, 572, 194–198. [Google Scholar] [CrossRef] [PubMed] [Green Version]
  120. Delgado-Baquerizo, M.; Reich, P.B.; Trivedi, C.; Eldridge, D.J.; Abades, S.; Alfaro, F.D.; Bastida, F.; Berhe, A.A.; Cutler, N.A.; Gallardo, A.; et al. Multiple elements of soil biodiversity drive ecosystem functions across biomes. Nat. Ecol. Evol. 2020, 4, 210–220. [Google Scholar] [CrossRef]
  121. Sorokin, A.; Owens, P.; Láng, V.; Jiang, Z.-D.; Michéli, E.; Krasilnikov, P. “Black soils” in the Russian Soil Classification system, the US Soil Taxonomy and the WRB: Quantitative correlation and implications for pedodiversity assessment. Catena 2021, 196, 104824. [Google Scholar] [CrossRef]
  122. Xie, Y.; Lin, H.; Ye, Y.; Ren, X. Changes in soil erosion in cropland in northeastern China over the past 300 years. Catena 2019, 176, 410–418. [Google Scholar] [CrossRef]
  123. Yang, X.M.; Zhang, X.P.; Deng, W.; Fang, H.J. Black soil degradation by rainfall erosion in Jilin, China. Land Degrad. Dev. 2003, 14, 409–420. [Google Scholar] [CrossRef]
  124. Ding, R.X.; Liu, S.T. A study on the fertility of black soil after reclamation. Acta Pedol. Sin. 1980, 17, 20–32. [Google Scholar]
  125. Zhang, H.L.; Gao, W.S.; Chen, F.; Zhu, W.S. Prospects and present situation of conservation tillage. J. China Agric. Univ. 2005, 10, 16–20. [Google Scholar] [CrossRef]
Figure 1. The research frame diagram.
Land 10 00605 g001
Figure 2. Location of the study area. Source: Drawn by the authors.
Land 10 00605 g002
Figure 3. The supply matrix of cultivated land soil function (Adapted with permission from ref. [70]. Copyright 2016 Copyright Coyle, et al.).
Land 10 00605 g003
Figure 4. Soil function supply matrix of cultivated land in Heilongjiang province.
Land 10 00605 g004
Figure 5. The grade of soil primary productivity function of paddy fields and drylands.
Land 10 00605 g005
Figure 6. The grade of provision and cycling of nutrients function in paddy fields and drylands.
Land 10 00605 g006
Figure 7. The grade of provision of functional and intrinsic biodiversity function in paddy fields and drylands.
Land 10 00605 g007
Figure 8. The grade of soil water purification and regulation function in paddy fields and drylands.
Land 10 00605 g008
Figure 9. The grade of soil carbon sequestration and regulation function in paddy fields and drylands.
Land 10 00605 g009
Figure 10. The grade of soil function in Heilongjiang province.
Land 10 00605 g010
Figure 11. Proportion of supply and demand area of cultivated land soil function.
Land 10 00605 g011
Figure 12. Distribution map of supply-demand ratio of cultivated land soil function.
Land 10 00605 g012
Figure 13. Dominant soil functions of cultivated land in Heilongjiang province.
Land 10 00605 g013
Figure 14. Cultivated land use zones in Heilongjiang province.
Land 10 00605 g014
Table 1. Evaluation indicator system for cultivated land soil function.
Soil FunctionIndicator
Primary productivitySoil texture
Soil thickness/cm
Available soil moisture/mm
pH
Gravel contents
Soil organic carbon
Bulk density
Slope
≥10° Effective accumulated temperature
Provision and cycling of nutrientsSoil texture
Soil thickness
pH
Soil organic carbon
CEC
Bulk density
Provision of functional and intrinsic biodiversityBulk density
Soil organic carbon
pH
≥10° Effective accumulated temperature
Annual cumulative precipitation
Soil thickness
Available soil moisture
Soil texture
Water purification and regulationSoil texture
Soil thickness
Available soil moisture
Base saturation%
Gravel contents
Soil organic carbon
CEC
pH
Bulk density
Carbon sequestration and regulationSoil thickness
Soil texture
Bulk density
Soil organic carbon
Gravel contents
Table 2. Grading assignment criteria and weights of cultivated land soil function evaluation indicators.
Soil FunctionIndicatorGrading Assignment Criteria of IndicatorsIndicator WeightData Source of IndicatorWeight of Function
10090807060
Primary productivitySoil textureLoamClay Sand 0.1052Harmonized World Soil Database0.6912
Soil thickness/cm≥100(100, 80](80, 60] <600.0540
Available soil moisture/mm15012510075500.2100
pH[5.5, 7.5) [7.5, 8.5) ≥8.5 or <5.50.0879SoilGrids
Gravel contents≤4(4, 6](6, 8](8, 11]>110.0316
Organic carbon≥90(90, 70](70, 50](50, 40]<400.2857
Bulk density g/cm3[1, 1.25) [1.25, 1.45) ≥1.45 or <10.1566
Slope<2[2, 6)[6, 15) [15, 25)0.0457DEM data
≥10° Effective accumulated temperature≥2600(2600, 2480](2480, 2360](2360, 1995]<19950.0232Meteorological data
Provision and cycling of nutrientsSoil textureLoamClay Sand 0.0350Harmonized World Soil Database0.2258
Soil thickness≥100(100, 80](80, 60] <600.1482
pH[5.5, 7.5) [7.5, 8.5) ≥8.5 or <5.50.2640SoilGrids
Organic carbon≥90(90, 70](70, 50](50, 40]<400.4350
CEC/cmol/kg≥20(20, 15.4](15.4, 10.5](10.5, 6.2]<6.20.0363
Bulk density[1, 1.25) [1.25, 1.45) ≥1.45 or <10.0815
Carbon sequestration and regulationSoil thickness≥100(100, 80](80, 60] <600.0756Harmonized World Soil Database0.0242
Soil moistureLoamClay Sand 0.1427
Bulk density[1, 1.25) [1.25, 1.45) ≥1.45 or <10.2694SoilGrids
Organic carbon≥90(90, 70](70, 50](50, 40]<400.4690
Gravel contents≤4(4, 6](6, 8](8, 11]>110.0434
Provision of functional and intrinsic biodiversityBulk density[1, 1.25) [1.25, 1.45) ≥1.45 or <10.1091SoilGrids0.0242
Organic carbon≥90(90, 70](70, 50](50, 40]<400.3021
pH[5.5, 7.5) [7.5, 8.5) ≥8.5 or <5.50.2001
≥10° Effective accumulated temperature≥2600(2600, 2480](2480, 2360](2360, 1995]<19950.0476Meteorologic-al data
Annual cumulative precipitation≥640(640, 590](590, 550](550, 520]<5200.0476
Soil thickness≥100(100, 80](80, 60] <600.0917Harmonized World Soil Database
Available soil moisture15012510075500.0476
Soil textureLoamClay Sand 0.1543
Water purification and regulationSoil textureLoamClay Sand 0.0487Harmonized World Soil Database0.0346
Soil thickness≥100(100, 80](80, 60] <600.0944
Available soil moisture15012510075500.3037
Base Saturation/%≥80 (80, 50] <500.0252
Gravel contents≤4(4, 6](6, 8](8, 11]>110.0487SoilGrids
Organic carbon≥90(90, 70](70, 50](50, 40]<400.1913
CEC 0.0294
pH[5.5, 7.5) [7.5, 8.5) ≥8.5 or <5.50.0944
Bulk density[1, 1.25) [1.25, 1.45) ≥1.45 or <10.1640
Table 3. Evolution of soil function assessment over time in terms of objectives, tools, methods, and indicators.
Before 19701970–19901990–20102010 Onwards
Objectivessuitability for crop growthproductivityproductivity, environment, animal/human healthmulti-functionality, ecosystem services, resistance and resilience
Toolsvisual/analytical/digital
Methodssoil assessment based on color, structure, macrofaunasoil quality test kits, and (bio)chemistry, multivariate statisticshigh-throughput methods, add microbiology
Indicator trendsfew indicatorsmany indicatorsminimum data setsnovel indicators
Publisher’s Note: MDPI stays neutral with regard to jurisdictional claims in published maps and institutional affiliations.

