Article

Establishment of Crops under Minimal Soil Disturbance and Crop Residue Retention in Rice-Based Cropping System: Yield Advantage, Soil Health Improvement, and Economic Benefit

1
Soil Science Division, Bangladesh Agricultural Research Institute, Gazipur 1701, Bangladesh
2
Department of Soil Science, Bangladesh Agricultural University, Mymensingh 2202, Bangladesh
3
Centre for Sustainable Farming Systems, Future Food Institute, Murdoch University, Perth, WA 6150, Australia
4
Project Implementation Office, Murdoch University, Dhaka 1230, Bangladesh
5
International Rice Research Institute, Bangladesh Office, Dhaka 1213, Bangladesh
6
Department of Biology, College of Science, Taif University, P.O. Box 11099, Taif 21944, Saudi Arabia
7
Rice Research and Training Center (RRTC), Field Crops Research Institute, Agricultural Research Center, Kafr Elsheikh 33717, Egypt
8
Department of Agronomy, Faculty of Agriculture, University of Kafrelsheikh, Kafrelsheikh 33516, Egypt
*
Author to whom correspondence should be addressed.
Land 2021, 10(6), 581; https://doi.org/10.3390/land10060581
Submission received: 1 May 2021 / Revised: 25 May 2021 / Accepted: 26 May 2021 / Published: 31 May 2021
(This article belongs to the Section Soil-Sediment-Water Systems)

Abstract

:
Minimum soil disturbance and increased crop residue retention practices are promising options to enhance soil organic matter, nutrient concentration and crop yield. However, the potentials of the practices in improving soil properties, increasing crop yield and in ensuring economic return have not been tested in the monsoon rice (Oryza sativa L.)-lentil (Lens culinaris L.)/wheat (Triticum aestivum L.)-jute (Corchorus culinaris L.) cropping systems on seasonally flooded lowlands of the Eastern Gangetic Plain of South Asia. A field trial for consecutive three years was conducted in the Gangetic Plains of Bangladesh to evaluate the effects of zero tillage (ZT), strip-tillage (ST), bed planting (BP) and conventional tillage (CT) with two residue retention levels (RL—a low level similar to current farmers’ practice and RH—increased retention) on soil properties, yield and economic return. Between rice and jute crops, lentil was grown for the 1st and 2nd years and wheat for the 3rd year during the dry winter season. The ST and BP performed better than the CT and ZT in terms of yield of rice and lentil, whereas ST and ZT performed better than other practices in the case of jute. Higher residue retention (RH) increased crop yield for all the years. The highest rice equivalent yield (sum of 3 crop yields, expressed as rice yield) and the greatest benefit-cost ratio (BCR) were recorded with ST and RH. The increased yield in the ST was associated with reduced soil bulk density (BD), while ST with RH increased soil water (SW) and decreased penetration resistance (PR) of soil. Compared to CT, minimum soil disturbance of ZT and ST increased soil organic matter (SOM) stock by 24% and 23%, respectively; total nitrogen (TN) by 23.5% and 18.4%, respectively; extractable sulphur (S) by 21% and 18%, respectively; whereas Zinc (Zn) concentrations increased by 53% and 47%, respectively, in the upper 0–5 cm soil depth. Accumulation of extractable P, S and Zn in the 0–5 cm depth of soil followed the sequence as ZT > ST > BP > CT practice. The higher amount of residue retention significantly increased SOM, TN and extractable P, K, S and Zn concentrations at 0–5 cm and 5–10 cm soil depths. The 3-year study suggests that ST with RH is a potential crop management approach for the seasonally flooded rice-lentil/wheat-jute cropping systems to enhance soil nutrients status, crop yield and farm economy.

1. Introduction

Fitting novel rice (Oryza sativa L.) establishment practices in the wetland rice–upland crop intensive cropping systems has always been a challenge. The benefits of following minimum soil disturbance and crop residue retention for establishing upland crops may be destroyed during establishing rice crop by puddling [1,2]. To fit conservation agriculture (CA) in rice-based triple cropping systems, puddling has been replaced by direct seeding of rice (dry, wet and water seeding), but they have their own demerits for the timeliness, labour use, water productivity, input requirement, drudgery, fuel consumption, energy use, yield sacrifice, economic return and GHG fluxes [3,4,5]. Accordingly, the beneficial farming principles of CA are not yet adopted widely in rice-based cropping systems particularly in South Asia [6]. A novel solution to overcome these problems can be non–puddled rice crop establishment practice which, in some environments and soils, has been reported to perform well in terms of yield increase, soil properties improvement, global warming mitigation and economic return [2,5,7,8,9]. More research is needed in diversified soils and cropping systems to showcase the potentials of CA cropping so that farmers, as well as policymakers, see the merits of adopting CA cropping in the Eastern Gangetic Plains (EGP).
Yield sustainability of CA cropping over time is based on soil fertility improvement which occurs by following its principles (minimal disturbance of soil, crop residue retention and growing crops in rotation). Long-term studies indicate that zero or minimum soil disturbance either improves or maintains soil fertility and productivity and similarly increases [10] or gives similar [11] crop yields in comparison with conventional cropping systems. In addition, crop residue retention builds SOM level and nitrogen reserves and also influences soil nutrient availability [12]. Soil physical and biological properties [7,9,13] are also influenced by crop residue retention. Appropriate crop rotation reduces weed infestation and fertilizer inputs use, increases nitrogen (N) availability, maintains soil fertility and thereby increases crop yields [14]. Legumes, such as lentil, in the cropping sequence, have the potential to enhance soil N concentration by fixing atmospheric N [15]. Jute, an important cash crop in Bangladesh, drops large amounts of leaf litter to the soil during crop growth, which improves the physical and chemical characteristics of soil [16,17]. Cassman et al. [18] categorically stated that soils of rice-based double—or triple—cropping accumulate a significant amount of nutrients over time, even with the removal of all aboveground biomass from the field and without organic manure application. Many previous studies reported that CA practices increase crop yield by improving soil fertility, conserving soil water and sequestering organic carbon in farm soils [3,19]. But very few studies report how CA cropping was applied to rice-upland cropping systems in the low lying areas which prevail in the EGP and other parts of Bangladesh. The alteration of soil properties under the CA cropping (non-puddled transplanting of rice and strip planting and bed planting for upland crops) in rice-based cropping systems in the low lying areas has also not been reported.
A range of cropping systems (more than 300) are practiced on the EGP depending on the land types and the availability of irrigation water [20]. Jute is common in the flooded area of the EGP and the component crops are grown by traditional crop establishment practices. As a result, soil health has been reported to deteriorate and nutrient mining has occurred under the traditional practices all over the EGP and Bangladesh [3,16]. Limited research has been done on CA practice on light-textured soils in seasonally flooded lands that support the rice-jute cropping system [21]. Soils with lower organic matter content and sandy texture can respond more to the implementation of a CA in terms of soil health and crop yield than loam and clay textured soils [22]. However, the adoption of minimal soil disturbance (strip tillage/bed planting/zero tillage for upland crops and non-puddling for rice) and residue retention for all component crops in intensive triple cropping systems can alter the stratification and availability of nutrients in the soil [1,23,24,25]. Few studies have been done to record the alterations in terms of soil health, crop yield and economics of the complete CA cropping [1,3,8,24] which are required for a complete assessment of CA cropping in the Gangetic Plains. The study was, therefore, conducted to measure changes in physical properties, SOM, soil nutrient concentrations yields and profitability of crops in the monsoon rice-lentil/wheat-jute cropping system under different crop establishment and crop residue retention practices.

2. Materials and Methods

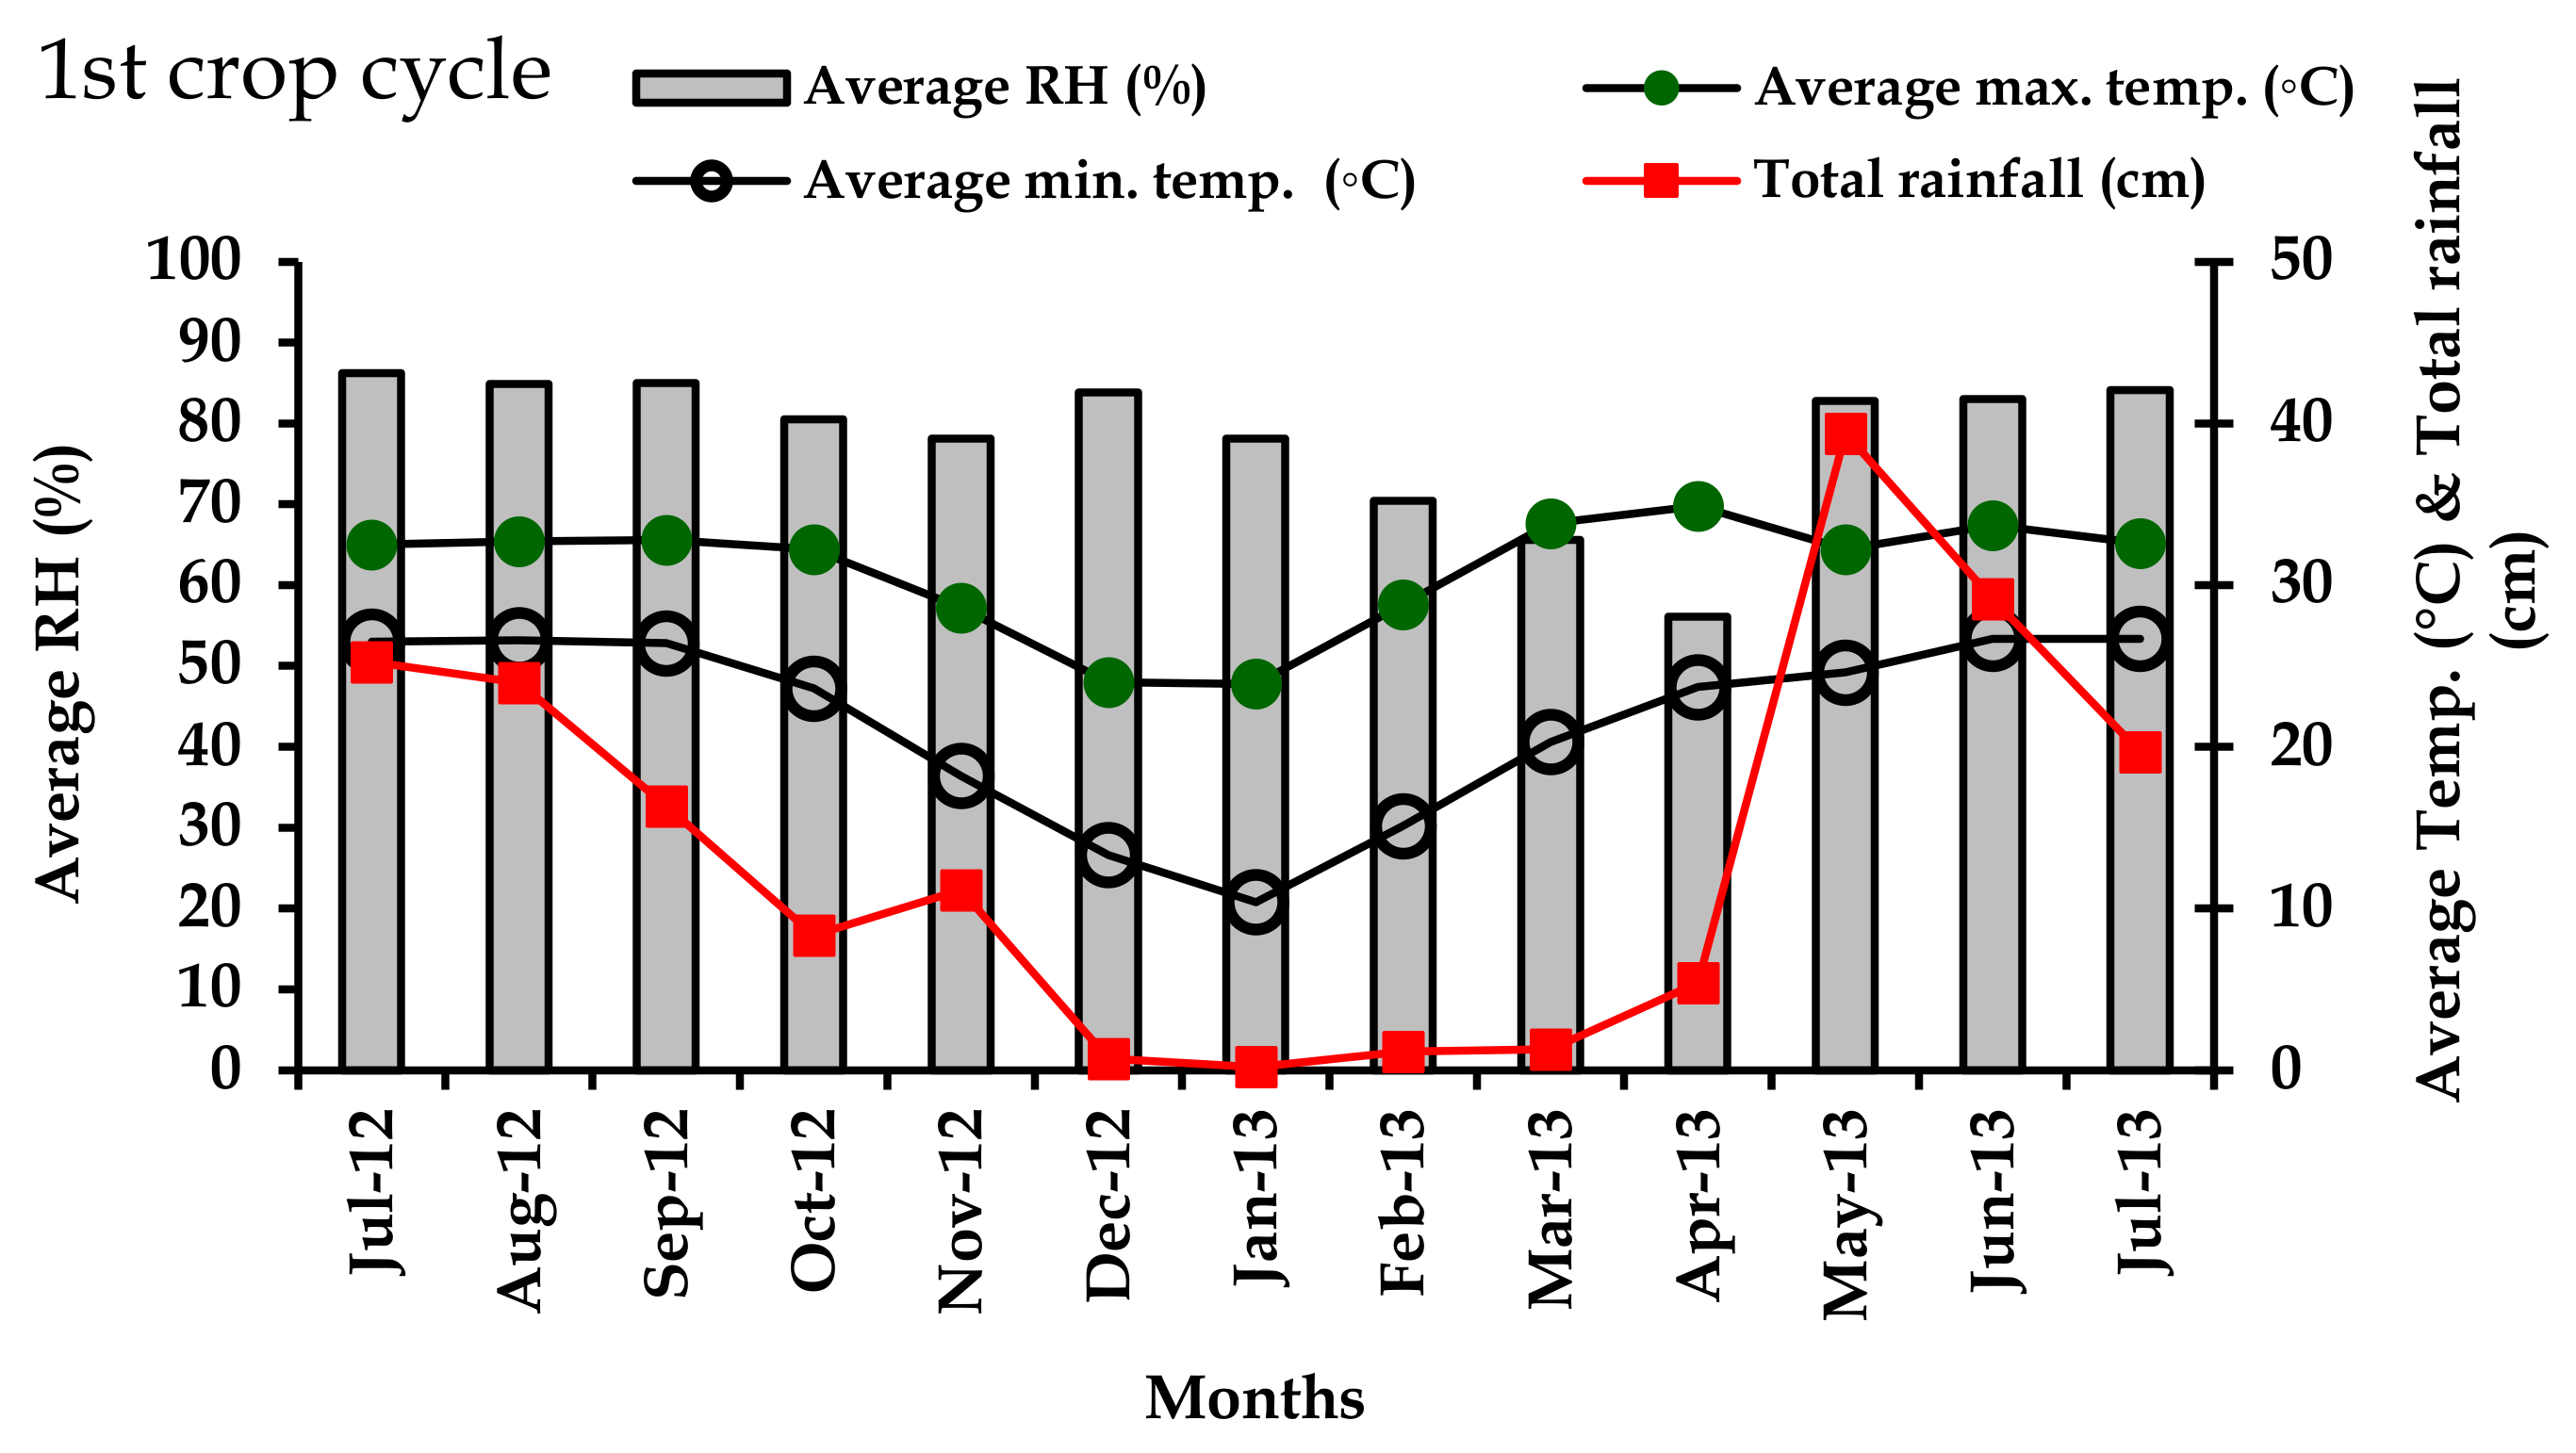
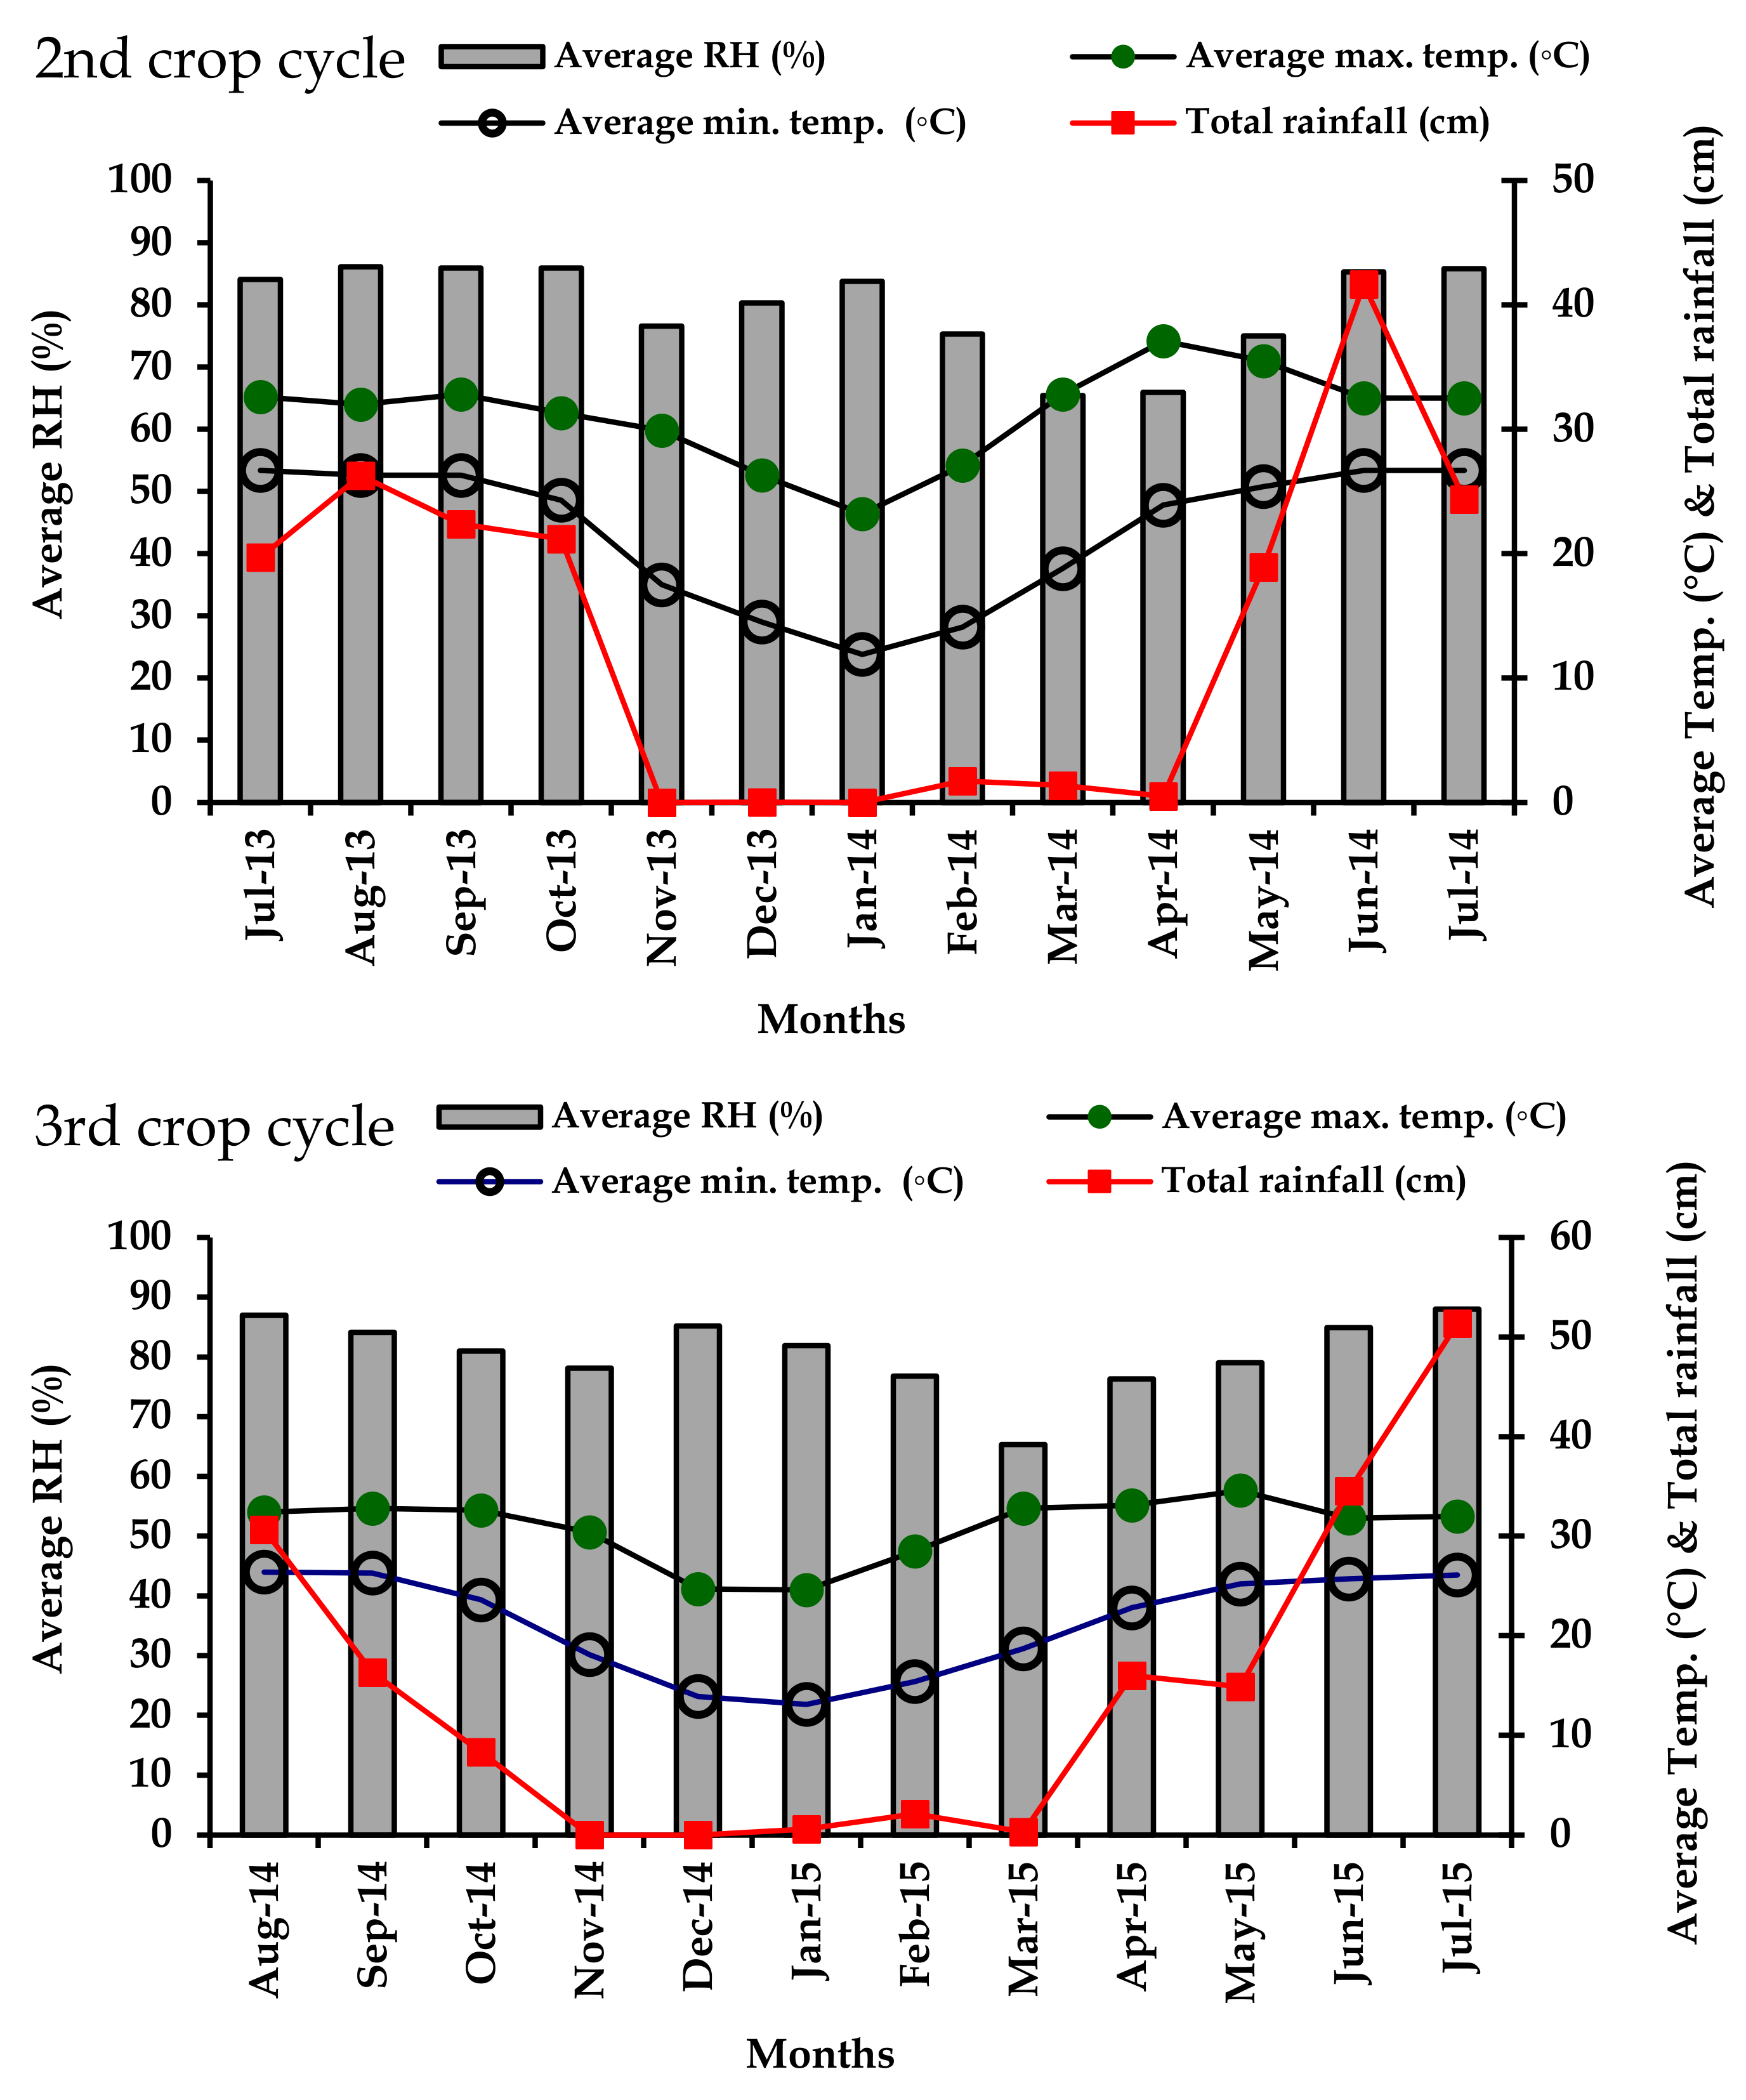
2.1. Experimental Site

The experiment was conducted in a farmer’s field of Baliakandi Upazila (sub-district) under the Rajbari district of Bangladesh from 2012 to 2015. The experimental field was located in the Low Ganges River Floodplain agro-ecological zone (AEZ-12). It was classed as medium low land (8 m above sea level) where the rainwater drained out within 24 hours. The soil texture was sandy loam while the soil is classified as a Chromic-Calcaric Gleysol (FAO Soil Unit) [26] and Aeric Haplaquept (USDA Soil Family) according to [27]. The major cropping pattern following in this area is the rainy season rice-lentil/wheat-jute sequence. The climate of this area is subtropical-maximum temperatures prevail in the months of April–May and the minimum temperatures in the months of December–January. Rabi season (November to March) is the dry season and almost no rainfall occurs during this time while the highest rainfall occurs during the months of July–August. Weather data, including temperatures (maximum and minimum), rainfall, and relative humidity during the study period are shown in Figure 1.

2.2. Treatments and Experiment Layout

The trial included four soil tillage options-zero tillage (ZT), strip-tillage (ST), bed planting (BP) and conventional tillage (CT), and two levels of crop residue retention-low retention level equivalent to farmer’s practice (RL) and increased residue retention (RH). The residue levels were maintained by height for rice and wheat, and by weight for lentil and jute. All of the senesced leaves fell to the soil surface during the growing season regardless of residue treatments (Table 1). The experiment was laid out in a split-plot design with four replications. Tillage practices were allocated to the main plots and residues to the sub-plots. Each of the experimental sub-plots was 9 × 6 m. The beds were prepared for the first crop and they were reformed for every subsequent crop over the experimental period.

2.3. Cropping Pattern and Variety

The cropping pattern was transplanted monsoon (aman) rice (Oryza sativa)-lentil (Lens culinaris)-jute (Corchorus olitorius), except in the 3rd year where lentil was replaced by wheat (Triticum aestivum) because of high rainfall during the sowing time. The crop varieties were Binadhan-7 for rice, BARI mosur-3 for lentil, Nabin (JRO-524) for jute, and Prodip (BARI Gom-24) for wheat.

2.4. Preparation of Different Soil Management Plots and Seeds or Seedling Planting

  • Zero tillage (ZT)—For the rice, plots were irrigated and flooded for 18–24 hours just immediately before transplanting and then 30-day old seedlings were manually transplanted directly into the wet, softened soil with a spacing of 25 × 15 cm. In case of lentil, jute and wheat, ZT was accomplished by one pass with a Versatile Multi–crop Planter (VMP) using a narrow furrow opener that opened a 2–3 cm wide and 1.0–1.5 cm deep slot maintaining 25 cm row spacing. Basal fertilizers were placed in the furrows below and to the side of the seed, respectively using VMP.
  • Strip tillage (ST)—the seed/seedling zone (3–5 cm wide and 3–4 cm deep) was rotary tilled while the inter-row with crop residue retained was left undisturbed. The ST was accomplished by VMP using rotating blades maintaining 25 × 15 cm spacing and placing seed and fertilizer behind narrow furrow openers. In case of rice, first strip tillage was carried out and then the soil was flooded by irrigation for 18–24 hours before transplanting rice seedlings in the non–puddled strip. For sowing of lentil, jute, and wheat seeds, ST was done by one pass with VMP maintaining 25 cm spacing from row to row and at the same time seeds and fertilizers were placed in the strip.
  • Bed planting (BP)—the new beds around 15–16 cm height were prepared at the beginning of the experiment in 2012 by using VMP in a one-pass operation. Thereafter, the beds were maintained but reshaped for subsequent crops (e.g., lentil, jute and wheat) by the VMP. Rice seedlings were transplanted manually on both edges of the raised beds whereas seeds of lentil, jute and wheat were sown on the same edges in the subsequent season. Basal fertilizers were applied on top of the re-shaped beds.
  • Conventional tillage (CT)—For rice, irrigation was applied to the plots up to saturation level, and then soil was puddled with three passes by a rotary tiller followed by two passes by soil leveler and then manual transplanting of rice seedling. For sowing of lentil, jute and wheat a high-speed rotary tiller was used for tillage two passes maintaining a 10–12 cm depth followed by two leveling operations. The seed rate was 35, 8, 120 kg ha−1 for lentil, jute and wheat, respectively for all the tillage options.

2.5. Fertilizer Application

Fertilizer application rates followed the national recommendations according to the Fertilizer Recommendation Guide [16]. The rates of nutrient application were 83, 24, 35, 11 and 2 kg ha−1 N, P, K, S and Zn for rice; 20, 17, 20, and 1 kg ha−1 N, P, K and Zn, respectively, for lentil; 75, 7, 18, 7 and 1 kg ha−1 N, P, K, S and Zn, respectively, for jute; and 100, 26, 50, 20, 1.25 and 1 kg ha−1 N, P, K, S, Zn and B, respectively, for wheat. The fertilizers urea, triple superphosphate, muriate of potash, gypsum, zinc sulphate and boric acid were used as sources of N, P, K, S, Zn and B, respectively.

2.6. Pest Management

Three days prior to land preparation for each crop, a non-selective pre-planting herbicide, Roundup [Glyphosate, N-(phosphonomethyl) glycine] at the rate of 3.75 L ha−1 was sprayed on the whole experimental field to suppress weed infestation. A pre-emergence herbicide, Rifit 50 EC (Pretilachlor) at the rate of 2 L ha−1 was applied at five days after transplanting (DAT) of rice seedlings and following hand weeding if required. A post-emergence selective herbicide, Whip super 9 EC® (Fenoxaprop-P-ethyl), was used at 18 days after sowing (DAS) at the rate of 650 mL ha−1 for jute and a hand weeding was done in lentil at 28 DAS. For wheat, weeds were controlled partially by spraying a post-emergence selective herbicide, Affinity (Carfentrazone ethyl + Isoproturon), at the rate of 2.5 g L−1 water at 20 DAS. Virtako (Chlorantraniliprole 20% + thiamethoxam 20%, at the rate of 75 g ha−1) was sprayed at 52 DAT to control the disease.

2.7. Crop Harvest and Data Recording

Each crop was harvested in its maturity stage. After harvest, the grain and straw yields for rice and wheat, seed and stover yields for lentil, and fibre and stick yields for jute were determined. Final grain yield was converted to t ha−1 at 14% moisture content for rice, and at 12% moisture content for wheat and lentil.

2.8. Soil Analysis

Soil samples from all treatments were collected at 0–5, 5–10 and 10–15 cm depths. After harvesting of the 2nd (lentil), 5th (lentil) and 8th crop (wheat), soil bulk density (BD) was measured by core method [28] and cone penetration resistance (PR) was measured by Hand Penetrometer (Eijkelkamp Equipment, Model 06.01, Serial No. 11911698/11, Giesbeek, The Netherlands). Soil water content (SWC) was measured by using an MPM–160 Moisture Probe Meter (ICT International Pty Ltd.). The PR and SWC were measured at the same time and it was repeated three times [29]; the cone PR was expressed in N cm−2 [30]. Soil organic carbon (SOC) was measured by the wet oxidation method [31] and SOM was calculated by multiplying percent SOC with the van Bemmelen factor, 1.73 [32]. Total N was measured by micro-Kjeldahl method [33], available P by the 0.5 M NaHCO3, pH 8.5 extraction [34], exchangeable K by NH4OAc extraction [35], available S by CaCl2 extraction [36] and available Zn by DTPA extraction [37].

2.9. Calculation of Rice Equivalent Yield

Rice Equivalent Yield (REY) of component crops (rice, lentil, jute and wheat) in the cropping pattern was computed by using Formula (1) [38]:
REY = Rice   yield + Other   crop   yield   t / ha × Market   price   of   other   crop Tk . / tonne Market   price   of   rice   Tk / t

2.10. Economic Analysis

The cost of production under different tillage practices and residue retention levels was calculated based on the total cost of products and total production cost. Rental charge of the land and input costs were the components of production cost. The cost for seed, seedling raising, VMP and power–tiller hiring for land preparation, fertilizers, labour, herbicides, insecticides, weeding, planting, intercultural operations, irrigation, harvest and post-harvest operations were the total variable costs. Total input cost was calculated as total variable cost (inputs, labour) plus total fixed cost (land rent) plus investment interest (considering 8%). Gross return was estimated as the sum of the market price of products and by-products of crops per hectare in each year. Prices of products and production costs are used to calculate the net return, gross margin and benefit–cost ratio (BCR). The BCR was computed as the gross return divided by total input cost whereas net return was calculated by subtracting the total input cost from the gross return, and gross margin was calculated by subtracting the total variable cost from gross return [39]. All the prices were converted to US dollars by using the conversion rate on 1 June 2018.

2.11. Statistical Analysis

All measured and calculated data were analyzed statistically using a two-way factorial model based on a split-plot design. Treatment effects for the variables were tested by analysis of variance (ANOVA), and comparisons among the treatment means were made using the Least Significant Difference (LSD) test at 5% level of probability (p < 0.05). Statistical procedures were carried out following the software program SPSS version 21 for Windows.

3. Results

3.1. Effects of Tillage and Residue on Crop Yield

3.1.1. Rice

The rice grain yield was greatly varied due to different tillage options in all three years (Table 2). In the first year, the tillage option CT and ST had similar yields, while transplanting on zero tilled soil (ZT) had the lowest yield (2.66 t ha−1). However, in the 2nd and 3rd years, the highest grain yield was observed in ST practice and BP had a significantly similar yield to ST. In the 2nd and 3rd years the lowest grain yield was noted in CT practice which was similar to ZT practice. There was no marked variation in rice grain yield between high and low residue retention in the 2nd year, however, in the 3rd year, the high residue retention produced 0.5 t ha−1 higher grain yield over low residue retention.

3.1.2. Lentil

In the 1st year, the CT practice produced the highest seed yield (1.98 t ha−1), followed by ST (1.76 t ha−1). The ZT produced the lowest seed yield (1.40 t ha−1) (Table 2). But in the 2nd year, the highest seed yield was recorded in BP (1.93 t ha−1), followed by ST (1.65 t ha−1), while the lowest yield was in CT (1.19 t ha−1). Increased retention of crop residues resulted in the increased seed yield in the 2nd year, but not in the 1st year.

3.1.3. Jute

The fibre yield of jute significantly (p < 0.05) responded to different tillage options in all three years. The highest fibre yield was obtained from ST (4.69, 4.87 and 4.22 t ha−1 in the 1st, 2nd and 3rd years, respectively) which was statistically similar to ZT, whereas BP produced the lowest fibre (Table 2). Significantly higher fibre yield (4.34 and 3.79 t ha−1 in the 2nd and 3rd years, respectively) was recorded with an increased amount of residue retention compared to the lower amount of residue retention.

3.1.4. Wheat

Neither crop establishment practices nor residue retention had significant effects on wheat yields (Table 2). However, increased residue retention increased wheat grain yield by 0.16 t ha−1.

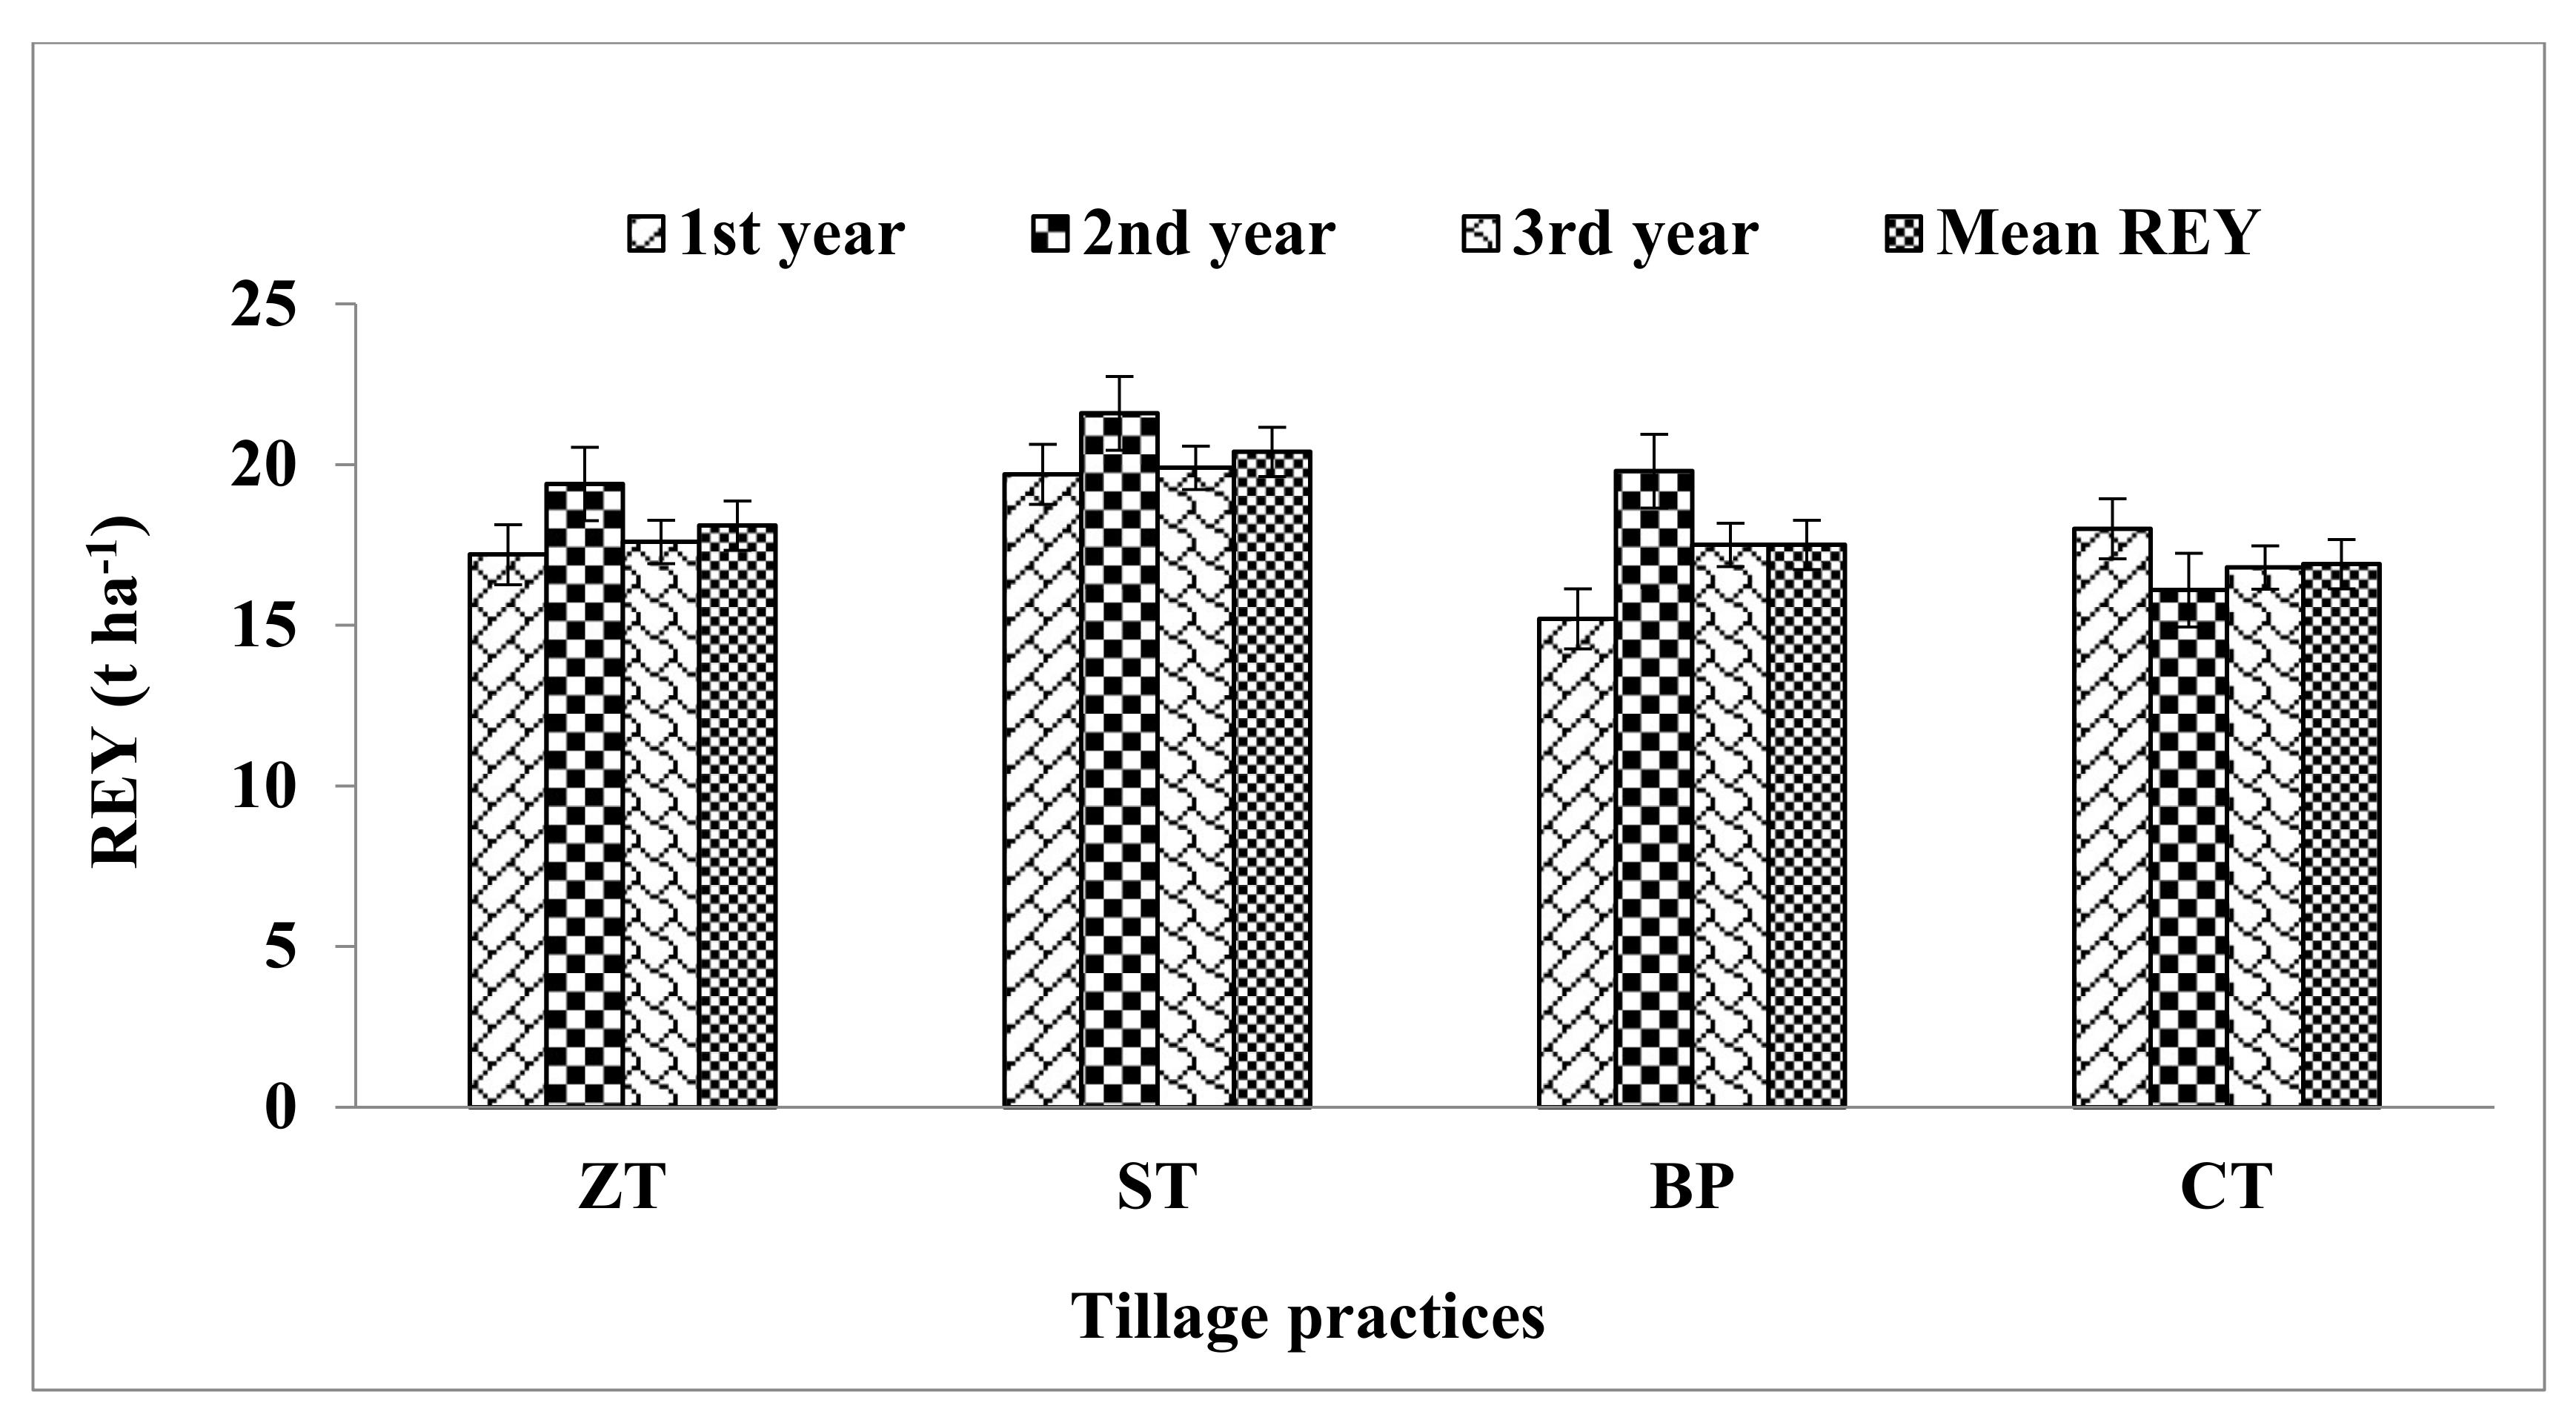
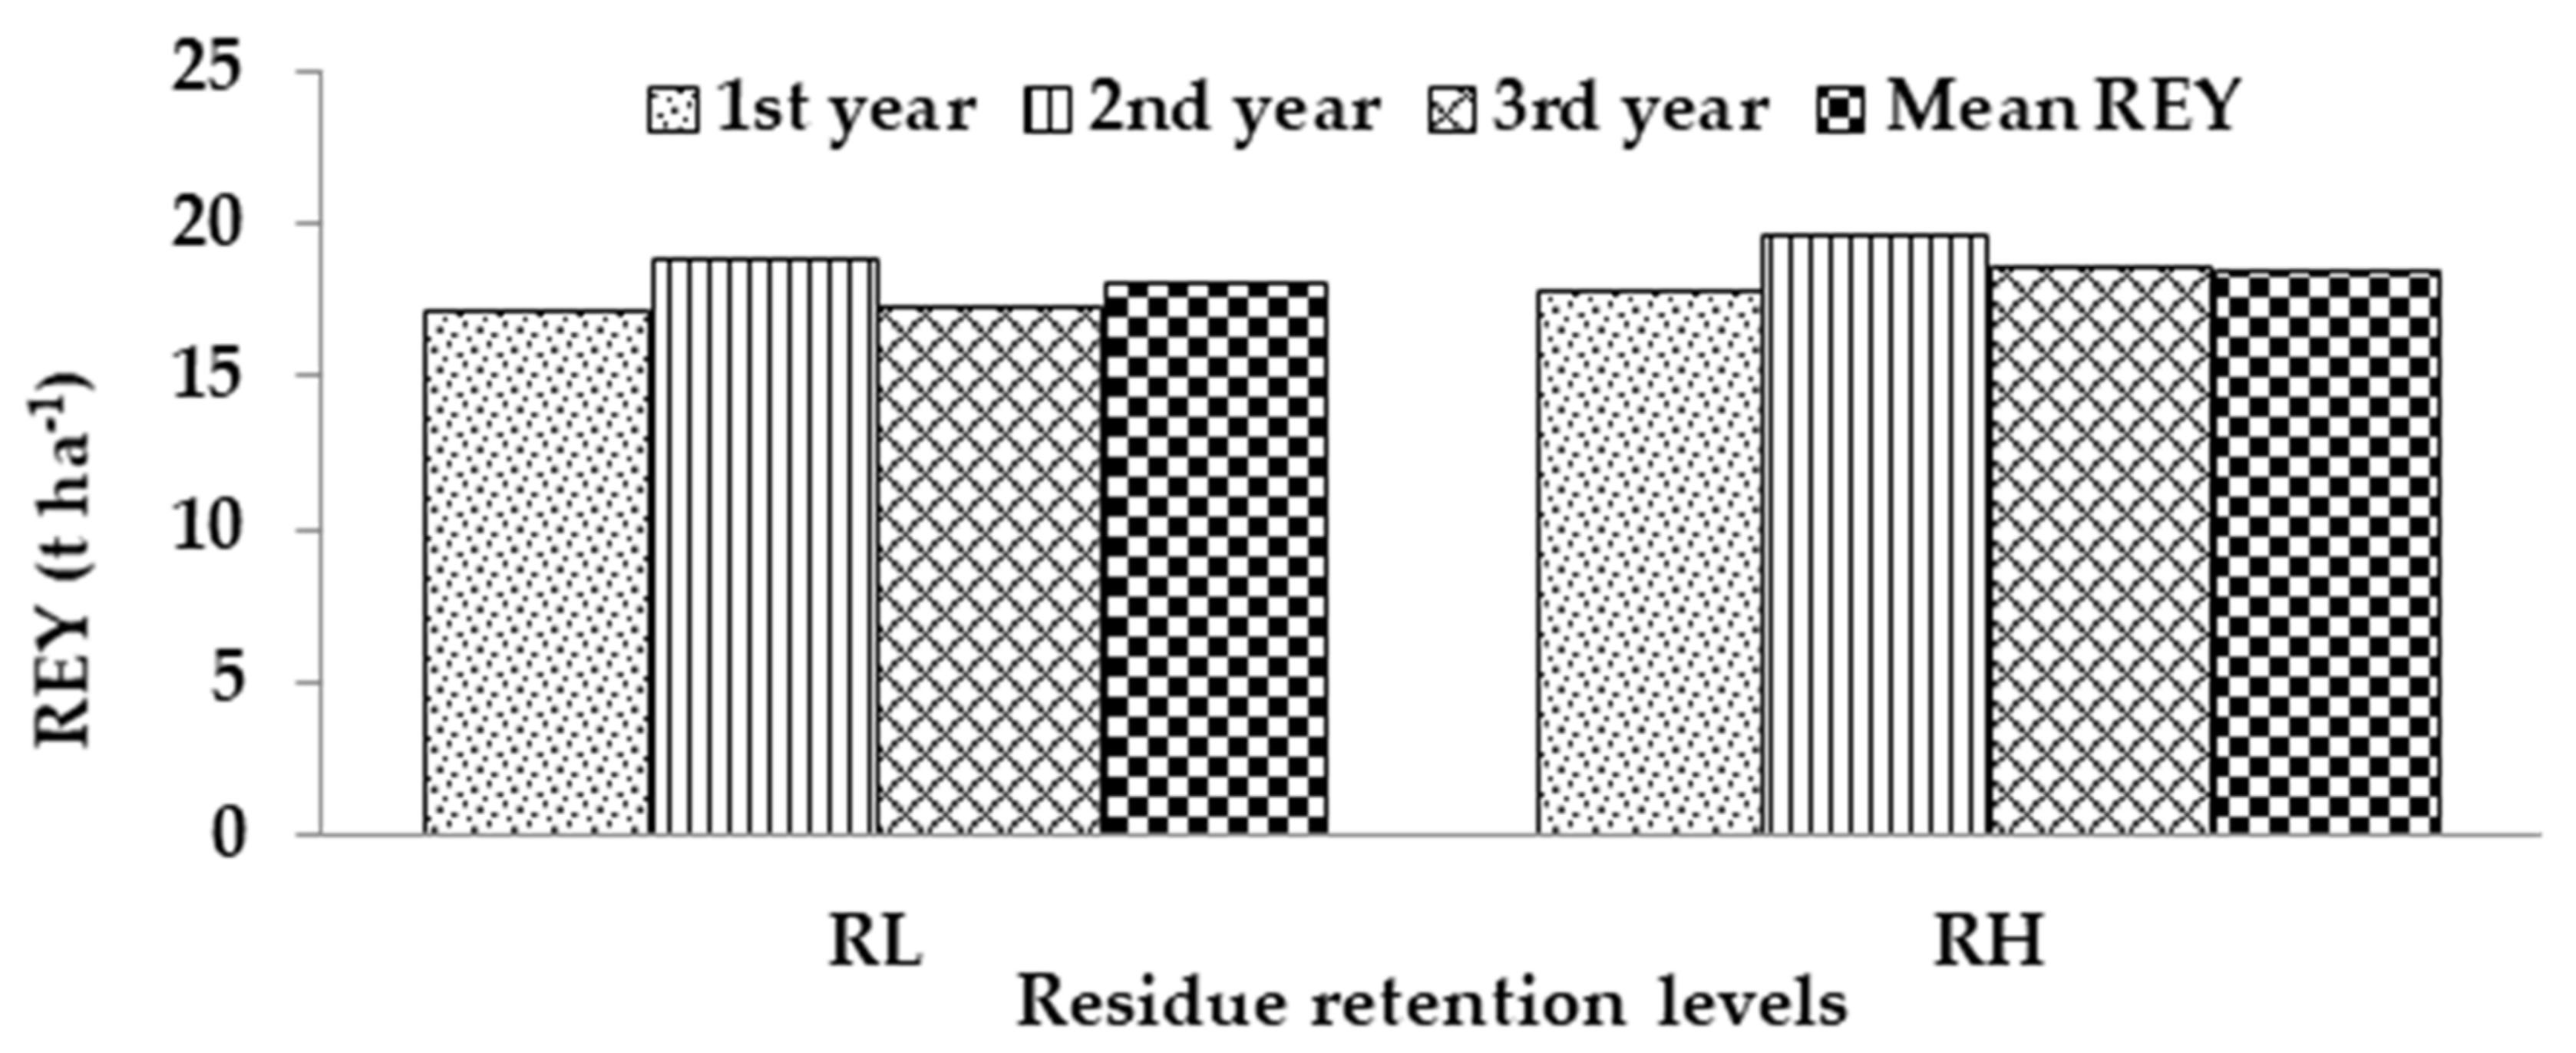
3.1.5. Cropping System Yield

The total yield of the crops grown in a sequence on the same piece of land in a year was expressed as rice equivalent yield (REY). The ST planting consistently gave higher REY over the years. Over the three years, across residue retention levels, the maximum mean REY was observed in ST (20.4 t ha−1) which was significantly higher than REY in ZT (18.1 t ha−1), BP (17.5 t ha−1) and CT (16.9 t ha−1) as shown in Figure 2. The increased residue level produced higher REY than the low residue level, as evidenced in years 2 and 3, and when averaged over three years (Figure 3). Over the three years, the mean REY increased by 0.5 t ha−1 due to RH compared to RL.

3.2. Effects of Tillage and Residue Retention on Soil Physical Properties

3.2.1. Bulk Density

After harvest of the 8th crop, compared with the initial soil bulk density (BD), the lowest BD was recorded in soil under ST (Table 3). Soil BD in soils under all tillage practices increased with increasing soil depths. For example, soil BD at 0–5 cm depth in ST declined to 1.45 g cm−3 from the initial BD (1.51 g cm−3); at 5–10 cm depth, it was declined to 1.49 g cm−3 from 1.53 g cm−3 and at 10–15 cm soil depth, it dropped to 1.52 g cm−3 from 1.55 g cm−3. The residue retention practices did not affect the soil BD in any soil depths (Table 3).

3.2.2. Soil Penetration Resistance

Across residue retention practices, the soil PR decreased in the order of ST < ZT ~ CT < BP at 0–5, 5–10 and 10–15 cm soil depths. In addition, the soil PR was always lower where increased residue was retained compared to low residue retention (Table 3). The changes in soil PR were most strongly correlated with changes in soil BD at 10–15 cm (R2 = 0.53). The tillage practices affected soil PR independently of residue retention effects.

3.2.3. Soil Water Content

After harvest of the 8th crop (wheat), ST, ZT and CT had higher water content compared with BP in the upper soil depth (0–5 cm) (Table 3). Significantly higher soil water was conserved in ST followed by CT, ZT and BP, respectively, in the 5–10 and 10–15 cm soil depths. Increased residue retention had higher SWC compared to SWC in low residue retention. Soil water content (SWC) was inversely related to soil PR at all soil depths (r = −0.98, p < 0.01) (Figure 3).

3.2.4. Soil Water Content

After harvest of the 8th crop (wheat), ST (13.7% water content), ZT (13.3%) and CT (12.6%) had higher water content compared with BP (10.8 %) in the upper soil depth (0–5 cm) (Table 3). Significantly higher soil water was conserved in ST (18.9 and 20.0%) followed by CT (17.6 and 18.3%), ZT (16.6 and 17.0%) and BP (15.3 and 16.2%), respectively, in the 5–10 and 10–15 cm soil depths. Increased residue retention had higher SWC compared to SWC in low residue retention. Soil water content (SWC) was inversely related to soil PR at all soil depths (r = −0.975, p < 0.01) (Figure 4).

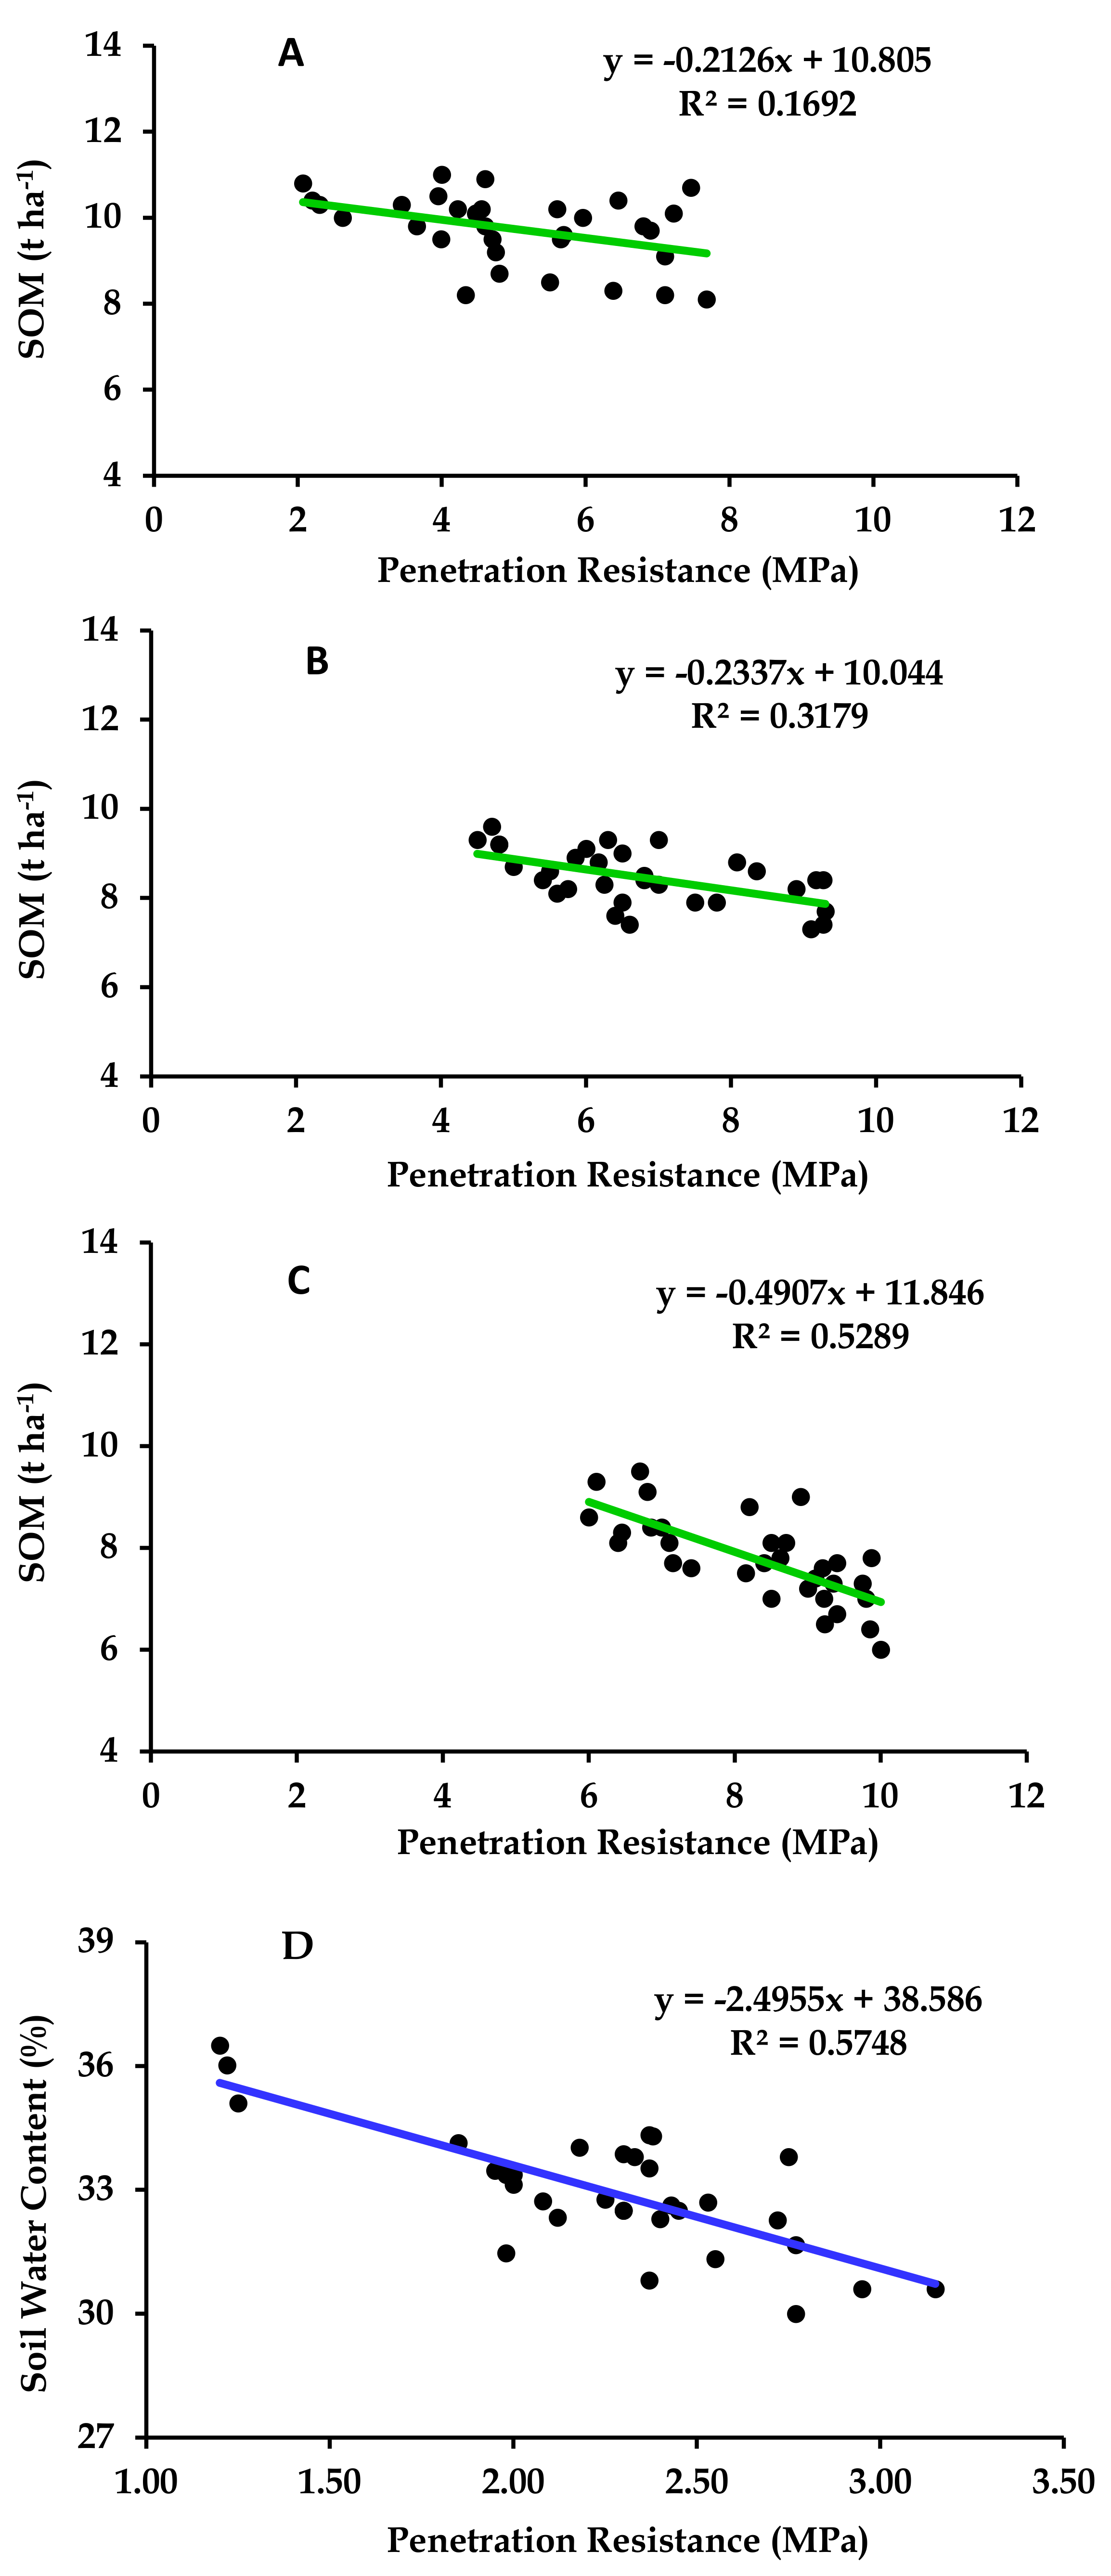
3.3. Soil Organic Matter

The establishment of crops by following minimum soil disturbance practices (ST and ZT) for all crops in rice-based cropping system promoted SOM accumulation over three years. The highest SOM stock was recorded in ZT (10.2 t ha−1) and ST (10.1 t ha−1). The SOM content of the uppermost soil depth (0–5 cm) in ZT, ST, BP and CT increased by 24%, 23%, 17% and 11%, respectively, compared to the initial SOM stock (8.2 t ha−1). The accumulation was higher at 0–5 cm soil depth than other soil depths (Table 4). At 5−10 cm and 10–15 cm soil depths, SOM stock did not significantly vary with tillage practices. The RH treatment significantly increased the SOM compared to RL at all soil depths. The SOM content was inversely related to soil penetration resistance (r = −0.727, p < 0.01). Like other soil properties, there was no interaction between tillage practice and residue retention on SOM content over the soil depths.

3.4. Effects on Soil Fertility

3.4.1. Soil N Content

After three years of CA-based cropping, N stocks in the upper soil increased. After the 3rd year, the highest N stock (0.531 t ha−1) was found in ZT, ST (0.509 t ha−1) and BP (0.496 t ha−1) and the lowest N stock was in CT practice (0.45 t ha−1) at the upper 0–5 cm soil layer (Table 4). No significant differences were recorded among the tillage practices at the lower soil depths (5−10 and 10–15 cm). The N stocks increased by 22%, 13% and 20% at 0–5, 5–10 and 10–15 cm depth soils under increased residue retention over initial N stock. On the other hand, the average low residue retention in the soil (across tillage treatments) had 9%, 8% and 6% increased N stocks at 0–5, 5–10 and 10–15 cm soil depths, respectively, based on the initial N stocks of 0.43, 0.398 and 0.364 t ha−1, respectively.

3.4.2. Soil P Concentration

Minimal disturbance of soils affected P concentration (NaHCO3 extractable), particularly in the upper 0–5 and 5–10 cm depths after the three years of CA cropping (Table 4), with higher values in ZT and ST than in BP and CT. The P increased by 66%, 62%, 52% and 28% in the 0–5 cm soil layer and by 51%, 45%, 40% and 29% at 5–10 cm soil depth, in ZT, ST, BP and CT practices, respectively, over the initial values of 6.1, 5.5 and 4.7 mg kg−1, respectively. Higher extractable P concentrations (67% increase at 0–5 cm and 53% at 0–10 cm depth) were obtained in the increased crop residue retained soils, whereas 38% and 31% higher P levels were recorded in low residue retained soils at 0–5 and 5–10 cm soil depths, respectively, compared to initial P status.

3.4.3. Soil K Concentration

The exchangeable K content was not influenced significantly by the different tillage practices over the soil depths (Table 5). On the other hand, the increased amount of crop residue retention significantly increased the exchangeable K content at all soil depths (0–5, 5–10 and 10–15 cm). An average of 50%, 53% and 38% more exchangeable K was noted in increased residue retained soils, whereas in low residue retained soils the increase was 27%, 31% and 22% at three soil depths, respectively, compared to the initial values.

3.4.4. Soil S Concentration

Minimal tillage practices (ZT, ST and BP) showed significant effects on soil S content. The highest extractable S content was found in ZT (17.7 mg kg−1), ST (17.2 mg kg−1) and BP (16.5 mg kg−1) at 0–15 cm depth which were significantly higher than CT practice (15.3 mg kg−1) (Table 5). The increase was 21% in soils under ZT and 18% in ST at 0–5 cm soil depth over the initial level. However, there were no significant differences observed in extractable S content in the deeper two layers (5–10 and 10–15 cm). The increased residue retention practice had increased extractable S concentrations at all soil depths (Table 5). At 0–5, 5–10 and 10–15 cm soil depths, increased crop residue retained soils had 21%, 20% and 22% increased extractable S content, whereas 8%, 3% and 5% increments were observed in low residue retained soils, respectively, relative to the initial status.

3.4.5. Soil Zn Concentration

A significant variation was recorded in extractable Zn content for different tillage practices, particularly at 0–5 cm soil depth (Table 5). All the tillage practices had increased Zn concentrations in soil relative to initial soil. The ZT, ST, BP and CT had 53%, 47%, 38% and 25% higher Zn concentration, in comparison with initial Zn (0.32 mg kg−1). Between residue retention practices, the increased and low residue retention practices had 45% and 14% higher soil Zn concentrations, respectively, compared to the initial Zn status.

3.5. Economics of Different Tillage Systems

Among the different tillage systems, strip tillage was the most profitable system (Table 6) for the rice-based cropping system over the three years of study. Although the total input costs were similar to each other for all four crop establishment systems (ZT, ST, BP and CT), the ST system showed better economic performances than any other tillage systems in terms of gross return (on an average, 11, 16 and 15% higher than ZT, SP and BP, respectively), net return (on an average, 22, 30 and 28% higher than ZT, SP and BP, respectively) and benefit-cost ratio (BCR) over the two levels of residue retention. The BCR (average of three years) in ST was 1.84 contrasting with 1.64 in ZT, 1.58 in BP and 1.60 in CT. When the total cost is compared, the benefit is different from one tillage system to another system which was influenced mainly by the crop yields of the crops (rice, lentil, wheat & jute).

4. Discussion

4.1. Effects of Tillage Practices and Residue Retention on Crop Yield

Minimum soil disturbance and increased residue retention practice improved yield performances of crops in the jute-lentil/wheat-rice cropping system by increasing SOM, by creating favorable soil BD, PR and SWC and by enhancing N, P, K, S and Zn availability in soil. In the case of the T. aman rice, yield increases with ST was 19–22% higher than the CT practice. The lentil yield was comparable to the yield with CT in the 1st year but exceeded the CT yield in the 2nd year. However, the yield of wheat in ST was similar to grain yield of CT. The ZT and CT had similar wheat grain yields after four years of cropping in a study in the Punjab, India [40] A similar grain yield of wheat was recorded under different tillage practices in an irrigated cotton-wheat system in the western Indo-Gangetic Plains by Das et al. [41].
The ST practice increased fibre yield of jute in the 1st year by 32% relative to CT, by 38% in the 2nd year and by 19% in the 3rd year. Similarly, ZT practice also increased yield relative to CT practice (30% in the 1st year). The increased yield under ST and ZT can be attributed to better plant establishment due to the more uniform jute seed placement at proper depth (1.0–1.5 cm depth in ZT and 3–4 cm depth in ST).
The increase in yield of component crops except wheat under minimum disturbance of soil might be associated with increased SOM which modifies soil physical conditions to be more favorable for crop growth [3,42]. The lower BD and PR of soils under ST (Table 3) are also connected to the increased SOM which might have created a favorable rhizosphere environment for plant and root growth, nutrient uptake and crop yield (data not shown) [43]. The improved status of soil nutrients for crops under ST (Table 4 and Table 5) also accounts for higher crop yield [44].
The BP practice gave comparable yield to ST in all cases except in jute crops that had depressed yield in all three years. In the present study, BP experienced more rapid drying of the beds than other practices on the sandy loam and loam soils which might be responsible for lower jute yield under BP practice [45]. As a result, in the BP tillage option, there was a 17.8% lower water content of the soil in the 2nd year at 0–5 cm soil depth. In addition, the mechanised planting may not control the depth of sowing of small jute seeds well enough for consistent germination on the raised beds [46].

4.2. Effects of Tillage Practices and Residue Retention on Soil Physical Properties

In comparison with initial soil BD (1.51 g cm−3), after 3 years, ST practice substantially reduced soil BD (1.45 g cm−3) at 0–5 cm soil depth. The lower soil BD under ST could be attributed to the SOM improvement in the surface soil (0–5 cm) as reported for silty clay soils after 3 years in the EGP [44].
Soil BD was not significantly varied due to residue retention in the current study which is at par with the results of [47] who found no significant influence of residue retention on BD value of Vertisol soil in Australia. Even though increased residue was tested in the present study, and it represented an extra 8 t of plant biomass addition per ha, only 50% (regarded as increased residue retention) of the cereal residue was retained. This may not be sufficient on sandy loam soil to alter BD within 3 years.
Soil PR was consistently lower in ST and higher in BP practice than CT at all 3 soil depths. By comparison, Islam [44] found consistently lower soil PR with ST than CT practice after 7 crops at 5–10 cm and 10–15 cm soil depths in the EGP. On the other hand, soil PR was significantly decreased at 0–5 cm, 5–10 cm and 5–10 cm soil depths by increased residue retention level, which might be due to improvement of SOM. The beneficial effect of increased residue on PR is supported by [48] who reported that increased residue incorporation reduced soil PR at 0–15 cm depth on sandy loam soil (Typic Haplustept).
The increased SWC was recorded in ST under the winter wheat crop but it is not clear whether the effect is due to greater soil cover by residue or to increased soil organic matter (Table 3 and Table 4). Many previous studies support soil water conservation under ST compared with CT [44,49]. Increased crop residue retention also appeared to conserve more water content in soil in the 0–5 cm depth soil which suggests a role in limiting evaporation loss [50]. The significant cooling effect of residues may slow the evaporative losses of water from soil with increased residue retention [1].
The SWC values were inversely correlated with soil PR values after 1st year’s lentil harvest at 0–5 cm soil depth (r2 = 0.841), after the 2nd year’s lentil harvest at 0–5 cm soil depth (r2 = 0.836) and after the 3rd year’s wheat harvest at 0–5 cm soil depth (r2 = 0.951). These results can be related to SOM which increases water holding capacity [51].

4.3. Effects of Tillage Practices and Residue Retention on Soil Organic Matter and Soil Fertility

The ZT and ST increased organic matter content in soil by about one–quarter after 3 years of CA practice at 0–5 cm soil depth. But in 5–10 cm and 10–15 cm soil depths, the SOM remained unchanged (p > 0.05). In the ZT and ST, crop residues were not incorporated in the soils which reduced contact of crop residues with soil and resulted in stratification of organic matter close to the soil surface. The increase in SOM can be attributed to the surface retention of crop residues of three crops over three years (Table 1) and the additional C from the increased biomass production; decreased disturbance of SOM and following crop rotation with species that produce different qualities of crop residue may also have a positive effect on SOM levels [1].
About 22.4 t of crop residues ha−1 were retained in 3 years’ time for 50% residue level equivalent to around 10.7 t of added C ha−1. On the other hand, under lower residue retention practice, 14.4% of the added residue to measurable as an increase in soil C stock after three years.
By contrast with other elements, exchangeable K increased after 3 years at 0–5, 5–10 and 10–15 cm soil depths with increased crop residue retention. [52] noted that crop biomass, especially from cereal crops, contains large quantities of K, and recycling from the stubble can markedly increase K availability in soils. Indeed Yadvinder-Singh et al. [53] suggested that rice residue retention can significantly reduce the amount of K fertilizer application in the next crop. On the other hand, tillage practices did not influence exchangeable K in soil which contradicted the results obtained by Alam et al. [42] who found exchangeable K was increased under minimal soil disturbance. It is possible that the higher K removal om grain under ST and ZT, in particular, may negate any influence of the minimum soil disturbance treatments on exchangeable K in soils.
There were significant differences in available S concentration in the upper 0–5 cm soil depth after the 3rd crop cycle due to tillage practices and this was connected with the higher organic matter concentration in the topsoil. Available S concentration increased by 21%, 18%, 13% and 5% under ZT, ST, BP and CT practices, respectively, at 0–5 cm soil depth compared with initial soil S status. These differences may be related to greater runoff and leaching potential of S under CT, but like the increases in N, P, K and Zn, S increase can be attributed to the increased SOM in the ZT and ST treatments in particular [41].

4.4. Profitability

The ST practice for upland crops and non-puddling for rice crops have ensured increased economic return in terms of gross margin, net return and BCR (Table 6). The increased yield under the novel crop establishment practices was the main driver of increased profitability. In other studies, the increased profit and BCR for CA crop production is also attributed to decreased costs of inputs [8]. The increased yield with the novel practices might be attributed to improved soil health (increased soil organic carbon, nutrient concentration, improved physical properties). A similar study was conducted in Bangladesh by [5], while [54] conducted farm-level research to find out the profitability of CA practice in Ecuador. They reported that crop rotations and reduced tillage increase SOM and soil health which ultimately increases incomes for farm households.

5. Conclusions

Strip tillage practice conserved more water content in soil (13.7%) and lowered BD (1.45 g cm−3) and PR (3.86 MPa) at 0–5 cm soil depth, relative to other practices. The ZT and ST increased organic matter accumulation in the soil at 0–5 cm depth (24 and 23% over initial SOM, respectively) but in 5–10 cm and 10–15 cm soil depths, SOM remained unaffected. Higher total N, extractable S and Zn concentrations in the uppermost 0–5 cm soil depth and extractable P in the 0–10 cm depth were accumulated under the minimum soil disturbance systems. Increased retention of crop residues after 3 years increased SOM and other nutrient concentration. Ultimately, CA practices (minimum soil disturbance and increased crop residue retention) augmented grain yield of rice, lentil and jute fibre. Overall, the ST with higher crop residue retention can be regarded as an efficient CA practice in terms of improvement of soil physical properties, organic matter, nutrient concentrations, crop yield and economic return.

Author Contributions

Conceptualization, N.S., M.J. and R.W.B.; methodology, N.S., M.J. and R.W.B.; software, N.S.; validation, N.S., M.J., R.W.B., M.R.I., M.K.A. and M.E.H.; formal analysis, N.S.; investigation, N.S.; resources, N.S., M.J. and R.W.B.; data curation, N.S.; M.K.A. writing—original draft preparation, N.S.; writing—review and editing, A.E.S., N.S., M.J., M.K.A., A.H., S.A., A.B. and R.W.B.; visualization, N.S., S.A. and M.K.A.; supervision, M.J., R.W.B. and M.R.I.; project administration, M.E.H.; funding acquisition, R.W.B., M.E.H., A.B. and A.E.S. All authors have read and agreed to the published version of the manuscript.

Funding

This research was funded by the Australian Centre for International Agricultural Research (ACIAR, grant number Project LWR/2010/080) and supported by in Taif University re-searches Supporting Project number (TURSP-2020//295), Taif University, Taif, Saudi Arabia.

Institutional Review Board Statement

Ethical review and approval were waived for this study, due to no obligatory rules existed for having Institutional Review Board Statement.

Informed Consent Statement

Not applicable.

Data Availability Statement

Data is not publicly available, though the data may be made available on request from the corresponding author.

Acknowledgments

The authors acknowledge the Australian Centre for International Agricultural Research (ACIAR–Project LWR/2010/080) for supporting a PhD scholarship for the first author and financial support to conduct this study. This work was supported by Taif University Researches Supporting Project number (TURSP-2020//295), Taif University, Taif, Saudi Arabia.

Conflicts of Interest

The authors declare no conflict of interest.

References

  1. Alam, M.K.; Bell, R.W.; Haque, M.E.; Kader, M.A. Minimal soil disturbance and increased residue retention increase soil carbon in rice–based cropping systems on the Eastern Gangetic Plain. Soil Tillage Res. 2018, 183, 28–41. [Google Scholar] [CrossRef]
  2. Alam, M.K.; Bell, R.W.; Biswas, W.K. Decreasing the carbon footprint of an intensive rice-based cropping system using conservation agriculture on the Eastern Gangetic Plains. J. Clean. Prod. 2019, 224, 72–87. [Google Scholar] [CrossRef]
  3. Alam, M.K.; Salahin, N.; Islam, S.; Begum, R.A.; Hasanuzzaman, M.; Islam, M.S.; Rahman, M.M. Patterns of change in soil organic matter, physical properties and crop productivity under tillage practices and cropping systems in Bangladesh. J. Agric. Sci. 2016, 155, 216–238. [Google Scholar] [CrossRef]
  4. Chakraborty, D.; Ladha, J.K.; Rana, D.S.; Jat, M.L.; Gathala, M.K.; Yadav, S.; Rao, A.N.; Ramesha, M.S.; Raman, A. A global analysis of alternative tillage and crop establishment practices for economically and environmentally efficient rice production. Sci. Rep. 2017, 7, 9342. [Google Scholar] [CrossRef] [Green Version]
  5. Haque, M.E.; Bell, R.W.; Islam, M.A.; Rahman, M.A. Minimum tillage unpuddled transplanting: An alternative crop establishment strategy for rice in conservation agriculture cropping systems. Field Crops Res. 2016, 185, 31–39. [Google Scholar] [CrossRef]
  6. Kassam, A.; Friedrich, T.; Derpsch, R.; Kienzle, J. Overview of the Worldwide Spread of Conservation Agriculture. Field Actions Sci. Rep. 2015, 8, 1–12. [Google Scholar]
  7. Haque, M.E.; Bell, R.W.; Hossain, M.M.; Menon, R.K. Transplanting rice seedling in dry strip-tilled soil: A strategy to minimize soil disturbance during non-puddled transplanting. In Proceedings of the 2nd Conference on Conservation Agriculture for Smallholders (CASH-II) 2017, Mymensingh, Bangladesh, 14–16 February 2017. [Google Scholar]
  8. Bell, R.W.; Haque, M.E.; Jahiruddin, M.; Rahman, M.M.; Begum, M.; Miah, M.A.M.; Islam, M.A.; Hossen, M.A.; Salahin, N.; Zahan, T.; et al. Conservation Agriculture for Rice-Based Intensive Cropping by Smallholders in the Eastern Gangetic Plain. Agriculture 2019, 9, 5. [Google Scholar] [CrossRef] [Green Version]
  9. Alam, M.K. Assessment of Soil Carbon Sequestration and Climate Change Mitigation Potential under Conservation Agriculture Practices in the Eastern Gangetic Plains. Ph.D. Thesis, Murdoch University, Murdoch, Australia, 2018; p. 325. [Google Scholar]
  10. Li, Y.X.; Tullberg, J.N.; Freebairn, D.M. Wheel traffic and tillage effects on runoff and crop yield. Soil Tillage Res. 2007, 97, 282–292. [Google Scholar] [CrossRef]
  11. Bell, R.W.; Haque, M.E.; Johansen, C.; Vance, W.; Kabir, M.E.; Musa, M.A.; Mia, M.N.N.; Neogi, M.G.; Islam, M.A. Mechanized minimum tillage establishment and yield of diverse crops in paddy fields using a two–wheel tractor–mounted planter suitable for smallholder cropping. Exp. Agric. 2017, 54, 755–773. [Google Scholar] [CrossRef]
  12. Yadvinder-Singh; Bijay-Singh; Timsina, J. Crop residue management for nutrient cycling and improving soil productivity in rice–based cropping practices in the tropics. Adv. Agron. 2005, 85, 269–407. [Google Scholar]
  13. Singh, B.; Shan, Y.H.; Johnson-Beeebout, S.E.; Yadvinder-Singh; Buresh, R.J. Crop residue management for lowland rice–based cropping practices in Asia. Adv. Agron. 2008, 98, 118–199. [Google Scholar]
  14. Prochnow, L.I.; Cantarella, H. Modifying soil to improve crop productivity. Better Crops 2015, 99, 10–12. [Google Scholar]
  15. Van Kessel, C.; Hartley, C. Agricultural management of grain legumes; has it led to an increase in nitrogen fixation? Field Crops Res. 2000, 65, 165–181. [Google Scholar] [CrossRef]
  16. FRG. Fertilizer Recommendation Guide, Bangladesh Agricultural Research Council (BARC); FRG: Farmgate, Dhaka, 2012; 274p. [Google Scholar]
  17. Islam, M.S.; Ahmed, S.K. The impacts of jute on environment: An analytical review of Bangladesh. J. Environ. Earth Sci. 2012, 2, 24–32. [Google Scholar]
  18. Cassman, K.; De Datta, S.; Amarante, S.; Liboon, S.; Samson, M.; Dizon, M. Long-term comparison of the agronomic efficiency and residual benefits of organic and inorganic nitrogen sources for tropical lowland rice. Exp. Agric. 1996, 32, 427–444. [Google Scholar] [CrossRef]
  19. Brouder, S.M.; Gomez-Macpherson, H. The impact of conservation agriculture on smallholder agricultural yields: A scoping review of the evidence. Agric. Ecosyst. Environ. 2014, 187, 11–32. [Google Scholar] [CrossRef]
  20. Aggarwal, P.K.; Joshib, P.K.; Ingramc, J.S.I.; Gupta, R.K. Adapting food systems of the Indo–Gangetic plains to global environmental change: Key information needs to improve policy formulation. Environ. Sci. Policy 2004, 7, 487–498. [Google Scholar] [CrossRef]
  21. Salahin, N. Influence of Minimum Tillage and Crop Residue Retention on Soil Organic Matter, Nutrient Content and Crop Productivity in the Rice-Jute System. Ph.D. Thesis, Department of Soil Science, Bangladesh Agricultural University, Mymensingh, Bangladesh, 2017; 317p. [Google Scholar]
  22. Kladivko, E.J.; Griffith, D.R.; Mannering, J.R. Conservation tillage effects on soil properties and yield of corn and soybeans in Indiana. Soil Tillage Res. 1986, 8, 277–287. [Google Scholar] [CrossRef]
  23. Franzluebbers, A.J.; Hons, F.M. Soil profile distribution of primary and secondary plant extractable nutrients under conventional and no tillage. Soil Tillage Res. 1996, 39, 229–239. [Google Scholar] [CrossRef]
  24. Alam, M.K.; Bell, R.W.; Haque, M.E.; Islam, M.A.; Kader, M.A. Soil nitrogen storage and availability to crops are increased by conservation agriculture practices in rice–based cropping systems in the Eastern Gangetic Plains. Field Crops Res. 2020, 250, 107764. [Google Scholar] [CrossRef]
  25. Haene, D.; Karoline, S.; Steven, N.; Stefaanl, D.; Donald, G.; Hofman, G. The effect of reduced tillage agriculture on carbon dynamics in silt loam soils. Nutr. Cycl. Agroecosyst. 2009, 84, 249–265. [Google Scholar]
  26. FAO (Food and Agriculture Organization). FAO/UNESCO Digital Soil Map of the World and Derived Soil Properties; Land and Water Digital Media Series #1 Rev 1; FAO: Rome, Italy, 2002. [Google Scholar]
  27. USDA (United States Department of Agriculture). Soil Taxonomy: A Basic System of Soil Classification for Making and Interpreting Soil Surveys (USDA Agricultural Handbook 436); US Government Printing Office: Washington, DC, USA, 1975.
  28. Celik, A.; Altikat, S. Effects of various strip widths and tractor forward speeds in strip tillage on soil physical properties and yield of silage corn. J.Agric. Sci. 2010, 16, 169–179. [Google Scholar]
  29. Altikat, S.; Celik, A. The effects of tillage and intra–row compaction on seedbed properties and red lentil emergence under dry land conditions. Soil Tillage Res. 2011, 114, 1–8. [Google Scholar] [CrossRef]
  30. Lampurlanés, J.; Cantero-Martínez, C. Soil bulk density and penetration resistance under different tillage and crop management systems and their relationship with barley root growth. Agron. J. 2003, 95, 526–536. [Google Scholar] [CrossRef]
  31. Jackson, M.L. Soil Chemical Analysis; Prentice Hall of India Pvt. Ltd.: New Delhi, Idian, 1973; pp. 38–56. [Google Scholar]
  32. Piper, C.S. Soil and Plant. Analysis; Adelaide University, Hassel Press: Adelaide, Australia, 1942. [Google Scholar]
  33. Bremner, J.M.; Mulvaney, C.S. Total nitrogen. In Methods of Soil Analysis, Part–2, 2nd ed.; Page, A.L., Miller, R.H., Keeney, D.R., Eds.; American Society of Agronomy: Madison, WI, USA, 1982; pp. 599–622. [Google Scholar]
  34. Olsen, S.; Cole, C.; Watanabe, F.; Dean, L. Estimation of Available Phosphorus in Soils by Extraction with Sodium Bicarbonate; USDA Circular No. 939; US Gov. Print. Office: Washington, DC, USA, 1954.
  35. Black, C.A. Method of Soil Analysis (Part.–I and II); American Society of Agronomy Inc.: Madison, WI, USA, 1965. [Google Scholar]
  36. Fox, R.L.; Olson, R.A.; Rhoades, H.F. Evaluating the sulfur status of soils by plants and soil tests. Soil Sci. Soc. Am. Proc. 1964, 28, 243–246. [Google Scholar] [CrossRef]
  37. Lindsay, W.L.; Norvell, W.A. Development of a DTPA soil test for zinc, iron, manganese, copper. Soil Sci. Soc. Am. J. 1978, 42, 421–428. [Google Scholar] [CrossRef]
  38. Anjeneyul, V.R.; Singh, S.P.; Paul, M. Effect of competition free periods and techniques and pattern of pearl millet planting on growth and yield of mungbean inter–cropping systems. Indian J. Agron. 1982, 27, 219–226. [Google Scholar]
  39. Chowdhury, A.K.M.H.U.; Haque, M.E.; Hoque, M.Z. Farmers response towards cultivation of BRRI dhan 47 in the coastal saline area. Int. J. Sustain. Agric. Technol. 2012, 8, 13–18. [Google Scholar]
  40. Singh, D. Studies to Moderate the Heat Stress Effects on Wheat (Triticum aestivum) Productivity. Master’s Thesis, Punjab Agricultural University, Ludhiana, India, 2010. [Google Scholar]
  41. Das, T.K.; Bhattacharyya, R.; Sudhishri, S.; Sharma, A.R.; Saharawat, Y.S.; Bandyopadhyay, K.K.; Sepat, S.; Bana, R.S.; Aggarwal, P.; Sharma, R.K.; et al. Conservation agriculture in an irrigated cotton–wheat system of the western Indo–Gangetic Plains: Crop and water productivity and economic profitability. Field Crops Res. 2014, 158, 24–33. [Google Scholar] [CrossRef]
  42. Alam, M.K.; Salahin, N.; Islam, M.M.; Hasanuzzaman, M. Effect of tillage practices on soil properties and crop productivity of wheat–mungbean–rice cropping system under sub-tropical climatic conditions. Sci. World J. 2014, 10, 40–55. [Google Scholar]
  43. Costa, S.E.V.G.A.; Souza, E.D.; Anghinoni, I.; Flores, J.P.C.; Cao, E.G.; Holzschuh, M.J. Phosphorus and root distribution and corn growth related to long term tillage systems and fertilizer placement. Rev. Bras. Ciênc. Solo 2009, 33, 1237–1247. [Google Scholar] [CrossRef]
  44. Islam, M.A. Conservation Agriculture: Its Effects on Crop and Soil in Rice–Based Cropping Systems in Bangladesh. Ph.D. Thesis, Murdoch University, Murdoch, Australia, 2016; p. 317. [Google Scholar]
  45. Prashar, A.; Thaman, S.; Humphreys, E.; Dhillon, S.S.; Yadvinder-Singh; Nayyar, A.; Gajri, P.R.; Dhillon, S.S.; Timsina, J. Performance of wheat on beds and flats in Punjab, India. In Proceedings of the 4th International Crop Science Congress, Brisbane, Australia, 26 September–1 October 2004. [Google Scholar]
  46. Yadav, S.S.; Rizvi, A.H.; Manohar, M.; Verma, A.K.; Shrestha, R.; Chengci, C.; Bejiga, G.; Chen, W.; Yadav, M.; Bahl, P.N. Lentil growers and production systems around the world. In Lentil: An Ancient Crop for Modern Times; Yadav, S.S., McNeil, D.L., Stevenson, P.C., Eds.; Springer: Dordrecht, The Netherlands, 2007; pp. 415–442. [Google Scholar]
  47. Dalal, R.C.; Allen, D.E.; Wang, W.J.; Reeves, S.; Gibson, I. Organic carbon and total nitrogen stocks in a Vertisol following 40 years of no–tillage, crop residue retention and nitrogen fertilization. Soil Tillage Res. 2011, 112, 133–139. [Google Scholar] [CrossRef]
  48. Saha, S.; Chakraborty, D.; Sharma, A.R.; Tomar, R.K.; Bhadraray, S.; Sen, U.; Behera, U.K.; Purakayastha, T.J.; Garg, R.N.; Kalra, N. Effect of tillage and residue management on soil physical properties and crop productivity in maize–Indian mustard system. Indian J. Agric. Sci. 2010, 80, 679–685. [Google Scholar]
  49. Reeder, R. Consider Strip Tillage to Alleviate Soil Compaction. 2002. Available online: http://www.agriculture.com/default.sph/AgNews.class?FNC=DetailNewsAsearchlistAg–News.html48797 (accessed on 12 July 2018).
  50. Naresh, R.K.; Singh, S.P.; Ashish, D.; Kishor, N.; Kumar, S.V.; Ronaliya, L.K.; Kumar, V.; Singh, R. Conservation agriculture improving soil quality for sustainable production systems under smallholder farming conditions in north West India: A review. Int. J. Life Sci. Biotechnol. Pharm. Res. 2013, 2, 151–213. [Google Scholar]
  51. Overstreet, L.F.; DeJong-Huges, J. The Importance of Soil Organic Matter in Cropping Systems of the Northern Great Plains, 2nd ed.; University Minnesota: Minneapolis, MN, USA, 2009. [Google Scholar]
  52. Chatterjee, B.N.; Mondal, S.S. Potassium nutrition under intensive cropping. J. Potassium Res. 1996, 12, 358–364. [Google Scholar]
  53. Yadvinder-Singh; Gupta, R.K.; Jagmohan-Singh; Gurpreet-Singh; Gobinder-Singh; Ladha, J.K. Placement effects on rice residue decomposition and nutrient dynamics on two soil types during wheat cropping in rice–wheat practice in northwestern India. Nutr. Cycl. Agroecosyst. 2010, 88, 471–480. [Google Scholar] [CrossRef]
  54. Nguema, A.; Norton, G.W.; Alwang, J.; Taylor, D.B.; Barrera, V.; Bertelsen, M. Farm-level economic impacts of conservation agriculture in Ecuador. Exp. Agric. 2013, 49, 134–147. [Google Scholar] [CrossRef] [Green Version]
Figure 1. Weather data during the cropping period.
Land 10 00581 g001aLand 10 00581 g001b
Figure 2. Effect of tillage practices on rice equivalent yield. ZT = zero tillage, ST = strip tillage, BP = bed planting, CT = conventional tillage.
Land 10 00581 g002
Figure 3. Effect of residue retention levels on rice equivalent yield. RL = low residue retention, RH = increased residue retention.
Land 10 00581 g003
Figure 4. Relationship between penetration resistance and soil organic matter ((A): 0–5 cm, (B): 5–10 cm, (C): 10–15 cm depth) and water content of soil (D) after completion of 8th crop.
Land 10 00581 g004
Table 1. Retention of residues by the component crops in the jute–lentil/wheat–rice cropping system over three years (t ha−1). Values are the means of four replicates.
Residue Retention LevelsRice
Residue
2012
Lentil
Residue
2012–13
Jute Leaf
2013
Rice
Residue
2013
Lentil
Residue
2013–14
Jute Leaf 2014Rice
Residue
2014
Wheat
Residue
2014–15
Jute Leaf
2015
Total
Residues
RL1.90.242.172.70.231.122.42.151.3414.3
RH3.40.562.104.30.581.464.53.991.4722.4
LSD0.050.030.050.200.190.030.290.280.290.160.69
ZT = zero tillage, SP = strip tillage, BP = bed planting, CT = conventional tillage, RL = low residue retention, RH = increased residue retention, LSD = least significant difference.
Table 2. Effect of tillage practices and crop residue retention on yield (t ha−1) of different crops in the Rice-lentil/wheat-jute cropping system over three years. Values are the means of four replicates.
Tillage
Practices
Grain Yield of T. aman RiceGrain Yield of Lentil/WheatFibre Yield of Jute
RLRHMeanRLRHMeanRLRHMean
1st year: Rice-Lentil-Jute
ZT--2.661.451.351.404.504.724.61
ST--3.241.811.721.765.324.064.69
BP--2.881.521.491.512.853.112.98
CT--3.702.011.951.983.643.443.54
Mean---1.701.63-4.083.83-
LSD0.05   Tillage = 0.69Tillage = 0.42, Residue = nsTillage = ns, Residue = ns
2nd year: Rice-Lentil-Jute
ZT5.575.515.541.461.431.454.314.934.62
ST6.156.426.281.701.611.654.465.294.87
BP5.726.025.872.001.861.933.123.663.39
CT5.055.215.131.311.071.193.543.473.51
Mean5.625.79-1.611.49-3.864.34-
LSD0.05  Tillage = 0.44, Residue = nsTillage = 0.29, Residue = 0.09Tillage = 1.12, Residue = 0.43
3rd year: Rice-Wheat-Jute
ZT4.895.395.144.194.234.213.743.903.82
ST5.726.115.914.294.614.254.104.344.22
BP5.175.875.524.244.284.263.183.433.30
CT4.775.194.984.064.334.193.633.503.56
Mean5.145.64-4.204.36-3.663.79-
LSD0.05  Tillage = 0.48, Residue = 0.21Tillage = ns, Residue = 0.15Tillage = 0.63, Residue = 0.13
ZT = zero tillage, ST = strip tillage, BP = bed planting, CT = conventional tillage, RL= low residue retention, RH= increased residue retention, LSD = least significant difference, ns = not significant, T (tillage practices) × R (residue retention) not significant for all cases.
Table 3. Effect of tillage practices and residue retention levels on soil bulk density, penetration resistance and water content in soils after 8th crop harvest.
Tillage
Practices
Bulk Density
(g cm−3)
Penetration Resistance
(MPa)
Water Content
(volume %)
RLRHMeanRLRHMeanRLRHMean
0–5 cm soil depth, initial BD 1.51 g cm−3
ZT1.541.521.534.614.454.5313.313.413.3
ST1.461.451.454.762.953.8612.714.813.7
BP1.511.491.506.915.956.4310.211.410.8
CT1.501.491.495.654.915.2812.113.112.6
Mean1.501.49-5.484.56-12.113.2-
LSD0.05   Tillage = 0.05, Residue = nsTillage = 1.78, Residue = 0.82Tillage = 2.08, Residue = 0.85
5–10 cm soil depth, initial BD 1.53 g cm−3
ZT1.581.541.56 7.966.137.04 14.918.216.6
ST1.501.491.49 6.525.155.83 17.419.018.9
BP1.541.551.54 9.216.447.82 14.618.015.3
CT1.521.521.52 7.065.796.4216.718.817.6
Mean1.531.51-7.695.88 -15.9 18.5 -
LSD0.05   Tillage = 0.06, Residue = nsTillage = 1.36, Residue = 0.60Tillage = 2.58, Residue = 1.14
10–15 cm soil depth, initial BD 1.55 g cm−3
ZT1.591.581.599.317.888.6015.318.617.0
ST1.531.511.527.966.417.1918.521.420.0
BP1.571.561.569.768.319.0315.117.416.2
CT1.541.531.549.097.558.3216.520.218.3
Mean1.551.53-9.037.5416.419.4-
LSD0.05   Tillage = 0.05, Residue = nsTillage = 1.26, Residue = 0.44Tillage = 2.65, Residue = 1.85
ZT = zero tillage, ST = strip tillage, BP = bed planting, CT = conventional tillage, RL = low residue retention, RH = increased residue retention, LSD = least significant difference, ns = not significant, T (tillage practices) × R (residue retention) not significant for all cases.
Table 4. Effect of tillage practices and residues retention on soil organic matter stock, total nitrogen stock and available phosphorus concentrations in soils after 3 years.
Tillage
Practices
Organic Matter (t ha−1)Total N (t ha−1)Available P (mg kg−1)
RLRHMeanRLRHMeanRLRHMean
0–5 cm soil depth, initial OM 8.2 t ha−1, N 0.430 t ha−1, P 6.1 mg kg−1
ZT9.910.510.2 0.4900.5720.531 9.210.910.1
ST9.210.610.1 0.4810.5300.509 9.110.79.9
BP9.210.19.6 0.4670.5260.496 8.210.49.3
CT8.49.89.1 0.4350.4660.450 7.18.67.8
Mean9.2 10.2 -0.468 0.525 -8.410.2-
LSD0.05   Tillage = 0.6, Residue = 0.4Tillage = 0.054, Residue = 0.022Tillage = 0.4, Residue = 0.4
5–10 cm soil depth, initial OM 7.6 t ha−1, N 0.398 t ha−1, P 5.5 mg kg−1
ZT8.49.08.70.4400.4640.4527.69.08.3
ST8.48.98.60.4420.4470.4457.58.58.0
BP8.08.48.20.4160.4380.4327.28.37.7
CT8.08.78.30.4220.4430.4276.67.67.1
Mean8.2 8.7 -0.430 0.448-7.2 8.4 -
LSD0.05   Tillage = ns, Residue = 0.3Tillage = ns, Residue = 0.009Tillage = 0.8, Residue = 0.3
10–15 cm soil depth, initial OM 6.8 t ha−1, N 0.364 t ha−1, P 4.7 mg kg−1
ZT6.98.07.50.3680.4180.3936.57.16.8
ST7.78.68.10.4060.4520.4296.26.96.6
BP7.08.17.50.3720.4230.4006.36.46.3
CT7.48.68.00.3950.4590.4275.96.36.1
Mean7.3 8.3 -0.3850.427-6.26.7-
LSD0.05   Tillage = ns, Residue = 0.2Tillage = ns, Residue = 0.014Tillage = ns, Residue = ns
ZT = zero tillage, ST = strip tillage, BP = bed planting, CT = conventional tillage, OM = organic matter, N = nitrogen, P = phosphorus, RL = low residue retention, RH = increased residue retention, LSD = least significant difference, NS = not significant, T (tillage practices) × R (residue retention) not significant for all cases.
Table 5. Effects of tillage practices and residue retention levels on potassium, sulphur and zinc concentrations in soils after 3 years.
Tillage
Practices
Exchangeable K
(cmol kg−1)
Extractable S
(mg kg−1)
Extractable Zn
(mg kg−1)
RLRHMeanRLRHMeanRLRHMean
0–5 cm soil depth, initial K 0.162 cmol kg−1, S 14.6 mg kg−1, Zn 0.32 mg kg−1
ZT0.2200.2750.24816.518.817.7 0.430.540.49
ST0.2130.2500.23116.018.517.20.410.530.47
BP0.2030.2250.21415.917.116.5 0.400.480.44
CT0.1850.2230.20414.715.815.6 0.370.440.40
Mean0.205 0.243-15.8 17.6 -0.40 0.50 -
LSD0.05   Tillage = ns, Residue = 0.01Tillage = 0.17, Residue = 0.06 Tillage = 0.03, Residue = 0.02
5–10 cm soil depth, initial K 0.134 cmol kg−1, S 14.4 mg kg−1, Zn 0.22 mg kg−1
ZT0.1850.2230.20415.618.517.00.280.350.31
ST0.1830.2100.19615.417.816.60.260.330.30
BP0.1730.2000.18614.616.715.70.240.310.28
CT0.1600.1880.17414.116.215.10.230.300.26
Mean0.175 0.205 -14.917.3-0.25 0.32 -
LSD0.05   Tillage = ns, Residue = 0.01Tillage = ns, Residue = 0.76 Tillage = ns, Residue = 0.02
10–15 cm soil depth, initial K 0.125 cmol kg−1, S 13.5 mg kg−1, Zn 0.21 mg kg−1
ZT0.1630.1780.17014.917.416.20.260.290.28
ST0.1600.1750.16814.616.915.80.250.280.27
BP0.1480.1700.15913.916.015.00.240.270.25
CT0.1400.1680.15413.615.714.60.230.260.24
Mean0.153 0.173 -14.316.5 -0.240.27-
LSD0.05   Tillage = ns, Residue = 0.01Tillage = ns, Residue = nsTillage = ns, Residue = ns
ZT = zero tillage, ST = strip tillage, BP = bed planting, CT = conventional tillage, RL = low residue retention, RH = increased residue retention, LSD = least significant difference, ns = not significant, T (tillage practices) × R (residue retention) not significant for all cases.
Table 6. Profitability of different tillage practices in the rice–lentil/wheat–jute cropping system.
ParticularZTSPBPCT
1st year: Rice-Lentil-Jute
Gross return (US $ ha−1)3732420132164065
Total input cost (US $ ha−1)2323227222282292
Gross margin (US $ ha−1)1998251715762361
Net return (US $ ha−1)140919299891773
BCR1.611.851.441.77
2nd year: Rice-Lentil-Jute
Gross return (USD ha−1)4341478944303676
Total input cost (USD ha−1)2316230323672311
Gross margin (USD ha−1)2615307526541954
Net return (USD ha−1)2026248620631365
BCR1.872.081.871.59
3rd year: Rice-Wheat-Jute
Gross return (USD ha−1)3749412536823656
Total input cost (USD ha−1)2591256525652528
Gross margin (USD ha−1)1754215617131722
Net return (USD ha−1)1158156011171128
BCR1.451.611.441.45
Average of 3 years
Gross return (USD ha−1)3941437237763799
Total input cost (USD ha−1)2410238023862377
Gross margin (USD ha−1)2122258219812013
Net return (USD ha−1)1531199213901422
BCR1.641.841.581.60
ZT = zero tillage, SP = strip planting, BP = bed planting, CT = conventional tillage, 1 $ USA = 82.50 BDT (Tk). Note: Market price of crops: Rice grain USD 0.21 kg−1, Rice straw USD 0.02 kg−1, Lentil seed USD 0.88 kg−1, Lentil stover USD 0.01 kg−1, Wheat grain USD 0.24 kg−1, Wheat straw USD 0.01 kg−1, Jute fibre USD 0.36 kg−1, Jute stick USD 0.02 kg−1.
Publisher’s Note: MDPI stays neutral with regard to jurisdictional claims in published maps and institutional affiliations.

