Article

The Spatial Effect of Administrative Division on Land-Use Intensity

1
Department of Public Management-Land Management, Huazhong Agricultural University, Wuhan 430070, China
2
Department of City and Regional Planning, University of North Carolina-Chapel Hill, Chapel Hill, NC 27599, USA
3
Department of Resources and Environment, Huazhong Agricultural University, Wuhan 430070, China
4
College of Horticulture & Forestry Sciences, Huazhong Agricultural University, Wuhan 430070, China
*
Author to whom correspondence should be addressed.
Land 2021, 10(5), 543; https://doi.org/10.3390/land10050543
Submission received: 16 April 2021 / Revised: 10 May 2021 / Accepted: 12 May 2021 / Published: 20 May 2021
(This article belongs to the Section Land Planning and Landscape Architecture)

Abstract

:
Land-use intensity (LUI) is one of the most direct manifestations of regional land use efficiency. The study of cross-administrative LUI in urban agglomerations is of great importance for the sustainable development of land, new urbanization, and territorial spatial planning. In this study, the urban agglomeration in the middle reaches of the Yangtze River in China was used as the case study area to explore the spatial spillover effect through the administrative division, underlying driving mechanism, and spatial interactions or constraints of LUI. First, LUI was measured using the index of the proportion of construction land to the total area of the administrative region. Second, the adjacency relationship of the county-level administrative units was identified on the basis of the queen-type adjacency criterion under the county-level administrative division system. Thereafter, spatial weight matrix for spatial modeling was constructed. Last, a spatial model using the “Spatial adjacency matrix” was devised to examine the influencing factors and the potential spatial interactions or constraints of administrative units. Results revealed that the level of LUI of different county-level administrative units were quite different, and the gap of LUI among county-level administrative units widened from 2010 to 2017. The fixed asset investment per land (FAIL), gross domestic product per capital (PGDP), and proportion of tertiary sector (PTS) are the driving factors of LUI. County-level administrative units not only had a significant and increasing spatial interaction effect based on the relationship of cooperation, but also had an influence of restraint mutually which was caused by the competition. The direct spatial spillover effect was remarkable. In the future, the effect of interaction among administrative units under the administrative division should be considered to promote the reasonable use and optimal layout of regional urban land to realize the optimal allocation of land resources.

1. Introduction

Nowadays, global land use has been increasingly intensified as the imbalance between the supply and demand of land resources becomes an intractable issue in the context of rapid urbanization. Meanwhile, the expansion of construction land and consequent changes in land use pattern have become the main method used by cities to find new space for development internationally [1]. The change of land use pattern is a game process that combines the top-down administrative power and bottom-up benefit. As a means of spatial governance and the spatial allocation of state power, administrative division is an important factor that affect the pattern of regional land use [2]. The institutional setting, especially from the aspects of the administrative fragmentation, the local tax system, and the competition between local jurisdictions, is already empirically identified to influence regional land use [3].
Land-use intensity (LUI) is a complex and constantly updated and deepened concept. LUI is defined as the extent of land being used, which is also an indication of the amount and degree of land development in an area [4,5]. It refers to the development and utilization of territorial space in a region and reflect the comprehensive effects that the natural environment and human activities have on land [6,7]. The change in land use is an important aspect to reflect the variation in regional social and economic development and spatial differentiation [8]. However, land use changes were relatively different in each country, being influenced by place specific factors associated to geographical, demographic and socioeconomic conditions and the related historical, political, and cultural background [9]. Of all land changes, 60% are associated with direct human activities and 40% with indirect drivers [10]. For example, Europe as the most developed and urbanized continent at the global scale, the urbanization is the dominant factor of the land use changes in most European countries [11]. In Asia countries, the land use changes are driven by economic development, population and government policies. Exploring the driving forces of land use changes is essential for realizing sustainable urban development worldwide. Empirical studies proved that socio-economic, physical environment, administrative governance, and other factors are the major influencing factors [12,13,14]. Socio-economic factors significantly influence LUI, and regional economic development, urbanization, and urban population density (PD) are the major contributions [15], and the growth of per-capita GDP is the most important economic factor influencing the degree of land development. Moreover, classical location theory suggests that transportation accessibility is an important determinant of LUI [16]. Regional socio-economic factor is only one of the important influencing aspects. The administrative governance significantly impacts land use, and administrative division restructuring is the major strategy to achieve governance for the LUI. Administrative division restructuring profoundly influences the land use of cities by changing the economic and social management authorities and resource allocation rights of local governments [17,18,19].
In China, land use management is implemented under a top-down system of administrative division [20,21]. The top-down administrative division system and the bottom-up land use change have an inevitable unintegration boundary effect, and the administrative authority under the administrative division system affect the allocation of regional land resources [21,22]. The utilization of territorial space and adjustment of administrative division are significantly important to achieve ecological civilization and to promote the modernization of territorial and spatial governance. Land-use intensity (LUI) has been proposed to measure the magnitude of the intensified land use [1]. LUI is important for the sustainable development of cities. Therefore, research on the influencing factors and spatial interaction of LUI plays an important role in achieving more efficient land use strategies and realize the sustainable use of land resource.
With the rapid urban land development around the world, various issues related to LUI have been widely studied, mainly focusing on the mode, the trend, the differences and the influencing factors of construction land expansion at the national, regional, provincial, and city scales, the impact of LUI on resources and environment, and other aspects [12,23,24]. However, the research examining whether administrative division affect LUI is limited. Thus, this study aims to create a model of administrative spatial interaction of construction land to verify and explain the effect of administrative spillover on LUI. The remainder of this paper is structured as follows. Section 2 presents a theoretical framework. Section 3 presents the material and methods, in which Section 3.1 shows the study area, Section 3.2 discusses the methods, the formation of administrative matrix, and the spatial model of administrative division. Section 4 provides the results of this study. Section 5 and Section 6 are the discussion and conclusion sections, respectively.

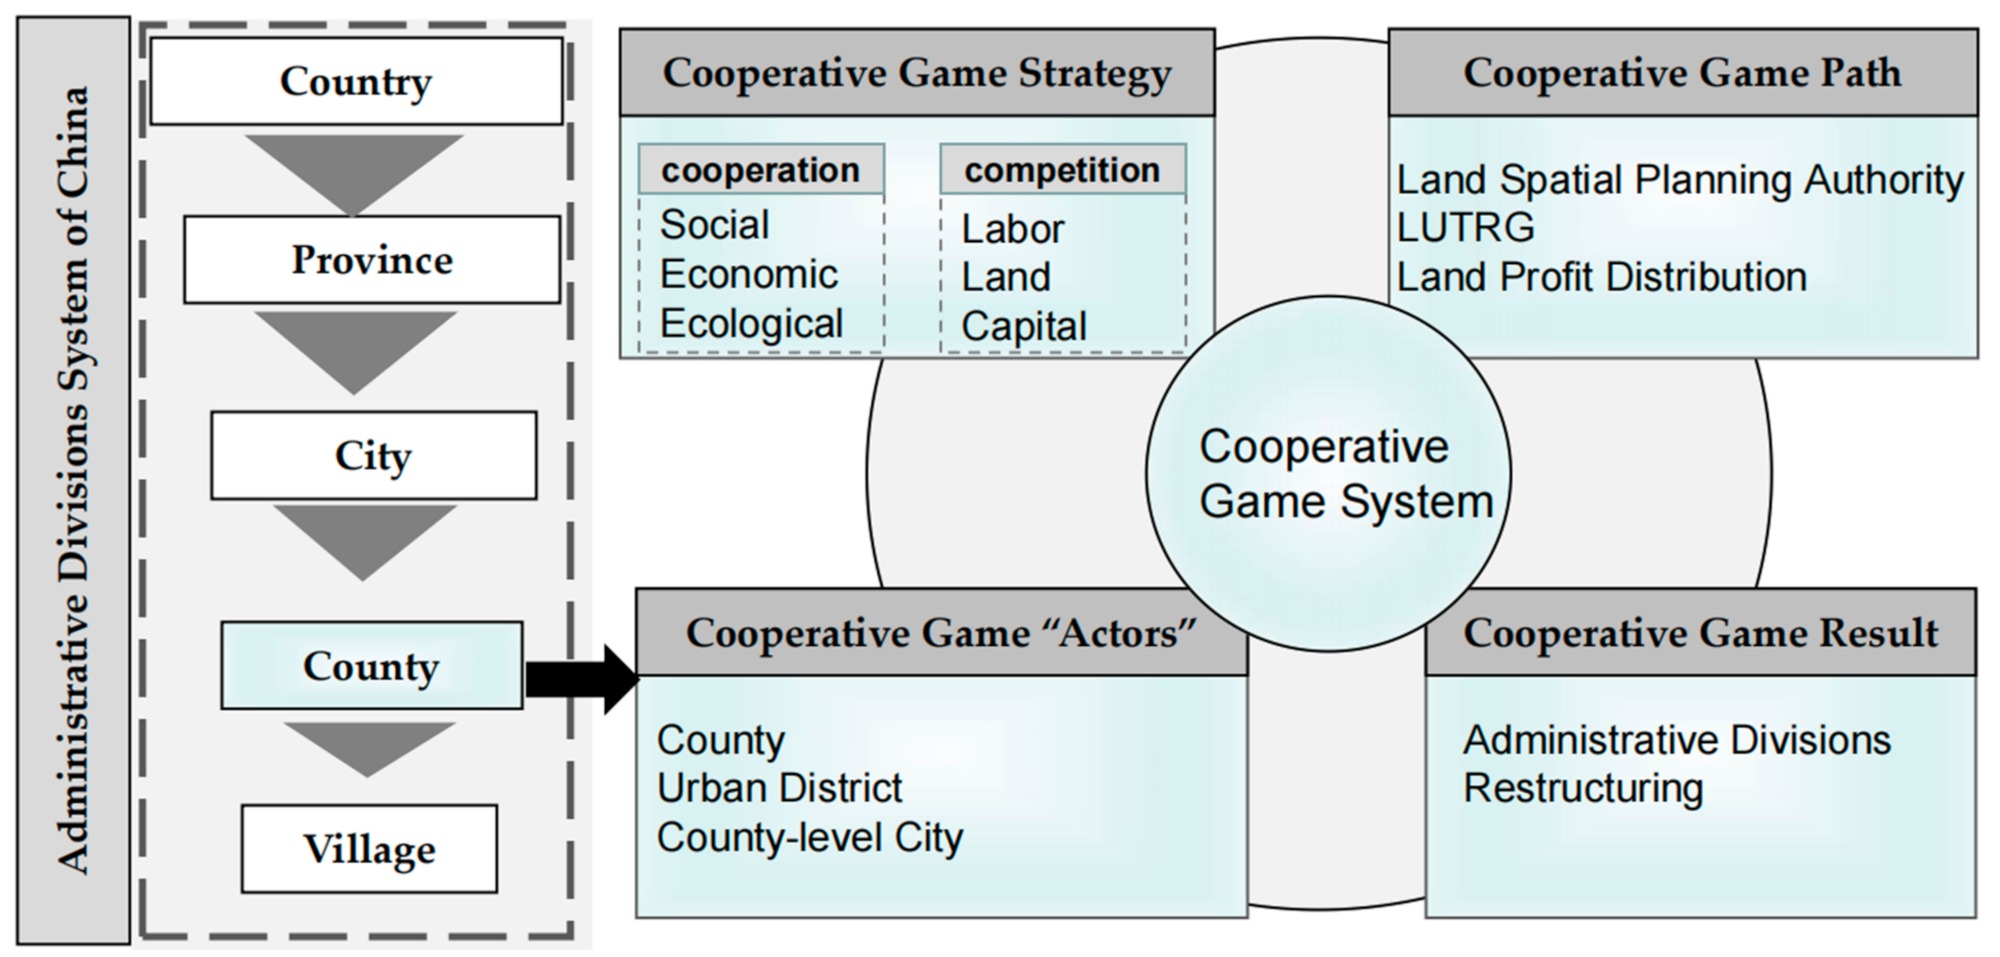
2. Theoretical Framework

The relationship between county-level administrative units and LUI has a theoretical basis. Under the administrative division system, the interaction of county-level administrative units is a cooperative game relationship in the process of regional development, which means competition and cooperation both exist. Therefore, game theory was used to analyze the interaction of county-level administrative units under the administrative division. Based on game theory, some significant points, such as cooperation, game, reginal development, and so on must be focused on.
Game theory is a scientific theory that studies the process of decision making among multiple subjects on the basis of their own desired goals and the outcome of the game equilibrium, generally including cooperative and non-cooperative games [25]. The “actors”, “strategies”, “payoffs”, “orders”, “information”, and “equilibrium” are the basic elements of game theory [26]. The basic conditions of game theory are as follows: The decision of the “actors” in the game are discussed with one another; each “actor” will adjust his or her own strategy on the basis of the decision of other “actors”; the process of the game is restricted by some rules; the “actors” in the game can make independent decisions and can scientifically evaluate his or her own payoffs. While traditional administrative regions are based on hierarchical power relations, the new forms of reginal cooperation depend more on spontaneous cooperation and coalition [2]. Each country has their own administrative division system, China has adopted a “Five-level” hierarchical administrative system, which is interpreted as “Country-Province-City-County-Village” (as shown in Figure 1) [20]. Under the administrative division system in China, the county-level administrative units are the “players” who participate in the game. The county-level system, as the tertiary administrative region, is the basis of the local government, which involves “county-level city”, “urban district”, and “county” [17,27]. They play games and cooperate with one another, adopting a series of policy strategies to achieve the purpose of optimizing the layout of construction land and improve the efficiency of construction land use to achieve sustainable development within the urban agglomeration. The players sharing the information that influences the equilibrium result of the game in the process of development, so that the strategy can be adjusted in accordance with the local conditions and their own actual development [28]. Game players of counties, county-level cities, and districts adopt different strategies of land spatial planning authority, construction land indicator, and land profit distribution system [29].
The administrative division system is a top-down resource-based geographical division pattern with an obvious boundary constraint effect. The administrative division system is a basic means of regional control by the Chinese government, administrative division adjustment indicates the adjustment of spatial dominant power [18,19]. County-level city, urban district, and county have their own regional characteristics. The development of a county is dominated by agriculture and rural division, and generally have jurisdiction over towns and villages. The urban district is a completely urban administrative district, which mainly has jurisdiction over subdistrict and focuses on non-agricultural economic development [30]. The county-level city has jurisdiction over the subdistrict, which focuses on agriculture and rural development and non-agricultural economic development. The county-level city is well developed in urbanization, has a relatively developed non-agricultural economy, and urban functions and morphological characteristics are prominent [31]. The adjustment of administrative division at the county level will directly affect the authority of local governments and change the original resource allocation and land financial pattern [32]. Governments of different administrative levels also have various institutional constraints on land tax revenue, such as “prefecture-level cities”, “urban districts”, “county-level cities”, and “counties” are different in the allocation of urban construction land and the proportion of land tax revenue. The interaction between various types of county-level administrative regions directly impacting the land development and use. Therefore, on the basis of game theory, this study conducts a theoretical analysis of the cooperative game relationship between county units in the region.
The land spatial planning of county-level has a significant role in the entire planning system. It implements the superior level land spatial planning and is also a specific scientific and reasonable arrangement for the development and protection of the administrative region [33]. Counties and county-level cities have the right to compile land spatial planning independently, whereas urban districts generally do not have. Under the situation of the continuous reduction of incremental construction land resources, the cities have gradually transferred the process from “incremental development” to “revitalize the stock” [34]. The indicator of construction land is self-balancing at the county level, coordinate balance at the city level, supplemented by adjustments within the province. As an important policy to realize the cross-regional adjustment of construction land indicators, “link urban construction land increases to decreases in rural construction land”, which is; therefore, called “Linkage between Urban Land Taking and Rural Land Giving” (LUTRG), plays an important role in promoting the economical and intensive use of construction land and coordinating urban-rural development [34,35,36]. The adjustment and improvement of the usage scope of land transfer fee has attracted great attention in China, and the proportion of land transfer fee used in agriculture and rural areas has been improved steadily [37]. County-level governments have the initiative to use the land transfer fee, whereas district-level governments generally do not have. The goal of county-level administrative units is to realize social and economic development and protection of the ecological environment, the competition is particularly reflected in the factor of labor, land, and capital. The administrative division restructuring is the result of cooperation and competition among county-level administrative units. In recent years, adjustments in the administrative division were frequent, which involves “Revoke County to County-level city”, “Revoke County to Urban District”, “Merger of Administrative Unit”, “Revoke County-level city to Urban District”, “Revoke County to Urban District“ and “Split of Administrative Unit”.
The impact of the administrative division system on the land use of county-level administrative units is determined by the spatial continuity of land resources and the boundary effect of the administrative division. On the basis of game theory, we propose a theoretical framework of administrative division-socio-economic-land system to explore the interaction of county-level administrative units. In terms of the methodology, the factor of “administrative division” spatial weight matrix was embedded in the spatial econometric model.

3. Materials and Methods
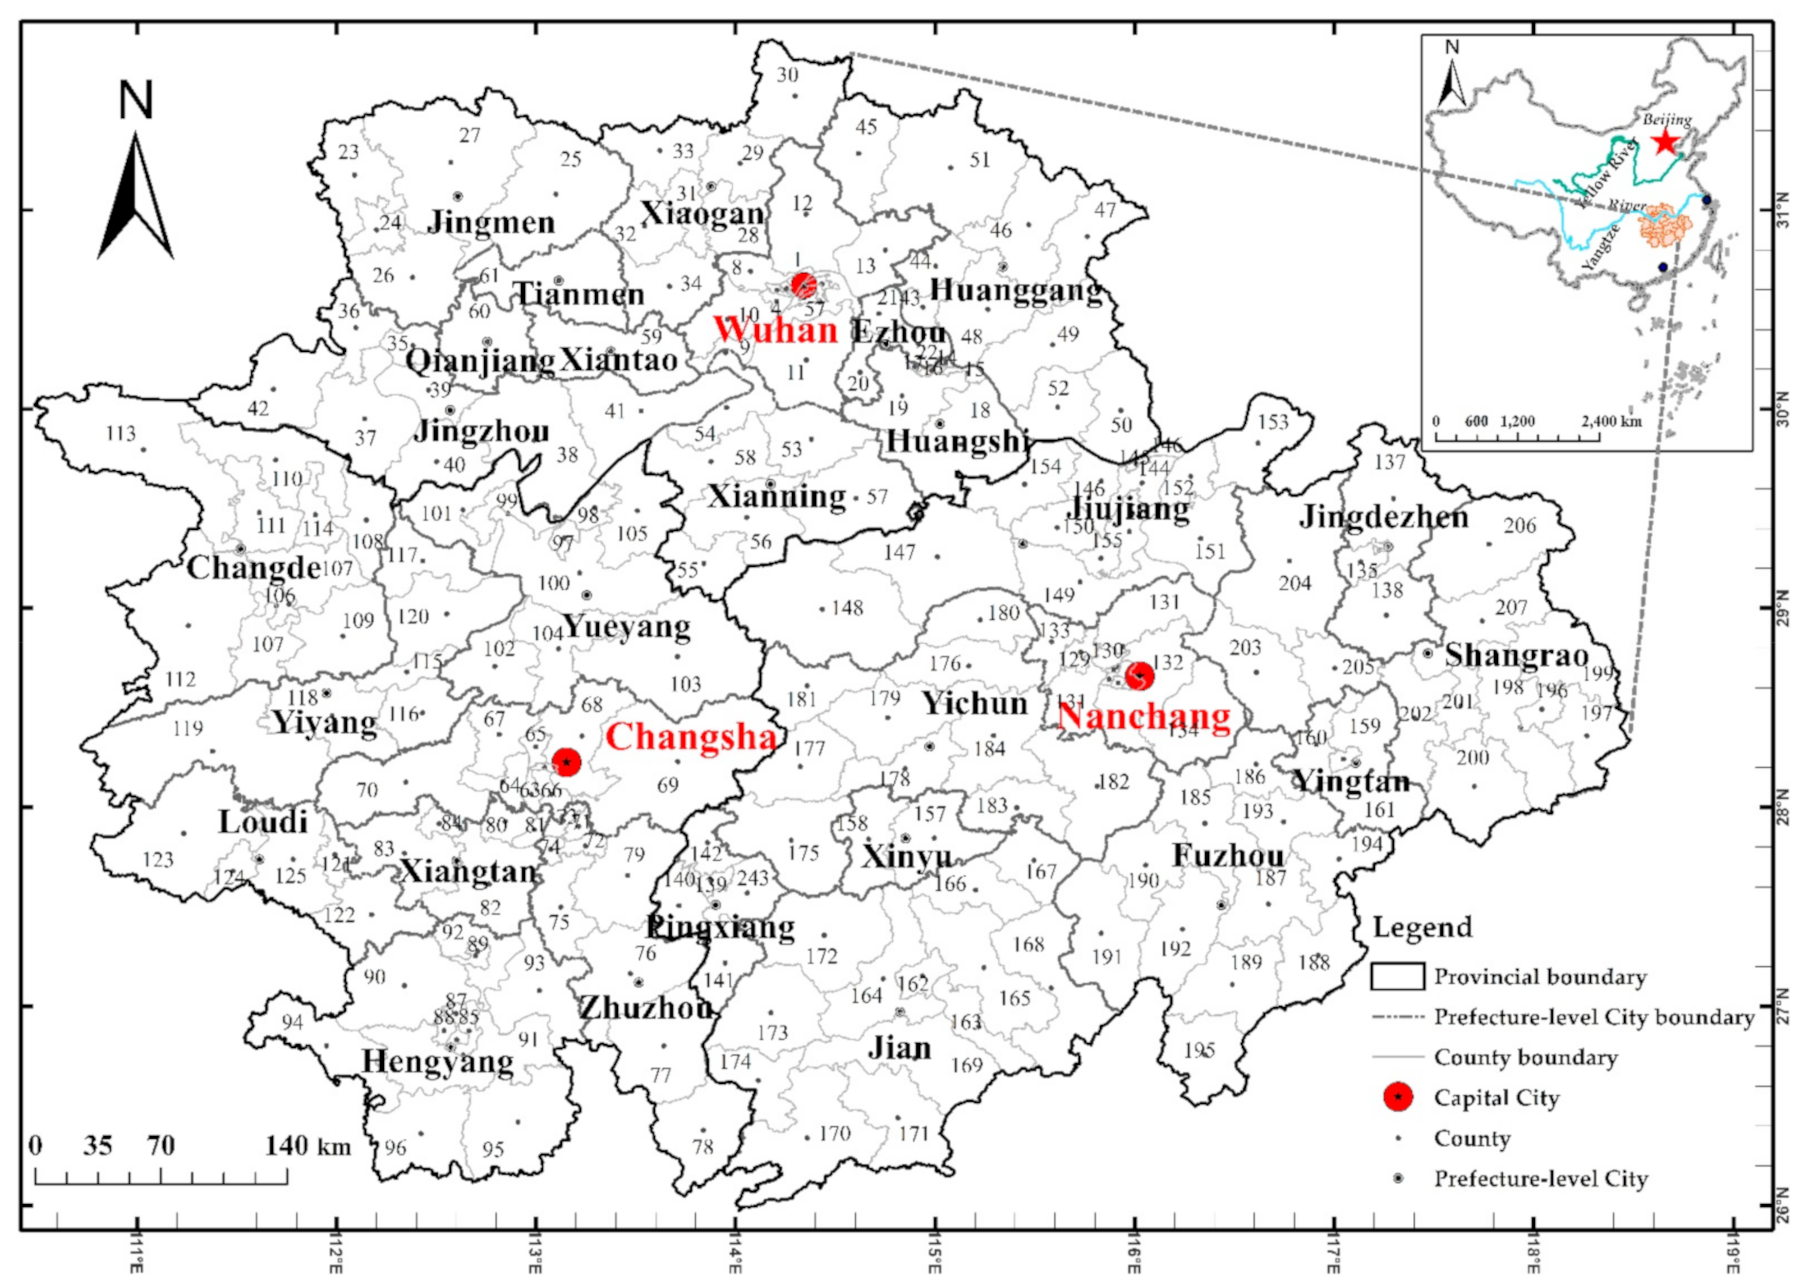
3.1. Study Area

The urban agglomeration in the middle reaches of the Yangtze River is a complex of super colossal urban agglomerations with the three central cities of Wuhan, Changsha, and Nanchang. The urban agglomeration in the middle reaches of the Yangtze River located in central China, including Wuhan urban agglomeration, Changsha–Zhuzhou–Xiangtan agglomeration and the urban agglomeration around Poyang Lake, with a regional area of approximately 3.17 × 10⁵ km2 was chosen as the study area. Geographically, the urban agglomeration in the middle reaches of the Yangtze River stretches from east to west, connecting north and south. The urban agglomeration in the middle reaches of the Yangtze River comprises 29 cities of Hubei, Hunan, and Jiangxi provinces (Figure 2), with 3.4% of the total area and 9.0% of the total population, accounting for 9.6% of the total GDP of China in 2017. The urban agglomeration in the middle reaches of the Yangtze River comprises 206 administrative units in 2010, and 207 administrative units in 2017 (The Gongqingcheng City which is a new county-level city established in November 2010.), which is an important part of the Yangtze River Economic Belt. The urban agglomeration in the middle reaches of the Yangtze River was selected in this study because it is one of the largest agglomerations of state-level in China, which plays a significant role in the national strategy of Rise of Central China and New Urbanization.
Table 1 lists data collected and sources for this study, the datasets involved interpreted land use and socio-economic data of 2010 and 2017. The land use data were obtained using the Landsat thematic mapper (TM) remote sensing images, with a spatial resolution of 30 m. Socio-economic data, such as population and gross domestic product (GDP), were obtained from the Hubei Statistical Yearbook in 2011 and 2018, Hunan Statistical Yearbook in 2011 and 2018, Jiangxi Statistical Yearbook in 2011 and 2018, and the County-level Socio-economic Statistical Yearbook of China in 2011 and 2018.

3.2. Methods

In this study, the measurement of LUI, the selection of driving factors, and the spatial econometric model were used to explore the spatial effect of administrative division on land-use intensity. The administrative adjacency relationship was transformed and integrated into spatial econometric model. Furthermore, the amplifying coefficient was introduced to explore the existence and the effect of administrative barriers.

3.2.1. Measurement on LUI and the Selection of Driving Factors

The construction land includes urban and built-up lands, rural settlements, and other construction lands (e.g., industrial parks, transportation facilities, mining areas, and so on) in 2010 and 2017 [38]. Based on the Major Function-Oriented Zone Planning (MFOZ Planning) of China (2010), the proportion of construction space in the total area of the region is defined as the LUI in a region. LUI was measured using the ratio of the construction land occupying the total area of the administrative area in this study. The calculation formula of LUI is as follows:
L U I = C L A T A
where LUI is land use intensity, CLA refers to the area of construction land, and TA presents the total area of the administrative units.
Industrialization, urbanization, and population growth have been considered common forces that contribute to land use changes on a global scale [39]. Transportation and infrastructures can directly drive the expansion of regional construction land, which positively affects LUI [8,40]. In our study, nine potential factors were selected by considering regional characteristics and data accessibility. These factors are gross domestic product per capita (PGDP), fixed asset investment per capital (PFAI), fixed asset investment per land (FAIL), total social consumption per capita (PSSC), proportion of industrial sector (PIS), proportion of tertiary sector (PTS), population density (PD), disposable personal income for urban residents (DPIU), and railway network density (RND). The verification revealed that a linear relationship exists between LUI and some independent variables. Correlation analysis and OLS regression were conducted to identify highly correlated factors and eliminate factors showing high levels of multicollinearity among the nine factors. Ultimately, three explanatory variables were selected, namely, PTS, PGDP, and FAIL to examine their influence on LUI.

3.2.2. Model Specification

To determine the relationship between the LUI and influencing factors and the interaction among administrative units, the spatial autocorrelation and regression models, including ordinary least squares (OLS) and spatial regressions were conducted. The regression method is a widely used statistical tool to estimate the coefficient of the cointegration equation and can also identify the strength of the relationship between the dependent variable and a collection of independent variables. In the OLS regression procedure, a spatial correlation was estimated for all explanatory variables [41]. The exploratory spatial data analysis (ESDA) was also used to estimate the spatial effect of LUI, including global Moran’s I and local Moran’s I. Global spatial autocorrelation is the description of the spatial characteristics of the attribute value in the total amount of the study area [42].

Spatial Regression Model

The spatial regression model is a standard tool for analyzing data with spatial correlation. The spatial regression model is widely used in many fields, such as spatial econometrics, ecological economics, geography, and so on. In contrast to the OLS regression model, the spatial regression model would examine the spatial spillover effects of neighboring cities. The spatial regression model is as the following equation [43,44].
y = β 0 + α W F i j y + β x i + γ W F i j x + μ w F i j ε + ε
In this formula, y is the dependent variable, xi is the independent variables, y’ and x’ are the neighbors’ “spillover” of y and x, respectively. WFij refers to the spatial weight, β is the coefficient of spatial regression of independent variable, β0 is a constant term. α is the spatial lag coefficient vector, γ is the spatial lag coefficient vector of independent variables, ε is the spatial error vector, and it is independently distributed and conform to normal distribution, and μ is the spatial error coefficient vector.
(1) When γ = 0, μ = 0, this formula turns to be a spatial lag model (SLM), which indicates that the interaction relationship of research units is directly reflected in the dependent variable of neighbor units.
(2) When γ = 0, α = 0, this formula turns to be a spatial error model (SEM), which reveals that the interaction relationship of research units is reflected in the spatial error vector of model.
(3) When μ = 0, this formula turns to be a spatial Durbin model (SDM), which indicates that the interaction relationship of research units is reflected not only in the dependent variable of neighbor units, but also in the influencing factors of the dependent variables.

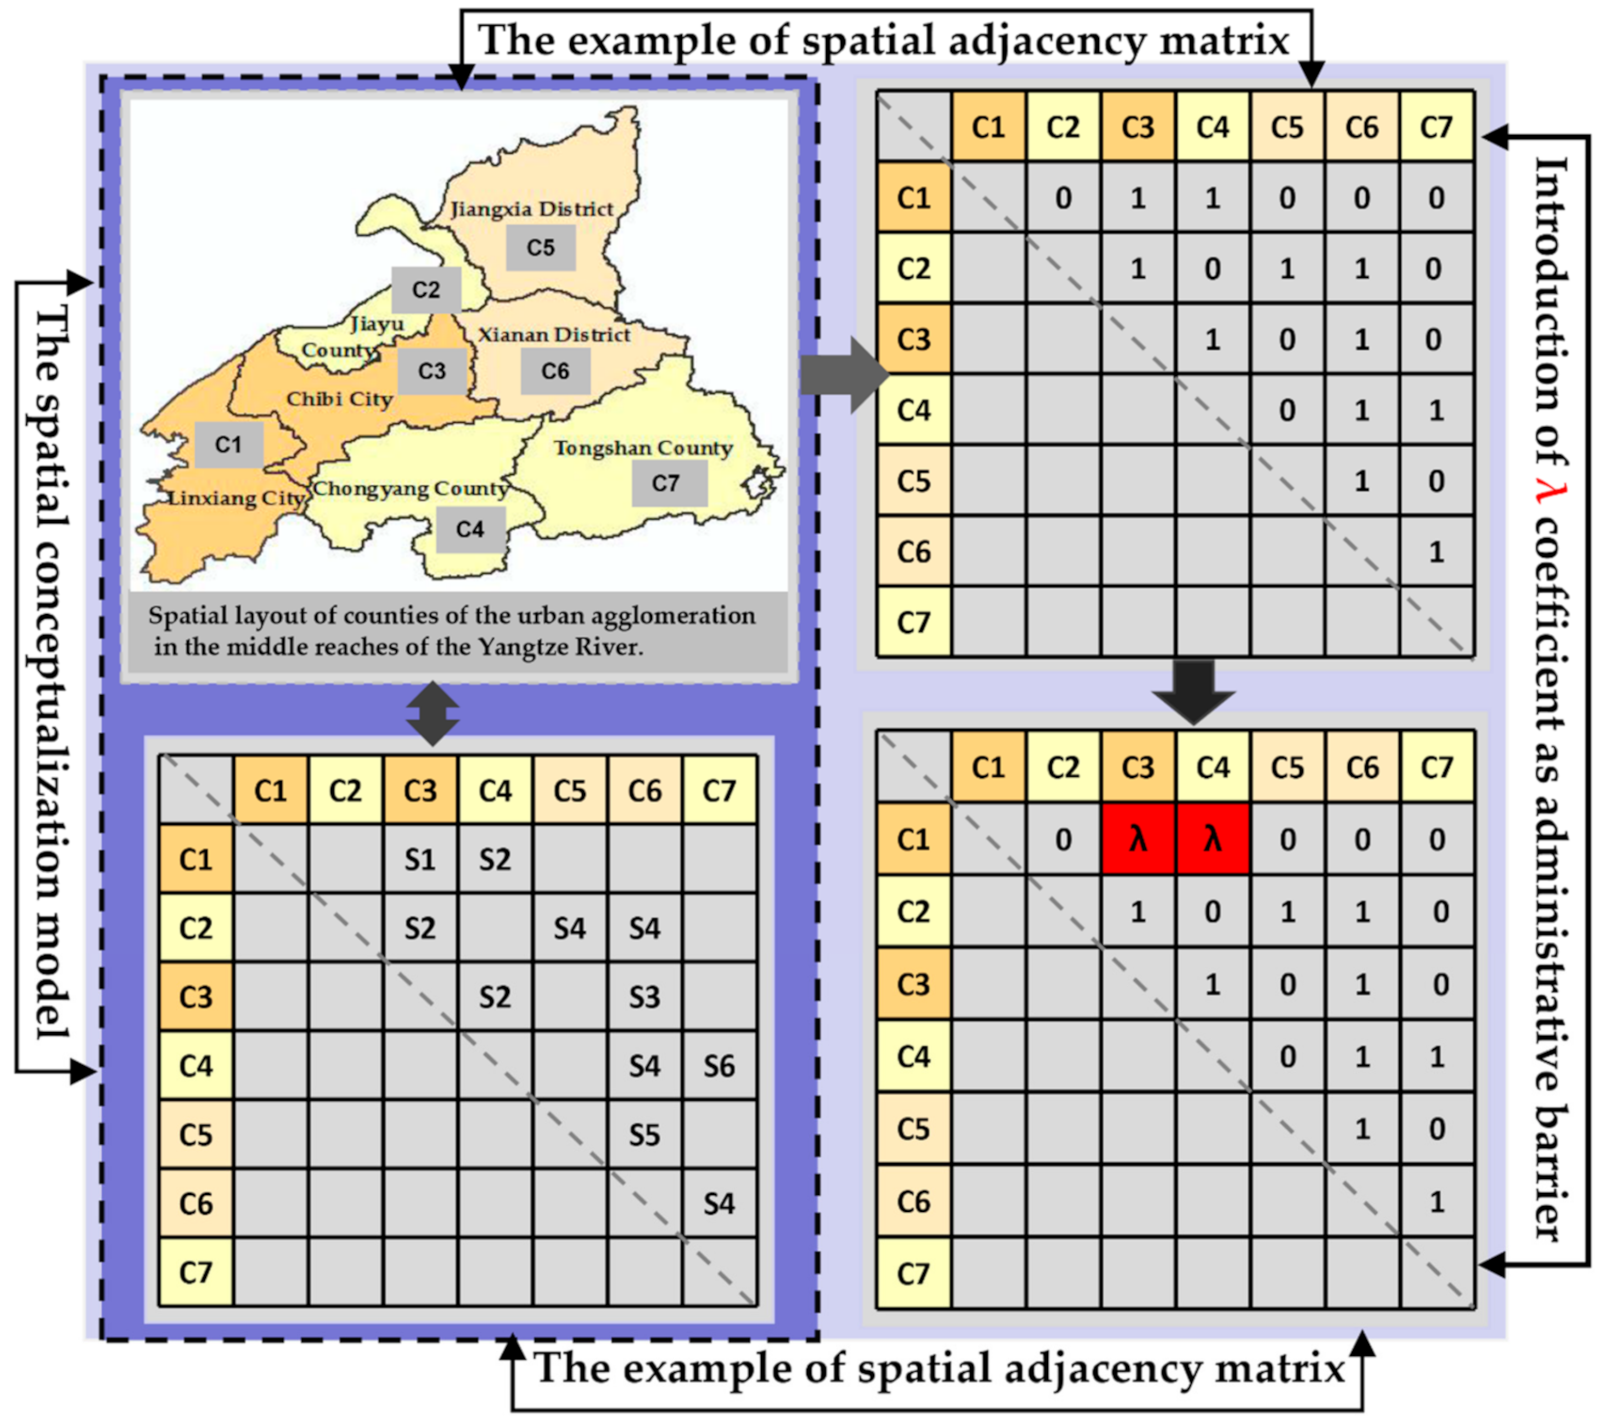
Administrative Embedded Spatial Econometric Model

The administrative division and LUI were integrated into spatial econometric model to explore the spillover effect of the interaction among administrative county units on land use in the urban agglomeration in the middle reaches of the Yangtze River.
Under the administrative division system, the adjacency relationship of administrative units is judged on the basis of the spatial adjacency relationship under the queen-type adjacency criterion. That is, if two administrative units share a public administrative boundary or node on the map, then the two administrative units have an adjacent relationship, as shown in the Figure below: Chibi City and Jiayu County. Contrarily, if the two administrative units do not have a public administrative boundary or node on the map, no neighboring relationship exists between these two administrative units, for example, the Linxiang City and Tongshan County, as shown in Figure 3.
Figure 3 presents that Jiangxia District and Jiayu County are adjacent to each other, and the value between them is 1; if the counties have no adjacent relationship, such as the Jiangxia District and Chongyang county, the value between them is 0. Thus, the administrative spatial matrix was constructed.
W = w i j i , j = 1 n
w i j = 1 , A i   a n d   A j   s h a r e   a   p u b l i c   a d m i n i s t r a t i v e   b o u n d a r y   o r   n o d e 0 , o t h e r s
where Ai and Aj are the county-level administrative units, and wij is the weight of the administrative units.
In this study, we assumed that the spillover effect between the adjacent administrative units in different provinces subjected to the administrative boundaries. In Figure 3, Chibi City, Jiayu County, Chongyang County, Jiangxia District, Xianning City, and Tongshan County belong to Hubei Province. Linxiang City is affiliated with Hunan Province. Taking into account the effect of administrative barriers between county-level administrative units in different provinces, the administrative barriers coefficient λ is introduced. If two adjacent county-level administrative units belong to two different provinces, such as the Linxiang City and Chongyang County, as shown in Figure 3, the administrative barriers coefficient value between them is λ, if two adjacent county-level administrative units belong to the same province, such as the Chibi and Linxiang cities, the administrative interaction coefficient value between them is 1.
On the basis of the spatial interaction of different administrative units, the LUI, influencing factors, and spatial spillover effects between adjacent administrative units were explored in the urban agglomeration in the middle reaches of the Yangtze River. The Stata15 was used to perform statistical and spatial analyses. The administrative embedded spatial econometric model is expressed as follows:
L U I i = β 0 + α W F a d m L U I + β x i + γ W F a d m x + μ W F a d m ε + ε
where LUIi is land use intensity; xi is factors influencing the LUI; the WFadm is the spatial adjacency matrix of county-level administrative division of the urban agglomeration in the middle reaches of the Yangtze River; LUI’ and x’ are the neighbors of administrative “spillover” of LUI and x, respectively; β is the coefficient of factors influencing the LUI; and γ is the spatial lag coefficient vector of factors influencing LUI.

4. Results

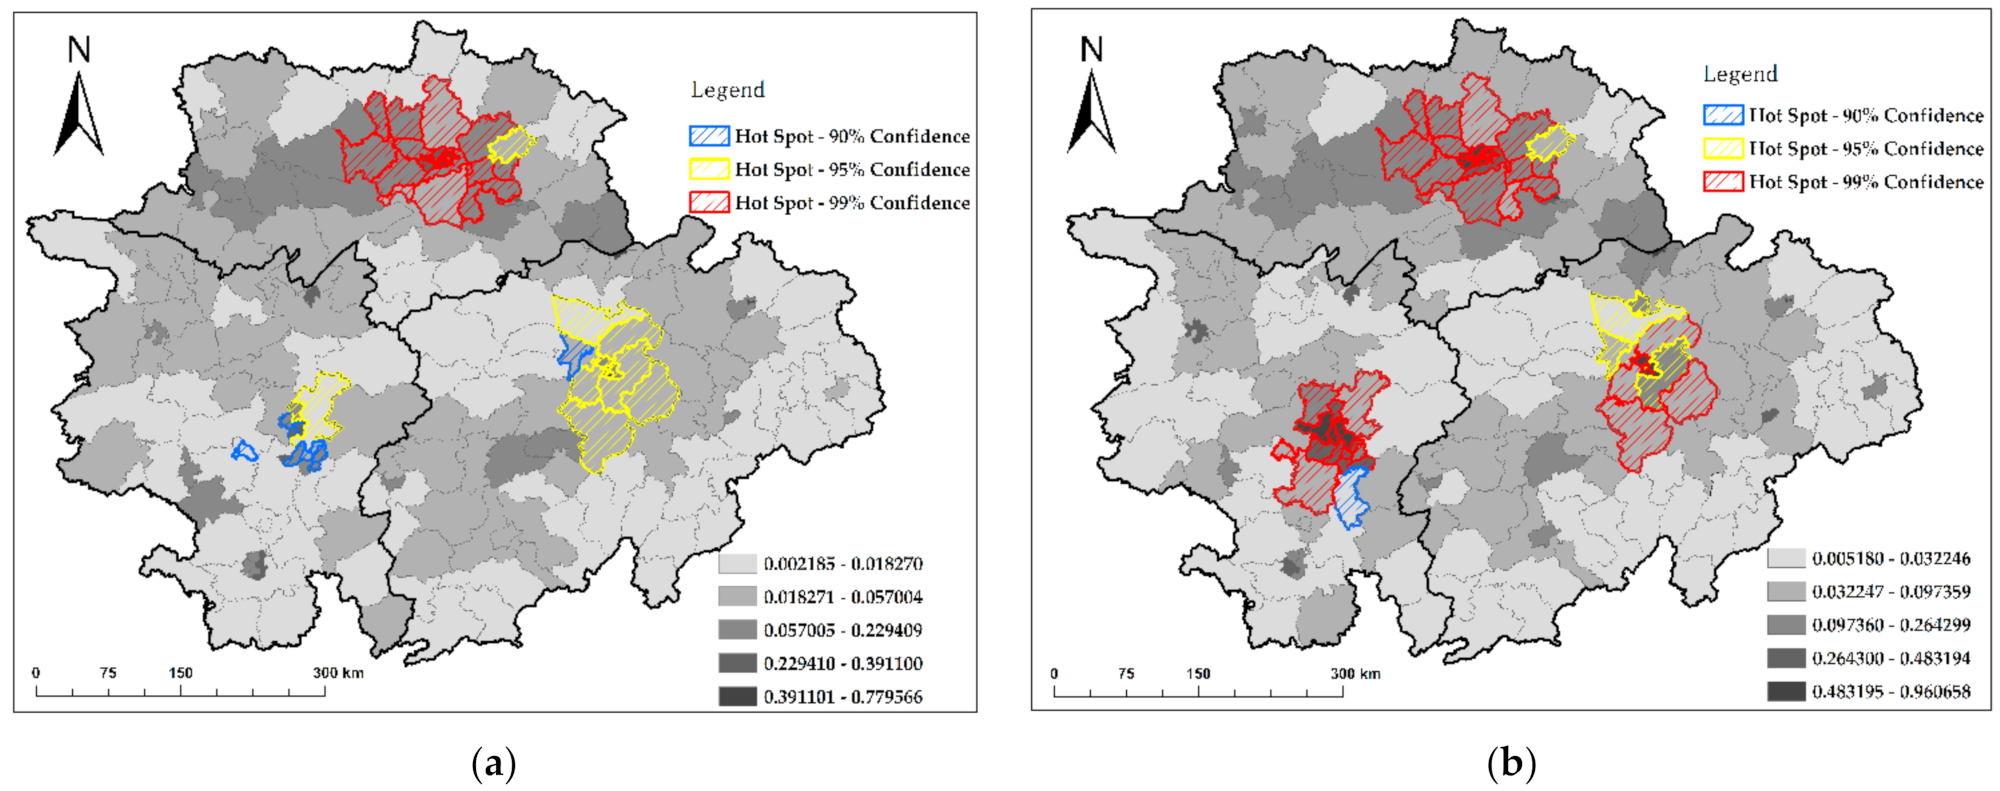
4.1. Spatio-Temporal Variability of LUI

Table 2 presents the maximum, minimum, average, median, and standard deviation of LUI of the urban agglomeration in the middle reaches of the Yangtze River in 2010 and 2017. The lowest LUI was observed in Tonggu County, the value was 0.0022 and 0.0052 in 2010 and 2017, respectively. The highest LUI was observed in Jianghan District (0.7796 in 2010 and 0.9607 in 2017), which is at the center of the Wuhan urban agglomeration. From 2010 to 2017, the Yuhua District had the highest increment (0.4762), and Lengshuijiang City was 7.73 times higher than that in 2010. The average value of LUI in 2017 was 1.76 times higher than that in 2010. From 2010 to 2017, the standard deviation was increased, signifying that the gap of LUI among counties widened.
Table 2 also shows the characteristics of FAIL, PGDP, and PTS of the administrative county-level units in the urban agglomeration in the middle reaches of the Yangtze River in 2010 and 2017. FAIL as an input indicator, from 2010 to 2017, the highest appeared in the Tianxin District (72,367.0973) in 2010, and Jianghan District (193,344.7389) in 2017, whereas the lowest appeared in the Lean County (46.6484) in 2010 and Zixi County (207.5307) in 2017. PGDP as the economic indicator, the highest PGDP was observed in Yuhua District (11.4308) in 2010 and Furong District (20.8306) in 2017, the lowest PGDP was observed in Duchang county (0.5510) in 2010 and Poyang county (1.5582) in 2017. The average and median values of FAIL and PGDP tremendously increased from 2010 to 2017. The highest value of PTS appeared in the Donghu District (0.9384) in 2010 and Jianghan District (0.9345) in 2017. The lowest value of PTS appeared in the Hukou County (0.1211) in 2010 and Hannan District (0.1461) in 2017. The economic indicators in most districts are higher than counties and county-level cities.
Figure 4 shows the spatio-temporal variability and hotspot patterns of LUI in the urban agglomeration in the middle reaches of the Yangtze River in 2010 and 2017. The level of LUI of different county-level administrative units are quite different. The urban district presented the highest value. The values in the Wuhan, Changsha, and Nanchang are higher than other cities and cluster around the three central cities. The administrative units of districts played a dominant role in 2010 and 2017. The values of Wuhan urban agglomeration are higher than Changsha–Zhuzhou–Xiangtan agglomeration and the urban agglomeration around Poyang Lake. By comparison, the urban agglomeration around Poyang Lake has the lowest LUI.
Hotspots refer to the statistically significant high-value clusters of LUI, whereas coldspots indicate statistically significant low-value clusters of LUI. No coldspots existed in 2010 and 2017. The hotspots were mainly clustered in Wuhan, Changsha, and Nanchang areas. In the Wuhan urban agglomeration, the range of significant hotspots in 2017 is identical to that of 2010. The LUI of all the counties in Wuhan and Ezhou cities are the hotspots in 2010 and 2017, and all the counties are at 99% confidence in 2010 and 2017. In the Changsha–Zhuzhou–Xiangtan agglomeration, the range of significant hotspot area was expanding, and the significance levels of some districts are becoming higher. Among them, Yuelu District, Shaoshan City, Yuetang District, Shifeng District, Hetang District, and Lusong District leaped from 90% to 99%, showing the greatest change, and Kaifu District, Furong District, Tianxin District, Changsha County, and Yuhua District leaped from 95% to 99%. The new hotspots that appeared were Wangcheng District, Zhuzhou County, and Xiangtan County in 2017, all of them were neighboring with the existing hotspots. In the urban agglomeration around Poyang Lake, the LUI of all the counties in Nanchang City were the hotspots area in 2010 and 2017, and the significance of counties except Nanchang County and Xihu District had improved from 2010 to 2017, Donghu District, Qingyunpu District, Qingshanhu District, Xinjian County, and Jinxian County leaped from 95% to 99%, Wanli District and Anyi County leaped from 90% to 95%. The new hotspots appeared were Gongqingcheng City and the significance level was 95%. Most of the other counties have insignificant hotspots of LUI of the urban agglomeration in the middle reaches of the Yangtze River.

4.2. Driving Forces of LUI

The multicollinearity and spatial autocorrelation tests were conducted on the basis of theoretical analysis. The FAIL, PGDP, and PTS have remarkably high correlation coefficients with LUI in 2010 and 2017. The global Moran’s I test was conducted to examine the correlation of LUI, FAIL, PGDP, and PTS under the administrative division system. In 2010 and 2017, the values of the global Moran’s I of the LUI, FAIL, and PGDP were all above 0.3, and all the values of the four indicators were significant at 1%, indicating that the LUI showed a strong positive spatial correlation. The global Moran’s I of LUI was 0.390 in 2010 and 0.549 in 2017. The global Moran’s I of FAIL was 0.480 in 2010 and 0.392 in 2017. The global Moran’s I of PGDP was 0.522 in 2010 and 0.489 in 2017. The global Moran’s I of PTS was 0.127 in 2010 and 0.133 in 2017. From 2010 to 2017, the global Moran’s I of LUI and PTS has increased, which means that the autocorrelation of the two factors have gradually increased.
Table 3 shows the results of the spatial autocorrelation tests of the Wuhan urban agglomeration, Changsha–Zhuzhou–Xiangtan agglomeration, and the urban agglomeration around Poyang Lake in 2010 and 2017. Most of the variables of the three agglomerations are significant at 1%. In the Wuhan urban agglomeration, from 2010 to 2017, the global Moran’s I of LUI, PGDP, and PTS have increased to varying degrees, signifying that during this period, the autocorrelation of the LUI, PGDP, and PTS has gradually increased. Contrarily, the value of FAIL has decreased. The autocorrelation of the LUI has increased, whereas the other three indicators have decreased in the Changsha–Zhuzhou–Xiangtan agglomeration from 2010 to 2017. In the urban agglomeration around Poyang Lake, the autocorrelation of PTS was not significant, and only the LUI has an increased autocorrelation.
To better understand factors underlying the spatial inequality of administrative division system, the regression and spatial regime analyses were conducted. The R2 was 0.6650 in 2010 and 0.7624 in 2017 and the adjusted R2 was 0.6600 in 2010 and 0.7624 in 2017, revealing that the independent factors well explain the LUI. The diagnoses of the spatial autocorrelation tests and significant spatial auto-correlations (p value at 0.01 significance level) were observed in 2010 and 2017 with respect to LUI in the urban agglomeration in the middle reaches of the Yangtze River. Based on the Lagrange tests, SLM performed better than SEM, thus, SLM and SDM models were applied to present the spatial econometric model results. Table 4 shows the results of OLS regression, SLM, and SDM.
As shown in Table 4, the three indicators of SLM were also significant at 1% in 2010 and 2017. The R2 (0.7394 in 2010 and 0.8662 in 2017) and the adjusted R2 (0.7369 in 2010 and 0.8649 in 2017) are higher than that of the OLS regression, implying that the explanatory variables highly fit the SLM model. The three indicators significantly and positively affect LUI in 2010 and 2017, indicating that FAIL, PGDP, and PTS exert a positive driving effect on the land use. The coefficient of PTS is the highest. This result means that the growth of LUI depends more on the development of the tertiary sector. From a temporal perspective, from 2010 to 2017, the coefficient of FAIL and PTS were decreased. Contrastingly, the coefficient of PGDP increased, demonstrating that the driving effect of PGDP became stronger, while the effect of FAIL and PTS weakened. From 2010 to 2017, the county-level administrative units had a significant and increasing spatial interaction effect, and the direct spatial spillover effect was remarkable.
In SDM, the coefficients of spatial correlation (γ) were 0.3744 and 0.3742 in 2010 and 2017, respectively, and the significance level was 1%. The coefficients of driving factors (FAIL, PGDP, and PTS) were significant at 1%. The influences of FAIL and PGDP dramatically weakened, but the PTS slightly increased. The spatial coefficient of W_PGDP changed from negatively significant to positively significant from 2010 to 2017, whereas the spatial coefficient of W_FAIL and W_PTS were insignificant in 2010 and 2017. For the insignificant coefficients of W_FAIL and W_PTS in both years, the indirect spatial spillover effects of FAIL and PTS through the administrative division could not be observed. The robustness of SDM was confirmed, given that the R2 and adjusted R2 were higher than 0.85.
To further examine the factors underlying the spatial inequality of administrative division system of the three agglomerations, the SDM spatial analysis was conducted on the three agglomerations. Table 5 shows the SDM results of Wuhan urban agglomeration, Changsha–Zhuzhou–Xiangtan agglomeration, and the urban agglomeration around Poyang Lake.
In the Wuhan urban agglomeration, as shown in Table 5, the correlation coefficients of FAIL were significant at 1% in 2010 and 2017, and the positive influences of FAIL were strengthened from 2010 to 2017, indicating that FAIL exerted a positive driving effect on LUI. The correlation coefficient of PGDP became insignificant from 2010 to 2017, whereas the coefficient of PTS changed from insignificant to significant at 1% from 2020 to 2017. The driving effect of PTS was becoming stronger, whereas the effect of PGDP was weakened, which is the same as the urban agglomeration in the middle reaches of the Yangtze River in SDM. The robustness of SDM was confirmed, and the R2 (0.9025 in 2010 and 0.9110 in 2017) and the adjusted R2 (0.8937 in 2010 and 0.9029 in 2017) were higher than 0.85 in both years. The independent factors (FAIL, PGDP, and PTS) well explain the LUI and the local factors were highly fitted in the SDM. The spatial coefficient of LUI was significant in 2010 and 2017 with values of 0.3845 and 0.4555, respectively, and both of them were significant at 1%, indicating that the direct impact of neighbors existed and gradually strengthened through the administrative division from 2010 to 2017. With respect to the spatial coefficient of W_PTS, the spatial coefficient changed from insignificant to significant at 1% from 2010 to 2017, whereas all the coefficients of W_PGDP and W_FAIL were insignificant in both years.
In the Changsha–Zhuzhou–Xiangtan agglomeration, the coefficient of FAIL and PTS were significant at 1% in 2010, and the coefficient of FAIL, PGDP, and PTS was significant at 1% in 2017. The coefficient of FAIL was gradually decreasing, while the coefficient of PGDP and PTS was gradually increasing. The results indicate that the economic and industrial factors have become the dominant factors of LUI. The R2 (0.7756 in 2010 and 0.9005 in 2017) and the adjusted R2 (0.7562 in 2010 and 0.8920 in 2017) were greatly improved from 2010 to 2017. This reveals that the independent factors well explain the LUI, and the explanatory variables are highly fitted in the SDM in 2017. From 2010 to 2017, the spatial interaction effect of administrative units weakened. The spatial coefficient of LUI was insignificant in 2010 and 2017, indicating that the direct impact of neighbors through the administrative division system not yet existed. The spatial coefficient of W_FAIL, W_PGDP, and W_PTS was insignificant in both years, and the indirect spatial spillover effects of local factors could not be observed.
In the urban agglomeration around Poyang Lake, the FAIL, PGDP, and PTS exerted a positive driving effect on LUI in 2017, and the FAIL and PGDP exerted a positive driving effect on LUI in 2017. Particularly, the driving effect of FAIL had a noticeable increment, signifying that the driving force of FAIL on LUI dramatically increased. The R2 and the adjusted R2 were higher than 0.9 in 2017, confirming the robustness of SDM. From 2010 to 2017, the spatial coefficient of LUI was changed from insignificant to negatively significant, indicating that the direct impact of neighbors through the administrative division system existed but did not show a positive effect. The spatial coefficient of W_FAIL and W_PGDP in 2017 indicates that the direct impact on LUI of neighbors of spatial spillover effect was obvious.

4.3. Administrative Barriers

To explore the administrative barriers of the three provinces, different administrative barriers coefficients λ were introduced ranging from 0.1–1 for verification. Figure 5 shows the coefficient changes of indicators (FAIL, PGDP, and PTS) and spatial coefficient (γ) under the different hypothesis coefficients of administrative barriers in 2010 and 2017. The results revealed that, as the λ increased, the spatial coefficient of LUI among administrative units showed a trend of strengthening first and then weakening in 2017 and kept strengthening in 2010. The coefficients of FAIL were weakening in 2010 and 2017 as the λ strengthened. The coefficient of PGDP showed a descending tendency as the λ strengthened in 2017, but a tendency of ascending first and then descending in 2010. Generally, the coefficients of FAIL and PGDP presented a decreasing trend along with the strengthening of λ. Particularly, the coefficients of PTS were remarkably different in 2010 and 2017. The coefficient of PTS showed the tendency of slightly increasing first and then decreasing with the λ weakening in 2010 and showed an increasing tendency in 2017.

5. Discussion

On the basis of game theory, an interaction relationship theoretical framework was proposed that reveals the administrative division-socio-economic-land system. This study aims to examine LUI under the administrative division, to explore the distribution and layout of construction land, underlying driving forces, and the spatial interaction of land development of the counties. This work took the urban agglomeration in the middle reaches of the Yangtze River as the case study area, including three different agglomerations, which is essential to study the LUI under administrative division within urban agglomerations.
LUI is a critical indicator to measure the level of regional land use, reveal the efficiency of land use, the level of social and economic development, the evolution of land spatial pattern, and control the allocation of land resources. The spatial distribution of LUI of administrative in different urban agglomerations showed great differences during the study period and presented a structure that radiated from the central city to the surrounding cities. From 2010 to 2017, the LUI had a substantial growth trend in Wuhan urban agglomeration. From the spatial perspective, as core cities of the urban agglomeration, Wuhan, Changsha, and Nanchang have demonstrated a radiating effect on the surrounding areas in terms of land development patterns. The demand for a large quantity of construction land is an essential factor in urban development of many cities, especially the big cities with rapidly development [45]. In the stage of critical urbanization, the spatial adjustment in urban planning and the strengthening of land use policies are warranted [46,47]. Many countries worldwide continuously face various problems, such as the imbalance space of LUI, overdevelopment, and extensive utilization, and the sustainable development of regional water, soil resources, and ecological environment threatened by the excessive expansion of construction land [48,49,50]. The optimization of the construction land layout and morphology can contribute to achieving a sound development of new urbanization, which also plays a critical role in forming efficient urban spatial patterns and structures [51]. Monitoring and controlling LUI can optimize the pattern of land spatial development and realize regional sustainable development.
The administrative level often determines preferences for policies and resource allocation, thus influencing LUI. Compared with the county and urban district, the county-level city has more authority of urban economic development, which implies more urban construction land index and the decentralization of land approval [19]. The construction land index is affected by the development strategy of the higher-level government, that is, the transmission and control of construction land indicators at the upper and lower levels and the influence among units at the same level is weak. However, as the results of this study reveal, the influence of LUI among county-level administrative units at the same level exists, the direct impact of neighbors existed and functioned through the administrative division system. The spatial spillover effect of administrative not only exists in the urban agglomeration in the middle reaches of the Yangtze River, but also in the urban agglomeration in Wuhan and around Poyang Lake.
The administrative spatial spillover effect has a complex influence on land use in the process of regional development, which is mainly through the regional competition and cooperation of different regions. When the relationship between different regions is cooperation, neighbors will often have a positive spatial spillover effect on the local area. Whereas when a strong competitive relationship exists between different regions, the administrative units with stronger competitiveness or higher administrative levels will often play a restrictive effect on the development of neighbor regions, which means a negative administrative spillover effect. In the process of land use, the cooperation and competition between neighboring regions should be fully balanced. The administrative spillover effect is significant and strengthening gradually in the Wuhan urban agglomeration. The administrative spillover effect is remarkably significant in the urban agglomeration in the middle reaches of the Yangtze River, which signifies that the Wuhan urban agglomeration has played a dominant role in the development of the middle reaches of the Yangtze River. On the other hand, the administrative spillover effect has not been observed in the Changsha–Zhuzhou–Xiangtan agglomeration and a negative administrative spillover effect has appeared in the urban agglomeration around Poyang Lake. Strict ecological protection policies have been implemented in these two urban agglomerations, and the cooperation between county-level administrative units focuses more on the protection of the ecological environment, thus, the spatial spillover effect of LUI is not obvious. Therefore, the spatial spillover effect among administrative units is a crucial factor that cannot be ignored in the coordinated development and sustainable development of regions [52]. The government can use the spatial spillover effect under the administrative division as a supplemental method to control the land market better [53]. In the background of land spatial planning, the spatial spillover should be fully considered in the major regional planning and special planning.
Concurrently, this study also verifies the existence of the cross-provincial administrative barriers effects under the administrative division system throughout urban agglomerations. The results show that when different coefficients were introduced, the influencing social economic factors on the LUI were different, and the influence of administrative units on neighboring units also shows different trends. The results revealed that the λ coefficient of 0.5 is the threshold value of administrative barriers, where the coefficient changed to different tendencies, such as changes from strengthening to weakening, from relatively stable to a sharp or a noticeable increase. That is, restricted by the administrative management and administrative boundaries under the administrative division, the spatial spillover effect between adjacent county-level administrative units belonging to different provinces is only half of that of adjacent county-level administrative units belonging to the same province. As the effect of administrative barriers weakens, the flow of production factors such as labor and capital between regions will be promoted. The existence of administrative barriers effects urges us to rethink the optimization of administrative governance during land use change. Therefore, to effectively break through the effect of administrative barriers is an effective measure to optimize structure of land use and improve the efficiency of land development.

6. Conclusions

In the context of rapid urbanization worldwide, the expansion of construction land and increasingly intensified land development have brought about great changes in the spatial structure and functions of the land. Meanwhile, a series of social and eco-environmental problems such as the reductions in arable land, soil erosion and forest destruction worldwide. Therefore, land use and land development have become a common concern of urban planning and development internationally.
This study explored the spatial spillover effect of administrative division system and the influencing factors of LUI in the urban agglomeration in the middle reaches of the Yangtze River in 2010 and 2017. Results revealed that the LUI shows strong characteristics of spatial heterogeneity, and the gap of LUI among counties widened from 2010 to 2017. The fixed asset investment per land, gross domestic product per capital, and proportion of tertiary sector positively influence LUI. The county-level administrative units had a significant and increasing spatial interaction effect, and the direct spatial spillover effect of neighbors on LUI was remarkable. Moreover, the effect of interprovincial administrative barriers among county-level administrative units were observed. These findings are meaningful to better understand the interdependencies between urban socio-economic and LUI under the administrative division system.
The results of this study provide references for the intensive land use and sustainable development. The positive spillover effects of administrative division should be fully considered to improve the land development in the process of spatial governance and policies making, so that we can better solve the global contradiction between land supply and demand. Countries should adopt specific land development and spatial structure readjustment strategies in different regions. The spatial planning is a powerful policy tool to balance economic growth and land development, the spillover effect should be taken into account to achieve regional economic cooperation and policy coordination, to balance land use and land protection effectively. Furthermore, the spillover effect of urban areas is supposed to influence the function of adjacent regions, which can be fully used to strengthen the ties between regions. There are also some limitations, such as the effect of administrative division is difficult to quantify, which can be considered for future investigation. The existence of administrative barriers effects within the province should also be further explored and verified in future research.

Author Contributions

Conceptualization, P.W. and C.Z.; methodology, P.W.; software, P.W.; validation, P.W., C.Z. and Y.S.; investigation, P.W., L.G. and W.L.; resources, C.Z.; data curation, P.W.; writing—original draft preparation, P.W.; writing—review and editing, P.W., C.Z. and Y.S.; visualization, W.Z.; supervision, L.G.; project administration, P.W. and W.L.; funding acquisition, C.Z. All authors have read and agreed to the published version of the manuscript.

Funding

This research was supported by the National Natural Science Foundation of China, grant number 41771563.

Institutional Review Board Statement

Not applicable.

Informed Consent Statement

Not applicable.

Data Availability Statement

Not applicable.

Acknowledgments

The authors would like to thank the anonymous reviewers for their valuable comments.

Conflicts of Interest

The authors declare no conflict of interest.

References

  1. Zhang, P.Y.; Yang, D.; Qin, M.Z.; Jing, W.L. Spatial heterogeneity analysis and driving forces exploring of built-up land development intensity in Chinese prefecture-level cities and implications for future Urban Land intensive use. Land Use Policy 2020, 99, 104958. [Google Scholar] [CrossRef]
  2. Melnychuk, A.; Gnatiuk, O. Regional identity and the renewal of spatial administrative structures: The case of Podolia, Ukraine. Morav. Geogr. Rep. 2018, 26, 42–54. [Google Scholar] [CrossRef] [Green Version]
  3. Colsaet, A.; Laurans, Y.; Levrel, H. What drives land take and urban land expansion? A systematic review. Land Use Policy 2018, 79, 339–349. [Google Scholar] [CrossRef]
  4. Quintas-Soriano, C.; Castro, A.J.; Castro, H. Impacts of land use change on ecosystem services and implications for human well-being in Spanish drylands. Land Use Policy 2016, 54, 534–548. [Google Scholar] [CrossRef]
  5. Cegielska, K.; Noszczyk, T.; Kukulska, A.; Szylar, M.; Hernik, J.; Dixon-Gough, R.; Jombach, T.; Valánszki, I.; Kovács, K.F. Land use and land cover changes in post-socialist countries: Some observations from Hungary and Poland. Land Use Policy 2018, 78, 1–8. [Google Scholar] [CrossRef]
  6. Kong, X.S.; Jiang, X.J.; Liu, Y.; Jin, Z.F. Spatiotemporal Coupling Between Territorial Space Development Intensity and Resource Environmental Carrying Capacity and Its Planning Implications: A Case Study of Jiangsu Province. China Land Sci. 2020, 34, 10–17. [Google Scholar]
  7. Wellmann, T.; Haase, D.; Knapp, S.; Salbach, C.; Selsam, P.; Lausch, A. Urban land use intensity assessment: The potential of spatiotemporal spectral traits with remote sensing. Ecol. Indic. 2018, 85, 190–203. [Google Scholar] [CrossRef]
  8. Huang, X.; Huang, X.J.; Liu, M.M.; Wang, B.; Zhao, Y.H. Spatial-temporal Dynamics and Driving Forces of Land Development Intensity in the Western China from 2000 to 2015. Chin. Geogr. Sci. 2020, 30, 16–29. [Google Scholar] [CrossRef] [Green Version]
  9. Salvati, L.; Carlucci, M. Patterns of sprawl: The socioeconomic and territorial profile of dispersed urban areas in Italy. Reg. Stud. 2016, 50, 1346–1359. [Google Scholar] [CrossRef]
  10. Song, X.P.; Hansen, M.C.; Stehman, S.V.; Potapov, P.V.; Tyukavina, A.; Vermote, E.F.; Townshend, J.R. Global land change from 1982 to 2016. Nature 2018, 560, 639–643. [Google Scholar] [CrossRef]
  11. Salvati, L.; Zambon, I.; Chelli, F.M.; Serra, P. Do spatial patterns of urbanization and land consumption reflect different socioeconomic contexts in Europe? Sci. Total Environ. 2018, 625, 722–730. [Google Scholar] [CrossRef]
  12. Shu, C.; Xie, H.L.; Jiang, J.F.; Chen, Q.R. Is Urban Land Development Driven by Economic Development or Fiscal Revenue Stimuli in China? Land Use Policy 2018, 77, 107–115. [Google Scholar] [CrossRef]
  13. Wang, Z.W.; Lu, C.H. Urban land expansion and its driving factors of mountain cities in China during 1990–2015. J. Geogr. Sci. 2018, 28, 1152–1166. [Google Scholar] [CrossRef] [Green Version]
  14. Zeng, C.; Song, Y.; Cai, D.W.; Hu, P.Y.; Cui, H.T.; Yang, J.; Zhang, H.X. Exploration on the spatial spillover effect of infrastructure network on urbanization: A case study in Wuhan urban agglomeration. Sustain. Cities Soc. 2019, 47, 101476. [Google Scholar] [CrossRef]
  15. Li, C.; Zhao, J.; Xu, Y. Examining spatiotemporally varying effects of urban expansion and the underlying driving factors. Sustain. Cities Soc. 2017, 28, 307–320. [Google Scholar] [CrossRef]
  16. Huang, H.; Wei, Y.D. Spatial inequality of foreign direct investment in China: Institutional change, agglomeration economies, and market access. Appl. Geogr. 2016, 69, 99–111. [Google Scholar] [CrossRef]
  17. Wang, K.Y.; Wang, F.Y. Theory and measurement model of administrative region potential from a perspective of administrative division adjustment: Taking Chongqing city as a case study. J. Geogr. Sci. 2020, 30, 1341–1362. [Google Scholar] [CrossRef]
  18. Yu, H.; Deng, Y.; Xu, S. Evolutionary pattern and effect of administrative division adjustment during urbanization of China: Empirical analysis on multiple scales. Chin. Geogr. Sci. 2018, 28, 758–772. [Google Scholar] [CrossRef] [Green Version]
  19. Feng, R.D.; Wang, K.Y. Spatiotemporal effects of administrative division adjustment on urban expansion in China. Land Use Policy 2021, 101, 105143. [Google Scholar] [CrossRef]
  20. Zeng, C.; Zhang, A.L.; Xu, S. Urbanization and administrative restructuring: A case study on the wuhan urban agglomeration. Habitat Int. 2016, 55, 46–57. [Google Scholar] [CrossRef]
  21. Hong, K.R.; Zou, Y.C.; Zhu, M.Y.; Zhang, Y.W. A Game Analysis of Farmland Expropriation Conflict in China under Multi-Dimensional Preference: Cooperation or Resistance? Land 2021, 10, 124. [Google Scholar] [CrossRef]
  22. Zeng, C.; Zhang, A.L.; Liu, L.; Liu, Y. Administrative restructuring and land-use intensity-A spatial explicit perspective. Land Use Policy 2017, 67, 190–199. [Google Scholar] [CrossRef]
  23. Li, Y.R.; Li, Y.; Karácsonyi, D.; Liu, Z.J.; Wang, Y.S.; Wang, J.Y. Spatio-temporal pattern and driving forces of construction land change in a poverty-stricken county of China and implications for poverty-alleviation-oriented land use policies. Land Use Policy 2020, 91, 104267. [Google Scholar] [CrossRef]
  24. Sheng, M.J.; Gu, C.L. Economic growth and development in Macau (1999–2016): The role of the booming gaming industry. Cities 2018, 75, 72–80. [Google Scholar] [CrossRef]
  25. Sedakov, A.A.; Sorokin, V.A. Solutions of Cooperative Games with a Major Player and a Hierarchical Structure. Autom. Remote Control. 2021, 82, 160–171. [Google Scholar] [CrossRef]
  26. Hilbe, C.; Šimsa, Š.; Chatterjee, K.; Nowak, M.A. Evolution of cooperation in stochastic games. Nature 2018, 559, 246–249. [Google Scholar] [CrossRef]
  27. Zheng, Y.T.; Zhao, S.; Huang, J.Y.; Lv, A.F. Analysis of the Spatiotemporal Pattern and Mechanism of Land Use Mixture: Evidence from China’s County Data. Land 2021, 10, 370. [Google Scholar] [CrossRef]
  28. Zhang, M.Y.; Chen, Q.X.; Zhang, K.W.; Yang, D.Y. Will Rural Collective-Owned Commercial Construction Land Marketization Impact Local Governments’ Interest Distribution? Evidence from Mainland China. Land 2021, 10, 209. [Google Scholar] [CrossRef]
  29. Ma, Y.G.; Chiu, R.L.H. Governing rural redevelopment and re-distributing land rights: The case of Tianjin. Land Use Policy 2018, 72, 533–546. [Google Scholar] [CrossRef]
  30. Wang, X.Z.; Qian, H.; Liu, Z.Y. The Positioning of the County-level Territorial Master Plan from the Perspective of Spatial Governance. Urban Plan. Forum 2020, 03, 65–72. [Google Scholar]
  31. Ma, L.B.; Chen, M.M.; Fang, F.; Che, X.L. Research on the spatiotemporal variation of rural-urban transformation and its driving mechanisms in underdeveloped regions: Gansu Province in western China as an example. Sustain. Cities Soc. 2019, 50, 101675. [Google Scholar] [CrossRef]
  32. Wang, J.J.; Yeh, A.G.O. Administrative restructuring and urban development in China: Effects of urban administrative level upgrading. Urban Stud. 2020, 57, 1201–1223. [Google Scholar] [CrossRef]
  33. Liu, Y.S.; Zhou, Y. Territory spatial planning and national governance system in China. Land Use Policy 2021, 102, 105288. [Google Scholar] [CrossRef]
  34. Tan, R.; Wang, R.Y.; Heerink, N. Liberalizing rural-to-urban construction land transfers in China: Distribution effects. China Econ. Rev. 2020, 60, 101147. [Google Scholar] [CrossRef]
  35. Wang, J.; Li, Y.R.; Wang, Q.Y.; Cheong, K.C. Urban–Rural Construction Land Replacement for More Sustainable Land Use and Regional Development in China: Policies and Practices. Land 2019, 8, 171. [Google Scholar] [CrossRef] [Green Version]
  36. Long, H.L.; Zhang, Y.N.; Tu, S.S. Rural vitalization in China: A perspective of land consolidation. Geogr. Sci. 2019, 29, 517–530. [Google Scholar] [CrossRef] [Green Version]
  37. Fan, X.; Qiu, S.N.; Sun, Y.K. Land finance dependence and urban land marketization in China: The perspective of strategic choice of local governments on land transfer. Land Use Policy 2020, 99, 105023. [Google Scholar] [CrossRef]
  38. Wei, S.Y.; Ju, X.; Xun, W.H. Spatial-Temporal Coupling Relationship between Land Development Intensity and Carrying Capacity of Regional Resources and Environment: A Case Study in Shenyang Economic Region. China Land Sci. 2018, 32, 58–65. [Google Scholar]
  39. Yang, J.; Zeng, C.; Cheng, Y.J. Spatial influence of ecological networks on land use intensity. Sci. Total Environ. 2020, 717, 137151. [Google Scholar] [CrossRef]
  40. Zeng, C.; Zhao, Z.; Wen, C.; Yang, J.; Lv, T.Y. Effect of Complex Road Networks on Intensive Land Use in China’s Beijing-Tianjin-Hebei Urban Agglomeration. Land 2020, 9, 532. [Google Scholar] [CrossRef]
  41. Lee, K.H.; Dvorak, R.G.; Schuett, M.A.; van Riper, C.J. Understanding spatial variation of physical inactivity across the continental United States. Landsc. Urban Plan. 2017, 168, 61–71. [Google Scholar] [CrossRef]
  42. Zhang, W.J.; Wang, M.Y.L. Spatial-temporal characteristics and determinants of land urbanization quality in China: Evidence from 285 prefecture-level cities. Sustain. Cities Soc. 2018, 38, 70–79. [Google Scholar] [CrossRef]
  43. Anselin, L. Local indicators of spatial association—LISA. Geogr. Anal. 1995, 27, 93–115. [Google Scholar] [CrossRef]
  44. Deng, Y.; Qi, W.; Fu, B.J.; Kevin, W. Geographical transformations of urban sprawl: Exploring the spatial heterogeneity across cities in China 1992–2015. Cities 2020, 105, 102415. [Google Scholar] [CrossRef]
  45. Jin, W.F.; Zhou, C.S.; Liu, T.; Zhang, G.J. Exploring the factors affecting regional land development patterns at different developmental stages: Evidence from 289 Chinese cities. Cities 2019, 91, 193–201. [Google Scholar]
  46. Liu, Y.S.; Li, J.T.; Yang, Y.Y. Strategic adjustment of land use policy under the economic transformation. Land Use Policy 2018, 74, 5–14. [Google Scholar] [CrossRef]
  47. Wang, J.; Lin, Y.F.; Glendinning, A.; Xu, Y.Q. Land-use changes and land policies evolution in China’s urbanization processes. Land Use Policy 2018, 75, 375–387. [Google Scholar] [CrossRef]
  48. Fang, L.; Tian, C.H. Construction land quotas as a tool for managing urban expansion. Landsc. Urban Plan. 2020, 195, 103727. [Google Scholar] [CrossRef]
  49. Xie, H.L.; He, Y.F.; Choi, Y.; Chen, Q.R.; Cheng, H. Warning of negative effects of land-use changes on ecological security based on GIS. Sci. Total Environ. 2020, 704, 135427. [Google Scholar] [CrossRef] [PubMed]
  50. Tong, D.; Yuan, Y.X.; Wang, X.G. The coupled relationships between land development and land ownership at China’s urban fringe: A structural equation modeling approach. Land Use Policy 2021, 100, 104925. [Google Scholar] [CrossRef]
  51. Liu, Y.S.; Zhang, Z.W.; Zhou, Y. Efficiency of construction land allocation in China: An econometric analysis of panel data. Land Use Policy 2018, 74, 261–272. [Google Scholar] [CrossRef]
  52. Wang, R.; Zameer, H.; Feng, Y.; Jiao, Z.L.; Xu, L.; Gedikli, A. Revisiting Chinese resource curse hypothesis based on spatial spillover effect: A fresh evidence. Resour. Policy 2019, 64, 101521. [Google Scholar] [CrossRef]
  53. Zeng, C. Spatial spillover effect on land conveyance fee-A multi-scheme investigation in Wuhan agglomeration. Land Use Policy 2019, 89, 104196. [Google Scholar] [CrossRef]
Figure 1. The theoretical framework.
Land 10 00543 g001
Figure 2. Study area.
Land 10 00543 g002
Figure 3. Conceptual model of the spatial adjacency matrix. Note: Chibi City is a county-level city administered by Xianning city of Hubei province. Linxiang City is a county-level city administered by Yueyang City of Hunan province. Jiayu County, Chongyang County, and Tongshan County are counties of Xianning city. Jiangxia District is a municipal district of Wuhan City. Xianan District is a municipal district of Xianning City. In the Figure 3, C1, C2, C3, C4, C5, C6, and C7 are Linxiang City, Jiayu County, Chibi City, Chongyang County, Jiangxia District, Xianan District, and Tongshan County, respectively. S1 is the adjacent scenario of county-level city and county-level city. S2 is the adjacent scenario of county-level city and county. S3 is the adjacent scenario of county-level city and urban district. S4 is the adjacent scenario of county and urban district. S5 is the adjacent scenario of urban district and urban district. S6 is the adjacent scenario of county and county.
Land 10 00543 g003
Figure 4. Spatial and hotspot patterns of LUI in the urban agglomeration of the middle reaches of the Yangtze River in 2010 and 2017. (a) Shows the spatial and hotspot patterns in the urban agglomeration in the middle reaches of the Yangtze River in 2010. (b) Refers to the spatial and hotspot patterns in the urban agglomeration in the middle reaches of the Yangtze River in 2017.
Land 10 00543 g004
Figure 5. Coefficient changes of indicators (FAIL, PGDP, and PTS) and spatial coefficient (γ) under different hypothesis coefficients λ of administrative barriers in 2010 and 2017. (a) Shows the different spatial coefficient (γ) of LUI under different hypothesis coefficients λ of administrative barriers in 2010 and 2017. (b) Refers to the coefficient changes of FAIL under the different hypothesis coefficients λ of administrative barriers in 2010 and 2017. (c) Presents the coefficient changes of PGDP under the different hypothesis coefficients λ of administrative barriers in 2010 and 2017. (d) Indicates the coefficient changes of PTS under the different hypothesis coefficients λ of administrative barriers in 2010 and 2017. Notes: The main axis, which is on the left, represents the year of 2010 and the secondary axis, which is on the right, represents the year of 2017.
Land 10 00543 g005
Table 1. Data and Data sources.
Data Data TypeData SourceYear
Land use classification data (interpreted from Landsat TM/ETM images spatial resolution of 30 m)Cropland, grassland, forest, build-up land, water and othersGeographical Information Monitoring Cloud Platform (http://www.dsac.cn/DataProduct)2010 and 2017
Road network dataRoadGeographical Information Monitoring Cloud Platform (http://www.dsac.cn/DataProduct/Detail/201843)2010 and 2017
Administrative division datasetProvincial boundaries, city boundaries and county boundariesMap World in National Platform for Common Geospatial Information Services (https://www.tianditu.gov.cn/)2010 and 2017
Socio-economic datasetPopulation, GDP, sector structure, and so onthe Statistical Yearbooks of Hubei, the Statistical Yearbooks of Hunan, and the Statistical Yearbooks of Jiangxi Province2011 and 2018
Table 2. Descriptive statistics in 2010 and 2017.
IndexYearCountiesMinMaxMeanMedianStandard Deviation
FAIL201020646.648472,367.09733590.1510455.96289843.0230
2017207207.5307193,344.73898589.10701701.573022,850.6100
PGDP20102060.5510 11.43082.58841.92001.9353
20172071.5582 20.83065.67314.39393.6155
PTS20102060.12110.93840.34940.32040.1375
20172070.14610.93450.41970.39000.1421
LUI20102060.00220.77960.07680.02590.1326
20172070.00520.96070.13530.05330.1963
Notes: Acronyms: FAIL: Fixed asset investment per land; PGDP: Gross domestic product per capital; PTS: Proportion of tertiary sector; LUI: Land-use intensity.
Table 3. Global Moran’s I of the Wuhan urban agglomeration, Changsha–Zhuzhou–Xiangtan agglomeration, and urban agglomeration around Poyang Lake in 2010 and 2017.
Variable
Scenario
Wuhan Urban AgglomerationChangsha–Zhuzhou–Xiangtan AgglomerationUrban Agglomeration around Poyang Lake
201020172010201720102017
LUI0.509 ***0.638 ***0.383 ***0.542 ***0.284 ***0.452 ***
FAIL0.505 ***0.427 ***0.504 ***0.323 ***0.430 ***0.414 ***
PGDP0.434 ***0.498 ***0.568 ***0.480 ***0.471 ***0.438 ***
PTS0.1230.198 **0.156 **0.143 *0.0460.001
Notes: *, **, *** refer to the 10%, 5%, and 1% significance level, respectively. Acronyms: FAIL: Fixed asset investment per land; PGDP: Gross domestic product per capital; PTS: Proportion of tertiary sector; LUI: Land-use intensity.
Table 4. Results of OLS regression, SLM, and SDM in 2010 and 2017.
Variable ScenarioOLS RegressionSLMSDM
201020172010201720102017
Moran’s I for LUI--0.390 ***0.549 ***--
LM--10.501 ***46.997 ***--
R-LM--0.07050.560 ***--
FAIL8.01 × 10−6 ***4.47 × 10⁻⁶ ***6.97 × 10⁻⁶ ***3.15 × 10⁻⁶ ***7.85 × 10⁻⁶ ***2.84 × 10⁻⁶ ***
PGDP0.0125 ***0.0203 ***0.0090 ***0.0118 ***0.0160 ***0.0089 ***
PTS0.1466 ***0.1870 ***0.1429 ***0.1869 ***0.1594 ***0.1648 ***
W_FAIL----−5.21 × 10 −78.63 × 10−7
W_PGDP----−0.0218 ***0.0128 ***
W_PTS----0.0230−0.0060
cons−0.0357 *−0.0965 ***−0.0395 **−0.0991 ***−0.0243−0.1255 ***
γ--0.2878 ***0.5364 ***0.3744 ***0.3742 ***
R20.66500.76240.73940.86620.75650.8694
Adj-R20.66000.75890.73690.86490.75040.8661
Notes: *, **, *** refer to the 10%, 5%, and 1% significance levels, respectively. Acronyms: OLS: Ordinary least squares; SLM: Spatial lag model; SDM: Spatial Durbin model; LM: Lagrange multiplier test of general spatial autocorrelation. R-LM: Robust Lagrange multiplier test of general spatial autocorrelation; FAIL: Fixed asset investment per land; PGDP: Gross domestic product per capital; PTS: Proportion of tertiary sector; LUI: Land-use intensity.
Table 5. Results of SDM in 2010 and 2017 of the three agglomerations.
Variable ScenarioWuhan Urban AgglomerationChangsha–Zhuzhou–Xiangtan AgglomerationUrban Agglomeration around Poyang Lake
201020172010201720102017
Moran’s I for LUI0.509 ***0.638 ***0.383 ***0.542 ***0.284 ***0.441***
FAIL1.07 × 10−5 ***2.00 × 10⁻⁶ ***3.02 × 10⁻⁶ ***2.08 × 10⁻⁶ ***1.17 × 10⁻⁶ ***4.05 × 10⁻⁶ ***
PGDP0.0325 ***0.00720.0109 **0.0134 ***0.0185 **0.0187 ***
PTS0.07500.1965 **0.2048 ***0.2204 ***0.12430.1324 **
W_FAIL−2.96 × 10−65.10 × 10−71.05 × 10−63.99 × 10−62.16 × 10−64.41 × 10−6 ***
W_PGDP−0.01200.0097−0.00550.0076−0.01040.0345 ***
W_PTS−0.12010.3617 **−0.17780.02360.1373−0.0086
cons0.0205−0.2304 ***0.0046−0.1678−0.0653−0.1960 ***
γ0.3845 **0.4555 ***0.26390.0145−0.3022−0.6602 ***
R20.90250.91100.77560.90050.77300.9191
Adj-R20.89370.90290.75620.89200.75790.9138
Notes: *, **, *** refer to the 10%, 5%, and 1% significance levels, respectively. Acronyms: SDM: Spatial Durbin model; FAIL: Fixed asset investment per land; PGDP: Gross domestic product per capital; PTS: Proportion of tertiary sector; LUI: Land-use intensity.
Publisher’s Note: MDPI stays neutral with regard to jurisdictional claims in published maps and institutional affiliations.

