Article

Attribution Analysis of Seasonal Runoff in the Source Region of the Yellow River Using Seasonal Budyko Hypothesis

1
College of Resources and Environmental Sciences, Henan Agricultural University, Zhengzhou 450002, China
2
Key Laboratory of Geographic Information Science, Ministry of Education, East China Normal University, Shanghai 200241, China
3
Collaborative Innovation Center on Yellow River Civilization Jointly Built by Henan Province and Ministry of Education & Key Research Institute of Yellow River Civilization and Sustainable Development, Henan University, Kaifeng 475001, China
4
Center for Energy, Environment & Economy Research, Zhengzhou University, No. 100 Science Avenue, Gaoxin District, Zhengzhou 450001, China
5
Tourism Management School, Zhengzhou University, No. 100 Science Avenue, Gaoxin District, Zhengzhou 450001, China
*
Author to whom correspondence should be addressed.
Land 2021, 10(5), 542; https://doi.org/10.3390/land10050542
Submission received: 4 March 2021 / Revised: 10 May 2021 / Accepted: 15 May 2021 / Published: 19 May 2021
(This article belongs to the Special Issue Impact of Land-Use Change on Water Resources)

Abstract

:
Previous studies mainly focused on quantifying the contribution rate of different factors on annual runoff variation in the source region of the Yellow River (SRYR), while there are few studies on the seasonal runoff variation. In this study, the monthly water storage and monthly actual evaporation of SRYR were calculated by the monthly ABCD model, and then a seasonal Budyko frame was constructed. Finally, the contribution rate of climatic and anthropic factors on the seasonal runoff variation in Tangnaihai hydrological station were quantitatively calculated. It turned out that: (1) The changing point of runoff data at Tangnaihai hydrological station is 1989. (2) The ABCD monthly hydrological model could well simulate the monthly runoff variation of Tangnaihai hydrological station. (3) Anthropic factors play a major role in runoff change in spring, summer, and winter, while climatic factors play a major role in runoff change in autumn.

1. Introduction

The source region of the Yellow River (SRYR), with the area of about 121,900 km2, accounting for 16.2% of the basin, is the main runoff producing area and water conservation area in the Yellow River Basin. Its annual average runoff is about 248.72 × 10⁸ m3, accounting for more than 40% of the average annual runoff of the basin [1]. The runoff in SRYR has gradually decreased, which has endangered the ecological security of the basin and harmed its high-quality economic development [1]. In addition, the reduction of water resources also endangered the grain production in the basin.
Climatic and anthropic factors are the two major driving forces of the hydrological cycle change [2,3,4]. Climate change mainly affects runoff through variations in precipitation and temperature [5,6]. The impact of human activities on runoff can be divided into the direct impact of anthropic factors and the indirect impact of underlying surface changes on runoff. The direct impacts include man-made water intake, inter-basin water transfer, and water conservancy project construction [7,8,9,10]. The indirect effects include urbanization and afforestation projects on the underlying surface conditions of the basin [11,12,13,14].
Many researches distinguished the impact of climatic and anthropic factors on annual runoff in SRYR. Jiang et al. quantified the impact of climatic and anthropic factors on the annual runoff in the SRYR for the period of 1956-2012, and found that climate changes was the main factor, with a contribution rate of more than 90% [15]. Wang et al. distinguished the contribution rate of climate change, frozen soil degradation, and land type change on annual runoff change in SRYR from 1965 to 2015. Compared with 1965–1989, the contribution rates of climate change, frozen soil degradation, and land type change on annual runoff change in 1990–2003 were 55.0%, 32.6%, and 12.4%, respectively. Compared with 1990–2003, climate change, frozen soil degradation, and land use change contributed 126.0%, −38.5%, and 12.5% on annual runoff change in 2004–2015 [16]. Wang et al. analyzed the contribution rate of climate and underlying surface changes on annual runoff change. The results show that an increase of 1% in precipitation will lead to an increase of 1.97% in runoff, and while an increase of 1% in evaporation or underlying surface parameters will would lead to a reduction of 0.97% or 1.18% in runoff. The contribution rate of precipitation change is 24.0%, and that of evaporation is 18.0% [17]. Zhang et al. used the elastic coefficient method to distinguish the impact of climatic and anthropic factors on the annual runoff variation in SRYR from 1965 to 2013. The results showed that the contribution rate of climate change was about 39%–45% and that of anthropic factors was about 55%–61% from 1990 to 1999. Anthropic factors were the leading reason from 2000 to 2013 [18]. Yan et al. (2021) used Budyko-type equations for separating the impacts of climate and vegetation change on annual runoff variation in SRYR from 1961 to 2015 [19]. However, previous studies aimed to quantify the impact of climatic and anthropic factors on annual runoff change, while few attempts have been made to quantitatively assess the impact of climatic and anthropic factors on river runoff changes at seasonal or monthly scales.
The commonly used methods for quantifying the impact of climatic and anthropic factors on runoff change include the Budyko hypothesis and hydrologic model simulation. The Budyko hypothesis takes into account the water and energy balance in the hydrological process and is easy to calculate. The time scale in the Budyko hypothesis is defined as the average value of multi-year meteorological and hydrological data [20]. Therefore, the Budyko hypothesis, based on an assumption that the change of catchment storage water for multi-year water balance is considered as 0, is widely applied to quantitatively calculate the impact of climate change and anthropic factors on long-term annual runoff change, while ignoring their impact on intra-annual runoff distribution [21,22,23,24,25,26]. For multi-year water balance, the change of water storage is usually negligible compared with the average annual precipitation depth. However, monthly or seasonal Budyko frameworks must consider the impact of water storage change on monthly or seasonal runoff change. Therefore, the change of water storage should be regarded as an important part of Budyko’s steady-state hypothesis on monthly or seasonal scales.
For the hydrologic model simulation method, the impact of a factor (climatic or anthropic) on runoff can be calculated by changing one parameter and fixing other parameters at the same time, and the contribution rate of climatic and anthropic factors to runoff variation can be separated by comparing the differences between observed and simulated runoff during the post-change period and observed runoff in the baseline period [27,28,29]. Common hydrological models include the Soil Water Assessment Tool [30,31], Distributed time-variant gain model [32], Geomorphology-Based Hydrological Model [33], Precipitation Runoff Modeling System [34], ABCD model [35], and Variable Infiltration Capacity model [36] et al. Hydrological model simulation can accurately express the mechanism of runoff evolution and simulate monthly water storage change. However, uncertainties are existed in both model parameters and input data [37,38,39,40,41].
Compared with other hydrological models, the ABCD model has the following advantages: (1) less parameters, high simulation accuracy and easy to optimize; (2) observed soil water content and groundwater data are unnecessary; (3) high adaptability due to unseparated direct runoff and groundwater outflow when calculating runoff; (4) the model can simulate the changing process of soil water content without estimating the parameters of soil aquifer; (5) the ABCD model is calculated by genetic algorithm, which is simple and can be easily implemented in MATLAB [42,43,44,45].
In short, for grasping the intra-annual runoff distribution mechanism of SRYR, this study attempts to quantitatively analyze the impact of climatic and anthropic factors on the seasonal runoff variation in SRYR by following four steps: (1) distinguishing the mutation year of runoff time series data by Mann–Kendall and cumulative anomaly methods; (2) calculating the monthly water storage and monthly actual evaporation of SRYR by the monthly ABCD model; (3) constructing a seasonal Budyko framework of SRYR; and (4) quantifying the contribution rate of climatic and anthropic factors on the runoff variation of Tangnaihai hydrological station in spring, summer, autumn, and winter by the decomposition method.

2. Study Area and Data
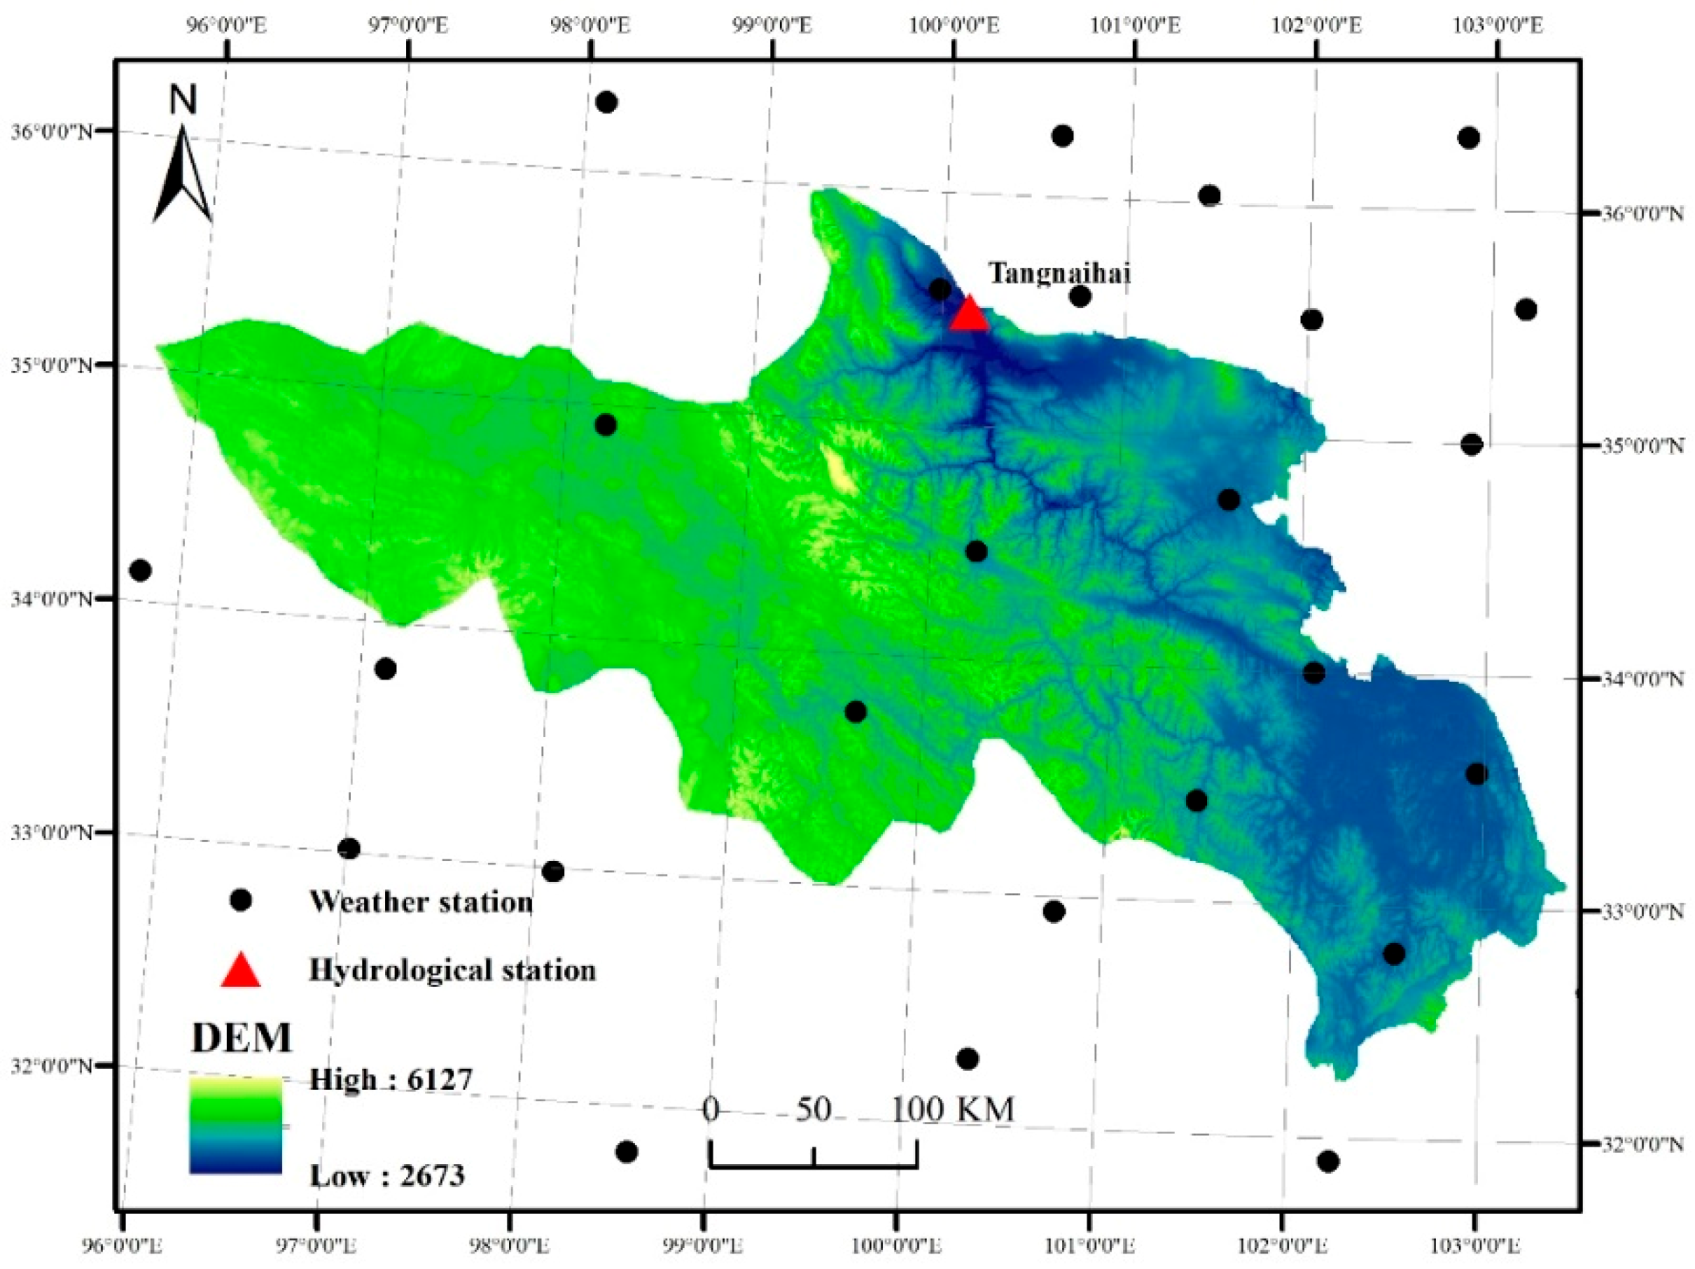
2.1. Study Area

SRYR is located between 32° N~36° N and 95° E~104° E (Figure 1). The topography of the basin is uneven. The altitude ranges from 2600 to 6200 m, with an area of about 121,900 km2, accounting for 16.2% of the basin. It is an important runoff producing area in the Yellow River Basin. Its annual average runoff is about 248.72 × 10⁸ m3, accounting for more than 40% of the average annual runoff of the basin.

2.2. Data Sources

The observed monthly runoff data in the period 1967–2016 in Tangnaihai station were obtained from the Yellow River Water Conservancy Commission (Table 1).
The 25 weather stations’ data from 1967 to 2016 in and around SRYR were obtained from China Meteorological Administration (Table 1). First, the daily precipitation and potential evaporation of 25 meteorological stations were obtained by distribution calculation, and then the monthly precipitation and potential evaporation of 25 meteorological stations were calculated. The monthly precipitation and potential evaporation with a resolution of 1 × 1 km were interpolated from 25 meteorological stations’ data in and around the SRYR.

3. Methodology

3.1. Mutation Analysis Methods

Mann–Kendall mutation analysis has been widely used to test abrupt point of hydrometeorological elements due to its advantages of no interference from a few outliers and simple calculation [46,47,48,49]. The cumulative anomaly method is a nonlinear statistical method which can directly judge the data change trend from the curve. Its calculation process is simple, and it is also widely used to test the abrupt change points of hydro-meteorological elements [50,51].
For distinguishing the mutation year of runoff time series data as accurately as possible, this paper uses the Mann–Kendall and cumulative anomaly methods to analyze abrupt points of the runoff time series data in Tangnaihai hydrological station, and then by combining the results of the two methods, the runoff time series data of Tangnaihai hydrological station were divided into several periods.

3.2. Monthly ABCD Hydrological Model

The monthly ABCD model proposed by Thomas in 1981 is a simple and efficient four parameter conceptual hydrological model. The main input data of the model are monthly rainfall data, monthly potential evapotranspiration data, and monthly runoff depth observation data, and the output data are monthly runoff depth simulated data, monthly soil water content data, monthly groundwater content data, and monthly actual evaporation data. The basic principle of the monthly ABCD model is the water balance principle.
The water balance equation in the soil aquifer can be expressed as:
P t E T t D R t G R t = S t S t 1
where Pt is the monthly rainfall (mm), ETt is the actual monthly evapotranspiration (mm), DRt is the surface direct runoff (mm), GRt represents groundwater recharge (mm), and St and St1 represent the soil moisture content (mm) of the current month and the last month.
The probable evapotranspiration (Yt) is the maximum water amount leaving the basin in the form of evapotranspiration. The effective water (Wt) is the sum of Yt and soil aquifer discharge (including surface runoff and groundwater recharge).
W t = P t + S t 1 = S t + E T t + D R t + G R t
W t = S t + E T t
The nonlinear functional relationship between Yt and Wt is shown in Equation (4):
P t E T t D R t G R t = S t S t 1
where parameter a is the probability of runoff formation before the soil water content is fully saturated and parameter b is the upper limit of unsaturated aquifer water storage capacity. The range of parameter a is (0, 1) and the range of parameter b is (0, 1000).
The curve of possible evapotranspiration and effective water quantity in the “ABCD” model is shown in Figure 2. YtWt, Y’t (0) = 1, Y’t (∞) = 0. With the increase of Wt, Yt will be more and more close to b. Yt will remain unchanged when it reaches b, so b can be considered as the upper limit of unsaturated aquifer water storage. When Yt reaches b, the excess rainfall will be converted into surface runoff and groundwater recharge.
The ratio between the decrease rate of soil water content (S) caused by evapotranspiration and the potential evapotranspiration is assumed to be St/b in the “ABCD” model.
d S t d t =   P E T t S t b
S t = Y t exp (   P E T t b )
where PETt is the potential evapotranspiration (mm). PETt can be calculated using the Penman–Monteith formula.
P E T t = 0.408 Δ ( R n G ) + γ 900 T + 273 U 2 ( e a e d ) Δ + γ ( 1 + 0.34 U 2 )
The water balance equation in the groundwater aquifer can be expressed as:
G t + G D t = G t 1 + G R t
where GDt is underground runoff, GRt is groundwater recharge, and Gt and Gt1 are the groundwater storage in the current month and the last month, respectively. GDt and GRt can be expressed as follows:
G R t = c ( W t Y t )
G D t = d G t
where parameter c is the proportion of groundwater recharge from the soil aquifer and parameter d is the rate of groundwater outflow. The range of parameter c is (0, 1) and the range of parameter d is (0, 1).
The Nash efficiency coefficient (NS) and root mean square error (RMSE) and relative error (RE) are selected as the evaluation indexes in the calibration and validation of hydrological model parameters.
N S = 1 i = 1 m ( Q i P i ) 2 i = 1 m ( P i P ¯ ) 2
R M S E = 1 m i = 1 m ( Q i P i ) 2
R E = i = 1 m Q i P i i = 1 m P i
In the formulas, Q i represents the runoff simulation value at time i, P i represents the runoff observation value at time i, and P ¯ represents the average value of runoff observation values.

3.3. Decomposition Method Based on Seasonal Budyko Framework

Chen et al. put forward the definition of effective precipitation, and then the applicability of the Budyko framework was extended from the annual scale to the seasonal scale [52]. The effective precipitation is equal to the precipitation minus the change value of water storage. The seasonal Budyko framework must consider the change of water storage, but there is no measured value between the change of water storage and the actual evapotranspiration. In this paper, the monthly ABCD model was applied for simulating the monthly water storage change and actual evapotranspiration, which were superimposed on the season to construct the seasonal Budyko framework.
The formula of the seasonal Budyko framework is shown as the following:
E P Δ S = [ 1 + ( E p P Δ S φ ) ω ] 1 / ω
P represents precipitation, E represents actual evaporation, Ep represents potential evaporation, ΔS represents the change of storage water, φ represents the corresponding lower bounds of aridity indices, and ω represents the underlying surface parameter.
Wang et al. put forward a decomposition method based on the Budyko hypothesis [53] and this method is simple in structure, easy to use, and does not need a lot of hydro-meteorological data. Sun et al., Jiang et al., Li et al., and Xin et al., respectively, applied the decomposition method to quantify the impact of climatic and anthropic factors on the upper reaches of Han River, Huifa River, and Weihe River runoff [54,55,56,57].
Figure 3 displays the schematic of the decomposition method. There are three points (A–C) in Figure 3. Under the joint impact of climatic and anthropic factors, point A will move to B. Only under the impact of climate change, point A will move to point C along the Budyko curve. The climatic conditions of point B and point C are consistent. Climate change will cause horizontal and vertical changes in directions, and anthropic factors can only cause changes in the vertical direction.
The runoff change caused by anthropic factors (ΔRh) and caused by climate change (ΔRc) can be calculated by:
Δ R h = ( P 2 Δ S 2 ) ( E 2 P 2 Δ S 2 E 2 P 2 Δ S 2 )
Δ R c = Δ R Δ R h
η R c = Δ R c / Δ R × 100
η R h = Δ R h / Δ R × 100
where ΔR represents the difference between the observed runoff in the pre-change period and the observed runoff in the post-change period, and η R c and η R h represent the contribution rate of climatic and anthropic factors on runoff variation, respectively.

4. Results and Analysis

4.1. Mutation Analysis

In this paper, the Mann–Kendall and cumulative anomaly method were applied for distinguishing the mutation year of runoff time series data in Tangnaihai (Figure 4 and Figure 5).
As can be seen from Figure 4, the UF and UB curve intersected in 1969, 1989, 2009, and 2015, and all of them are within the range of the 0.05 significance level. As can be seen from Figure 5, the change trend of the cumulative anomaly value of runoff in the Tangnaihai station changed in 1989. Combining the results of two mutation analysis methods, the change point of annual runoff series data in Tangnaihai hydrological station from 1967 to 2016 is 1989.

4.2. Parameter Calibration and Verification of Monthly ABCD Model

According to the analysis results in Section 4.1, the period 1967–2016 was segmented into two periods: the pre-change period (T1: 1967–1989) and the post-change period (T2: 1990–2016). The T1 period and the T2 period are both divided into the calibration period and the validation period, respectively, and the specific time division is shown in Table 2 and Table 3.
The ABCD model was calculated by genetic algorithm in MATLAB; the value of parameter a, b, c, and d in the calibration period (1967.1–1978.6) in the T1 period were calculated (Table 2). The NS of the calibration period (1967.1–1978.6) in the T1 period is 0.80, the RMSE is 5.11, and the RE is −3.62% (Table 2). Then, the value of parameter a, b, c, and d in the calibration period (1967.1–1978.6) in the T1 period were used to simulate the monthly simulated runoff depth data in the validation period (1978.7–1989.12). The NS of the validation period (1978.7–1989.12) in the T1 period is 0.82, the RMSE is 5.84, and the RE is 3.37% (Table 2).
The ABCD model was calculated by genetic algorithm in MATLAB; the value of parameter a, b, c, and d in the calibration period (1990.1–2003.6) in the T2 period were calculated (Table 3). The NS of the calibration period (1990.1–2003.6) in the T2 period is 0.79, the RMSE is 3.76, and the RE is 0.31% (Table 3). Then, the values of parameter a, b, c, and d in the calibration period in the T2 period were used to simulate the monthly simulated runoff depth data in the validation period (2003.7–2016.12). The NS of the validation period (2003.7–2016.12) in the T2 period is 0.80, the RMSE is 4.59, and the RE is −1.65% (Table 3).
Therefore, the monthly ABCD model constructed in this paper can well simulate the monthly runoff changes of Tangnaihai hydrological stations in T1 (1967–1989) and T2 (1990–2016), and was applied for simulating monthly water storage change and actual evaporation in SRYR. The monthly runoff simulation results of Tangnaihai hydrological station in T1 (1967–1989) and T2 (1990–2016) are displayed in Figure 6 and Figure 7.

4.3. Parameter Fitting of Budyko Curve

According to the distribution of seasonal precipitation in SRYR, the annual runoff data are segmented into four seasons: spring, summer, autumn, and winter. Before applying the vertical decomposition method to quantitatively calculate the contribution rate of climatic and anthropic factors on runoff variations, it was necessary to fit the parameter of Budyko curves in the four seasons in the pre-change period (1967–1989).
The parameter fitting results of the Budyko curve in the pre-change period of four seasons are displayed in Figure 8. The values of φ in the pre-change period are 0.46 in spring, 0.27 in summer, 0.23 in autumn, and 0.52 in winter, respectively. The values of ω in the pre-change period are 1.08 in spring, 1.40 in summer, 1.14 in autumn, and 1.04 in winter, respectively. The values of φ and ω reflect the effects of vegetation, soil, and topography on the evaporation and water storage in different seasons in SRYR [52]. In addition, most of the purple dots are above the blue dots, indicating that anthropic factors have a reducing impact on runoff of the four seasons in the post-change period (1990–2015).

4.4. Quantitative Analysis of Seasonal Runoff by Climatic and Anthropic Factors

The eigenvalues of climatic and hydrological variables in the pre-change period (1967–1989) and the post-change period (1990–2016) are displayed in Table 4. Compared with the pre-change period (1967–1989), precipitation in spring, summer, autumn, and winter of the post-change period (1990–2016) changed by 1.96, −4.86, −3.91, and 1.93 mm, respectively; the actual evaporation increased by 8.69 mm in spring, 15.51 mm in summer, 8.01 mm in autumn, and 3.34 mm in winter; the runoff depth decreased by 4.12 mm in spring, 12.18 mm in summer, 18.9 mm in autumn, and 1.05 mm in winter, respectively. Water storage changed by −2.61 mm in spring, −8.19 mm in summer, 6.98 mm in autumn, and −0.36 mm in winter, respectively.
Table 5 displays the contribution rate of climatic and anthropic factors on seasonal runoff variation in the post-change period. Compared with the pre-change period (1967–1989), the runoff in the post-change period (1990–2016) decreased by 1.22 mm in spring, 6.06 mm in summer, 15.01 mm in autumn, and 0.43 mm in winter due to climatic factors, accounting for 29.72%, 49.75%, 79.45%, and 40.89%, respectively. The runoff variation caused by anthropic factors in the T2 period is −2.90 mm in spring, −6.12 mm in summer, −3.88 mm in autumn, and −0.62 mm in winter, accounting for 70.28%, 50.25%, 20.55%, and 59.11%, respectively. In summary, anthropic factors played a major role in runoff change in spring, summer, and winter, while climatic factors played a major role in runoff change in autumn.

5. Conclusions and Discussion

In this paper, based on the monthly ABCD hydrological model and the seasonal Budyko framework, the contribution rate of climatic and anthropic factors on the seasonal runoff variation in SRYR was quantitatively calculated. It turned out that the ABCD monthly hydrological model could well simulate the monthly runoff variation of Tangnaihai hydrological station in T1 (1967–1989) and T2 (1990–2016) periods. The contribution rate of climatic and anthropic factors on the runoff variation in spring, summer, autumn, and winter are 29.72% and 70.28%, 49.75% and 50.25%, 79.45% and 20.55%, and 40.89% and 59.11%, respectively.
The main reason for the higher contribution rate of anthropic factors in spring is that the spring crops (wheat and rapeseed) require a large amount of water, which extracted from the river basin for irrigation. In summer, the runoff is relatively large, and Huangheyuan hydropower station has a great influence on the regulation of river runoff, especially when the hydropower station is in full load operation for power generation and preventing flood, resulting in the decrease of the runoff at Tangnaihai in summer. In winter, the runoff is relatively small; reservoirs and hydropower stations often regulate and control water levels for power generation, resulting in the decrease of the runoff at Tangnaihai. In autumn, the water level can meet the basic requirements of reservoirs and hydropower stations; its regulation mode is “release as much as possible”, which indicates that the impact of anthropic factors on the runoff change at Tangnaihai in autumn is relatively small.
Although the data used in this study were carefully controlled, there were still some uncertainties. Precipitation and potential evapotranspiration data were interpolated from low-density station data from national meteorological stations in and around the SRYR. Although the theoretical basis of the monthly ABCD hydrological model is rigorous, there are still some uncertainties when using mathematical formulas to describe the process of runoff generation. Additionally, the monthly ABCD hydrological model is a lumped hydrologic model, which cannot show the influence of the uneven distribution of the underlying surface conditions and precipitation on the runoff formation process.

Author Contributions

Conceptualization: G.J., Z.L. Data curation: G.J., L.W. (Leying Wu), L.W. (Liangdong Wang). Methodology: G.J., D.Y., Z.L., L.W. (Leying Wu), L.W. (Liangdong Wang). Writing—original draft: G.J., Z.L., L.W. (Leying Wu), L.W. (Liangdong Wang). Writing—review and editing: G.J., D.Y., Z.L. All authors have read and agreed to the published version of the manuscript.

Funding

This research was supported by the Guizhou Theoretical Innovation Joint Project of China (GZLCLH-2020-331), Soft Science Research Project of Henan Province (212400410077, 192400410085), the National Natural Science Foundation of China (41901239), and China Postdoctoral Science Foundation (2018M640670).

Institutional Review Board Statement

Not applicable.

Informed Consent Statement

Not applicable.

Data Availability Statement

Not applicable.

Conflicts of Interest

We declare no conflict of interest.

References

  1. Li, L.; Shen, H.; Dai, S.; Xiao, J.; Shi, X. Response of runoff to climate change and its future tendency in the source region of Yellow River. J. Geogr. Sci. 2012, 22, 431–440. [Google Scholar] [CrossRef]
  2. Vörösmarty, C.J.; Green, P.; Salisbury, J.; Lammers, R.B. Global water resources: Vulnerability from climate change and population growth. Science 2000, 289, 284–288. [Google Scholar] [CrossRef] [Green Version]
  3. Milly, P.C.; Dunne, K.A.; Vecchia, A.V. Global pattern of trends in streamflow and water availability in a changing climate. Nature 2005, 438, 347–350. [Google Scholar] [CrossRef] [PubMed]
  4. Oki, T.; Kanae, S. Global hydrological cycles and world water resources. Science 2006, 313, 1068–1072. [Google Scholar] [CrossRef] [Green Version]
  5. Piao, S.; Ciais, P.; Huang, Y.; Shen, Z.; Peng, S.; Li, J.; Friedlingstein, P. The impacts of climate change on water resources and agriculture in China. Nature 2010, 467, 43–51. [Google Scholar] [CrossRef] [PubMed]
  6. Guo, Y.; Huang, S.; Huang, Q.; Leng, G.; Fang, W.; Wang, L.; Wang, H. Propagation thresholds of meteorological drought for triggering hydrological drought at various levels. Sci. Total Environ. 2020, 712, 136502. [Google Scholar] [CrossRef]
  7. Rossi, A.; Massei, N.; Laignel, B.; Sebag, D.; Copard, Y. The response of the Mississippi River to climate fluctuations and reservoir construction as indicated by wavelet analysis of streamflow and suspended-sediment load, 1950–1975. J. Hydrol. 2009, 377, 237–244. [Google Scholar] [CrossRef]
  8. Wang, X. Advances in separating effects of climate variability and human activity on stream discharge: An overview. Adv. Water Resour. 2014, 71, 209–218. [Google Scholar] [CrossRef]
  9. Shi, H.; Li, T.; Wang, K.; Zhang, A.; Wang, G.; Fu, X. Physically based simulation of the streamflow decrease caused by sediment-trapping dams in the middle Yellow River. Hydrol. Process. 2016, 30, 783–794. [Google Scholar] [CrossRef] [Green Version]
  10. Ren, K.; Huang, S.; Huang, Q.; Wang, H.; Leng, G.; Cheng, L.; Li, P. A nature-based reservoir optimization model for resolving the conflict in human water demand and riverine ecosystem protection. J. Clean. Prod. 2019, 231, 406–418. [Google Scholar] [CrossRef]
  11. Foley, J.A.; DeFries, R.; Asner, G.P.; Barford, C.; Bonan, G.; Carpenter, S.R.; Helkowski, J.H. Global consequences of land use. Science 2005, 309, 570–574. [Google Scholar] [CrossRef] [PubMed] [Green Version]
  12. Cruise, J.F.; Laymon, C.A.; Al-Hamdan, O.Z. Impact of 20 Years of Land-Cover Change on the Hydrology of Streams in the Southeastern United States 1. JAWRA J. Am. Water Resour. Assoc. 2010, 46, 1159–1170. [Google Scholar] [CrossRef]
  13. Zheng, J.; Yu, X.; Deng, W.; Wang, H.; Wang, Y. Sensitivity of land-use change to streamflow in Chaobai river basin. J. Hydrol. Eng. 2013, 18, 457–464. [Google Scholar] [CrossRef]
  14. Sterling, S.M.; Ducharne, A.; Polcher, J. The impact of global land-cover change on the terrestrial water cycle. Nat. Clim. Chang. 2013, 3, 385–390. [Google Scholar] [CrossRef]
  15. Jiang, C.; Li, D.; Gao, Y.; Liu, W.; Zhang, L. Impact of climate variability and anthropogenic activity on streamflow in the Three Rivers Headwater Region, Tibetan Plateau, China. Theor. Appl. Climatol. 2017, 129, 667–681. [Google Scholar] [CrossRef]
  16. Wang, T.; Yang, H.; Yang, D.; Qin, Y.; Wang, Y. Quantifying the streamflow response to frozen ground degradation in the source region of the Yellow River within the Budyko framework. J. Hydrol. 2018, 558, 301–313. [Google Scholar] [CrossRef]
  17. Wang, Y.Q.; Yuan, Z.; Xu, J.J.; Yan, B.; Hong, X.F. Research on the attribution identification of source runoff variation in the Yellow River Source Region based on water and energy balance model. In IOP Conference Series: Earth and Environmental Science; IOP Publishing: Bristol, UK, 2019; Volume 344, p. 012122. [Google Scholar]
  18. Zhang, C.; Liu, C.; Wang, G.; Jin, J.; Guan, X. Attribution of Runoff Variation for the Yellow River Source Region Based on the Budyko Hypothesis. China Rural Water Hydropower 2020, 42, 90–94. (In Chinese) [Google Scholar]
  19. Yan, D.; Lai, Z.; Ji, G. Using Budyko-Type Equations for Separating the Impacts of Climate and Vegetation Change on Runoff in the Source Area of the Yellow River. Water 2020, 12, 3418. [Google Scholar] [CrossRef]
  20. Donohue, R.J.; Roderick, M.L.; McVicara, T.R. Can dynamic vegetation information improve the accuracy of Budyko’s hydrological model? J. Hydrol. 2010, 390, 23–34. [Google Scholar] [CrossRef]
  21. Caracciolo, D.; Pumo, D.; Viola, F. Budyko’s based method for annual runoff characterization across different climatic areas: An application to United States. Water Resour. Manag. 2018, 32, 3189–3202. [Google Scholar] [CrossRef]
  22. Shang, F.; Wang, K.; Huang, Y.; Wei, J. Variation Characteristics of Runoff and the Quantitative Separation Based on Budyko Hypothesis in the Three-River Headwaters Region. J. Tongji Univ. 2020, 48, 305–316. (In Chinese) [Google Scholar]
  23. Zhang, X.; Dong, Q.; Cheng, L.; Xia, J. A Budyko-based framework for quantifying the impacts of aridity index and other factors on annual runoff. J. Hydrol. 2019, 579, 124224. [Google Scholar] [CrossRef]
  24. Wu, J.; Miao, C.; Wang, Y.; Duan, Q.; Zhang, X. Contribution analysis of the long-term changes in seasonal runoff on the Loess Plateau, China, using eight Budyko-based methods. J. Hydrol. 2017, 545, 263–275. [Google Scholar] [CrossRef]
  25. Xu, X.; Yang, D.; Yang, H.; Lei, H. Attribution analysis based on the Budyko hypothesis for detecting the dominant cause of runoff decline in Haihe basin. J. Hydrol. 2014, 510, 530–540. [Google Scholar] [CrossRef]
  26. Zhang, D.; Cong, Z.; Ni, G.; Yang, D.; Hu, S. Effects of snow ratio on annual runoff within the Budyko framework. Hydrol. Earth Syst. Sci. 2015, 19, 1977. [Google Scholar] [CrossRef] [Green Version]
  27. Ehsan Bhuiyan, M.A.; Nikolopoulos, E.I.; Anagnostou, E.N.; Polcher, J.; Albergel, C.; Dutra, E.; Fink, G.; Martínez-De La Torre, A.; Munier, S. Assessment of precipitation error propagation in multi-model global water resource reanalysis. Hydrol. Earth Syst. Sci. 2019, 23, 1973–1994. [Google Scholar] [CrossRef] [Green Version]
  28. Gelati, E.; Decharme, B.; Calvet, J.-C.; Minvielle, M.; Polcher, J.; Fairbairn, D.; Weedon, G.P. Hydrological assessment of atmospheric forcing uncertainty in the Euro-Mediterranean area using a land surface model. Hydrol. Earth Syst. Sci. 2018, 22, 2091–2115. [Google Scholar] [CrossRef] [Green Version]
  29. Jaiswal, R.K.; Sohrat, A.; Birendra, B. Comparative evaluation of conceptual and physical rainfall–runoff models. Appl. Water Sci. 2020, 10, 1–14. [Google Scholar] [CrossRef] [Green Version]
  30. Li, Z.; Liu, W.; Zhang, X.; Zheng, F. Impacts of land use change and climate variability on hydrology in an agricultural catchment on the Loess Plateau of China. J. Hydrol. 2009, 377, 35–42. [Google Scholar] [CrossRef]
  31. Mango, L.M.; Melesse, A.M.; McClain, M.E.; Gann, D.; Setegn, S. Land use and climate change impacts on the hydrology of the upper Mara River Basin, Kenya: Results of a modeling study to support better resource management. Hydrol. Earth Syst. Sci. 2011, 15, 2245. [Google Scholar] [CrossRef] [Green Version]
  32. Wang, G.; Xia, J.; Chen, J. Quantification of effects of climate variations and human activities on runoff by a monthly water balance model: A case study of the Chaobai River basin in northern China. Water Resour. Res. 2009, 45, W00A11. [Google Scholar] [CrossRef] [Green Version]
  33. Ma, H.; Yang, D.; Tan, S.; Gao, B.; Hua, Q. Impact of climate variability and human activity on streamflow decrease in the Miyun Reservoir catchment. J. Hydrol. 2010, 389, 317–324. [Google Scholar] [CrossRef]
  34. Qi, S.; Sun, G.; Wang, Y.; Mcnulty, S.; Moore, M. Streamflow response to climate and land use changes in a coastal watershed in North Carolina. Trans. ASABE 2009, 52, 739–749. [Google Scholar] [CrossRef] [Green Version]
  35. Thomas, H.A. Improved Methods for National Water Assessment; Report WR15249270; USGS Unnumbered Series; US Water Resource Council: Washington, DC, USA, 1981.
  36. Xu, X.; Yang, H.; Yang, D.; Ma, H. Assessing the impacts of climate variability and human activities on annual runoff in the Luan River basin, China. Hydrol. Res. 2013, 44, 940–952. [Google Scholar] [CrossRef] [Green Version]
  37. Liu, X.; Dai, X.; Zhong, Y.; Li, J.; Wang, P. Analysis of changes in the relationship between precipitation and streamflow in the Yiluo River, China. Theor. Appl. Climatol. 2013, 114, 183–191. [Google Scholar] [CrossRef]
  38. Ji, G.; Lai, Z.; Xia, H.; Liu, H.; Wang, Z. Future Runoff Variation and Flood Disaster Prediction of the Yellow River Basin Based on CA-Markov and SWAT. Land 2021, 10, 421. [Google Scholar] [CrossRef]
  39. Ahn, K.H.; Merwade, V. Quantifying the relative impact of climate and human activities on streamflow. J. Hydrol. 2014, 515, 257–266. [Google Scholar] [CrossRef]
  40. Nie, N.; Zhang, W.; Liu, M.; Chen, H.; Zhao, D. Separating the impacts of climate variability, land-use change and large reservoir operations on streamflow in the Yangtze River basin, China, using a hydrological modeling approach. Int. J. Dig. Earth 2021, 14, 231–249. [Google Scholar] [CrossRef]
  41. Bao, Z.; Zhang, J.; Wang, G.; Fu, G.; He, R.; Yan, X.; Zhang, A. Attribution for decreasing streamflow of the Haihe River basin, northern China: Climate variability or human activities? J. Hydrol. 2012, 460, 117–129. [Google Scholar] [CrossRef]
  42. Griffen, J. A Continuous Hydrologic Model Structure for Application at Multiple Time Scales. Master’s Thesis, University of Central Florida, Orlando, FL, USA, 2012. [Google Scholar]
  43. Walker, J.D. Web Applications for Interactive Environmental Modeling. Ph.D. Thesis, Tufts University, Medford, MA, USA, 2014. [Google Scholar]
  44. Wang, X.; Gao, B.; Wang, X. A Modified ABCD Model with Temperature-Dependent Parameters for Cold Regions: Application to Reconstruct the Changing Runoff in the Headwater Catchment of the Golmud River, China. Water 2020, 12, 1812. [Google Scholar] [CrossRef]
  45. Martinez, G.F.; Gupta, H.V. Toward improved identification of hydrological models: A diagnostic evaluation of the “abcd” monthly water balance model for the conterminous United States. Water Resour. Res. 2010, 46, W08507. [Google Scholar] [CrossRef]
  46. Gong, L.; Jin, C. Fuzzy Comprehensive Evaluation for Carrying Capacity of Regional Water Resources. Water Resour. Manag. 2009, 23, 2505–2513. [Google Scholar] [CrossRef]
  47. He, B.; Miao, C.; Shi, W. Trend, abrupt change, and periodicity of streamflow in the mainstream of Yellow River. Environ. Monit. Assess. 2013, 185, 6187–6199. [Google Scholar] [CrossRef] [PubMed]
  48. Yan, X.; Bao, Z.; Zhang, J.; Wang, G.; He, R.; Liu, C. Quantifying contributions of climate change and local human activities to runoff decline in the upper reaches of the Luanhe River basin. J. Hydro Environ. Res. 2020, 28, 67–74. [Google Scholar] [CrossRef]
  49. Zeng, Z.; Liu, J.; Savenije, H.H. A simple approach to assess water scarcity integrating water quantity and quality. Ecol. Indic. 2013, 34, 441–449. [Google Scholar] [CrossRef]
  50. Huang, Q.; Kong, B.; Fan, J. Hydrological Elements Comprehensive Detecting Variation. Yellow River 2016, 38, 18–23. (In Chinese) [Google Scholar]
  51. Wang, S.; Wang, Y.; Ran, L.; Su, T. Climatic and anthropogenic impacts on runoff changes in the Songhua River basin over the last 56 years (1955–2010), Northeastern China. Catena 2015, 127, 258–269. [Google Scholar] [CrossRef]
  52. Chen, X.; Alimohammadi, N.; Wang, D. Modeling interannual variability of seasonal evaporation and storage change based on the extended Budyko framework. Water Resour. Res. 2013, 49, 6067–6078. [Google Scholar] [CrossRef] [Green Version]
  53. Wang, D.; Hejazi, M. Quantifying the relative contribution of the climate and direct human impacts on mean annual streamflow in the contiguous United States. Water Resour. Res. 2011, 47, 411. [Google Scholar] [CrossRef] [Green Version]
  54. Sun, Y.; Tian, F.; Yang, L.; Hu, H. Exploring the spatial variability of contributions from climate variation and change in catchment properties to streamflow decrease in a mesoscale basin by three different methods. J. Hydrol. 2014, 508, 170–180. [Google Scholar] [CrossRef]
  55. Jiang, C.; Xiong, L.; Wang, D.; Liu, P.; Guo, S.; Xu, C.Y. Separating the impacts of climate change and human activities on runoff using the Budyko-type equations with time-varying parameters. J. Hydrol. 2015, 522, 326–338. [Google Scholar] [CrossRef]
  56. Li, Z.; Huang, S.; Liu, D.; Leng, G.; Zhou, S.; Huang, Q. Assessing the effects of climate change and human activities on runoff variations from a seasonal perspective. Stoch. Environ. Res. Risk Assess. 2020, 34, 575–592. [Google Scholar] [CrossRef]
  57. Xin, Z.; Li, Y.; Zhang, L.; Ding, W.; Ye, L.; Wu, J.; Zhang, C. Quantifying the relative contribution of climate and human impacts on seasonal streamflow. J. Hydrol. 2019, 574, 936–945. [Google Scholar] [CrossRef]
Figure 1. Location of hydrological and weather stations in and around the SRYR.
Land 10 00542 g001
Figure 2. Curve of possible evapotranspiration and effective water quantity in the “ABCD” model.
Land 10 00542 g002
Figure 3. Schematic of the decomposition method for quantifying the climatic and anthropic factors on runoff.
Land 10 00542 g003
Figure 4. Result of Mann–Kendall mutation analysis in the Tangnaihai station from 1967–2016.
Land 10 00542 g004
Figure 5. Result of cumulative anomaly mutation analysis in the Tangnaihai station from 1967–2016.
Land 10 00542 g005
Figure 6. Monthly runoff simulation results in the pre-change period using the monthly ABCD model.
Land 10 00542 g006
Figure 7. Monthly runoff simulation results in the post-change period using the monthly ABCD model.
Land 10 00542 g007
Figure 8. Parameter fitting results of the Budyko curve in spring (a), summer (b), autumn (c), and winter (d).
Land 10 00542 g008
Table 1. The basic information of the five global climate models.
DataTemporal ResolutionData RangesData Sources
RunoffMonth1967–2016Yellow River Water Conservancy Commission (http://yrcc.gov.cn/ (accessed on 1 January 2021))
Weather stations’ dataDay1967–2016China Meteorological Administration (http://www.cma.gov.cn (accessed on 1 January 2021))
Table 2. Monthly runoff simulation results in the pre-change period using the monthly ABCD model.
Hydrological StationabcdCalibration Period
(1967.1–1978.6)
Validation Period
(1978.7–1989.12)
NSRMSERE (%)NSRMSERE (%)
Tangnaihai0.8499349.99970.24110.42770.805.11−3.620.825.843.37
Table 3. Monthly runoff simulation results in the post-change period using the monthly ABCD model.
Hydrological StationabcdCalibration Period
(1990.1–2003.6)
Validation Period
(2003.7–2016.12)
NSRMSERE (%)NSRMSERE (%)
Tangnaihai0.9293.41110.24420.45690.793.760.310.804.59−1.65
Table 4. The eigenvalues of different climatic and hydrological variables.
SeasonP1P2ΔPE1E2ΔER1R2ΔRΔS1ΔS2Δ(ΔS)
Spring97.9199.871.9666.7075.398.6927.3223.2−4.123.891.28−2.61
Summer284.37279.51−4.86139.92155.4415.5178.2366.05−12.1866.2158.02−8.19
Autumn116.29112.38−3.9168.7076.718.01 65.9647.06−18.9−18.37−11.396.98
Winter11.3813.311.9324.6528.003.34 12.8611.81−1.05−26.13−26.49−0.36
Table 5. The attribute analysis of seasonal runoff change in SRYR.
SeasonRCRH η R c   ( % ) η R h   ( % )
Spring−1.22−2.9029.7270.28
Summer−6.06−6.1249.7550.25
Autumn−15.01−3.8879.4520.55
Winter−0.43−0.6240.8959.11
Publisher’s Note: MDPI stays neutral with regard to jurisdictional claims in published maps and institutional affiliations.

