Article

Differences in the Efficiency of the Vertical Transfer of Windblown Sediment over Different Ploughed Surfaces during Wind Erosion Events

by
Mohamed Taieb Labiadh
1,*,
Gilles Bergametti
2,
Jean Louis Rajot
2,3,
Christel Bouet
2,3,
Mohsen Ltifi
1,
Saâd Sekrafi
1 and
Thierry Henry des Tureaux
3
1
Institut des Régions Arides (IRA), El Fjé, Medenine 4119, Tunisia
2
LISA, Université de Paris and Univ Paris Est Creteil, CNRS, F-75013 Paris, France
3
Institut d’Ecologie et des Sciences de l’Environnement de Paris, UMR IRD 242, Université Paris Est Créteil–Sorbonne Université–CNRS–INRAE–Université de Paris, F-93143 Bondy, France
*
Author to whom correspondence should be addressed.
Land 2021, 10(5), 511; https://doi.org/10.3390/land10050511
Submission received: 26 March 2021 / Revised: 6 May 2021 / Accepted: 7 May 2021 / Published: 11 May 2021
(This article belongs to the Special Issue Soil Erosion and Desertification)

Abstract

:
Airborne sediment fluxes were measured in southern Tunisia on two experimental plots tilled with a moldboard and a tiller plough, respectively, during five wind erosion events of different intensities. The sediment fluxes were sampled on both plots using a mast equipped with seven sand traps positioned between ≈10 and 120 cm height. The windblown sediment fluxes in the 0–100 cm layer were about eight times higher on the plot tilled using the tiller plough compared to the plot tilled using the moldboard plough due to different efficiencies in the trapping of the saltating particles in the furrow, depending on the ridges characteristics. On both plots, sediment fluxes of larger particles were depleted in the sediment samplers compared to the proportions measured in the soil from which they were derived. When examining the sediment flux in the 30–100 cm layer, we observed that the efficiency of the vertical transfer was about twice higher on the moldboard plot than on the tiller one. This implies that a higher fraction of the sediment mobilized by wind can be transported over long distances in the case of a surface ploughed with a moldboard. This result could reduce in part the benefit of using the moldboard instead of the tiller plough regarding soil loss by wind erosion.

1. Introduction

Wind erosion is a common cause of land degradation in the arid and semi-arid regions of the Earth, e.g., [1]. Significant wind erosion events occur when wind of high intensity blows over low covered light-textured soils, e.g., [2,3]. Over agricultural soils of drylands, wind erosion is a major process affecting soil fertility by loss of the fine soil grains that are rich in nutrients and organic matter, e.g., [4,5,6], and that can be transported over long distances, e.g., [7]. This phenomenon can lead to a significant decrease in crop yield, e.g., [8,9,10,11] and in lowering the water-holding capacity of the soil in regions where wind erosion is a recurring problem [12].
Wind erosion control is an important issue, especially for cultivated soils, and it has been widely studied for many decades, e.g., [9,13,14,15]. Principles for controlling wind erosion include: stabilizing surface with various materials, producing a rough cloddy surface, reducing field width or the distance wind travels across an unprotected field with barriers and strip crops, and establishing and maintaining sufficient vegetative cover [16]. Following these principles, the techniques developed to control wind erosion are frequently classified into three categories [14]: (a) crop management practices (such as cropping system, e.g., [17], mulching, e.g., [18], or crop residues management, e.g., [19]), (b) mechanical tillage operations, e.g., [20], and (c) vegetative barriers (such as windbreaks, e.g., [21]). All of these methods aim to decrease wind speed at the soil surface by increasing surface roughness and/or increasing the threshold wind speed that is required to initiate soil aggregate movement by wind [14].
Among these techniques, it has been clearly shown that for loose soils, tillage, which is an essential part of farming, efficiently decreases soil erosion by wind compared to the same loose and flat surface, e.g., [22,23,24]. Indeed, tilled surfaces present ridges that allow the trapping of a part of the saltating particles into the furrow of the ridges, which reduces the saltation of soil grains and consequently decreases the sediment flux blowing over tilled surfaces. Thus, this decrease of the wind erosion efficiency over different tilled surfaces is dependent on the geometric characteristics of the tillage ridges, i.e., ridge height (RH) and ridge spacing (RS), e.g., [24,25,26,27,28]. As an example, Armbrust et al. [25] showed that any size ridge up to 20.3 cm height on a cultivated soil is more effective in controlling wind erosion than is a smooth surface. Kardous et al. [24] measured wind erosion fluxes in a wind tunnel over eight different ridged surfaces constituted by sandy soils of southern Tunisia. These authors showed that the intensity of the sediment flux mainly depended on the ridge height to ridge spacing ratio. This strongly suggests that the way by which an agricultural surface is tilled has a significant impact on the sediment flux mobilized by wind erosion. In the field, this was for instance confirmed by López et al. [26]: during the experiment they conducted in Central Aragón (NE Spain), these authors showed that soil surface conditions after tillage could indicate a lower susceptibility of soil to wind erosion following chisel ploughing than moldboard ploughing. In the same way, Labiadh et al. [27] showed that the difference in the sediment flux was about a factor 4 between agricultural surfaces tilled with a disc plough and a tiller plough and was of an order of magnitude between surfaces tilled with a disc plough and a moldboard plough. More recently, the impact of tillage practices on dust emission was also evidenced by Çarman et al. [28] using a portable wind erosion tunnel in an experimental field in Turkey. Eight different tillage applications were tested: conventional tillage, six different reduced tillages, and direct seeding. Their results showed that wind erosion rate was lower in direct seeding than in conventional and reduced tillage applications with the rate measured using the horizontal shaft rototiller (L-typefoot)-float being the highest as this technique induced an excess fragmentation of soil.
However, wind erosion is very selective in terms of grain size, carrying the finest particles—particularly organic matter, clay, and silt—many kilometers away while most of the larger particles are deposited close to the sediment source [29,30]. Thus, it is of the highest interest to examine not only how the different types of tillage ridges can limit wind erosion but also how the different size fractions constituting the sediment material mobilized by wind are vertically distributed. Earlier investigations showed that the mean grain size of suspended sediment decreased with height [12,31,32,33]. Nickling [32] described the Particle-Size Distribution (PSD) of the soil, creep, saltation, and suspended fractions to show how both the mean grain size and mass of sediment decrease as a power function with height. However, based on wind tunnel measurements, Dong and Qian [34] showed that this decay with height differed for different size populations and wind speeds, the flux decreasing more rapidly as the grain size and the wind speed decreased.
As mentioned by Sharratt et al. [35], few studies have measured the windblown loss of top soil or flux of dust from agricultural lands managed under different tillage systems. Hagen et al. [36] mentioned that if tillage ridges on soils are effective at trapping saltation aggregates, they may not reduce erosion rates on soils composed mainly of suspension-size aggregates during high winds. This suggests that the fractions of the mass of windblown sediment in saltation, in short-term suspension or in suspension, could change depending on the type of tillage ridges. In this paper, we propose to examine, from an experiment performed in southern Tunisia, how the vertical transfer of windblown sediment of different size classes is affected by the type of tillage applied to an erodible surface and the implications for wind erosion.

2. Materials and Methods

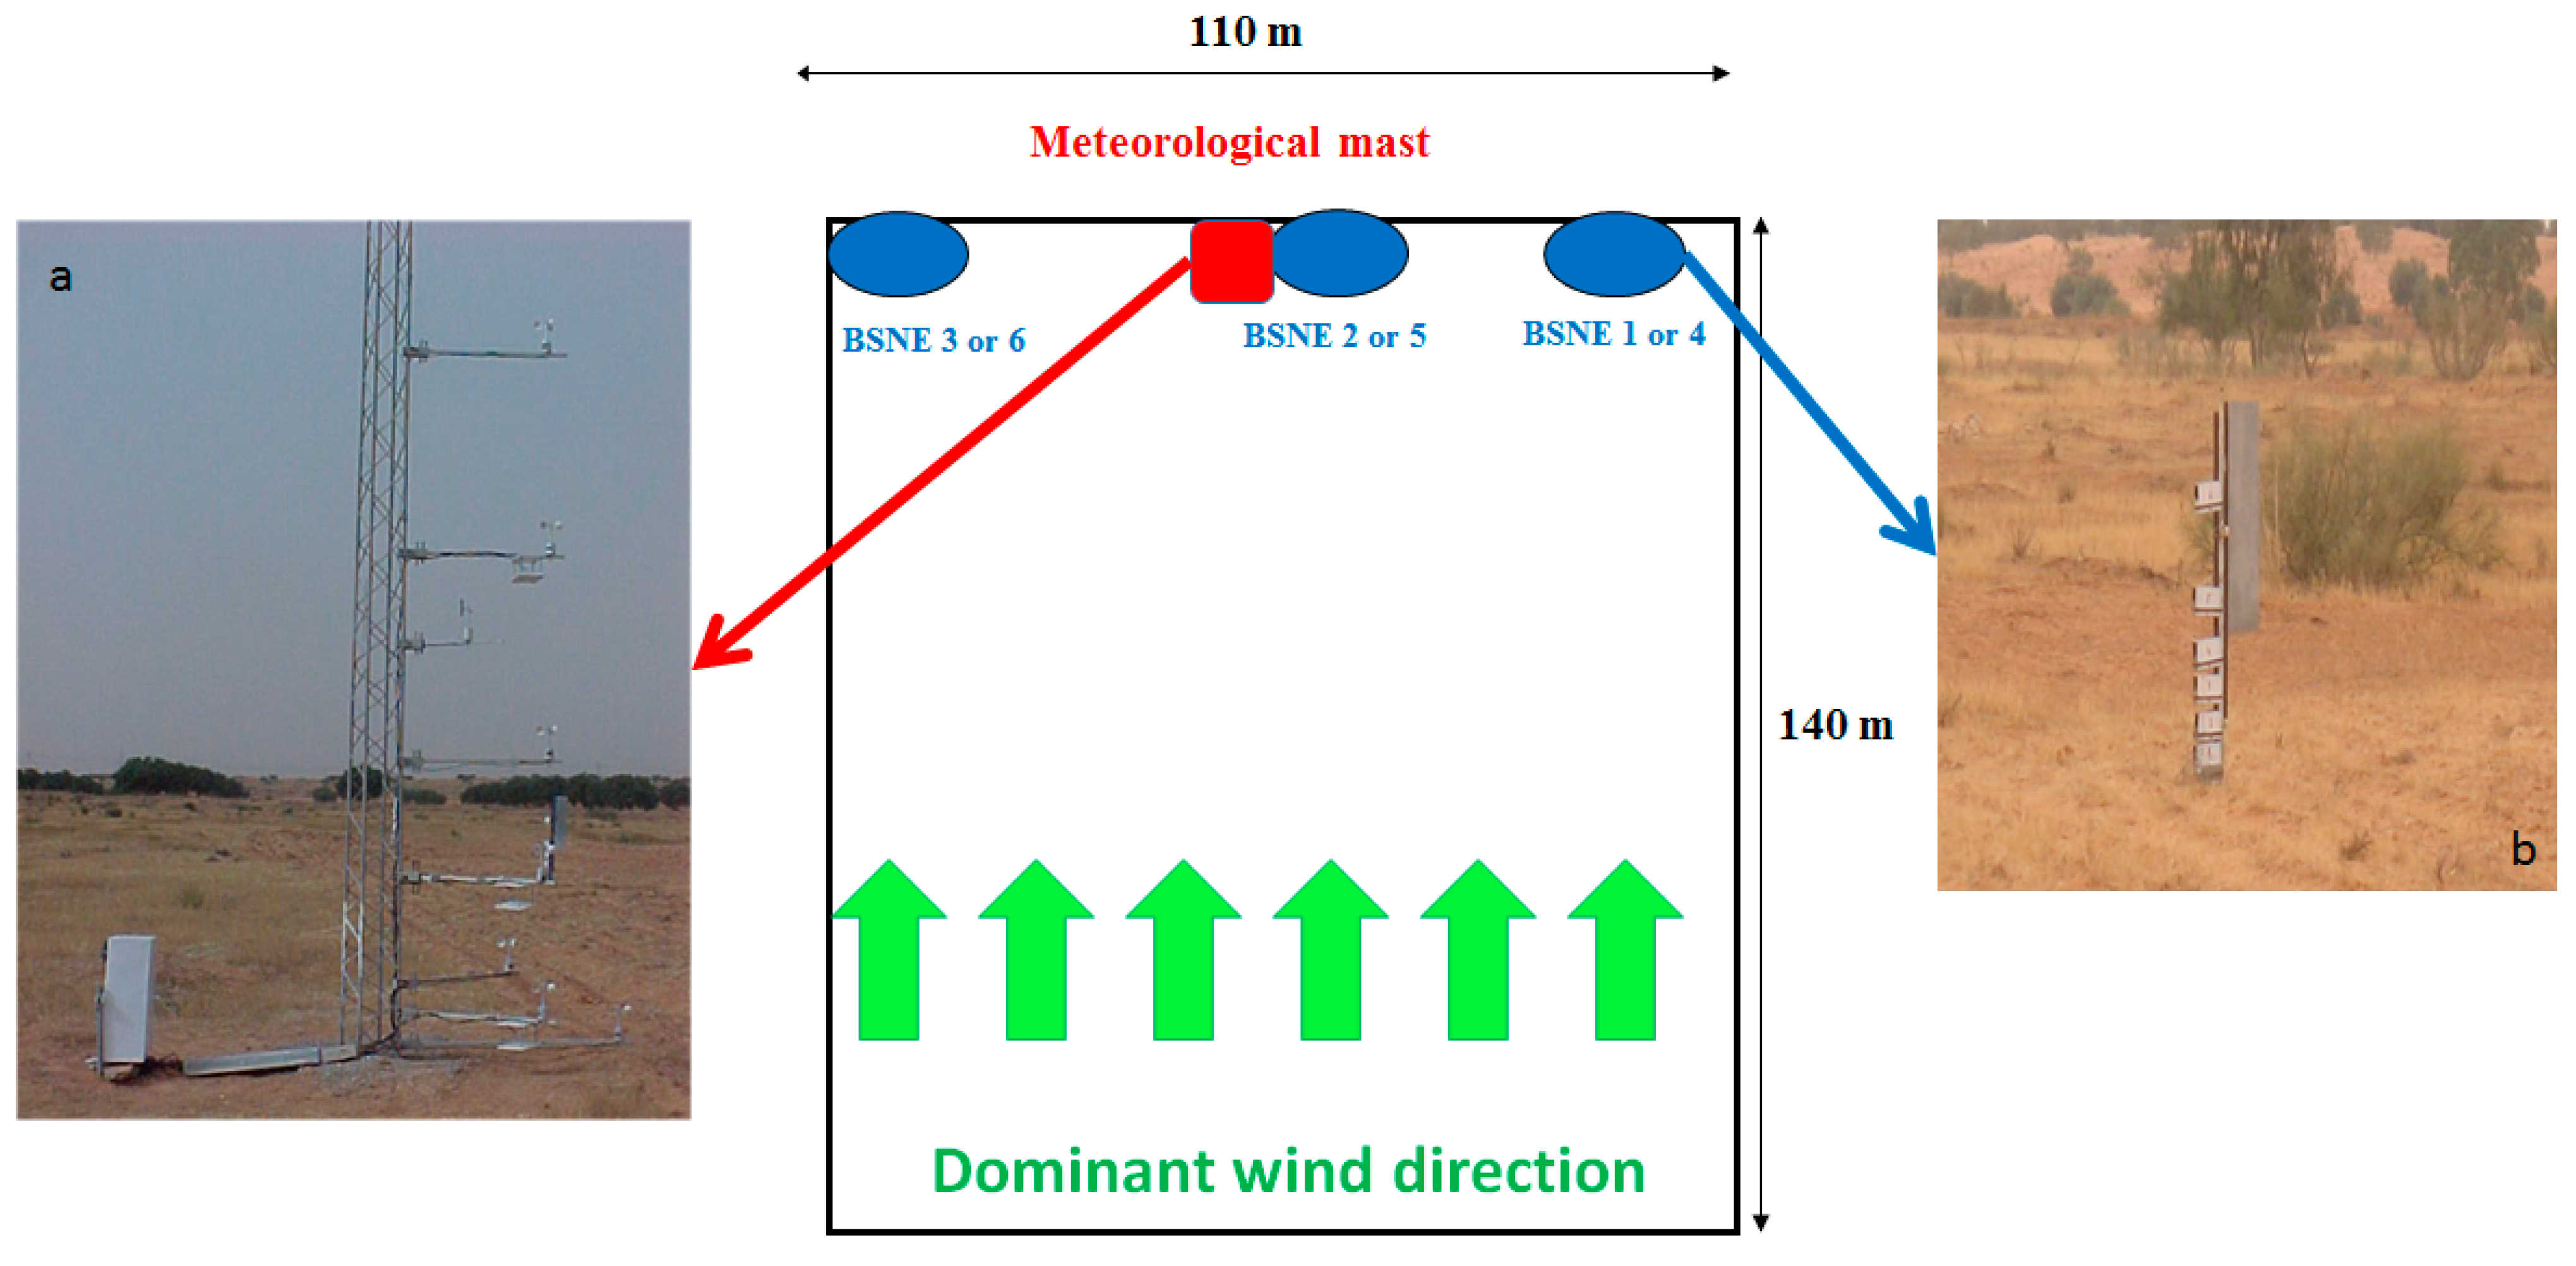
2.1. Experimental Site

During the spring season 2008, a field experiment was conducted inside the Dar Dhaoui Experimental Range (DDER) (Figure 1), which is located in the arid region of Medenine/Zarzis in South Tunisia where annual precipitation is low (≈200 mm/y) and irregular in space and time, with most precipitation falling in autumn and winter, e.g., [37]. This DDER is an area of 54 ha protected for many years from grazing and other disturbances. Thus, the surface in its natural state is crusted and well protected from wind erosion by a relatively dense vegetation cover.
Within this range, two rectangular (140 m × 110 m) plots, 400 m apart, were ploughed using two different ploughing techniques: Plot 1 was tilled using a tiller plough while a moldboard plough was used in Plot 2 (Figure 1c). The slope was 0.6% and 2% for Plot 1 and Plot 2, respectively. Tillage was performed so that the tillage ridges were perpendicular to the prevailing direction of the highest wind speed [38].

2.2. Soil Characteristics

In this region, soils are classified as isohumic subtropical truncated soil, which is poor in soil organic matter according to the French soil classification system [39]. The parent material is aeolian fine sand generally lying on a calcareous crust. They can be classified as cambic Arenosol in the classification of the International Union for Soil Sciences (IUSS) Working Group World Reference Base (WRB) for Soil Resources [40].
The soil size distribution relevant for wind erosion processes must be determined with a minimum disturbance of the aggregates, e.g., [41]. This leads researchers to avoid disruptive techniques (such as those involving wet samples) when measuring the size distribution of soils erodible by wind. Dry sieving and dry dispersion laser particle size analyzers remain the methods best suited for retrieving the size distribution of the soil aggregates with a minimum of disturbance.
Twelve composite soil surface samples (eight samples on Plot 1 and 4 samples on Plot 2) were collected. Each composite samples were composed of 10 soil samples randomly collected in ten different places on each plot. The composite soil samples were dried at 105 °C for 24 h before being passed slowly through a column of 13 sieves with meshes ranging from <50 µm to >1000 μm. The duration and intensity of the sieving, performed using a Retsch AS200 vibratory sieve shaker, were selected according to various tests performed to identify the best compromise between maximizing the accuracy of the grain size classification and minimizing the disruption of soil aggregates. Three sieving intensities (40, 50, and 60) were tested as well as six sieving durations (5, 10, 15, 20, 25, and 30 min), i.e., 18 tests were performed in total. The analysis of the results showed that the optimum conditions were obtained for 20 min of sieving with an intensity of 40 [42]. Then, each fraction was weighed on an electronic weighing scale having a precision of 0.01 g. Key statistical parameters (median diameter and standard deviation) were estimated by fitting the mass of sediment collected in each size class (i.e., in each sieve) to log-normal functions. As in Chatenet et al. [41] and Labiadh et al. [42], we assumed that the mass size distribution of an erodible soil can be assessed by the sum of log-normal functions. The computation was performed by integrating the log-normal functions over the size range 1–2500 μm using 1300 iso-logarithmic size bins. Then, these bins were summed over the size interval corresponding to each of the 13 sieve classes. The adjustment of the log-normal distributions was obtained using a least squares method, i.e., by minimizing the sum of the differences between the measured masses for each sieve and those computed for the same size classes by using the log-normal functions. For these samples, the adjustment was made by using two modes (i.e., two log-normal functions). The number of modes was selected using threshold values for the minimization test.
Table 1 shows that the soil samples exhibited two populations of similar importance: (i) one, very well sorted, with a median diameter of about 100 μm, and (ii) one having a median diameter of approximately 75 μm. This is in agreement with the numerous measurements of soil size distributions performed in southern Tunisia by Labiadh et al. [42], who showed that these soils are characterized by very fine sand populations.

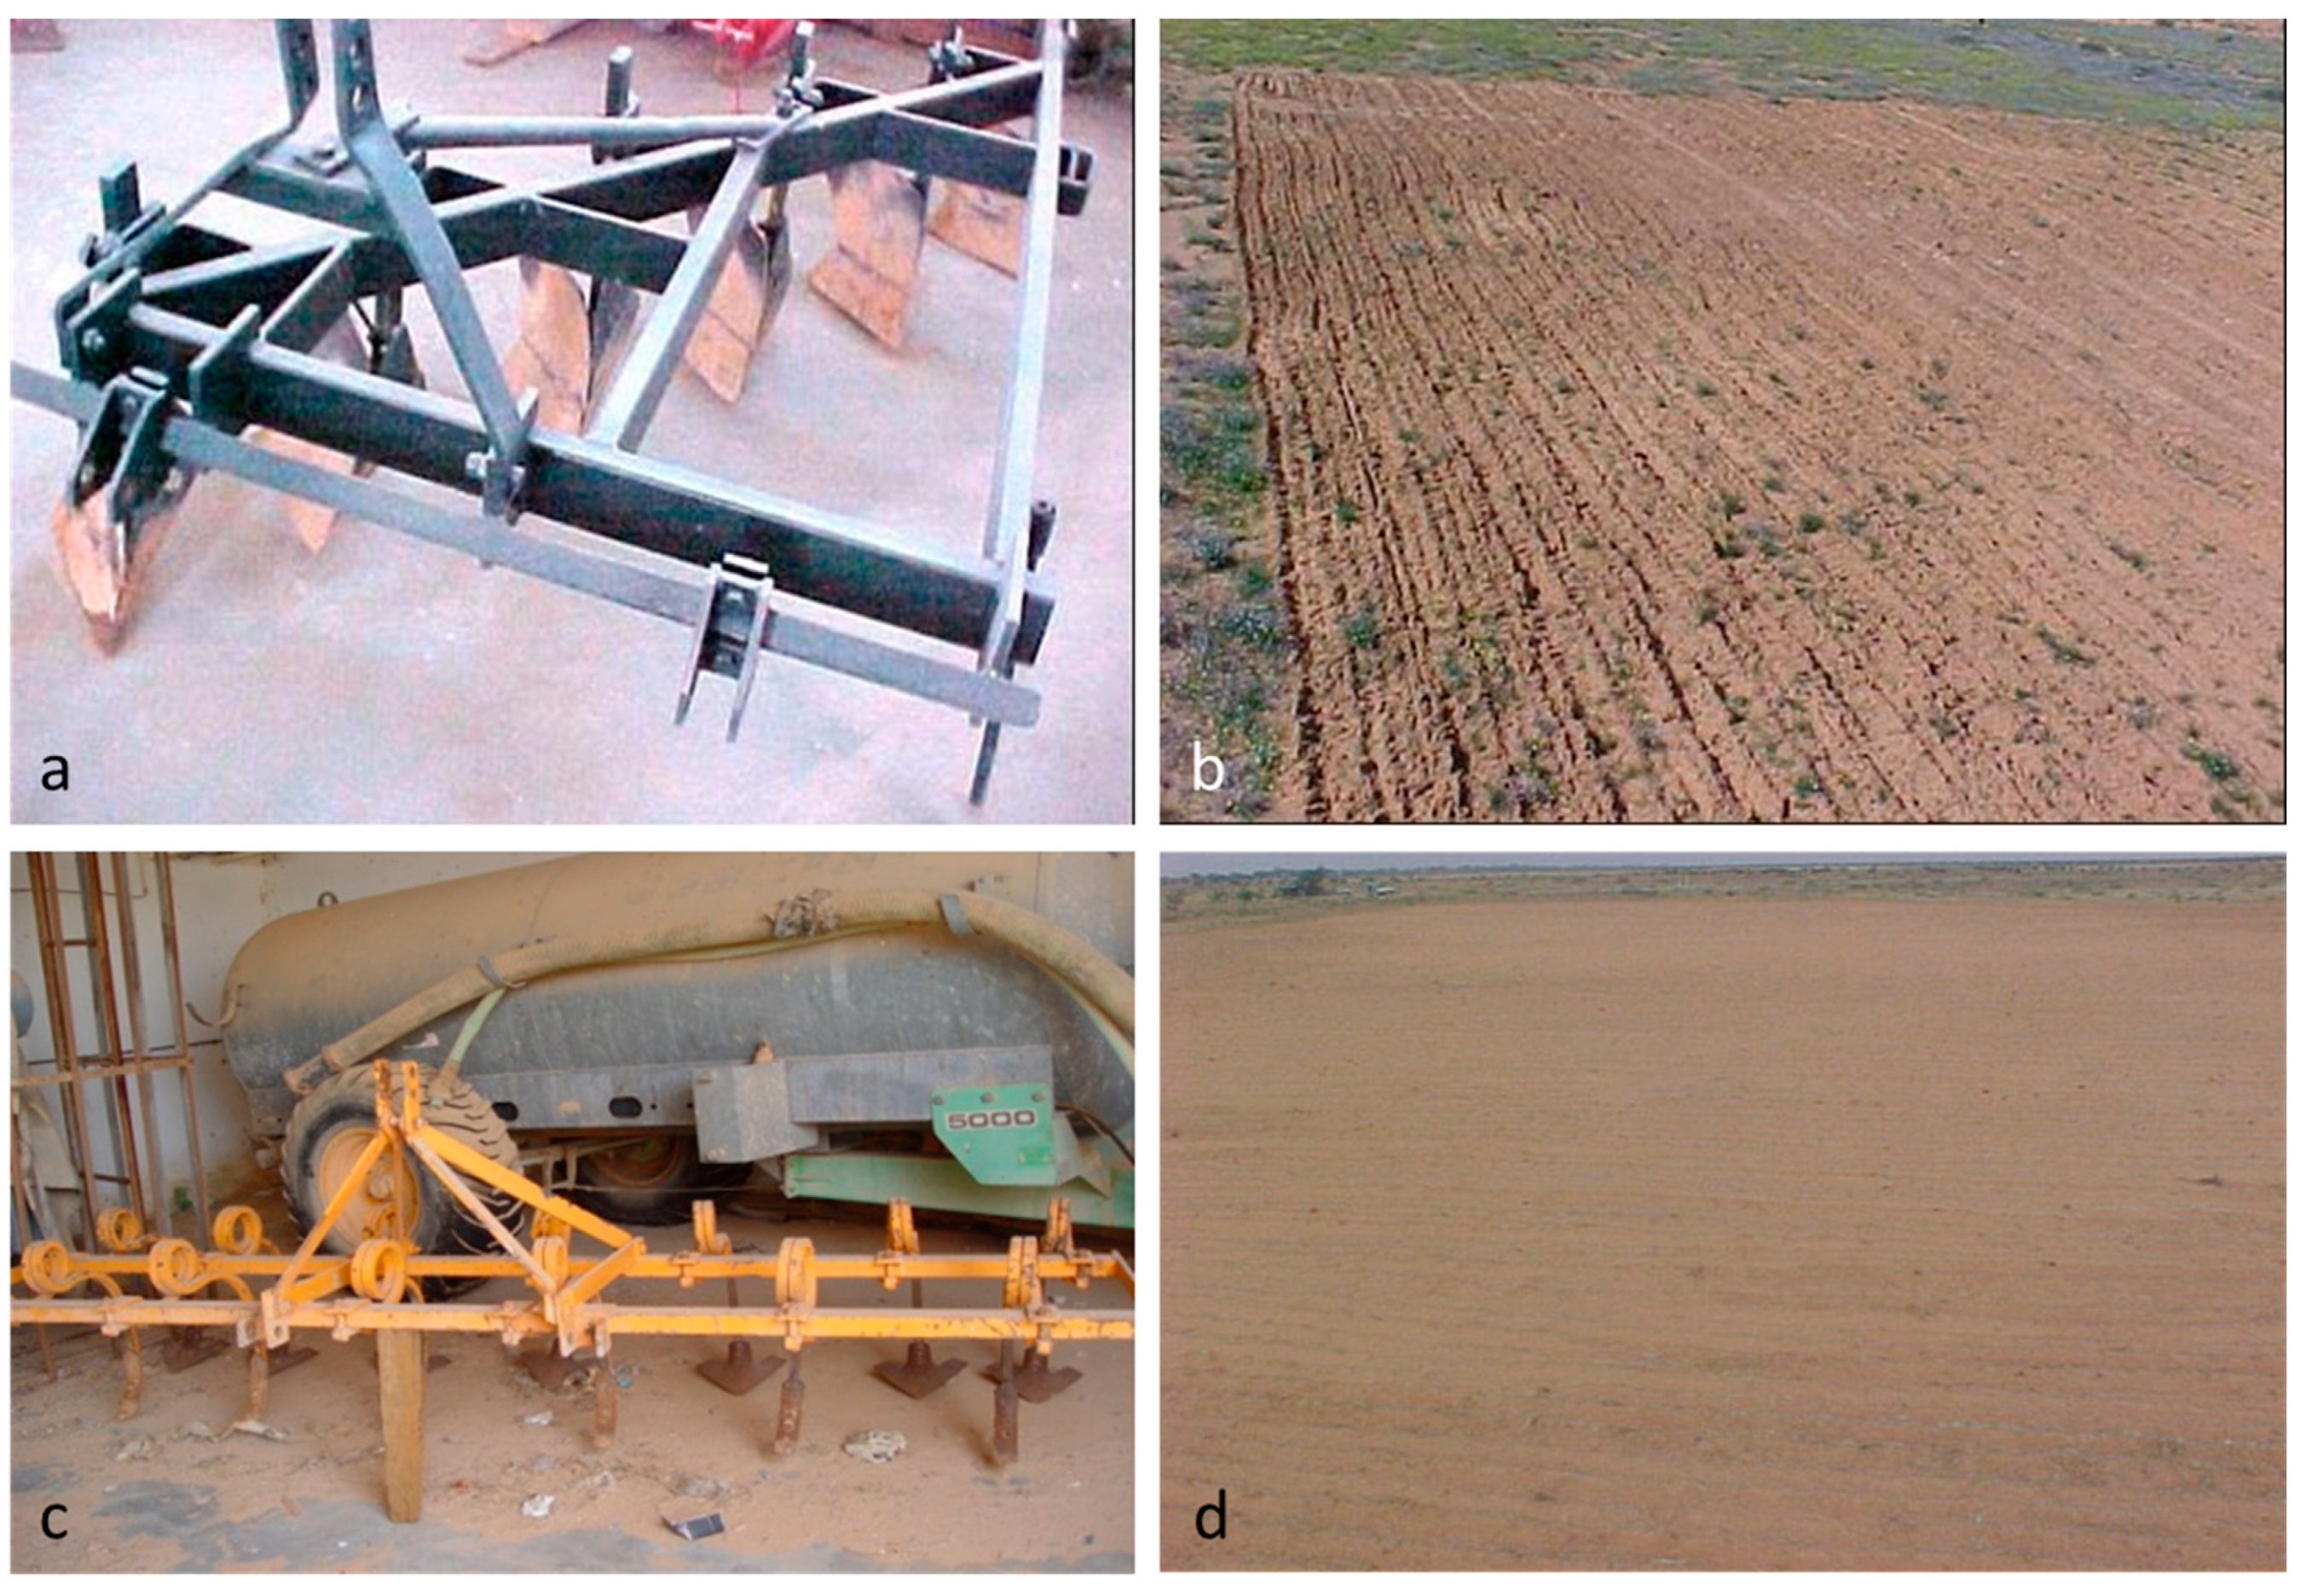
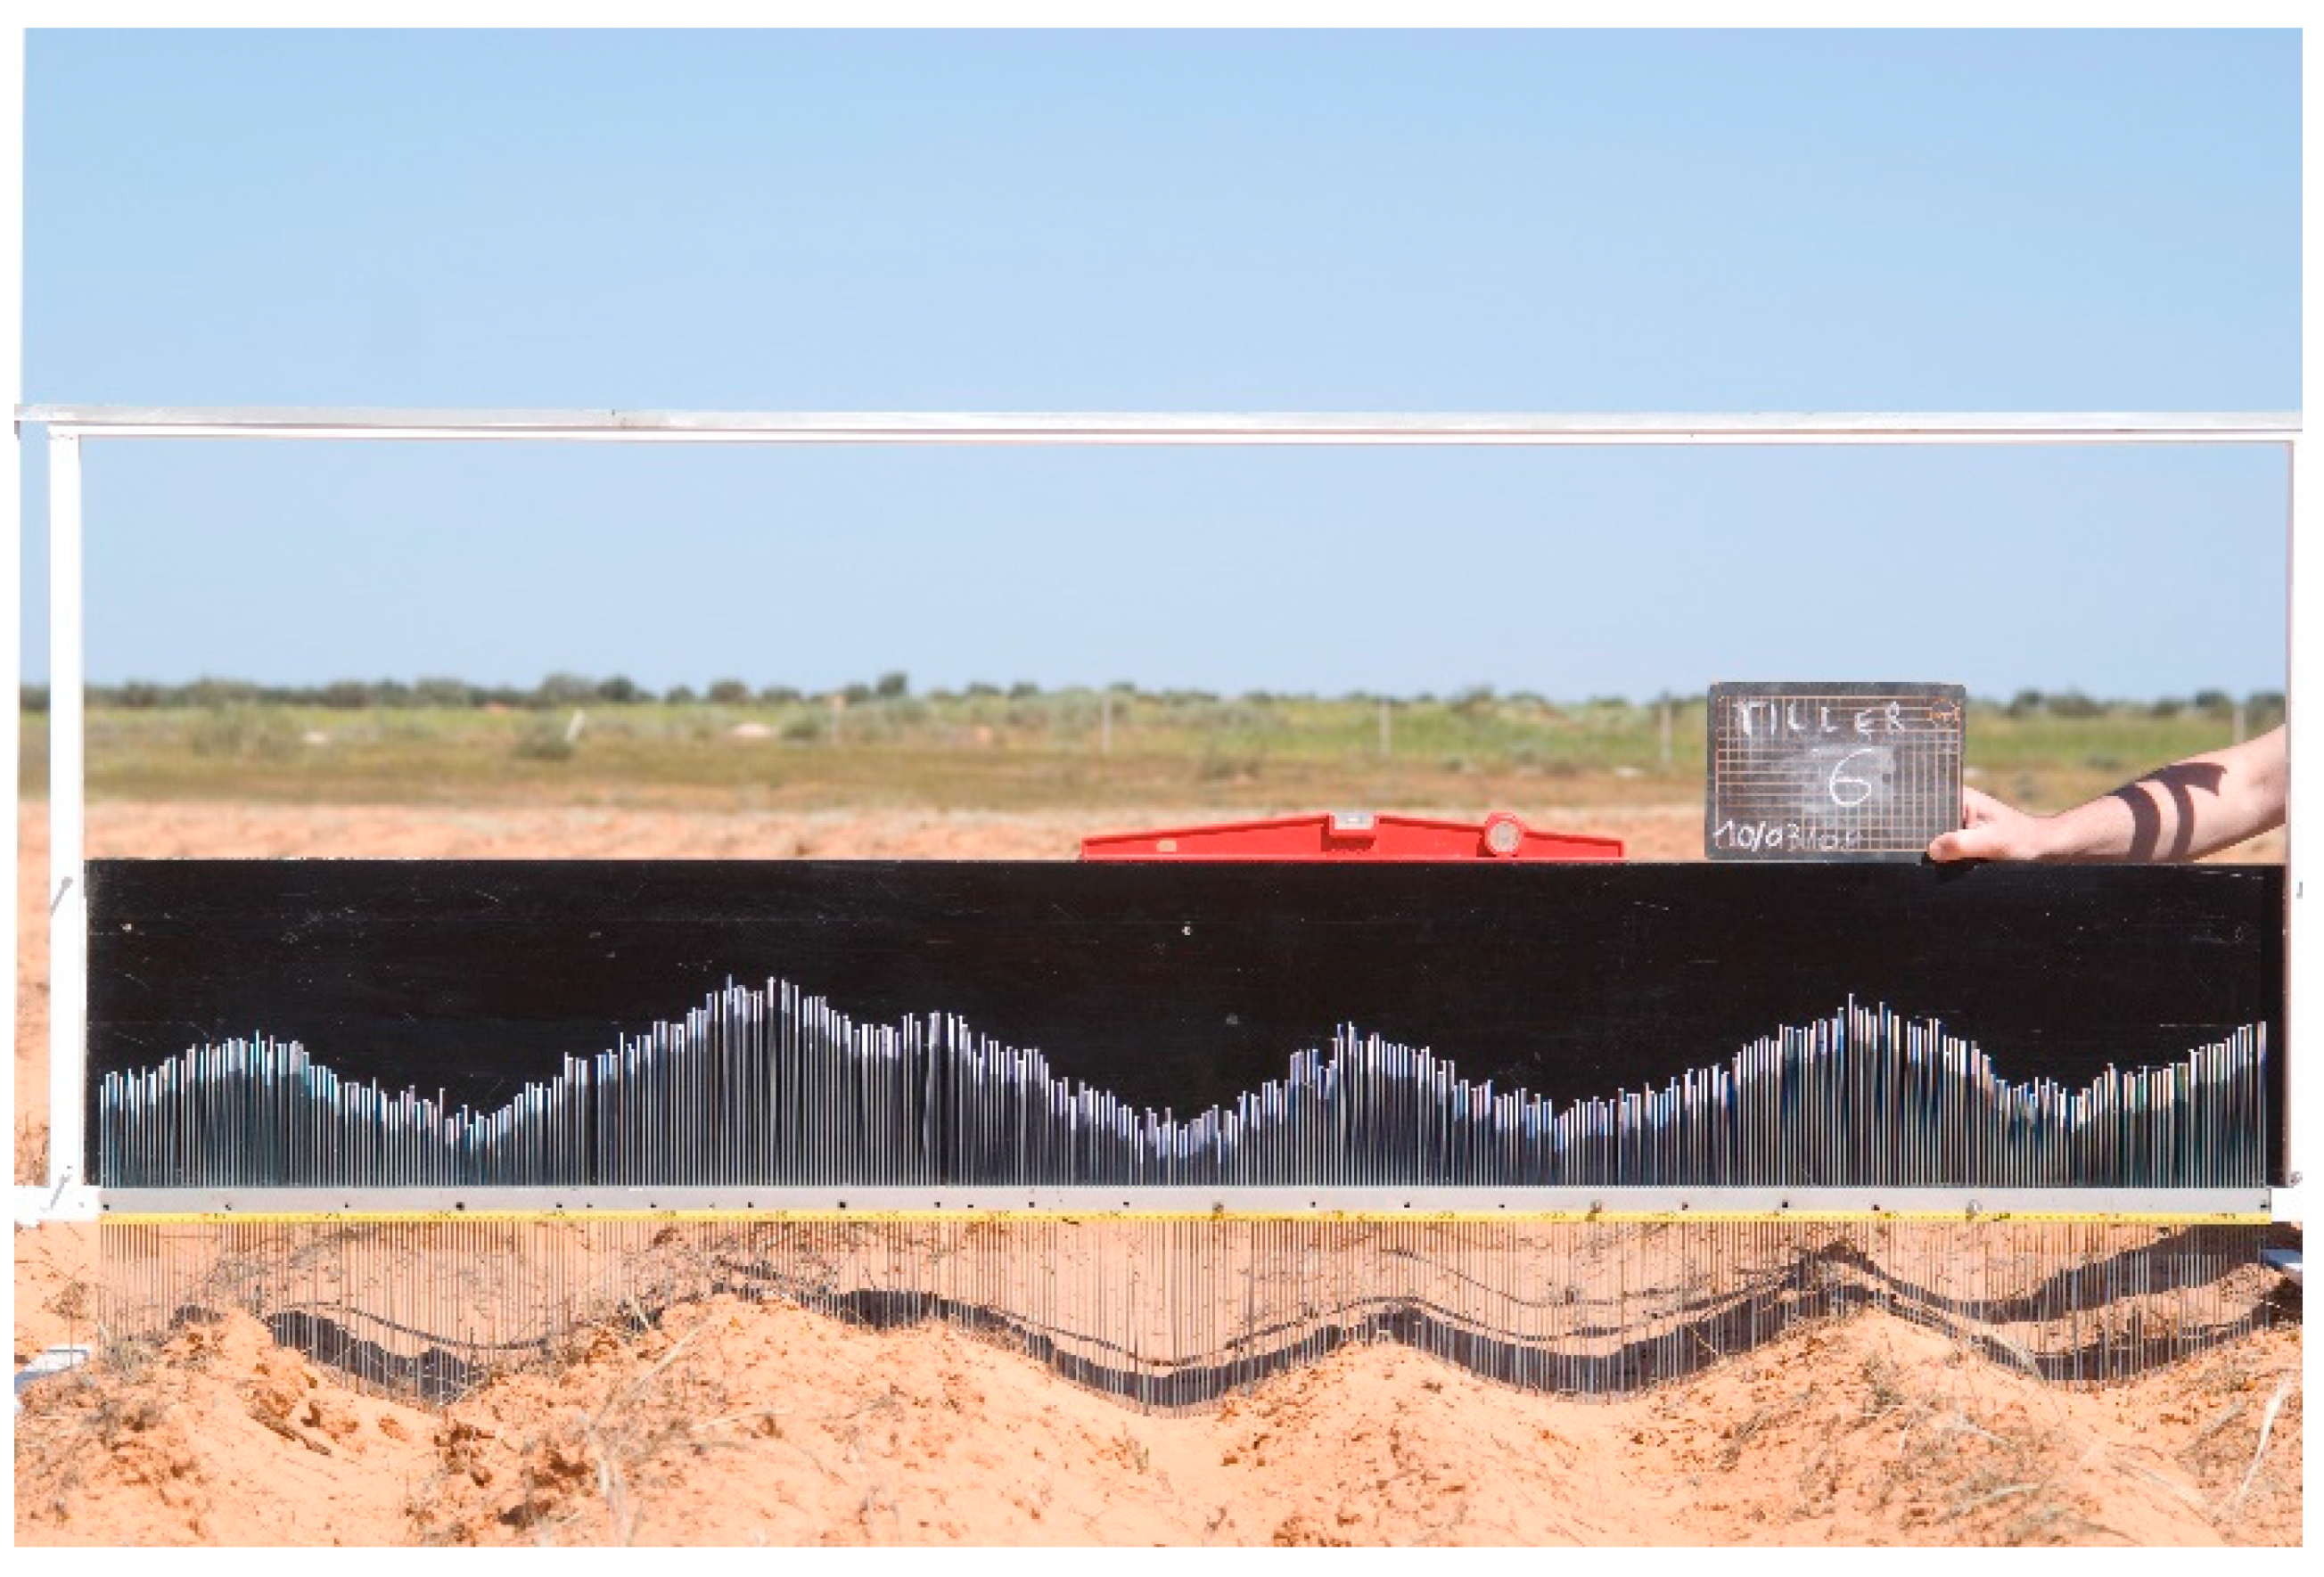
2.3. Height and Spacing of Tillage Ridges

The two plots were tilled with two different ploughing tools: a moldboard and a tiller (Figure 2). These tools are the traditional and “modern” ploughs used in southern Tunisia, respectively. Tillage was made with methods, especially tractor speed, that are those used by farmers in this region. The moldboard plough was composed of six elements (Figure 2a). The plough has a working width of 2.3 m and a depth of cut of approximately 15 cm. It slices the soil with its wedge-shaped body, lifts it with its moldboard (an inclined plane), and inverts it gently, burying weeds and crop residues. The tiller plough is more suitable in soils obstructed by stones and roots and for light and moderate soil conditions. It is used for loosening and aerating soil to a depth of approximately 20 cm. The tiller was composed of two lines of six and seven plow teeth respectively, leading to a working width of 3 m (Figure 2c).
The geometric characteristics of tillage ridges were determined using a 2-meter-long pin roughness meter composed of 400 white pins placed in front of a black background (Figure 3). Each pin measures 29 cm and is equipped with a circular cap in order to increase the surface in contact with the soil, which prevents the pin sinking into the freshly tilled soil. The spacing between pins is 5 mm. Ten 2-meter profiles were performed in each plot. These profiles were imaged numerically and analyzed to determine the average height and spacing of the ridges. Photos were analyzed manually: for each ridge, a minimum height (Hmin) and a maximum height (Hmax) were determined. Then, the difference between Hmax and Hmin was the Ridge Height (RH), while the distance between two consecutive Hmax was the Ridge Spacing (RS). The average heights of the ridges were measured to be 7.7 (±1.5) cm and 8.5 (±1.3) cm while the average spacing between ridges was 53.7 (±6.5) cm and 45.8 (±4.8) cm for the moldboard and the tiller, respectively [27]. This leads to RH/RS ratios of 0.14 for the moldboard and 0.19 for the tiller.

2.4. Meteorological Data

Wind speed and air temperature profiles were measured using a 7 m-high mast (Figure 4a). The mast was located at the extremity of one of the two parcels according to the wind direction. During the field campaign, the meteorological mast was relocated successively on plots 1 and 2 to acquire surface parameters (aerodynamic roughness length, Z0, and wind friction velocity, u * ) on both plots using the methodology described by Marticorena et al. [43] and based on the gradient theory [44].
Wind speed was measured using cup anemometers (A100R Vector Instrument from the Campbell Scientific© Company, Shepshed, Leicestershire, UK) installed on 1-meter shaped brackets at 7 vertical levels ranging from 0.22 to 4.22 m. The highest anemometer was placed at a height equal to less than 1/30 of the plot length as measured in the dominant wind direction. Measurement heights were selected to approximate a logarithmic scale, but out of practicality, the lowest measurement heights were determined by the height of the instruments (>20 cm). The consistency of wind speed measurements among the anemometers was tested in wind tunnel and in natural conditions prior to being placed in the field.
Air temperature was simultaneously measured by thermocouples (type Chromel Constantan) at three different heights (20, 95, 272 cm).
Wind direction was measured at only one level (2.5 m) using a W200P Vector Instrument (Campbell Scientific© company).
Data acquisition was performed with a data logger (CR10X from the Campbell Scientific© company), allowing the recording of all meteorological parameters averaged over 2-minute intervals with a scanning time of 5 s. Details on wind meteorological measurements and treatment can be found in Labiadh et al. [27]. The mean meteorological conditions during the wind erosion events are reported in Table 2. The mean aerodynamic roughness lengths derived from the wind profile measurements were 1.1 (±0.29) cm (with 252 observations) and 0.58 (±0.67) cm (with 673 observations) for Plot 1 (tiller) and Plot 2 (moldboard), respectively [27].
For each erosion event, we checked the wind direction with respect to the direction of the plots. To do that, considering that winds having the highest speed contributed most to the measured erosion fluxes, we computed the mean direction and standard deviation of the highest wind speeds recorded during each erosive period. Then, all erosion events occurred when wind directions were within ±45° of the direction of the plots [27].

2.5. Measurements of Wind Erosion Fluxes

Wind erosion fluxes were measured using Big Spring Number Eight (BSNE) sediment samplers (Figure 4b), which are widely used and were described in detail by Fryrear [45]. Briefly, these collectors have openings always facing the wind thanks to a large wind vane. This allows the particle-laden wind to flow into collection chambers; after soil particles settle in the collection regions of the chambers, the wind passes through large areas of fine steel mesh. Combining multiple sediment samplers allows sampling at different heights above the soil surface.
Three poles supporting seven BSNE samplers (ranging from approximately 7 to 120 cm above the soil surface) were installed at the boundary of each plot (Figure 4). For this study, only data from two of the three poles were available, the windblown sediment collected from the last one having been used for complementary chemical analyses.
Computing the vertically integrated fluxes from the sediment masses collected at different heights requires precise measurements of the height of each BSNE sampler. In the case of ridged surfaces, this measurement is not trivial. For example, a BSNE sampler may be located above either the top or the bottom of a furrow depending on the wind direction. To minimize this problem, the height of each BSNE sampler was first measured in reference to the top of the pole. Then, a precise (±1 mm) determination of the height of the top of the pole above ground level was performed using a theodolite (Zeiss-Ni 21©, Carl Zeiss, Oberkochen, Germany), with the ground level determined as the average of twelve measurements around the vertical position of the instruments. Additional measurements of the relative distance between the instruments using the theodolite were performed as a control. The BSNE samplers were collected immediately after a wind erosion event occurred and reinstalled immediately in order to be able to collect the following event. Measurements of the height of the BSNE samplers were repeated whenever the sediment trapped in the BSNE samplers was collected. Collection of the sediment trapped in the sand samplers, re-installation of the BSNE samplers, and height measurements were time-consuming processes (at least 3 h). Therefore, these tasks could not be completed at night or during windy conditions. Thus, as discussed later, in some cases, we treated erosion events occurring on consecutive days as a single event, i.e., they were collected in the same BSNE sampling run.
For each sampling period, at each sampling height, z, the average value of the horizontal mass flux of windblown sediment, q (mass per area per sample period), was obtained by dividing the mass of trapped soil by the inlet area of the BSNE sampler. Then, the sediment fluxes obtained at the different heights were integrated to compute the integrated horizontal mass flux of a column of windblown sediment moving in the direction of the wind, with a width of one-centimeter perpendicular to the wind direction and a height equal to 100 cm. Several empiric expressions exist to describe the vertical mass flux profile (power laws, exponential, or logarithmic equations). Considering the results of the study conducted by Panebianco et al. [46] who compared some of these experimental expressions, we used the formula proposed by Fryrear and Saleh [47] to describe the evolution of the erosion flux with height (Equation (1)) as this expression was shown to be the most robust one.
q ( z ) = a   e b z ,
with a and b regression coefficients for saltation flow with units of g cm−2 and cm−1, respectively.

2.6. Size Distribution of the Sediment Fluxes

The sediment samples collected in BSNE at different heights were sieved in order to retrieve the size distribution of the sediment fluxes with height. The procedure we followed was the same as the one described for soil samples (see Section 2.2): the sediment samples were passed slowly through a column of 13 sieves with <50 µm to >1000 μm mesh. However, the masses of sediment that were trapped into BSNE were sometimes low, especially for the highest BSNE, so that we used an electronic weighing scale having a better precision (0.0001 g).

2.7. Determination of the Threshold Wind Velocity

In order to determine the Threshold Wind Velocity (TWV), we used fast response Sensit© instruments [48] (The Sensit Company, Portland, USA). The Sensit© converts particle impacts into electrical energy with a piezoelectric crystal. One Sensit© was installed in each plot. The accumulated 20 s responses to impacting particles on the piezoelectric crystal were recorded and then summed over a 2-minute time step. However, in the field, we observed that our Sensits© began to count systematically after the beginning of an erosion event. This suggests that the kinetic energy of the moving grains at the TWV was insufficient to be registered by the sensor. This is likely due to the small size of the grains and aggregates that constitute the erodible soils in southern Tunisia.

2.8. Dust Uplift Potential

Since the sampling duration covers the whole wind erosion event (i.e., many hours), it is not easy to examine the possible link between wind speed (or wind friction velocity) and the mean size (or the size distribution) of the windblown sediment. Indeed, during a wind erosion event, wind speed significantly fluctuated (see Table 2).
Thus, to account for the possible role of wind speed on the size of the windblown sediment, we decided to compute a Dust Uplift Potential (DUP; Marsham et al. [49]). DUP allows providing an indication on the intensity of each wind erosion event. It is adapted from a widely used parameterization of saltation proposed by White [50]. Then, DUP is proportional to the horizontal mass flux:
{ D U P = U 3 ( 1 + U t U ) ( 1 U t 2 U 2 )   w h e n   U U t D U P = 0   o t h e r w i s e ,
where U is the wind speed (in m s−1), and Ut the wind threshold velocity to initiate wind erosion (in m s−1).
As shown by Equation (2), DUP weighs in a non-linear way the role of the wind during a wind erosion event depending on its speed: thus, DUP constitutes an interesting method to scale the intensity of a wind erosion event.
We computed the DUP in steps of 2 min by using the measured wind speed at 4.22 m and assuming a TWV of 7.47 m s−1 at this height. As mentioned above, due to the low sensitivity of the Sensit©, this is a rough estimate of the TWV based on a combination between field observations and Sensit© counts. Moreover, as indicated in Table 2, the durations of the five wind erosion events were very different, and thus, we normalized the DUP computed for each wind erosion event by the duration of each event in order to qualify the wind erosion events in terms of “relative intensity”.

3. Results and Discussion

3.1. Wind Erosion Events

Five erosion events that occurred under defined conditions (i.e., with respect to the relevant wind direction) were sampled during the field campaign. The erosion event occurring on 20 April was a single event of short duration, while those sampled on 23–24 March, 27–28 March, 7–8 April, and 17–19 May were longer in duration with wind erosion occurring during the day, ceasing in the evening and starting again in the morning of the following day. The sediment flux varied over about one order of magnitude on each parcel (from 7.2 to 95.2 g cm−1 event−1 for the plot ploughed with moldboard and from 55 to 446 g cm−1 event−1 for the plot ploughed with tiller). The highest wind erosion event was recorded on 7–8 April for both plots, whereas the less intense one was collected on 19–20 May for Plot 1 (tiller) and on 20 April for Plot 2 (moldboard) (Table 2).

3.2. Size Distributions of the Soil and of Windblown Sediment

We first examined the links existing between the size of soil grains and the size of windblown sediment depending on the height at which the sediment was collected. Figure 5 illustrates the results obtained during the 7–8 April 2008 wind erosion event. We observe that, as mentioned before, the soil size distributions were very similar. Indeed, both on the tiller plot and on the moldboard plot, they are dominated by very fine sand: the soil particles having a diameter less than 125 µm constitute about 97% of the soil mass.
We also observe that the size class 100–125 µm is strongly depleted in the windblown sediment compared to its abundance in soil whatever the plot or the height at which the windblown sediment was collected. Conversely, the smallest size classes (50–75 µm and <50 µm) are significantly enriched in the windblown sediment compared to the parent soil whatever the plot. This result is in agreement with various experiments previously performed on soils without ridges, e.g., [32,51,52,53]. Indeed, during wind erosion events, the size of the windblown sediment in the saltation/suspension layers decreases with height as the effect of gravitational and drag forces limit the ascent of coarser particles into the upper atmospheric layers.
The class 75–100 µm, which is the dominant size class on both plots, exhibits a different behavior depending on the plough: on the tiller plot, the saltating sediment was enriched in this size class compared to the parent soil whatever the height. For the moldboard plot, this size class is depleted in the windblown sediment compared to the parent soil, at least above 9 cm in height. Thus, above this height, the dominant size class in the windblown sediment is the size class 50–75 µm on the moldboard plot, while it is the size class 75–100 µm on the tiller plot. This suggests that the vertical transfer of matter from the soil surface to more than 1 m height is not identical for each size class of sediment, depending on the characteristics of the surface.

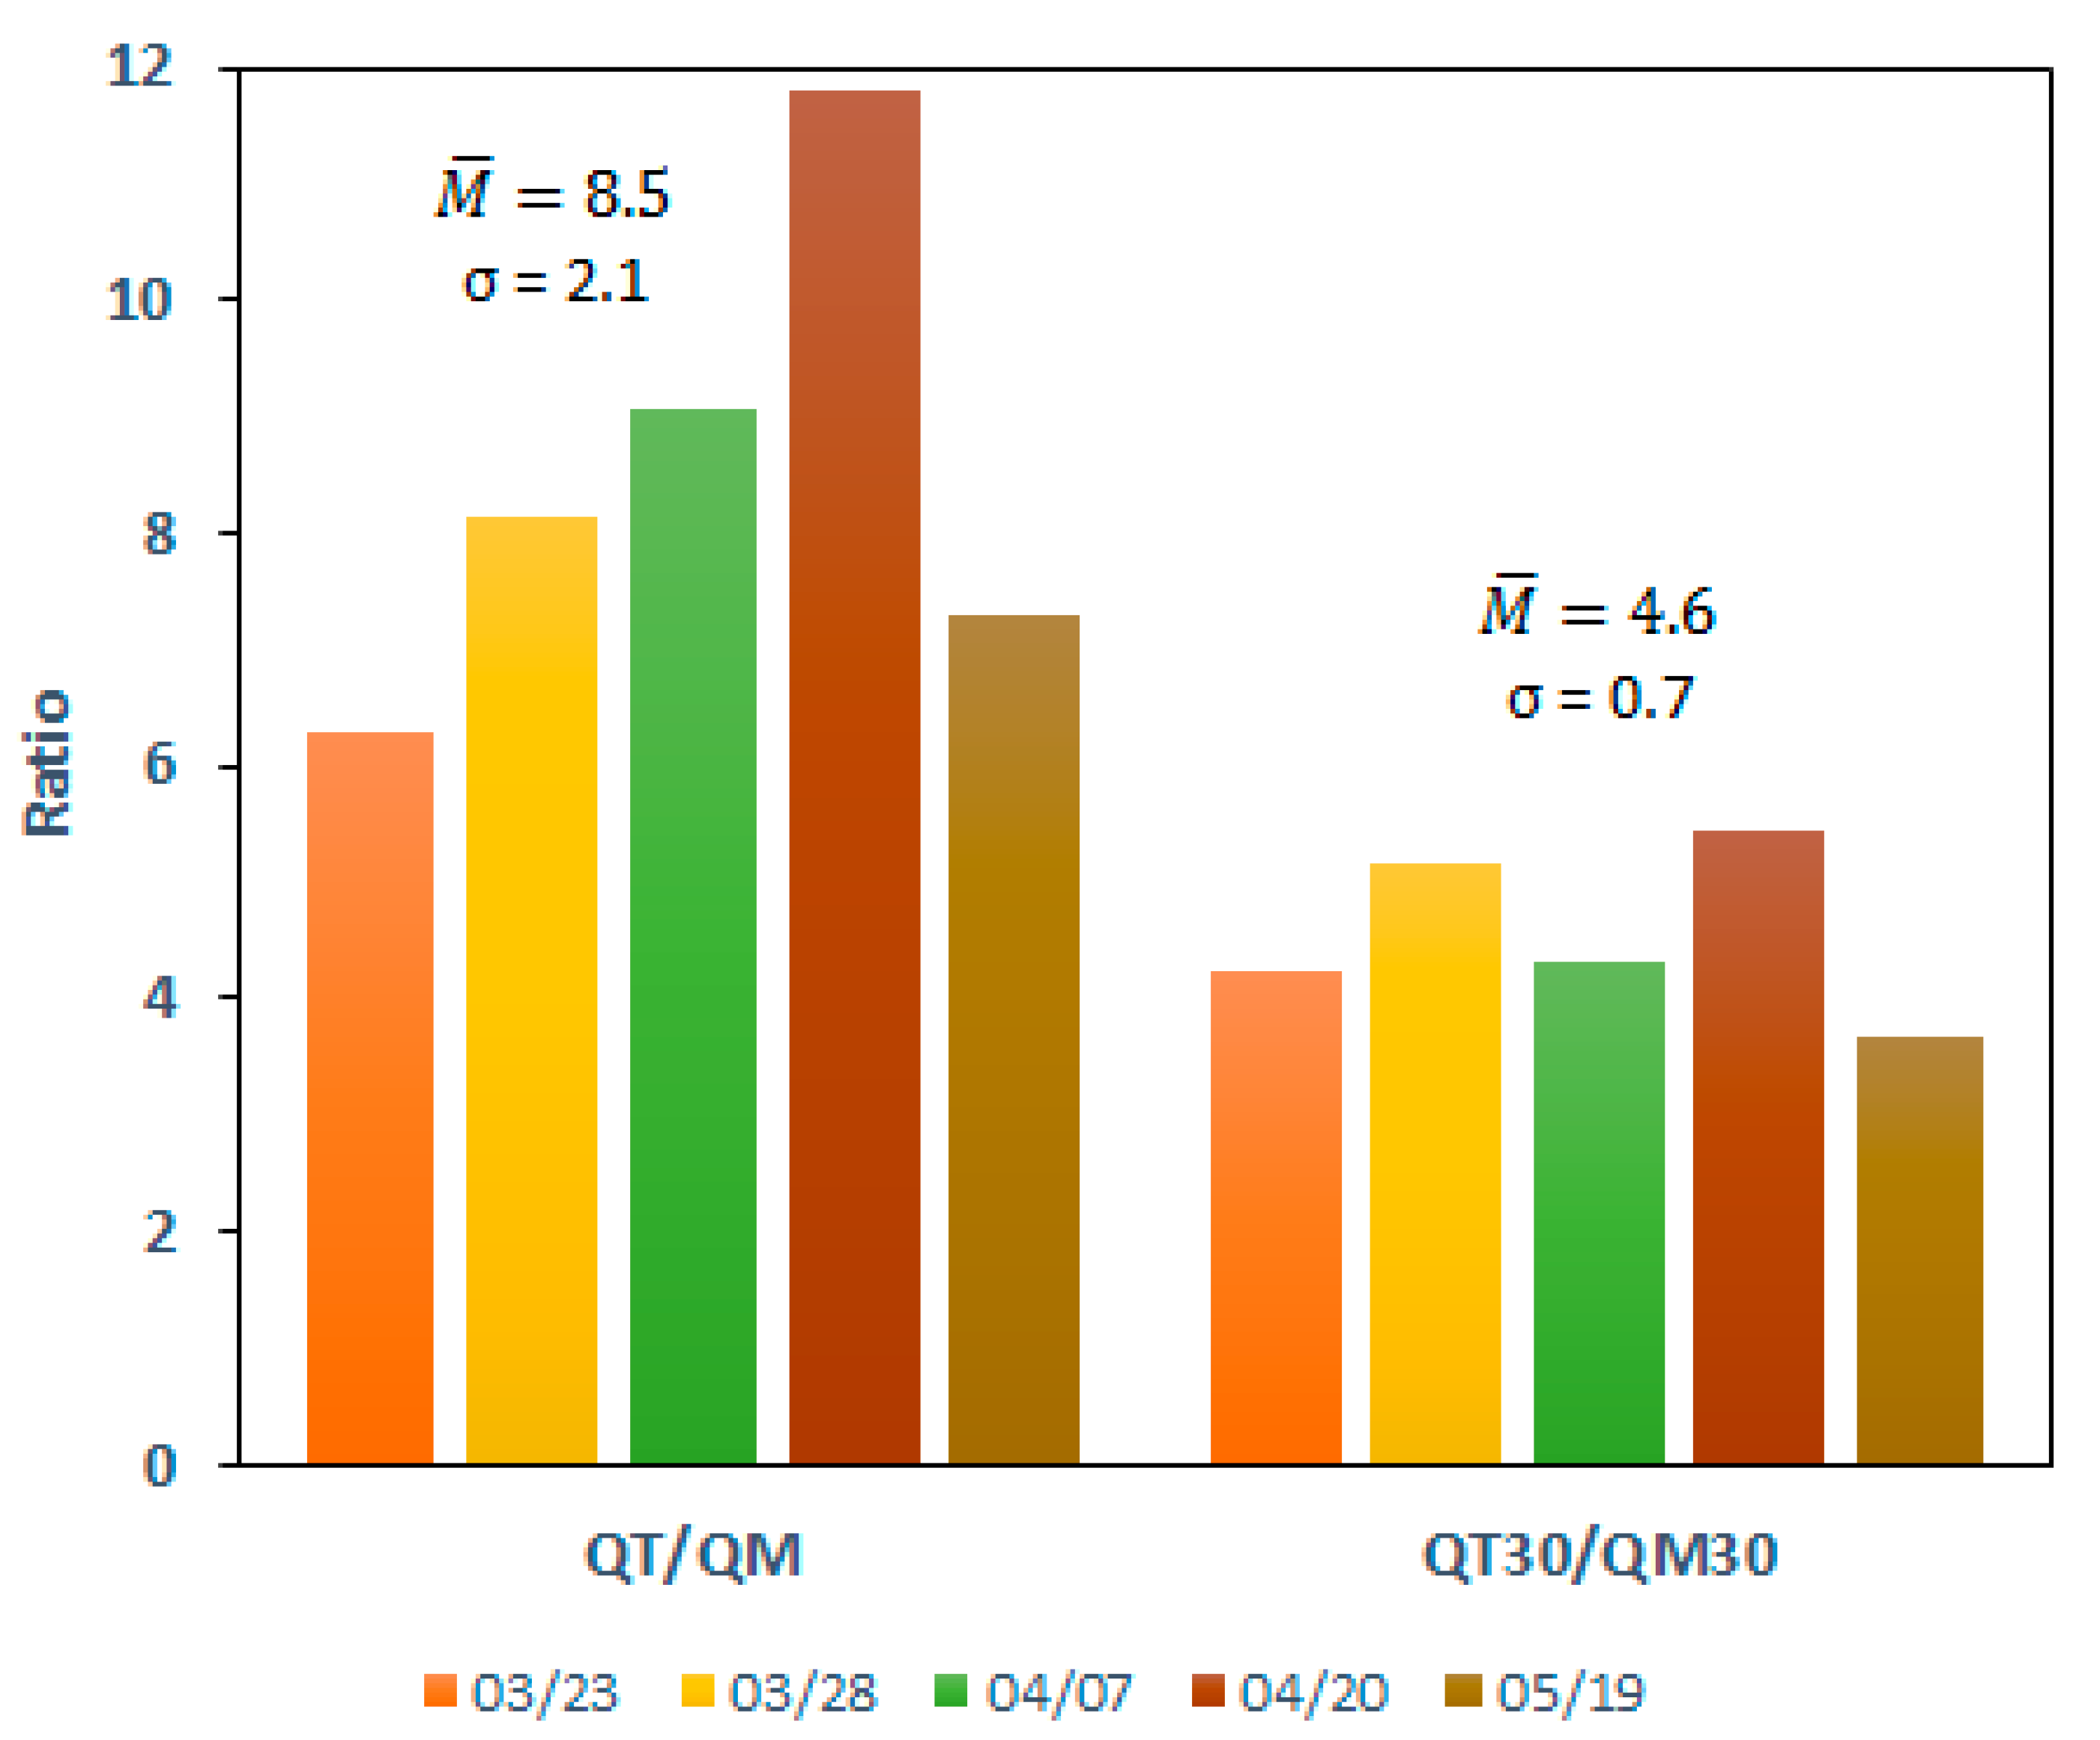
3.3. Changes in Windblown Sediment Size with Wind Speed

Results are reported in Table 2 and show that the range of variation of the normalized DUP is limited, since there is only a factor of 2.5 between the smallest and the highest normalized DUP. This may be due to this low variability of the intensity of the wind erosion events, and there is no clear trend between the size of the windblown sediment and the DUP that was observed, with larger differences in the size distribution of the windblown sediment being observed between the two types of tilled surfaces for the same event rather than between events of different DUPs for the same tilled surface. This will be detailed in the following sections.

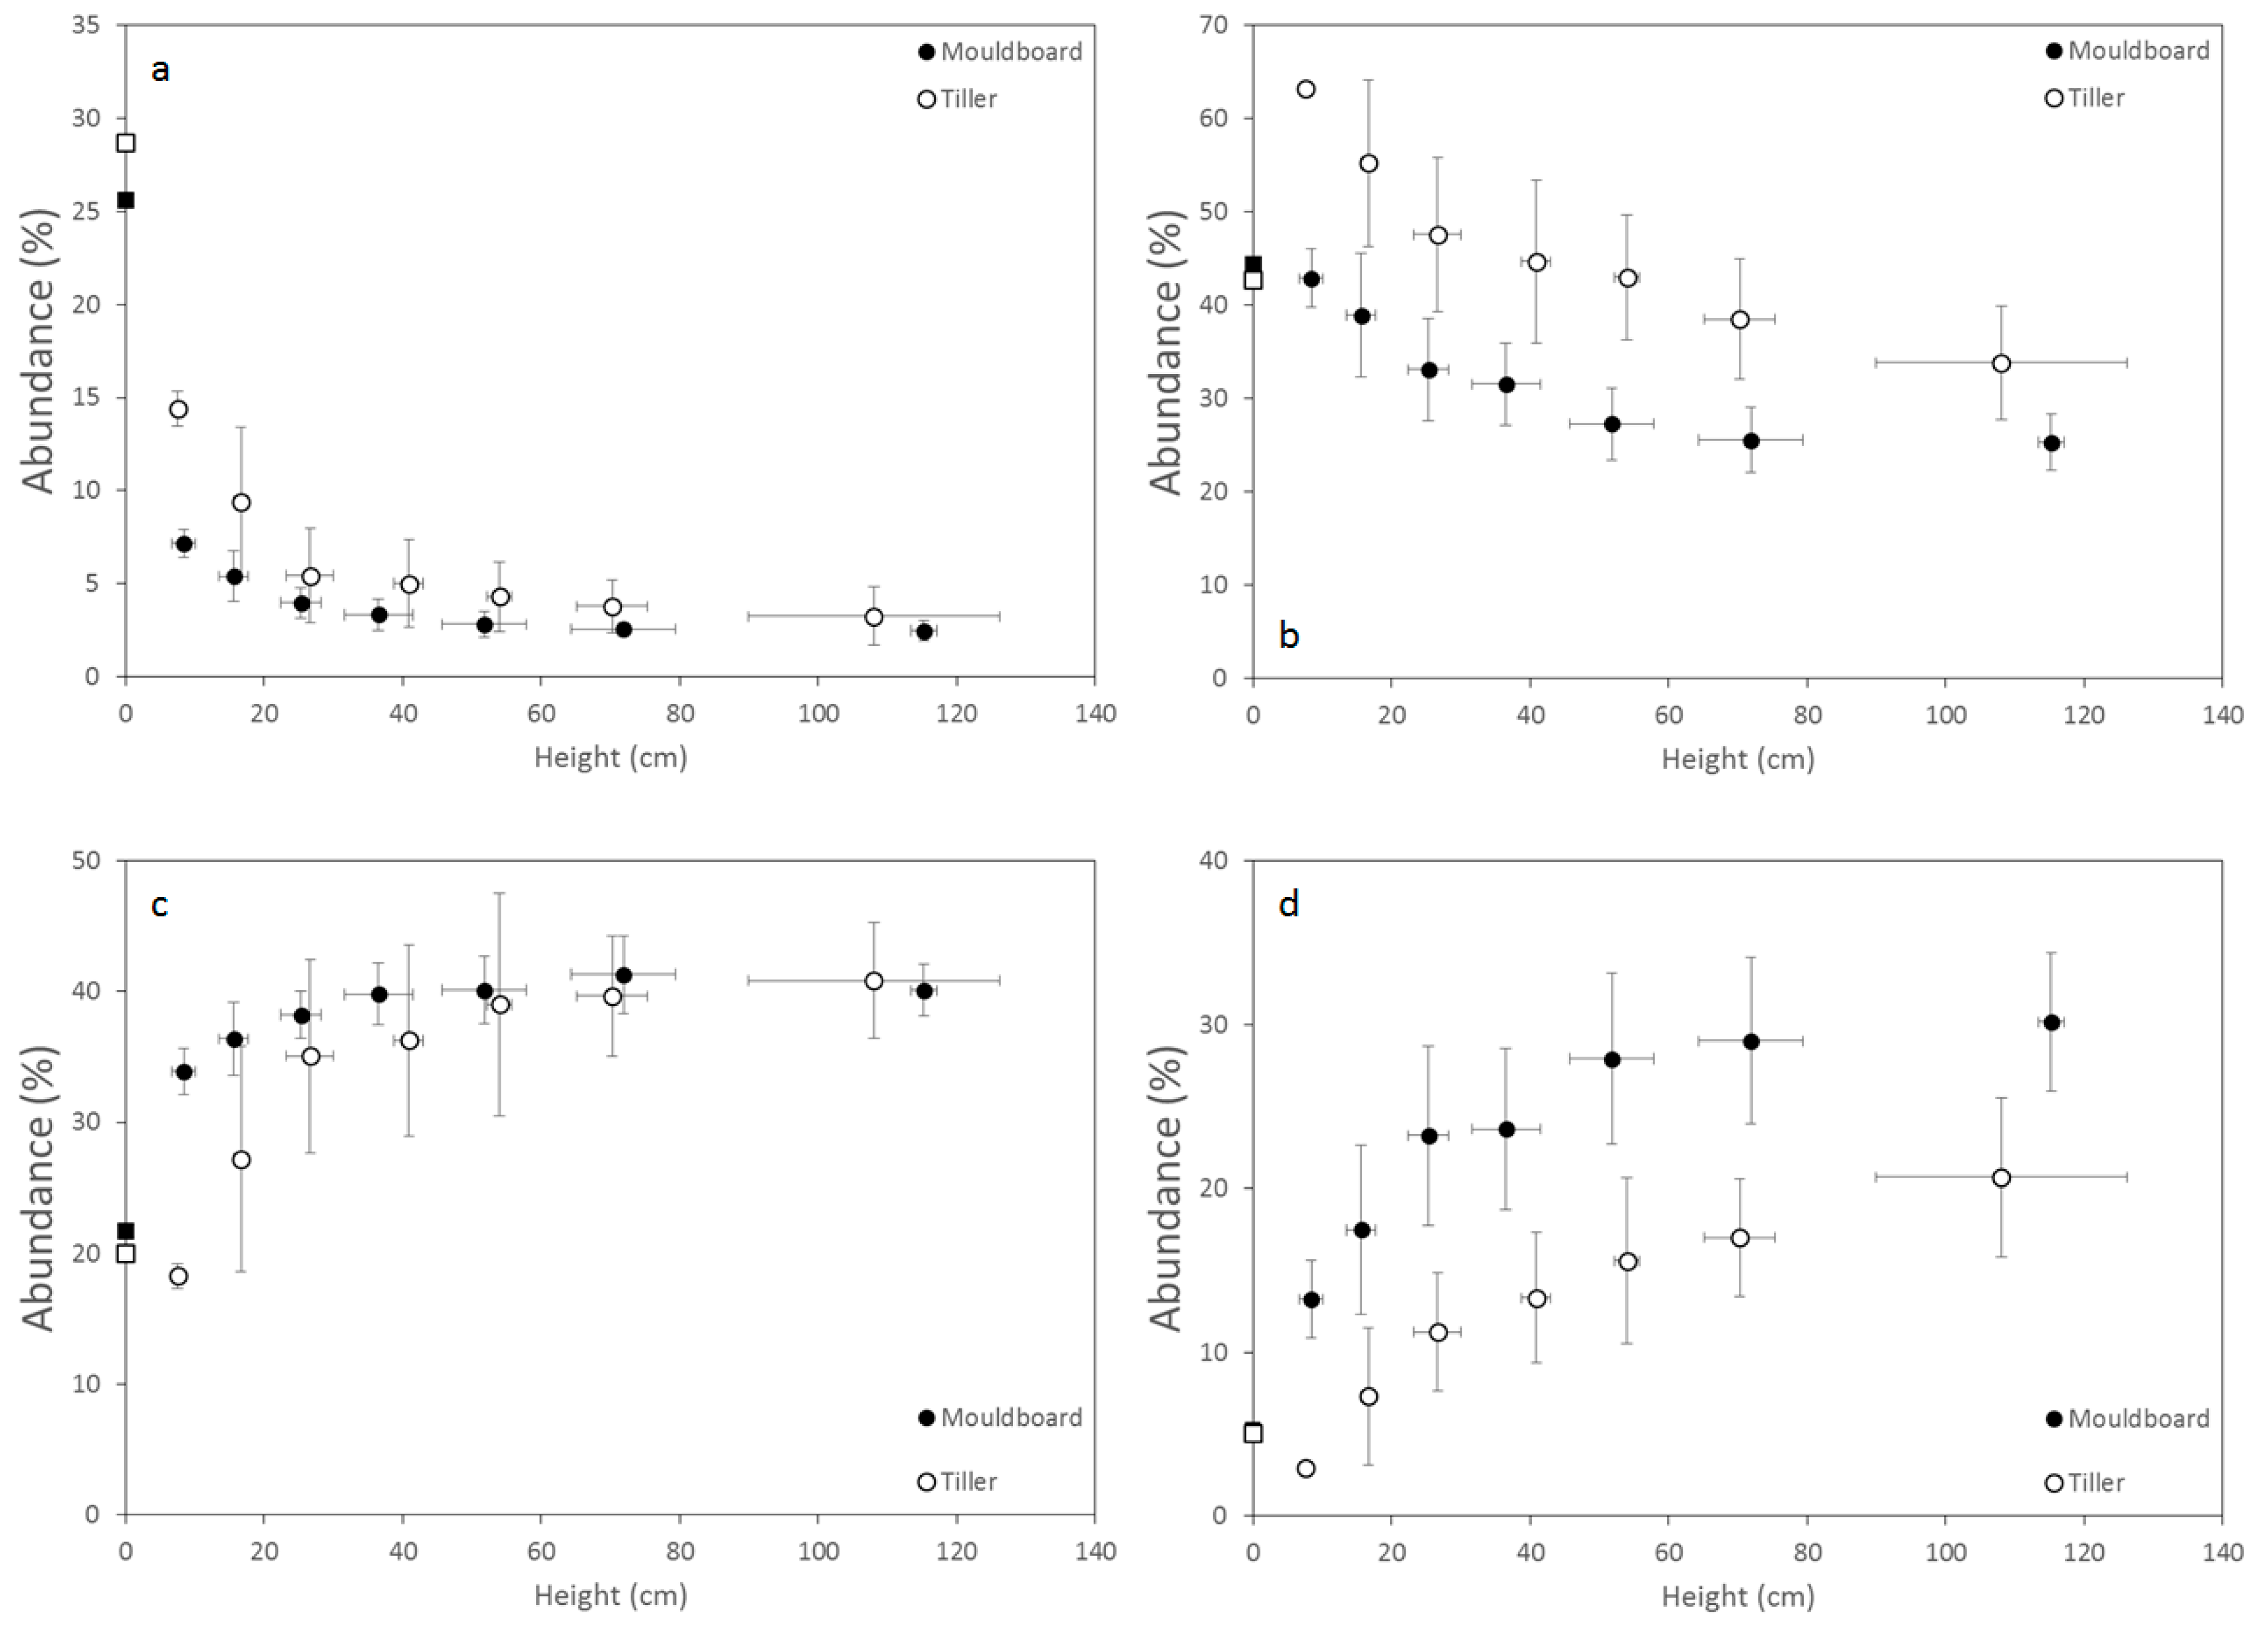
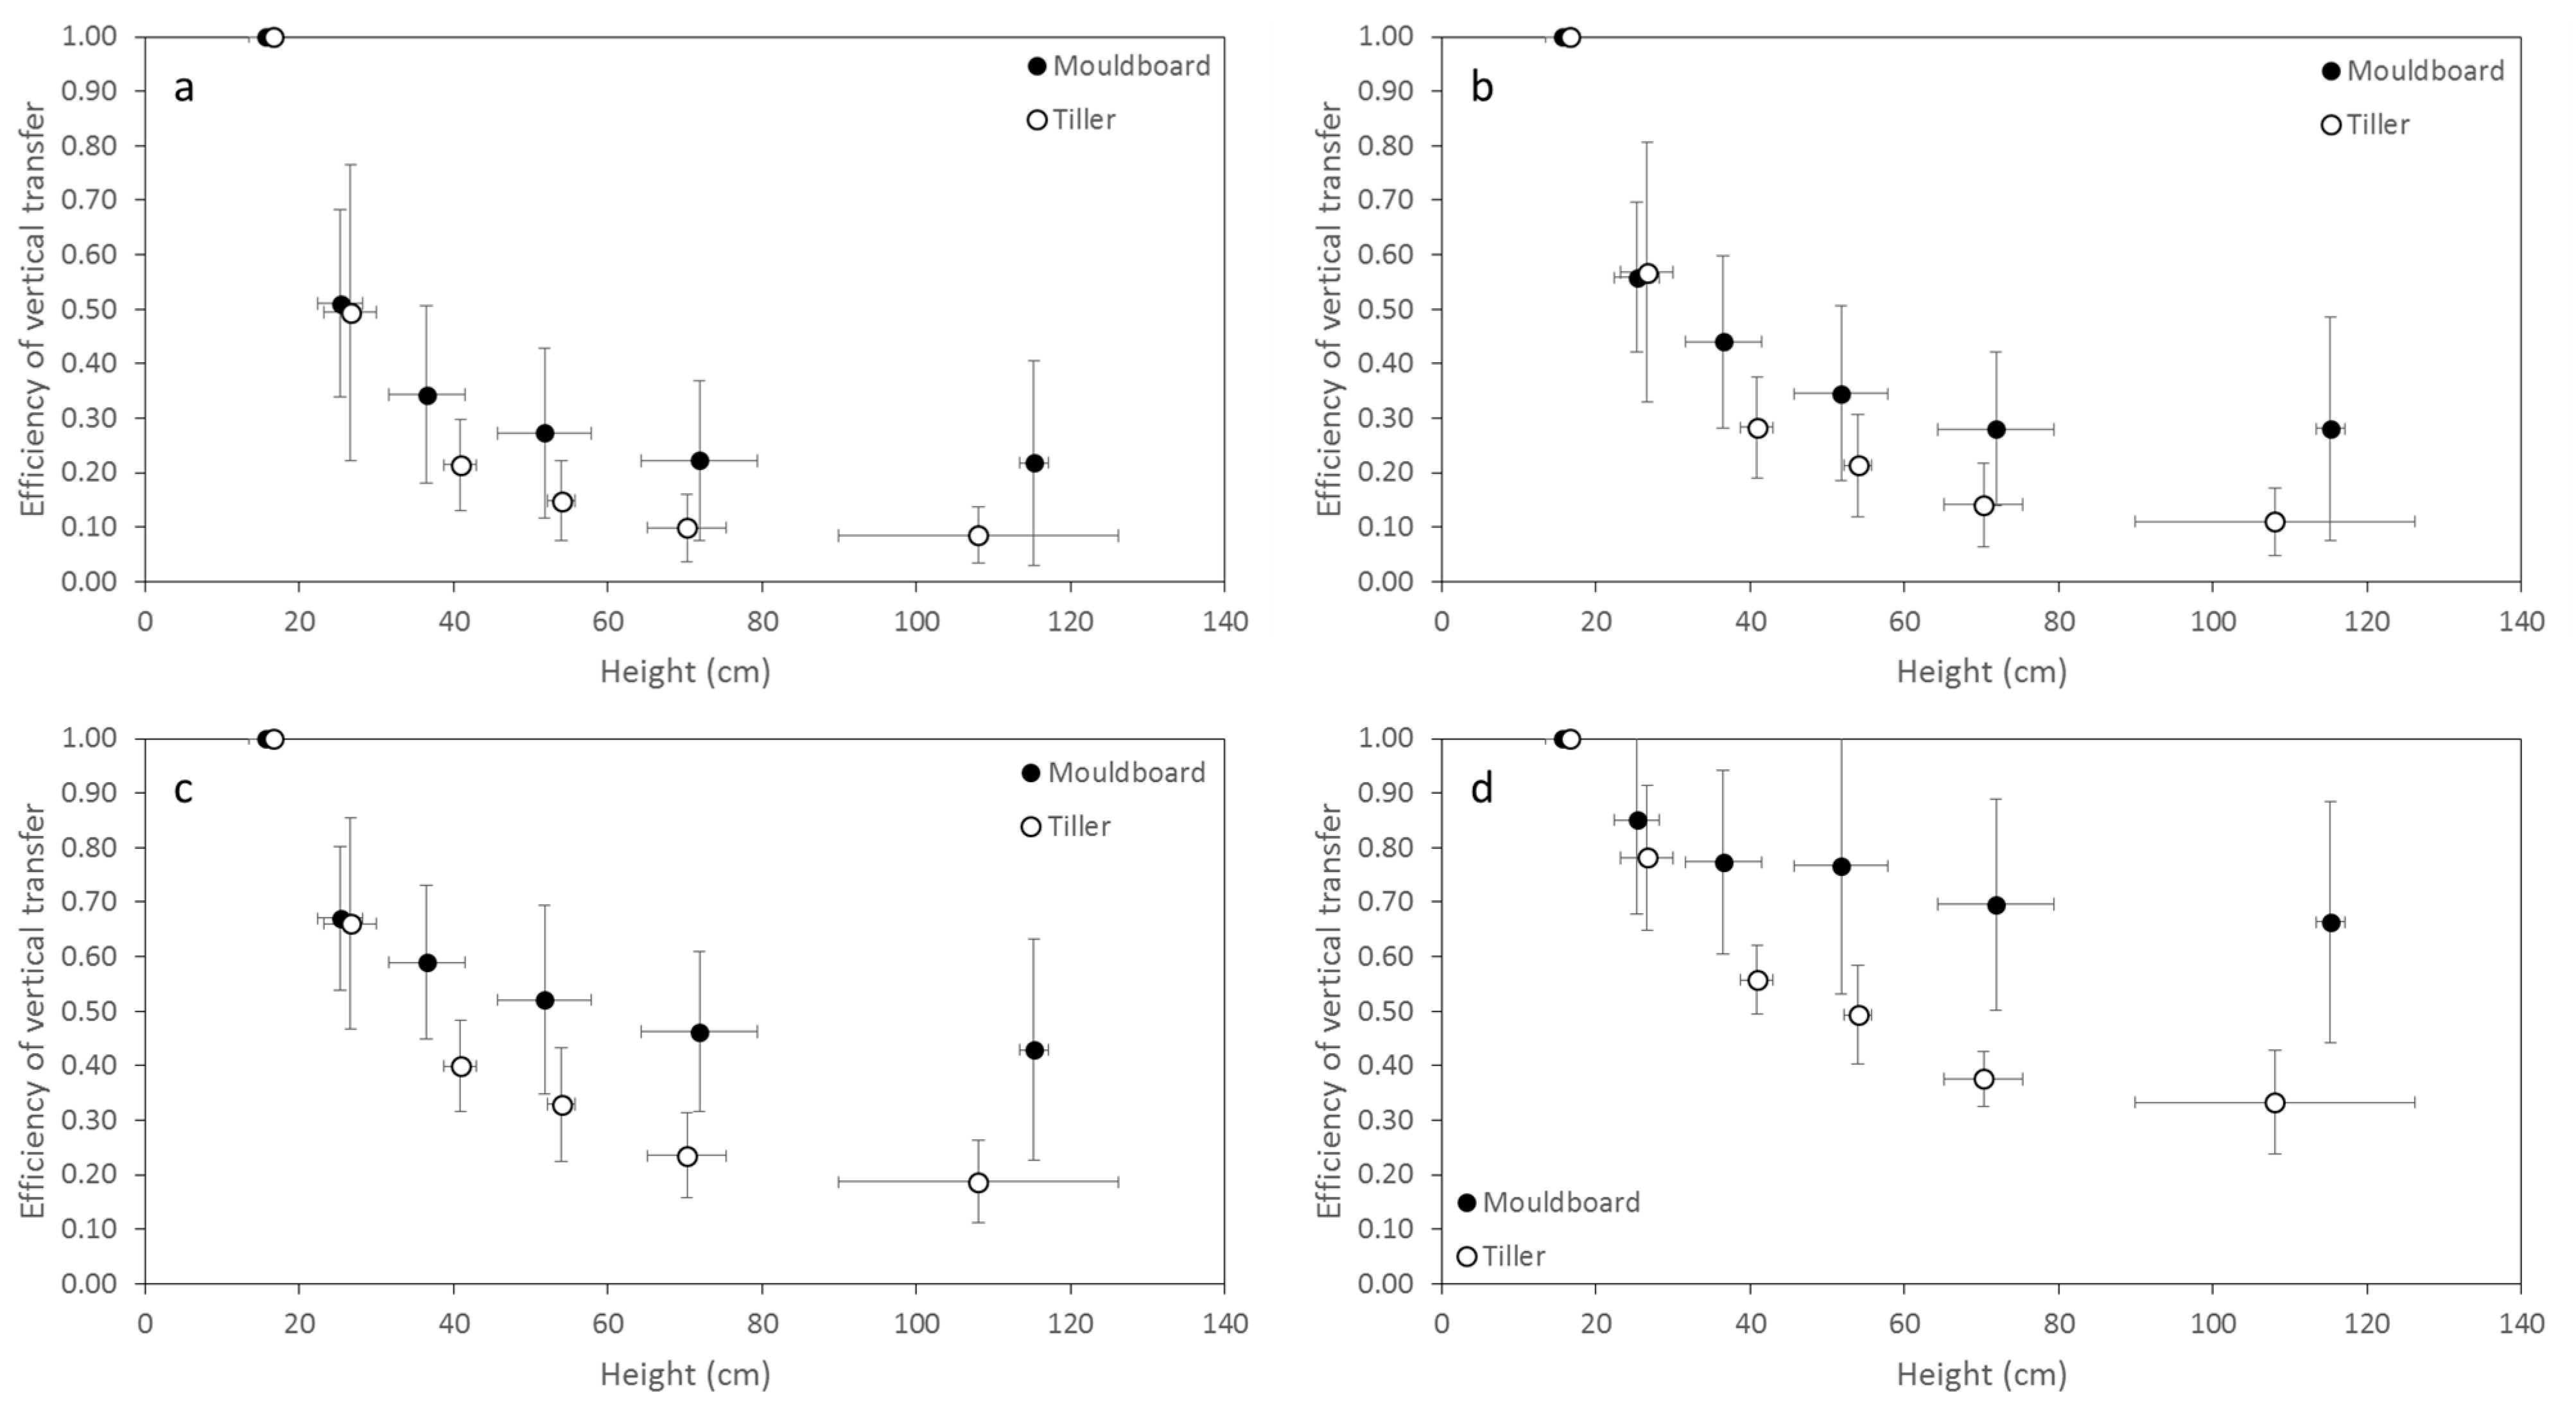
3.4. Changes in Windblown Sediment Size with Height

Figure 6 allows discussing in detail the difference in the vertical relative abundance of the different size classes depending on the plot. For each height, the relative abundance for each size class averaged over the five wind erosion events is:
M i M i ,
i being the size class, and M its mass (in g).
Figure 6a shows that the size class 100–125 µm of the windblown sediment raised from the moldboard and tiller plots is strongly depleted compared to the parent soils and the greater the height, the higher the depletion. We can also observe that the depletion is more pronounced for the moldboard plot than for the tiller one.
A similar depletion of the size class 75–100 µm with height compared to the parent soil for the moldboard plot can be observed in Figure 6b. However, for the tiller plot, the windblown sediment collected in the lower vertical levels (up to about 70 cm) is enriched in this size class compared to the parent soil.
Concerning the finest size fractions, <50 µm and 50–75 µm (Figure 6c,d), the windblown sediment is enriched compared to the parent soil for both the tiller and the moldboard plots. The enrichment in the small size fraction of the windblown sediment is increasing with height. However, for the tiller plot, the lowest vertical level (around 10 cm height) is depleted in these two size classes. Note that the enrichment of the windblown sediment in these size fractions is more pronounced for the moldboard plot than for the tiller one.
Labiadh et al. [27] showed that the sediment flux mobilized by wind is significantly lower on the moldboard plot than on the tiller plot (see also Table 2). These authors explained this difference in the intensity of the sediment fluxes measured over the two parcels by differences in the efficiency in trapping the saltating particles for each type of tillage ridges.
This is consistent with a higher depletion of the 75–100 µm and 100–125 µm windblown sediment size classes on the moldboard plot. Indeed, these size classes contribute for about 70% of the soil size distribution (Figure 5) and correspond to the soil grain sizes for which the wind erosion threshold is the lowest, e.g., [54].
In order to examine the efficiency of the vertical transfer of the different sediment size classes, we computed a vertical transfer efficiency which is equal to the ratio between the abundance of each size class at a given height divided by the abundance of this size class at a reference height arbitrarily selected to be 15.6 cm for the moldboard and 16.6 cm for the tiller (Figure 7).
Figure 7 shows that the efficiency of the vertical transfer is more important for the smallest size classes than for the coarser ones whatever the plot. As an example, the sediment flux of particles having a diameter less than 50 µm measured at 71.9 cm on the moldboard plot is about 70% of that measured for the same size class at 15.6 cm. For the particles ranging from 100 to 125 µm in diameter, at 71.9 cm, the sediment flux represents only 22% of that measured at 15.6 cm.
More surprisingly, Figure 7 shows that the efficiency of the vertical transfer is much better over the moldboard plot than on the tiller plot: as an example, the vertical transfer at about 70 cm is about two times greater for the moldboard plot than for the tiller plot, whatever the size class.
In order to provide a more general view of the difference in the vertical transfer of the windblown sediment depending on the tilled surface, we first computed, for each wind erosion event, the two different windblown sediment fluxes: one for the layer extending from 0.1 to 100 cm height and another one for the windblown sediment above 30 cm height. This latter height can be considered as a reasonable limit between saltation and short-term suspension, e.g., [52]. The ratio of windblown sediment fluxes measured on the tiller plot to the moldboard plot for the five wind erosion events is in average 8.5 when considering the total (i.e., from 0.1 to 100 cm height) windblown sediment flux, while it is about two times lower (4.6) when considering only the windblown flux between 30 and 100 cm (Figure 8). Moreover, Figure 8 shows that this difference is observed for each of the wind erosion events, suggesting that the vertical transfer of the windblown sediment to a height greater than 30 cm is systematically much more efficient on the moldboard plot whatever the wind erosion event.
One possible hypothesis for explaining this result could be, as mentioned by Gillette et al. [52], the longer scale of horizontal distance required by weakly suspended particles to reach equilibrium than that needed by saltating particles. In these conditions, it seems possible that the fraction the saltation flux represented in the total horizontal mass flux evolves with distance (even if the saltation flux has become constant with distance). However, Table 2 shows that the distances between the starting point for erosion and the sand catchers (i.e., the fetch) are not so different for the two parcels for most of the wind erosion events. It is especially the case for the 27–28 March and 20 April events for which the ratios between the total and above 30 cm windblown sediment fluxes are similar to those obtained for the other wind erosion events, suggesting that this hypothesis probably does not explain our results.
As mentioned above, Labiadh et al. [27] showed that for identical wind erosion events, the trapping of the saltating particles was much more efficient on the moldboard plot than on the tiller one. Our results suggest that this trapping is less efficient for the particles having the capacity to be extracted from the saltation layer, i.e., the smallest ones.
These experimental results suggest that the large benefit of the moldboard vs. tiller ploughing in term of soil loss by wind erosion is significantly reduced when the vertical transfer of the fine fraction of the windblown material is accounted for: a larger fraction of the mobilized particles by wind can reach a higher elevation in the case of moldboard ploughing and then can be transported more efficiently over longer distances.

4. Conclusions

Measurements of windblown sediment fluxes on two parcels respectively tilled with a tiller plough and a moldboard plough showed that windblown sediment fluxes were significantly greater on the tiller plot than on the moldboard plot. Whatever the plot, larger particles were depleted in the sediment samplers compared to the parent soil. The enrichment in the small size fraction of the windblown sediment increased with height.
The efficiency of the vertical transfer was greater over the moldboard plot than over the tiller plot: as an example, the fraction of the windblown sediment that was transferred up to 30 cm was about two times greater for the moldboard plot than for the tiller plot whatever the size classes. This implies that a higher fraction of material compared to the total sediment flux can be transported over long distances in the case of a surface ploughed with a moldboard. This result could reduce in part the benefit regarding wind erosion of using the moldboard plough instead of the tiller plough. This new result is important because it highlights that the impact of tillage tool on wind erosion is different when considering the horizontal or the vertical flux. As a consequence, for future studies dealing with the impact of wind erosion on soil degradation, the impact of agricultural practices must be investigated not only on the saltation flux but also on the vertical dust flux.

Author Contributions

Conceptualization, M.T.L., G.B., J.L.R. and C.B.; Data curation, M.L., S.S. and T.H.d.T.; Formal analysis, M.T.L., G.B., J.L.R., and C.B.; Funding acquisition, M.T.L. and G.B.; Investigation, M.T.L., G.B., J.L.R., and C.B.; Validation, M.T.L., G.B., J.L.R., and C.B.; Writing—original draft, M.T.L., G.B., J.L.R., and C.B.; Writing—review and editing, M.T.L., G.B., J.L.R., and C.B. All authors have read and agreed to the published version of the manuscript.

Funding

This study was partly supported by a grant from the National INSU/CNRS Program EC2CO and has benefited from the support of the bilateral French–Tunisian cooperation program PHC UTIQUE.

Institutional Review Board Statement

Not applicable.

Informed Consent Statement

Not applicable.

Data Availability Statement

The data presented in this study are available on request from the corresponding author.

Acknowledgments

The authors would like to thank Houcine Khatteli, Director of the Institut des Régions Arides (IRA) of Médenine, for the constant support of IRA in all research related to wind erosion, and in particular for giving us access to the Dar Dhaoui’s experimental range and for the IRA’s logistic help during the all experiment to ensure the success of the campaign.

Conflicts of Interest

The authors declare no conflict of interest.

References

  1. Lal, R. Soil erosion by wind and water: Problems and prospects. In Soil Erosion: Research Methods; Lal, R., Ed.; Soil and Water Conservation Society: Ankeny, IA, USA; St. Lucie Press: Delray Beach, FL, USA, 1994; pp. 1–9. [Google Scholar]
  2. Wang, X.; Xia, D.; Wang, T.; Xue, X.; Li, J. Dust Sources in Arid and Semiarid China and Southern Mongolia: Impacts of Geomorphological Setting and Surface Materials. Geomorphology 2008, 97, 583–600. [Google Scholar] [CrossRef]
  3. Bullard, J.E.; Harrison, S.P.; Baddock, M.C.; Drake, N.; Gill, T.E.; McTainsh, G.; Sun, Y. Preferential Dust Sources: A Geomorphological Classification Designed for Use in Global Dust-cycle Models. J. Geophys. Res. Earth Surf. 2011, 116. [Google Scholar] [CrossRef] [Green Version]
  4. Hagen, L.J.; Lyles, L. Amount and Nutrient Content of Particles Produced by Soil Aggregate Abrasion. In Proceedings of the National Symposium on Erosion and Soil Productivity, New Orleans, LA, USA, 10–11 December 1984; ASAE Publication: New Orleans, LA, USA, 1985; Volume 8, pp. 117–129. [Google Scholar]
  5. Zobeck, T.M.; Fryrear, D.W. Chemical and Physical Characteristics of Windblown Sediment II. Chemical Characteristics and Total Soil and Nutrient Discharge. Trans. ASAE 1986, 29, 1037–1041. [Google Scholar] [CrossRef]
  6. Leys, J.; Mc Tainsh, G. Soil Loss and Nutrient Decline by Wind Erosion—Cause for Concern. Aust. J. Soil Water Conserv. 1994, 7, 30–35. [Google Scholar]
  7. Raupach, M.R.; McTainsh, G.H.; Leys, J.F. Estimates of the Dust Mass in the Melbourne Dust Storm of 8 February 1983. Aust. J. Soil Water Conserv. 1994, 7, 20–24. [Google Scholar]
  8. Sterk, G.; Herrmann, L.; Bationo, A. Wind-Blown Nutrient Transport and Soil Productivity Changes in Southwest Niger. Land Degrad. Dev. 1996, 7, 325–335. [Google Scholar] [CrossRef]
  9. Sterk, G. Causes, Consequences and Control of Wind Erosion in Sahelian Africa: A Review. Land Degrad. Dev. 2003, 14, 95–108. [Google Scholar] [CrossRef]
  10. Li, J.; Okin, G.S.; Alvarez, L.; Epstein, H. Quantitative Effects of Vegetation Cover on Wind Erosion and Soil Nutrient Loss in a Desert Grassland of Southern New Mexico, USA. Biogeochemistry 2007, 85, 317–332. [Google Scholar] [CrossRef]
  11. Li, J.; Okin, G.S.; Alvarez, L.; Epstein, H. Effects of Wind Erosion on the Spatial Heterogeneity of Soil Nutrients in Two Desert Grassland Communities. Biogeochemistry 2008, 88, 73–88. [Google Scholar] [CrossRef]
  12. Gillette, D.A. Fine Particle Emissions Due to Wind Erosion. Trans. ASAE 1977, 20, 890–897. [Google Scholar] [CrossRef]
  13. Nordstrom, K.F.; Hotta, S. Wind Erosion from Cropland in the USA: A Review of Problems, Solutions and Prospects. Geoderma 2004, 121, 157–167. [Google Scholar] [CrossRef]
  14. Goudie, A.S.; Middleton, N.J. Dust storm control. In Desert Dust in the Golabl System; Springer: Heidelberg, Germany, 2010; p. 287. ISBN 978-3-642-06890-4. [Google Scholar]
  15. Xiao, L.; Li, G.; Zhao, R.; Zhang, L. Effects of Soil Conservation Measures on Wind Erosion Control in China: A Synthesis. Sci. Total Environ. 2021, 778, 146308. [Google Scholar] [CrossRef]
  16. Skidmore, E.L. Wind Erosion Control. Clim. Chang. 1986, 9, 209–218. [Google Scholar] [CrossRef]
  17. Yang, C.; Geng, Y.; Fu, X.Z.; Coulter, J.A.; Chai, Q. The Effects of Wind Erosion Depending on Cropping System and Tillage Method in a Semi-Arid Region. Agronomy 2020, 10, 732. [Google Scholar] [CrossRef]
  18. Gholamiderami, P.; Lahooti, P.; Darbam, H. The Effect of Mulch on Properties of Erosion Sensitive Soil Using a Wind Tunnel. Glob. J. Environ. Sci. Manag. 2020, 6, 537–552. [Google Scholar] [CrossRef]
  19. Pi, H.; Webb, N.P.; Huggins, D.R.; Sharratt, B. Critical Standing Crop Residue Amounts for Wind Erosion Control in the Inland Pacific Northwest, USA. Catena 2020, 195, 104742. [Google Scholar] [CrossRef]
  20. Mikailsoy, F.; Carman, K.; Ozbek, O. Non-Linear Modelling to Describe the Wind Erosion Rate in Different Tillage Practices. Fresen. Environ. Bull. 2018, 27, 1604–1612. [Google Scholar]
  21. Chang, X.; Sun, L.; Yu, X.; Liu, Z.; Jia, G.; Wang, Y.; Zhu, X. Windbreak Efficiency in Controlling Wind Erosion and Particulate Matter Concentrations from Farmlands. Agric. Ecosyst. Environ. 2021, 308, 107269. [Google Scholar] [CrossRef]
  22. Fryrear, D.W. Soil Ridge-Clods and Wind Erosion. Trans. ASAE 1984, 27, 445–448. [Google Scholar] [CrossRef]
  23. Hagen, L.J.; Armbrust, D.V. Aerodynamic Roughness and Saltation Trapping Efficiency of Tillage Ridges. Trans. ASAE 1992, 35, 1179–1184. [Google Scholar] [CrossRef] [Green Version]
  24. Kardous, M.; Bergametti, G.; Marticorena, B. Wind Tunnel Experiments on the Effects of Tillage Ridge Features on Wind Erosion Horizontal Fluxes. Ann. Geophys. 2005, 23, 3195–3206. [Google Scholar] [CrossRef] [Green Version]
  25. Armbrust, D.V.; Chepil, W.S.; Siddoway, F.H. Effects of Ridges on Erosion of Soil by Wind. Soil Sci. Soc. Am. J. 1964, 28, 557–560. [Google Scholar] [CrossRef]
  26. López, M.V.; Sabre, M.; Gracia, R.; Arrúe, J.L.; Gomes, L. Tillage Effects on Soil Surface Conditions and Dust Emission by Wind Erosion in Semiarid Aragón (NE Spain). Soil Tillage Res. 1998, 45, 91–105. [Google Scholar] [CrossRef] [Green Version]
  27. Labiadh, M.; Bergametti, G.; Kardous, M.; Perrier, S.; Grand, N.; Attoui, B.; Sekrafi, S.; Marticorena, B. Soil Erosion by Wind over Tilled Surfaces in South Tunisia. Geoderma 2013, 202–203, 8–17. [Google Scholar] [CrossRef]
  28. Çarman, K.; Marakoğlu, T.; Taner, A.; Mikailsoy, F. Measurements and Modelling of Wind Erosion Rate in Different Tillage Practices Using a Portable Wind Erosion Tunnel. Zemdirb. Agric. 2016, 103, 327–334. [Google Scholar] [CrossRef] [Green Version]
  29. Bergametti, G.; Forêt, G. Dust deposition. In Mineral Dust: A Key Player in the Earth System; Knippertz, P., Stuut, J.-B.W., Eds.; Springer: Dordrecht, The Netherlands, 2014; pp. 179–200. [Google Scholar]
  30. Bergametti, G.; Marticorena, B.; Rajot, J.L.; Foret, G.; Alfaro, S.C.; Laurent, B. Size-Resolved Dry Deposition Velocities of Dust Particles: In Situ Measurements and Parameterizations Testing. J. Geophys. Res. Atmos. 2018, 123, 11080–11099. [Google Scholar] [CrossRef]
  31. Chepil, W.S.; Woodruff, N.P. Sedimentary Characteristics of Dust Storms: II. Visibility and Dust Concentration. Am. J. Sci. 1957, 255, 104–114. [Google Scholar] [CrossRef]
  32. Nickling, W.G. Grain-Size Characteristics of Sediment Transported during Dust Storms. J. Sediment. Petrol. 1983, 53, 1011–1024. [Google Scholar] [CrossRef]
  33. Goossens, D. The Granulometrical Characteristics of a Slowly-Moving Dust Cloud. Earth Surf. Proc. Landf. 1985, 10, 353–362. [Google Scholar] [CrossRef]
  34. Dong, Z.; Qian, G. Characterizing the Height Profile of the Flux of Wind-Eroded Sediment. Environ. Geol. 2007, 51, 835–845. [Google Scholar] [CrossRef]
  35. Sharratt, B.; Wendling, L.; Feng, G. Windblown Dust Affected by Tillage Intensity during Summer Fallow. Aeolian Res. 2010, 2, 129–134. [Google Scholar] [CrossRef]
  36. Hagen, L.J.; van Pelt, S.; Sharratt, B. Estimating the Saltation and Suspension Components from Field Wind Erosion. Aeolian Res. 2010, 1, 147–153. [Google Scholar] [CrossRef]
  37. Kallel, M.R. Hydrologie de La Jeffara Tunisienne; DG-RE: Tunis, Tunisia, 2001; p. 65. [Google Scholar]
  38. Kardous, M. Quantification de L’érosion Éolienne Dans les Zones Arides Tunisiennes: Approche Expérimentale et Modélisation. Doctorat, Université Paris XII Val de Marne: Créteil, 2005. Available online: https://www.theses.fr/2005PA120009/document (accessed on 26 March 2021).
  39. Aubert, G.; Betremieux, R.; Bonfils, P.; Bonneau, M.; Boulaine, J.; Dejou, J.; Delmas, J.; Drouineau, G.; Duchaufour, P.; Dupuis, J.; et al. Classification Des Sols; Travaux CPCS 1963–1967; Commission de Pédologie et de Cartographie des Sols: Paris, France, 1967. [Google Scholar]
  40. IUSS Working Group WRB World Reference Base for Soil Resources 2014, Update 2015. International Soil Classification System for Naming Soils and Creating Legends for Soil Maps; World Soil Resources Reports; Food and Agriculture Organization of the United Nations: Rome, Italy, 2015; p. 192.
  41. Chatenet, B.; Marticorena, B.; Gomes, L.; Bergametti, G. Assessing the Microped Size Distributions of Desert Soils Erodible by Wind. Sedimentology 1996, 43, 901–911. [Google Scholar] [CrossRef]
  42. Labiadh, M.; Bergametti, G.; Attoui, B.; Sekrafi, S. Particle Size Distributions of South Tunisian Soils Erodible by Wind. Geodin. Acta 2011, 24, 39–49. [Google Scholar] [CrossRef]
  43. Marticorena, B.; Kardous, M.; Bergametti, G.; Callot, Y.; Chazette, P.; Khatteli, H.; Le Hégarat-Mascle, S.; Maillé, M.; Rajot, J.-L.; Vidal-Madjar, D.; et al. Surface and Aerodynamic Roughness in Arid and Semiarid Areas and Their Relation to Radar Backscatter Coefficient. J. Geophys. Res. 2006, 111, F03017. [Google Scholar] [CrossRef] [Green Version]
  44. Wieringa, J. Representative Roughness Parameters for Homogeneous Terrain. Bound. Lay. Meteorol. 1993, 63, 323–363. [Google Scholar] [CrossRef]
  45. Fryrear, D.W. A Field Dust Sampler. J. Soil Water Conserv. 1986, 41, 117–120. [Google Scholar]
  46. Panebianco, J.E.; Buschiazzo, D.E.; Zobeck, T.M. Comparison of Different Mass Transport Calculation Methods for Wind Erosion Quantification Purposes. Earth Surf. Proc. Landf. 2010, 35, 1548–1555. [Google Scholar] [CrossRef]
  47. Fryrear, D.W.; Saleh, A. Field Wind Erosion: Vertical Distribution. Soil Sci. 1993, 155, 294–300. [Google Scholar] [CrossRef]
  48. Gillette, D.A.; Pitchford, A.M. Sand Flux in the Northern Chihuahuan Desert, New Mexico, USA, and the Influence of Mesquite-Dominated Landscapes. J. Geophys. Res. 2004, 109, F04003. [Google Scholar] [CrossRef]
  49. Marsham, J.H.; Knippertz, P.; Dixon, N.S.; Parker, D.J.; Lister, G.M.S. The Importance of the Representation of Deep Convection for Modeled Dust-Generating Winds over West Africa during Summer. Geophys. Res. Lett. 2011, 38, L16803. [Google Scholar] [CrossRef] [Green Version]
  50. White, B.R. Soil Transport by Winds on Mars. J. Geophys. Res. 1979, 84, 4643–4651. [Google Scholar] [CrossRef]
  51. Zobeck, T.M.; Fryrear, D.W. Chemical and Physical Characteristics of Windblown Sediment I. Quantities and Physical Characteristics. Trans. ASAE 1986, 29, 1032–1036. [Google Scholar] [CrossRef]
  52. Gillette, D.A.; Fryrear, D.W.; Xiao, J.B.; Stockton, P.; Ono, D.; Helm, P.J.; Gill, T.E.; Ley, T. Large-Scale Variability of Wind Erosion Mass Flux Rates at Owens Lake 1. Vertical Profiles of Horizontal Mass Fluxes of Wind-Eroded Particles with Diameter Greater than 50 Μm. J. Geophys. Res. 1997, 102, 25977–25987. [Google Scholar] [CrossRef]
  53. Gillette, D.A.; Chen, W. Size Distributions of Saltating Grains: An Important Variable in the Production of Suspended Particles. Earth Surf. Proc. Landf. 1999, 24, 449–462. [Google Scholar] [CrossRef]
  54. Shao, Y.; Lu, H. A Simple Expression for Wind Erosion Threshold Friction Velocity. J. Geophys. Res. 2000, 105, 22437–22443. [Google Scholar] [CrossRef]
Figure 1. (a,b) Localization of the Dar Dhaoui Experimental Range (DDER) at the scale of Tunisia DDER (©Google Earth). (c) Localization of the two experimental plots in the DDER (©Google Earth). The letters T and M refer to the plot tilled with the tiller (Plot 1) and the moldboard (Plot 2), respectively. The red dots locate the positions of the meteorological mast: (33°17′35.30″ N; 10°46′56.81″ E) and (33°17′52.56″ N; 10°46′54.49″ E) for Plot 1 and Plot 2, respectively.
Land 10 00511 g001
Figure 2. Ploughing tools used during the field experiment: (a) the moldboard plough, and (c) the tiller plough and photographs of the corresponding parcels after tillage operations ((b) and (d), respectively).
Land 10 00511 g002
Figure 3. Example of the measurement of the geometric characteristics of the tillage ridges using the 2-meter long pin roughness meter in Plot 2.
Land 10 00511 g003
Figure 4. Schematic view of the experimental plots locating the instruments. Note that data from BSNE2 and BSNE5 were excluded from the present analysis. The tillage direction is perpendicular to dominant wind direction. Photos on both sides of the diagram represent the meteorological mast (a) and the BSNE mast (b).
Land 10 00511 g004
Figure 5. Soil size distribution and size distributions of the windblown sediments at different heights for the wind erosion event of 7–8 April 2008. Top: moldboard plot; bottom: tiller plot.
Land 10 00511 g005
Figure 6. Abundance (%) of the size class i averaged for the five wind erosion events as a function of height. (a) 100 µm ≤ di < 125 µm; (b) 75 µm ≤ di < 100 µm; (c) 50 µm ≤ di < 75 µm; (d) di < 50 µm. The square symbols indicate the abundance of the size class i in soil. Black symbols: moldboard plot; open symbols: tiller plot.
Land 10 00511 g006
Figure 7. Efficiency of the vertical transfer averaged for the five wind erosion events and for the different size classes as a function of height. (a) 100 µm ≤ di < 125 µm; (b) 75 µm ≤ di < 100 µm; (c) 50 µm ≤ di < 75 µm; (d) di < 50 µm. Black circles: moldboard plot; open circles: tiller plot.
Land 10 00511 g007
Figure 8. Ratio between the windblown sediment fluxes measured on the tiller plot (QT and QT30) to the windblown sediment fluxes measured on the moldboard plot (QM and QM30) for each of the five wind erosion events. Left: total windblown sediment fluxes; right: windblown sediment fluxes above 30 cm height. Means ( M ¯ ) over the five events and the corresponding standard deviations (σ) are indicated in both cases.
Land 10 00511 g008
Table 1. Mean of the percentage Pi, standard deviation σi, and median diameter di (in μm) of each population i constituting the mass size distribution of the 12 soil samples collected on the experimental plots.
TillerMoldboard
n = 8n = 4
Population 1Population 2Population 1Population 2
Pi (Mi/M)mean43%57%48%52%
standard deviation13131212
σimean1.381.081.411.08
di (µm)mean7310276101
standard deviation2432
Table 2. Main characteristics of the recorded wind erosion events. Event duration corresponds to the time during which wind speed is above the threshold velocity allowing wind erosion (7.47 m s−1 at 422 cm). Mean wind speed was computed over the event duration as defined above. DUP stands for Dust Uplift Potential. Standard deviation for the wind direction are reported in italics. PS stands for “Particle Sampler” and the associated number denotes the BSNE mast number (see Labiadh et al. [27] for details).
DateEvent Duration (min)Wind Speed at 422 cm (m s−1)Normalized DUP
(m3 s−3)
Wind Direction (°)Fetch (m)Wind Erosion Flux (g cm−1 event−1)
Plot 1—TillerPlot 2—MoldboardPlot 1—TillerPlot 2—Moldboard
MeanMaximumPS1PS3PS4PS6PS1PS3PS4PS6
23–24 March 20088028.7413.403.2281 (±28)113.7144.367.6153.267.633.47.58.6
27–28 March 20089129.2211.764.4299 (±24)140.3140.3140.8140.8127.431.98.710.9
7–8 April 20089809.7613.956.2264 (±19)53.4160.241.9125.8434.9295.518.362.2
20 April 20082069.3111.404.6242 (±11)34.4103.330.992.652.772.04.36.3
17–19 May 20088588.6110.202.6262 (±14)50.5151.540.3121.059.356.56.99.0
Publisher’s Note: MDPI stays neutral with regard to jurisdictional claims in published maps and institutional affiliations.

