4.1. Main Findings
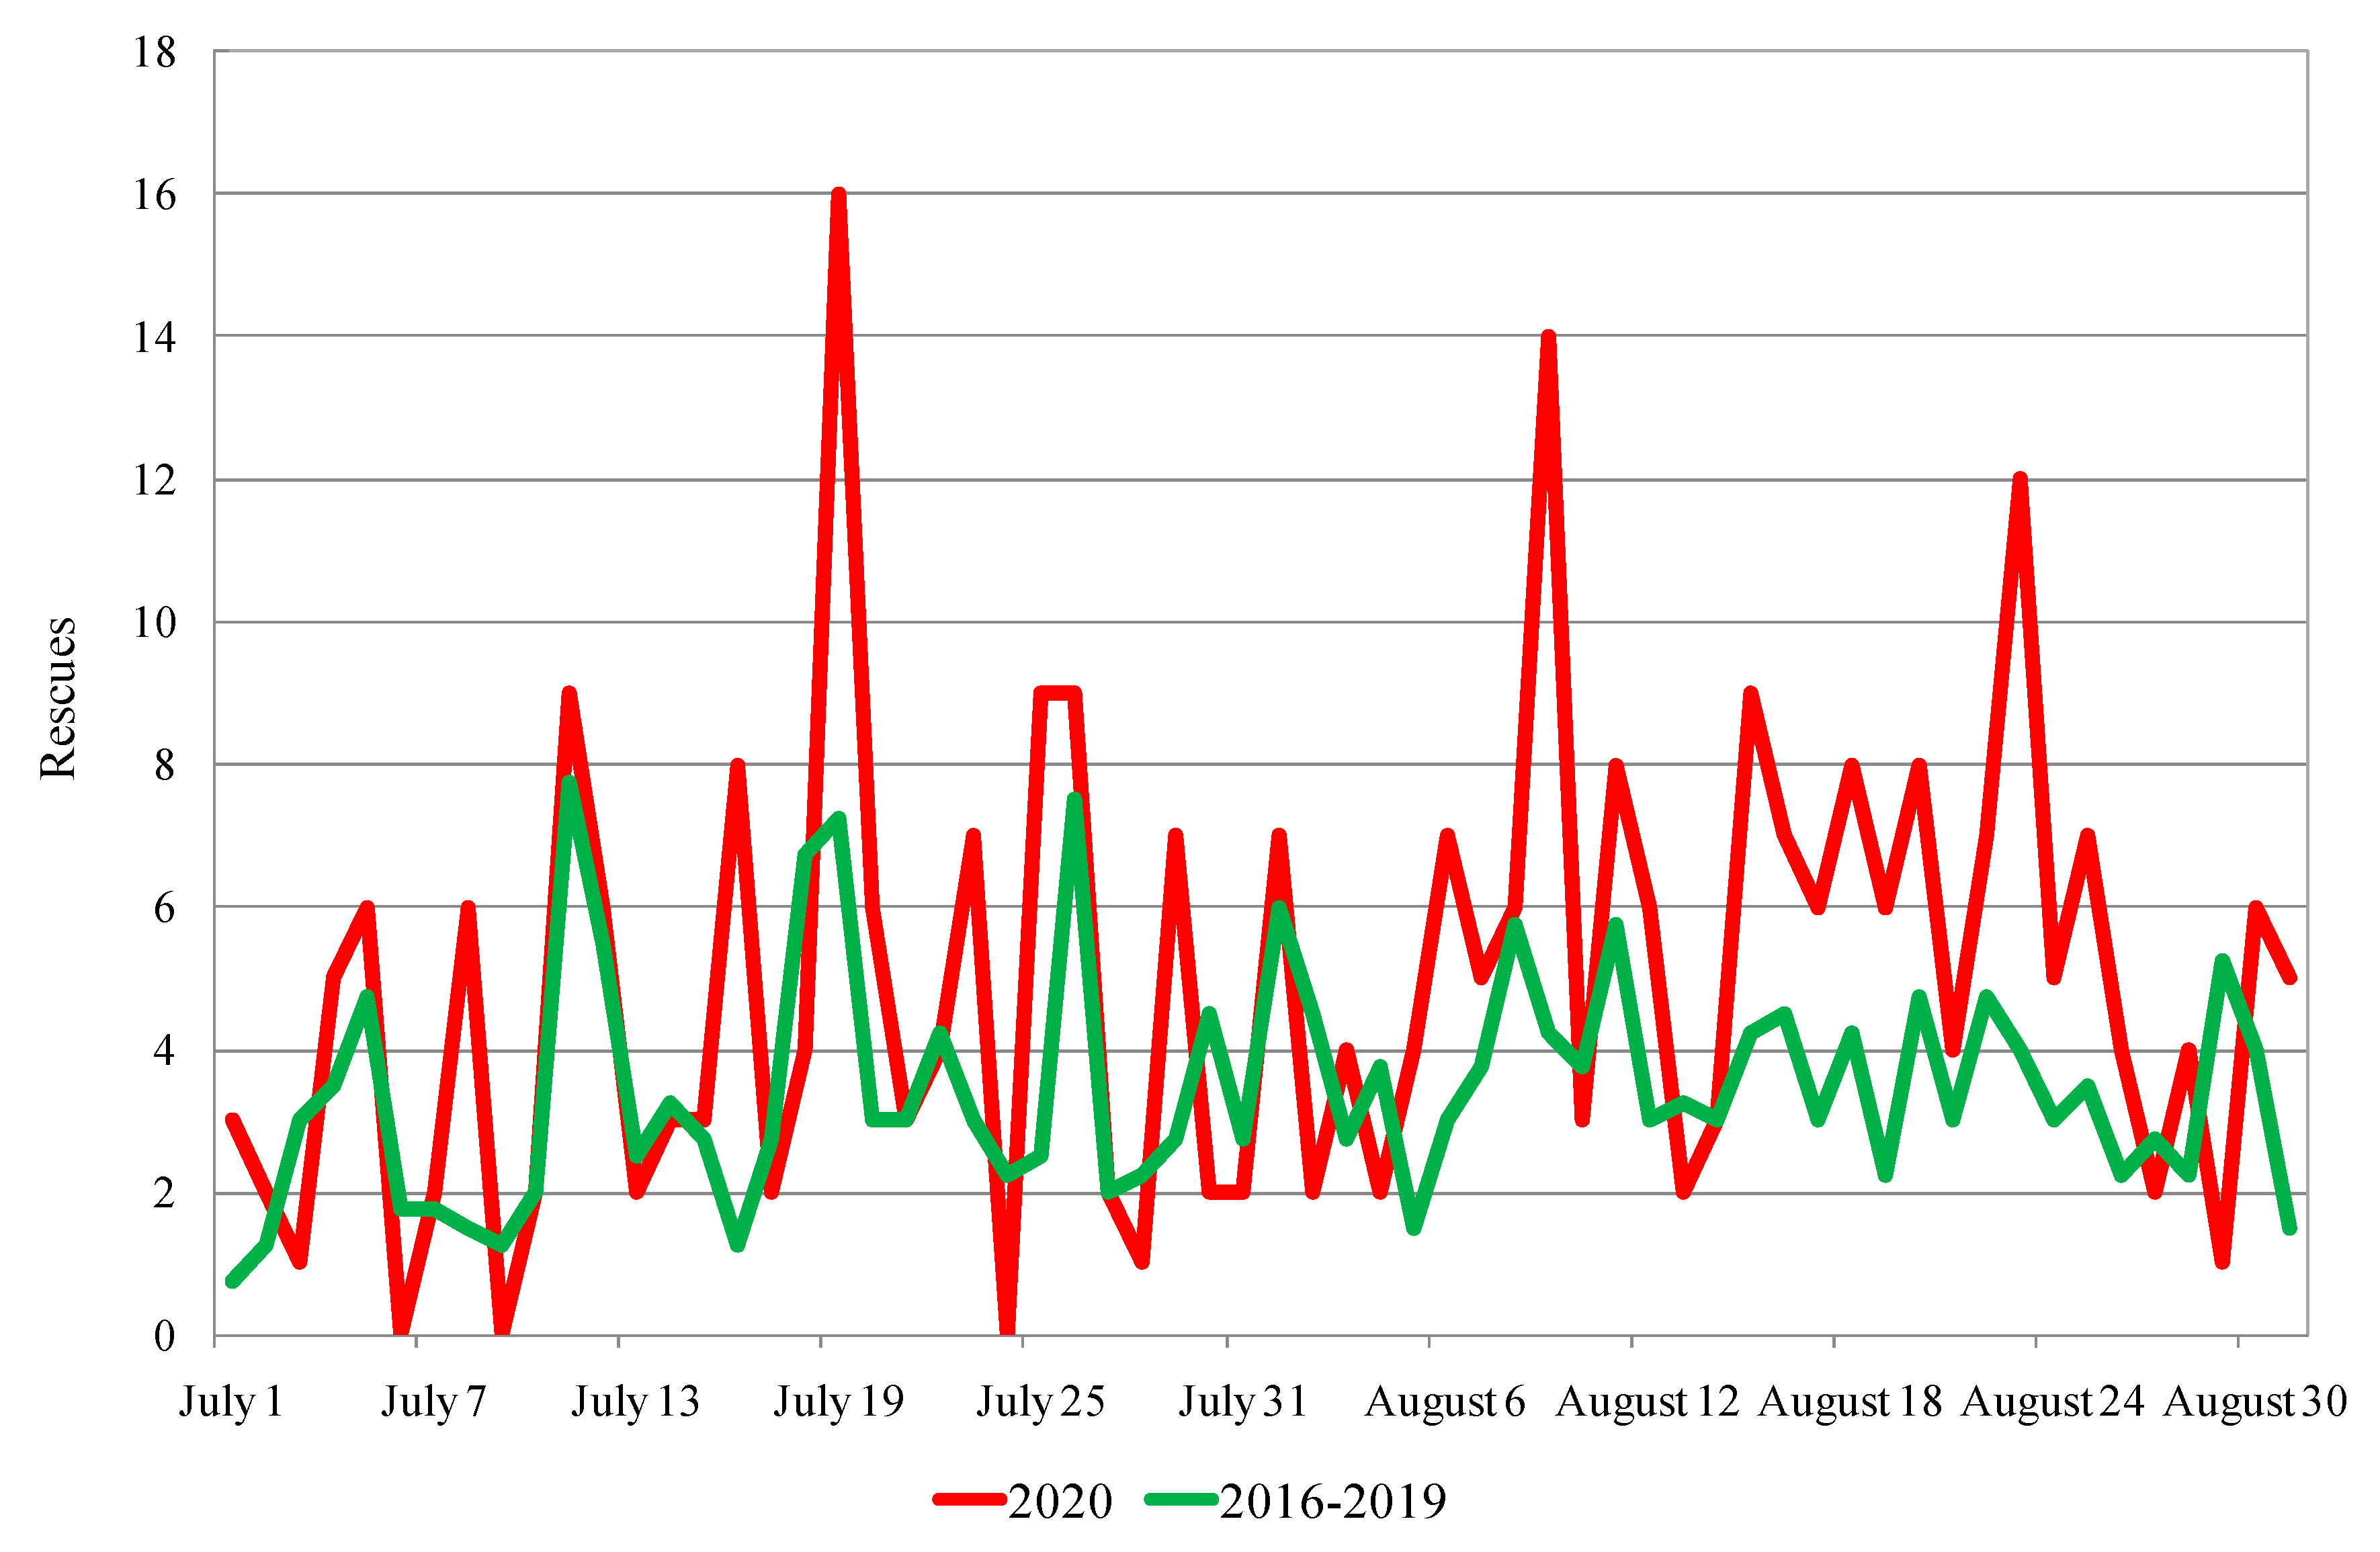
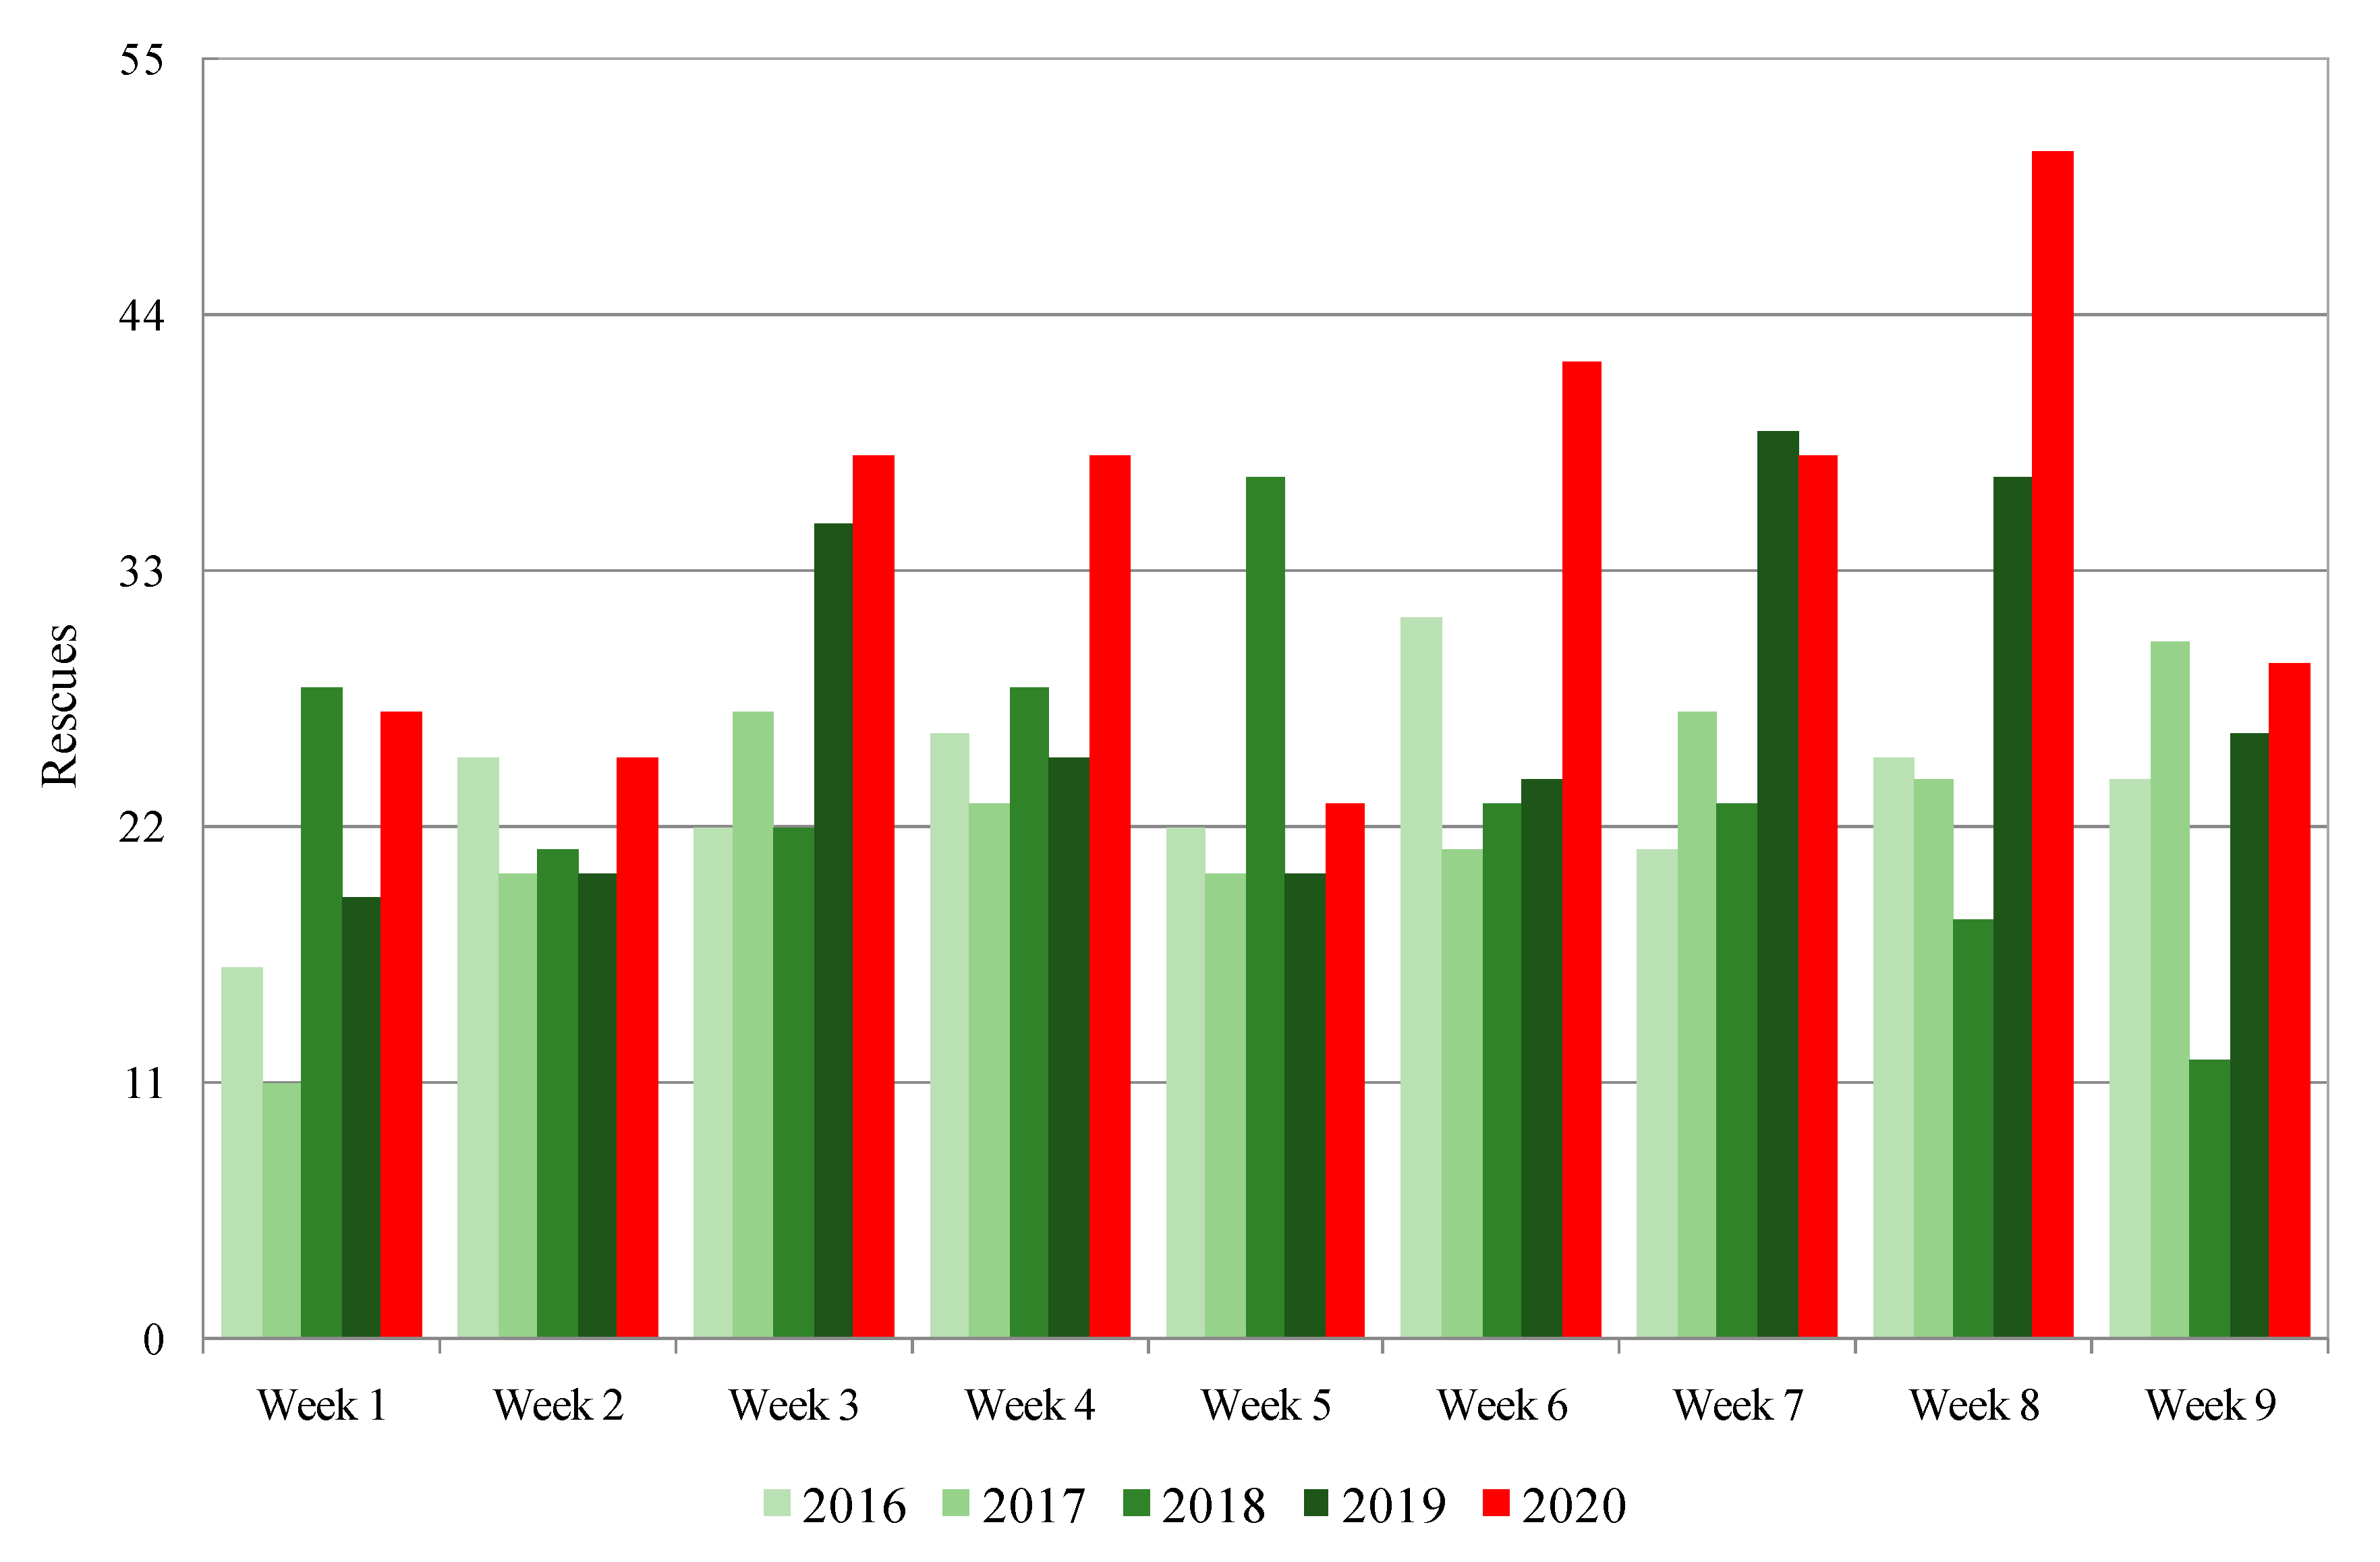
Our findings show that the number of rescues undertaken by the Catalan Fire Department in July and August 2020 increased significantly compared to the same summer period corresponding to the four previous years. While the number of these kinds of rescue may vary from year to year, the considerable difference noted between the study period (July and August) in 2020 and the equivalent period in 2016–2019, with an increase of almost 40% and an incidence of almost five rescues per day, could mainly be attributed to the reconfiguration of leisure mobilities due to COVID-19. To be more precise, it would seem related to the June 21 revocation of the initial period of lockdown, which had been decreed by the Spanish Government three months earlier, and also to the relaxation of some of the restrictions on mobility, enforced to combat the spread of COVID-19.
In Catalonia, natural areas received larger numbers of visitors than before in the summer of 2020 [
52]. This was partly because some mobility restrictions remained in force (i.e., mobility to the rest of Spain and other countries) and because people were trying to avoid what would usually be crowded destinations. Natural areas were perceived as safer than, for example, coastal destinations in terms of the risk of COVID-19 contagion. One of the consequences of this was an increase in emergency service activity to rescue people in natural areas. The growth in the number of people visiting these areas also increased the probability of them having accidents there [
15,
18,
53,
54,
55]. Undertaking activities in natural areas often involves a certain element of risk.
The reasons for accidents (human, environmental, etc.) have already been analyzed in some depth in the literature [
9,
13,
14], and accidents are more likely when people visit natural areas that they do not know well (due to inappropriate preparation, etc.). However, activities such as climbing are very different from others such as hiking, and when accidents occur, their consequences may include a wide range of injuries, or even death [
59,
60,
61,
62].
Regarding the temporal distribution of rescues, the number increased in both July and August 2020, but it was twice as high as in the latter. The potential number of visitors to natural areas was greater in August than in July because most Catalan people have their holidays in August. Catalonia also tends to receive a huge number of tourists from the rest of Spain and other countries in summer, especially in August. Nevertheless, many Catalan people normally spend their holidays outside Catalonia, or at other Catalan destinations, particularly on the coast, participating in activities where the probability of needing to be rescued is low. The number of both international tourists and those from other parts of Spain fell in August 2020, but so also did the stream of Catalan residents traveling outside Catalonia and/or visiting other Catalan destinations considered “less safe” in terms of potential COVID-19 contagion. The result was an increase in the number of visitors to protected natural areas, but also to natural areas with no protection status in the summer of 2020 and, especially, in August of that year. There was consequently a significant increase in the number of rescues undertaken by the Catalan Fire Department. The greatest increase in rescues occurred in August rather than July, and this is also shown by daily and weekly distributions.
The number of rescues increased both at weekends and on weekdays, and the differences between them also increased in terms of daily rescues. The increase in rescues at weekends was greater in July than in August, and greater on weekdays in August. Natural areas probably received more visits (daily average) at weekends than on weekdays in July because many people would have been working rather than on holiday in that month. On the other hand, despite the average number of daily rescues being greater at weekends in August than on weekdays, the difference between the two was smaller than in July because many people decided to visit a natural area on a weekday due to the previously mentioned restrictions on mobility and/or perceived health risk/safety.
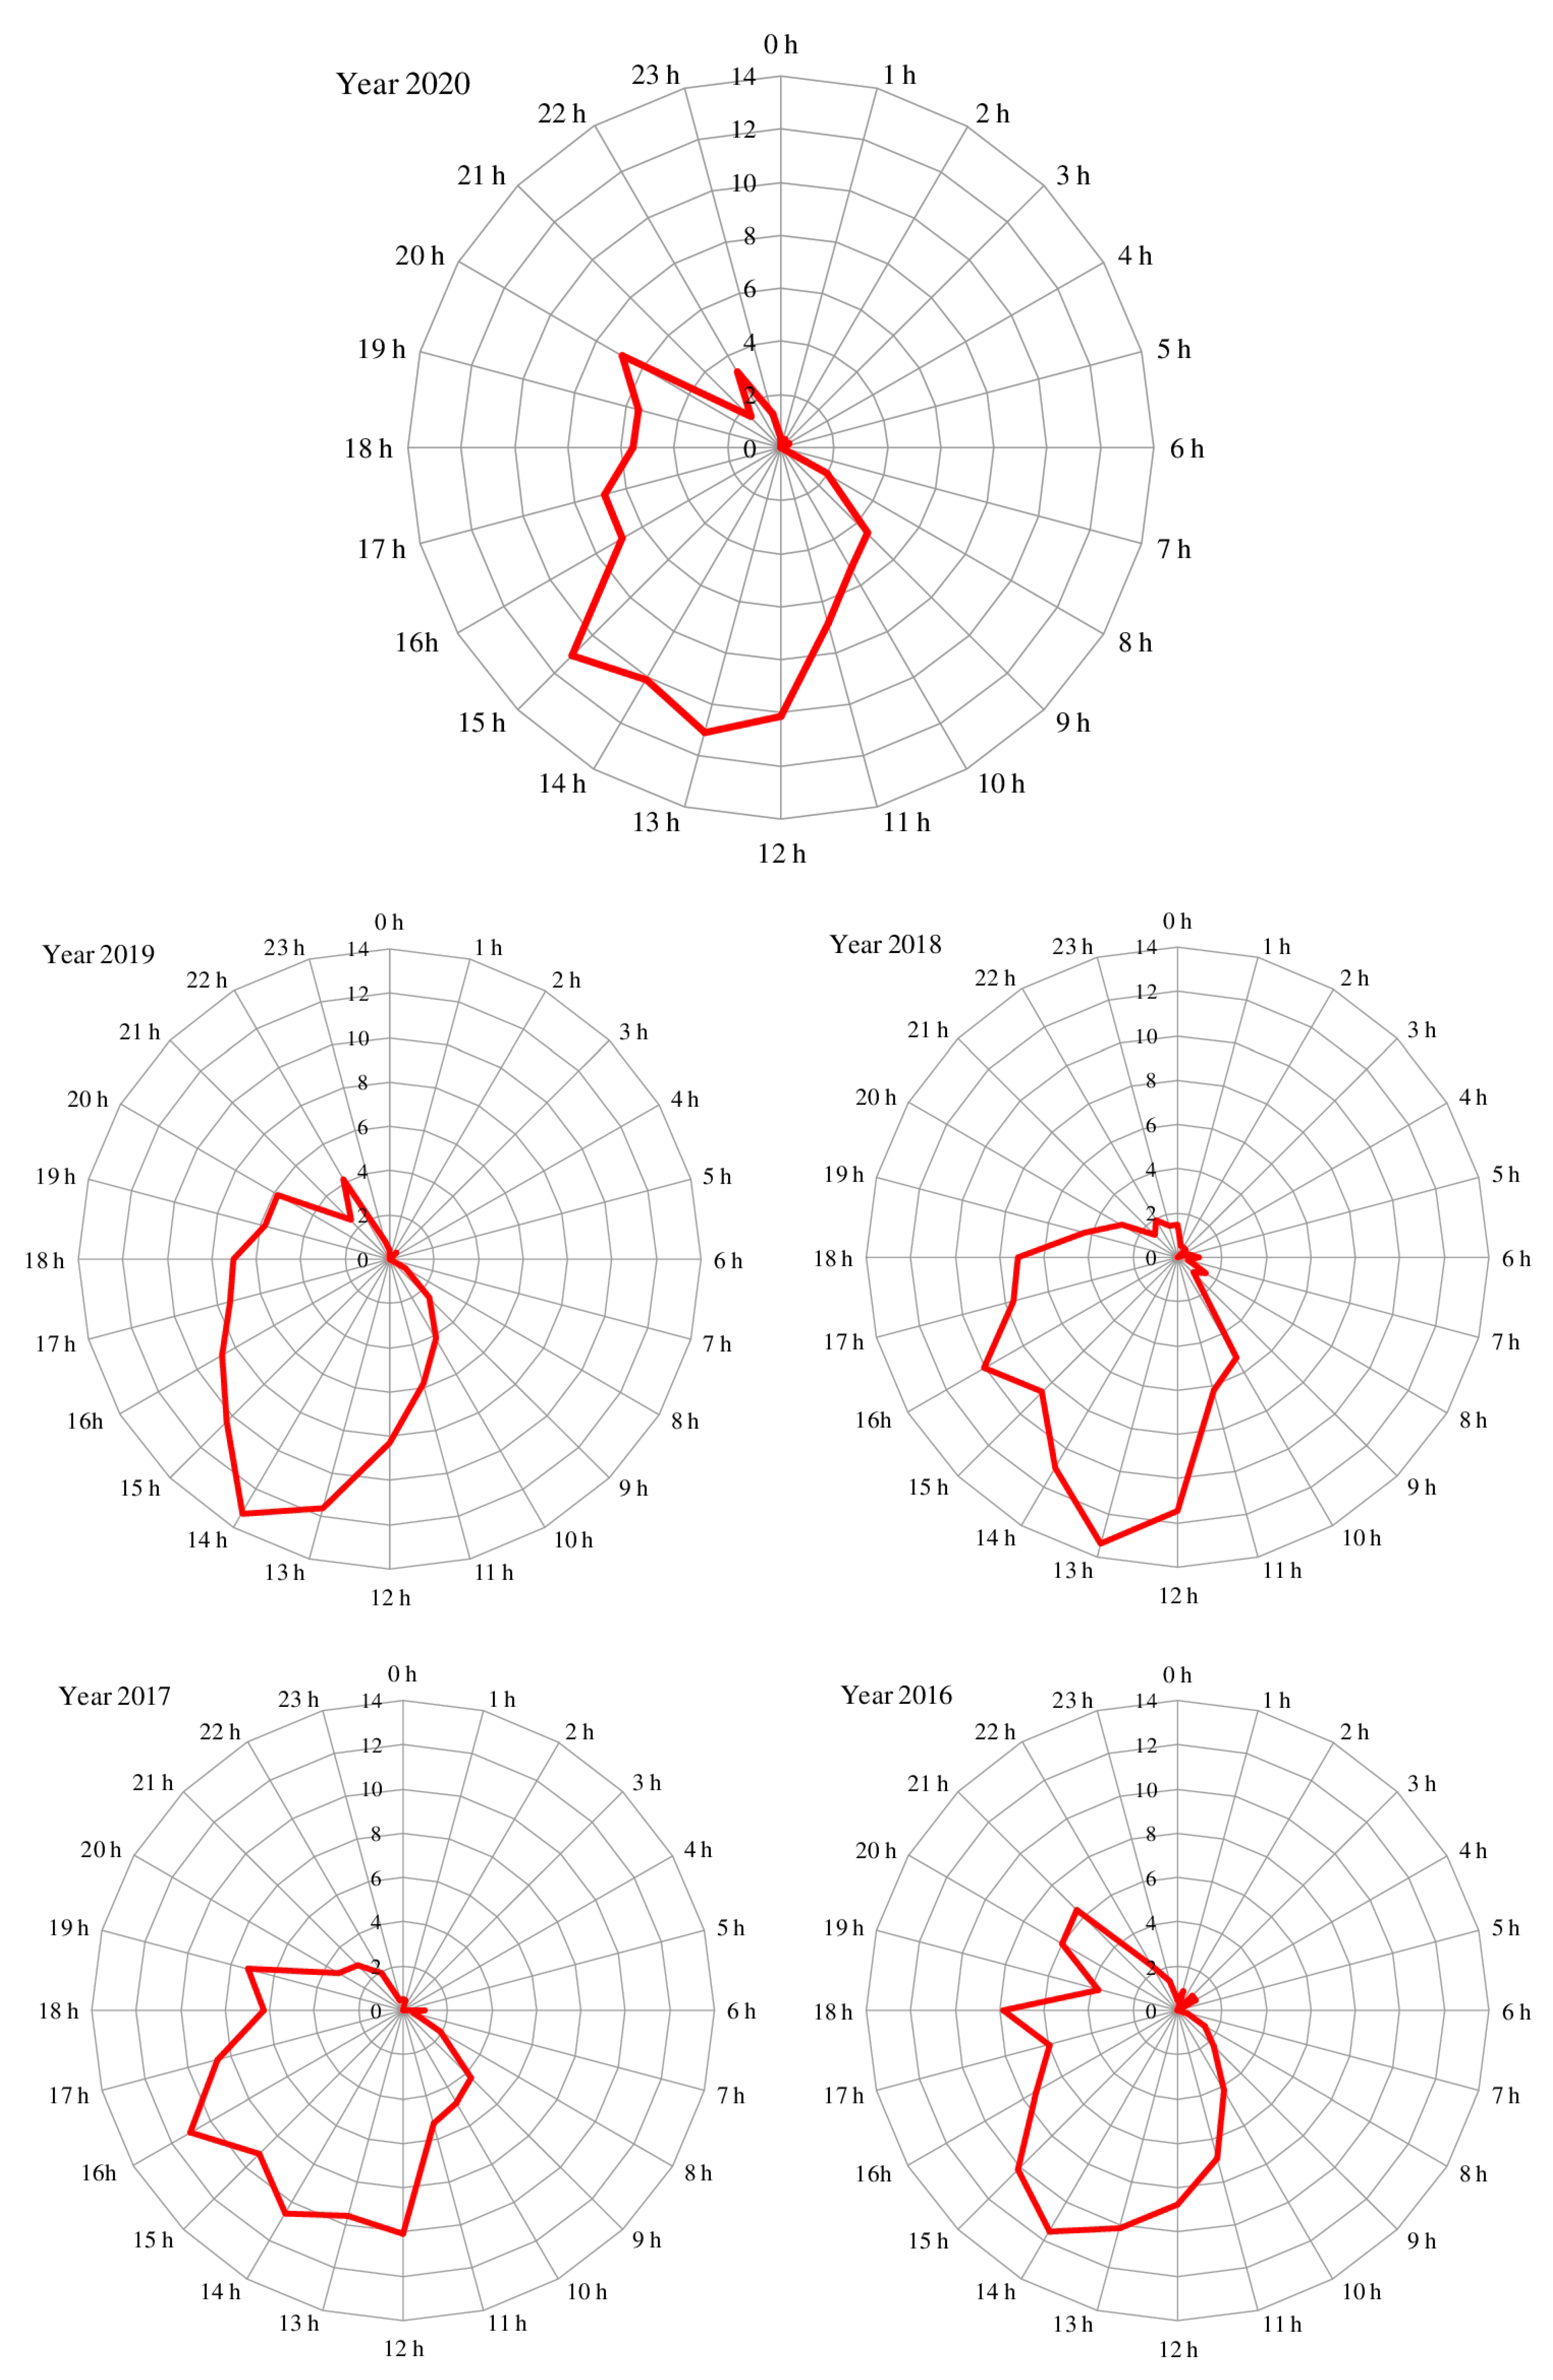
The number of rescues also increased in each of the four timeslots we defined. However, this increase was by around 25%–40% in three of them, but by more than 80% when the rescue started at between 06.01 and 11.00. This could perhaps be explained by the fact that many people would have visited natural areas near where they lived. They would therefore have been able to arrive at their chosen destination earlier than it had been located farther away. Nevertheless, the rescues performed during that timeslot represented fewer than 15% of the total. Half of these occurred between 11.01 and 16.00 in both 2020 and the period 2016–2019.
The distribution of rescues according to altitude showed increases for all five of the thresholds defined. Nevertheless, there was a clear pattern revealing a greater increase in the number of rescues with decreasing altitude, with around 80% in the lowest altitude band (<500 m ASL) but one of only 6% above 2000 m ASL, comparing data for 2020 with 2016–2019. The surface area over 1000 m ASL represents only 20% of the total but accounted for 39% of the rescues carried out. The number of rescues performed by the Catalan Fire Department at high altitude locations remained more stable. This was probably because most of the “new visitors” to natural areas chose places near where they lived. The highest summits are located far away from the most populated areas. However, people can also perform some risky activities at low altitudes, and a lack of preparation implies an increased degree of risk. Furthermore, an excess of confidence can lead to an accident, regardless of the activity or the altitude/orography.
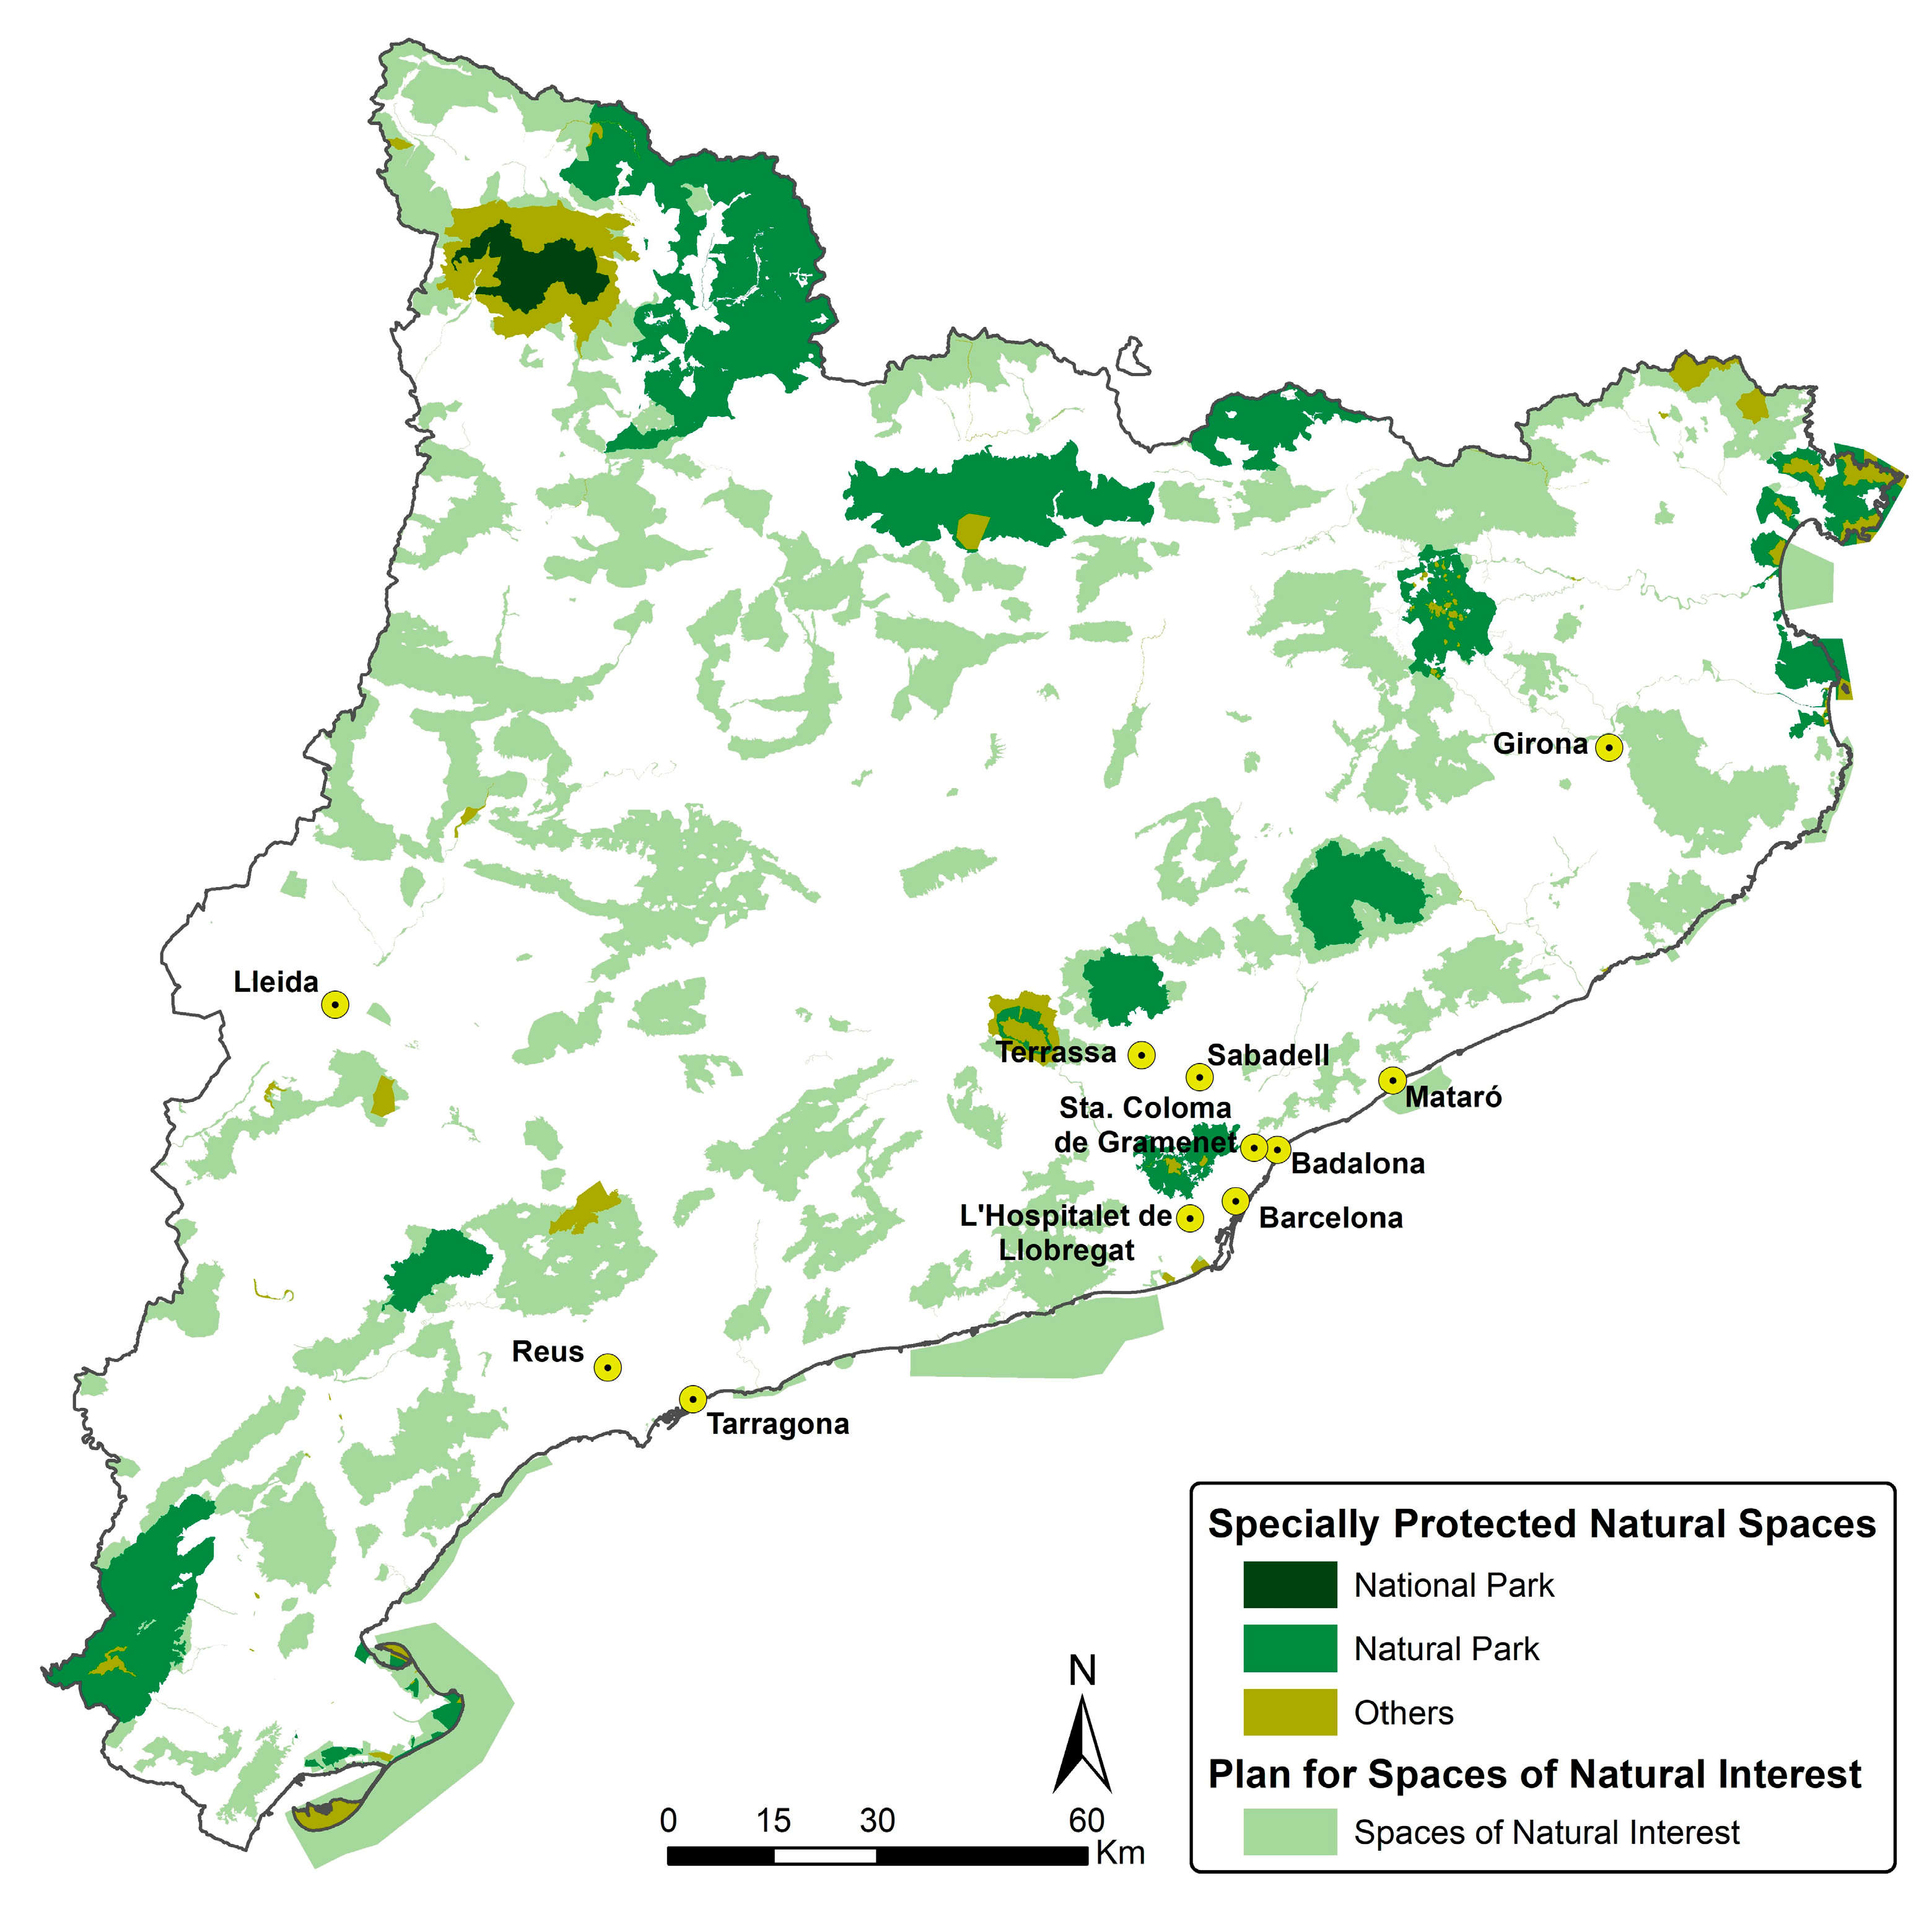
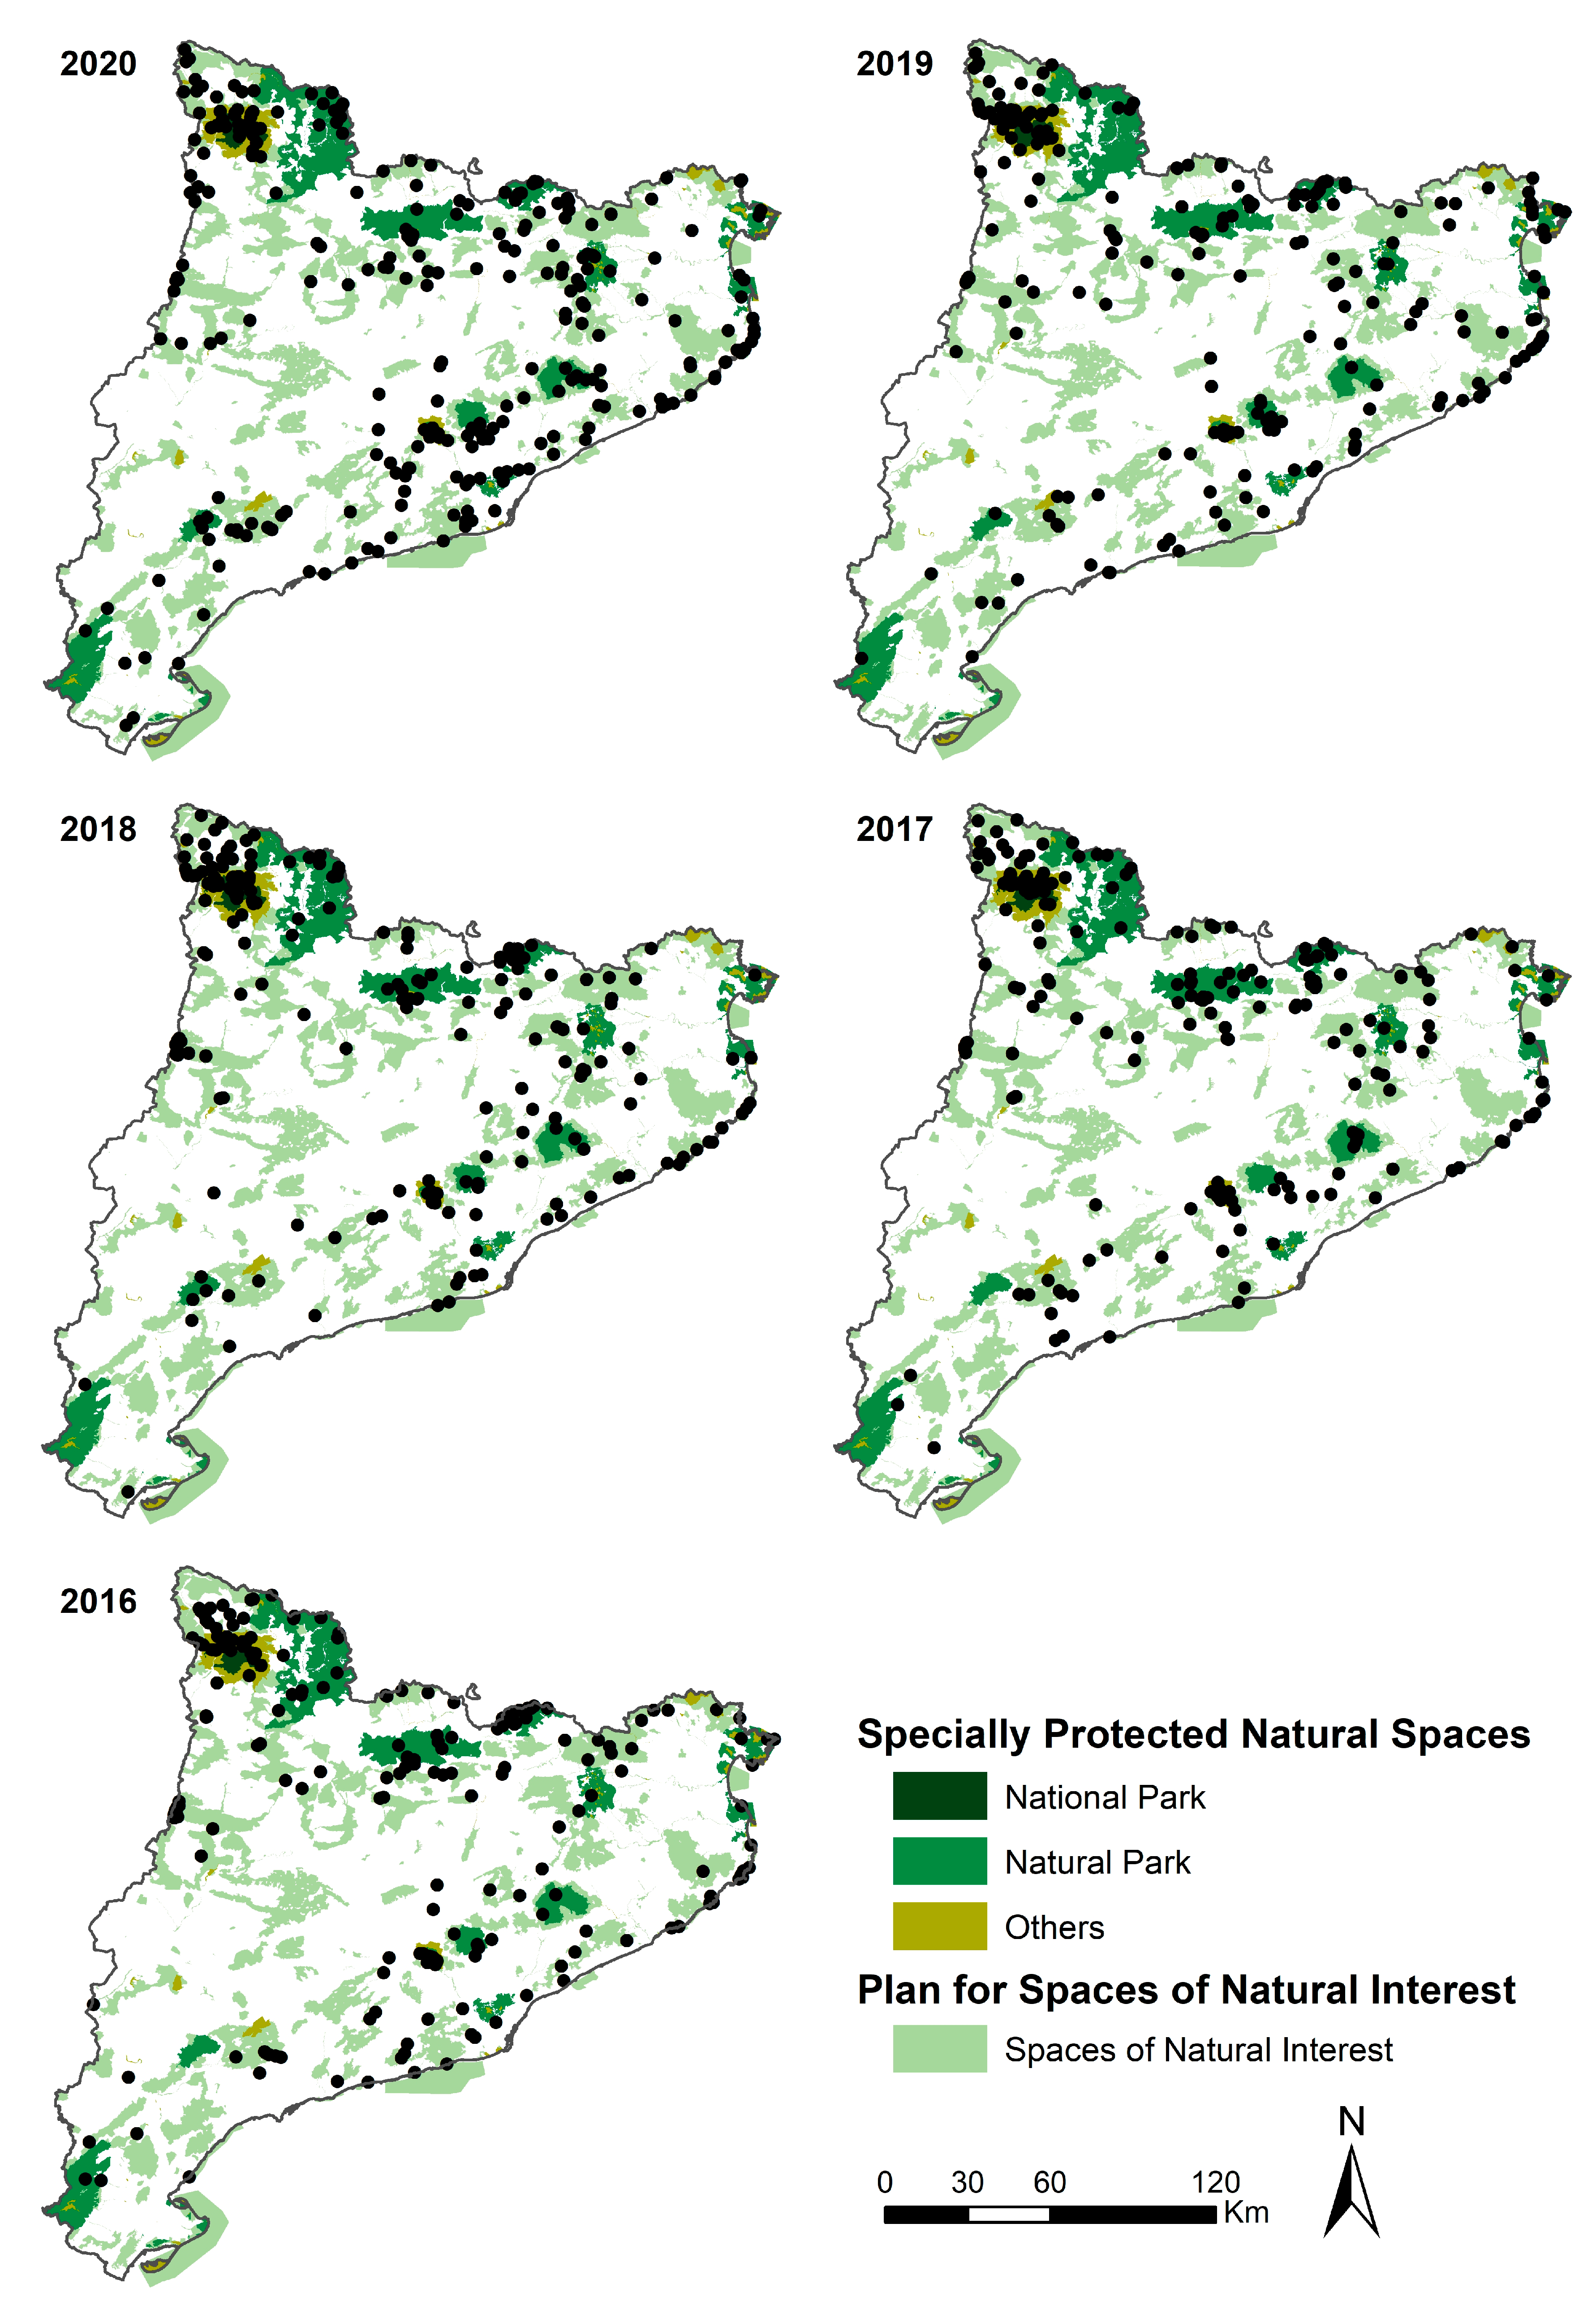
The number of rescues also increased in all three categories based on protection status: Specially Protected Natural Spaces (SPNS), Spaces of Natural Interest (SNI), and other natural areas. The numbers were very similar in the cases of SPNS and SNI (+20%), but significantly different for the third category, in which the number of rescues rose from 68 in 2016–2019 to 124 in 2020 (+80%)—the highest number in any of the three categories. However, the total surface area corresponding to the SPNS is almost 3200 km2 and that of the SNI is 7100 km2. This implies one rescue for every 30 km2 and 95 km2, respectively, while Catalonia has a total surface area of around 32,000 km2 (including urban areas).
The analysis of the spatial concentration of rescues shows how the Pyrenees (in the highest altitude category), and especially the western part of the Pyrenees, where the Aigüestortes i Estany de Sant Maurici National Park is located, remains the area with the highest concentration of accidents. The mountainous area (Pre-littoral chain) surrounding the Metropolitan Area of Barcelona (with its high population density) has emerged as a second hotspot. This area includes several Natural Parks and SNI but also other natural areas with no official protection status. The key role played by urban areas, especially the Metropolitan Area of Barcelona, but also the Metropolitan Area of Tarragona-Reus, is reinforced when we analyzed the distribution of rescues according to distance to the nearest town with over 100,000 people. There were increases for all three of the thresholds defined. Nevertheless, there was a clear pattern revealing a greater increase in the number of rescues with decreasing distance, with around 75% in the lowest distance (<50 km) when comparing data for 2020 with 2016–2019.
4.2. Limitations
This research does, however, have several limitations. We could not perform an in-depth analysis into the relationship between the increase in the number of visitors to these natural areas and the increase in the number of rescues. Most of the protected natural areas in Catalonia received more visits in 2020 than in 2019, but there was a decrease in visits to others [
52]. Unfortunately, there are no data available to quantify the increase for the whole territory. Data about visitors are limited to certain protected natural areas and, in some cases, the available data are not updated to the internet. We cannot therefore assert that the increase in the relative number of rescues has been either higher or lower than in the relative number of visitors.
Other divergences emerge when we compare the increase in the number of visitors and rescues associated with a concrete protected natural area. For example, the Aigüestortes i Estany de Sant Maurici National Park had a greater increase in the number of visitors than in the number of rescues, while just the opposite occurred at the Alt Pirineu Natural Park. Difficulties involved in establishing a pattern are more evident in the SNI, and other natural areas, where no estimation of the number of visitors is made. The number of rescues has increased significantly in some SNI, such as Muntanyes de Prades. We know that the number of visitors also increased, but by means of indirect sources, meaning we cannot quantify the increase.
Other limitations relate to the data about rescues. These include, for example, the lack of available information about: (1) the sociodemographic profiles of those rescued (age, sex, origin, etc.); (2) the number of people rescued in each rescue event; (3) the activities that the visitors were involved in before they needed to be rescued; (4) the number of people who were injured or died on a daily basis; and (5) the types of injury suffered.
4.3. Implications and Future Research Lines
Our data allowed us to achieve the objectives established in the introduction, and the results obtained could be of interest to emergency service managers, managers of protected natural areas, and public authorities. An increase in the number of rescues could compromise the efficiency of the emergency services if they were to occur simultaneously, especially if they required aerial support. This may make it necessary to increase or redistribute the resources currently available. Efficiency of the emergency services is even more compromised in the case of natural mountain areas. The complex orography and lack of suitable roads delay the answer of the terrestrial resources. Vehicles cannot reach where an accident took place. The orography and the presence of trees can also make the work of the aerial resources difficult. It is not possible to build an unlimited number of roads or provide suitable areas for helicopters, especially in protected natural areas, but the existing roads and suitable areas for helicopters have to be conveniently marked to facilitate the management of an emergency. At the same time, the efficiency of the emergency services improves if injured people can be quickly located utilizing their cell phones or GPS. Visitors to natural mountain areas can prevent or, at least, minimize the risk of suffering an incident if they are appropriately equipped (clothes, footwear, sufficient water, and food) including a cell phone [
13]. The area should have good internet signal, which is not guaranteed in some mountain or remote area. These are not, however, the only implication for the Catalan Fire Department. Most wildfires occur in the summer, especially in the mountain chain that runs parallel to the coast (the Pre-littoral chain), which is near some of the most populated areas of Catalonia. Wildfires have also begun to pose a threat in the Pyrenees, partly due to climate change [
63,
64]. The summer of 2020 was exceptional in that there were relatively few wildfires and only a small, burned surface. However, having more people enjoying outdoor activities in natural areas increases the risk of both wildfires and people being trapped. It is therefore necessary to redefine the strategy used to fight against wildfires.
The increase in the number of rescues was linked to the increase in the number of visitors to natural areas. Several factors influence the number of visitors to a determined natural area, whether it is protected or not. These include both external and internal factors relating to conjunctural and structural situations. The end of the COVID-19 lockdown, restrictions to visit other destinations during the summer of 2020, and the perception of natural areas as safe places in terms of contagion were three external factors. A set of people who accessed the natural areas were unprepared to be in outdoor environments, and thus were more likely to have an accident. Undertaking a detailed analysis of each of the natural spaces, especially the protected ones, is therefore necessary. This must take into account their individual characteristics (high or medium-height mountains, wetlands, plateau, rocky coast, etc.) and the activities that can be enjoyed there, but also where they are located in terms of distance from the main populated areas and their connectivity and accessibility.
Although we could not determine the correlation between these two variables, we can assume that, as more people visit natural areas, the risk of them having accidents will increase, and some of these accidents will require the attention of the emergency services. The managers of protected natural areas had to face the sudden arrival of a large contingent of visitors in the summer of 2020. This could have had a negative impact on the natural resources of the protected areas by exceeding their carrying capacity. The managers of protected natural areas have to implement preventive measures to protect natural resources, but also to take appropriate action to prevent accidents [
13,
65].
A relevant question would be: do the managers of protected natural areas have sufficient budgets, staff, and infrastructure to provide appropriate answers to these challenges? One possible strategy to protect natural areas would be to restrict access to them. The threats and challenges are greatest when the protected natural area in question does not have a management team (or a budget or regular staff). A second relevant question would be: is this a one-off phenomenon that will be limited in time, or will it remain relevant in the future?
Managers of protected natural areas and environmental administrations, at the national, regional, and local levels, must design and apply short- and medium-term strategies adapted to the possible answers to the previous question. These questions open the way to new and more ambitious research involving all of the previously mentioned stakeholders, and focus on both the increase in the number of visitors to natural areas and the accidents that occur in them.


