Abstract
National parks are important natural reserves of high ecological value, and the visual perception of national park landscapes is closely tied to the degree of protection that the natural resources within national parks receive. Visual cognition has a direct impact on public consciousness and plays an increasingly important role in national park management. Most techniques and methods previously used to study visual behaviors are subjective and qualitative; objective and quantitative studies are rare. Here, we used the eye-tracking method to study the visual behaviors of individuals viewing landscapes within the Qianjiangyuan National Park System Pilot Area to assess the visual and psychological mechanisms underlying public perception of different landscapes. The effect of landscape type on visual behaviors was greater than that of color diversity and degree of spatial confinement and was mainly related to the characteristics of landscape elements. The public preferred recreational and forest landscapes with high ornamental value, whereas rural and wetland landscapes tended to be neglected given that perception of these landscapes required additional information to facilitate interpretation. When landscape colors were uniform and landscape spaces were more confined, the fixation duration was longer, and instant attractiveness was stronger. The effects of subject background on behavioral preferences were examined. Females were more interested in the whole landscape, whereas males focused more on the parts of the landscapes with prominent humanistic architectural features, complex colors, and open space. Art students generally preferred landscapes with strong humanistic attributes, whereas students majoring in forestry preferred landscapes with strong natural attributes.
1. Introduction
National parks were born out of a change in the aesthetic appreciation of nature in Europe and the United States in the first half of the 19th century. They are managed by countries to aid biodiversity conservation and are highly valuable for the ecosystem services that they provide [], including provisioning, regulating, supporting and cultural ecosystem services (such as aesthetic, spiritual, and recreation). National parks in China started late and are currently in the exploratory stage, facing various problems including the fragmentation of cross-regional management, uncertainty in the value of ecological assets, and lack of ecological compensation. In order to build a unified, standardized, and efficient national park system with Chinese characteristics, 10 pilot areas of the national park system have been established. Recently, an increasing number of studies have examined the complexity and systematic nature of national parks []. These studies have shown that national parks cannot be effectively managed when the ecological value of natural resources is made the exclusive focus of management efforts [], as the perception of the public and the form of public participation also have significant effects on the system construction of national parks [,]. Consequently, an increasing number of landscape studies are examining human perception, with a focus on natural elements and the study of the physical perception and psychological cognition of the public [,,,]. This is consistent with contemporary ecological studies emphasizing the need for human and cultural activities to be integrated into ecological studies to ensure compatibility between humans and nature [,,] and reflected by the themes of major conferences, such as the 100th anniversary of the British Ecological Society. Landscapes in national parks not only embody ecological, cultural, and social functions but also have significant visual features and aesthetic value. The visual features and aesthetic value of national parks are the product of the specific historical stage and social civilization, and are based on the ecological value. The evaluation of visual features and aesthetic value needs to ensure the extensive participation and perception of the public []. Most studies of national parks have had an ecological focus. However, with the development of science and technology, there is growing interest in the study of humans and their perception, visual behaviors, and perception of national park landscapes [].
In China, ecological protection is the primary but not the only objective of national parks. According to existing studies [], aesthetically pleasing landscapes tend to receive greater protection compared with less aesthetically pleasing ones regardless of their ecological value. In other words, the aesthetic value of a landscape is tied to its degree of ecological protection. However, this relationship has not been given thorough consideration in the context of ecosystem management [,]. The aesthetic value of landscapes in national parks is based entirely on human perception, but the perception of landscapes can also be affected by human activities. Most of the challenges associated with the management of national parks stem from the fact that there are often multiple, opposing management goals. These goals are generally associated with the different ecological functions sought by different stakeholders. For example, the purpose of leaving branch fragments after cutting wood is to promote forest regeneration, but many perceive a landscape with wood fragments as messy and dirty, which affects the psychological perception of national park visitors []. Hence, the effect of national park landscapes on public visual behaviors and cognitive processes, public preferences of different characteristics, and the incorporation of human landscape perception into national park ecosystem management are both outstanding scientific problems in current landscape research as well as practical problems for the management of national parks.
The idea of visually evaluating landscapes was first proposed in the 1900s. A variety of approaches can be used, including expert, psychophysics, cognitive, and experiential approaches. The subjective psychophysical approach [], including scenic beauty estimation, the law of comparative judgment, and semantic differentiation (SD), is the most widely used. Most recent studies have examined the factors affecting visual quality [], the relationship between landscape pattern indexes and visual quality [], and the visual quality of forest landscapes [,]. Most studies have conducted visual quality evaluations on the landscape scale and community scale; by contrast, few studies have evaluated the most important sensory dimensions. Visual behavior is the behavior generated when people watch or observe the external environment, including a series of complex visual information processing such as searching, discovering, distinguishing, identifying, confirming, and memory searching []. Visual behavior analysis is an important content of visual quality evaluation. It has been used as an important index to measure the effectiveness of the construction of national park and has become an interdisciplinary subject that has received wide attention. Recent research based on the theoretical principles of psychology has explored landscape visual perception [], but the objectivity and accuracy of evaluations could be improved through the use of more advanced methods and technology. This is the main deficiency of current research. The eye-tracking test mainly explores viewers’ inner psychological activities or cognitive processes by recording and analyzing their eye movement during observation []. This technology is widely used in psychology, advertising, industrial product design, and other fields and has been gradually applied to the fields of urban planning and ancient villages; an increasing number of studies have also studied differences in the visual behaviors among different stakeholders [,]. However, few studies have examined the visual behaviors of individuals in the context of national parks. The eye-tracking analysis method is a powerful landscape research tool. To a large extent, eye-tracking indexes can effectively reflect the subjective feelings of the public when observing the national park landscape and objectively measure the visual behavior characteristics of the public. For example, Nordh et al. studied the impact of urban landscape on the recovery of public attention through eye-tracking technology []; Zhang used the eye-tracking analysis method to explore the objective effects of forest visual landscape and forest soundscape on human physiology []; and Dupont et al. applied this technique to the field of participatory planning and design and explored the influence of professional knowledge on visual perception [].
Here, we analyzed the visual information processing of the landscapes of Qianjiangyuan National Park System Pilot Area using the eye-tracking test. This study provides a visual assessment of the national park landscape at a micro scale (i.e., immersing oneself in the park and observing the nearby landscape). We conducted tests to explore the effect of national park landscapes on visual behaviors. In addition, we studied the effect of subject background on visual behaviors and characterized the visual and psychological mechanisms underlying the perception of national park landscapes. In summary, four hypotheses are proposed in this study: (1) Different landscape types affect public visual behavior; (2) different color diversities of landscapes affect public visual behavior; (3) different degrees of spatial confinement of landscapes affect the public visual behavior; (4) group characteristics affect the public visual behavior.
2. Materials and Methods
2.1. Background
The Qianjiangyuan National Park System Pilot Area (hereafter referred to as the “Pilot Area”) is one of the 10 pilot national parks that was approved by 13 government departments (e.g., the National Development and Reform Commission of China) in 2015. Located in Western Zhejiang Province (28°54′–29°30′ N, 118°01′–118°37′ E) and at the junction of Zhejiang, Anhui, and Jiangxi Provinces, the Pilot Area has an area of 252 km2 (Figure 1). The Pilot Area is a nationally important area for ecological preservation and water conservation and consists of the former Gutianshan National Nature Reserve, the former Qianjiangyuan provincial scenic spot, and the former Qianjiangyuan National Forest Park, including the ecological areas within these reserves (mostly ecological public welfare forests). The Pilot Area has the world’s most well-preserved large-scale low-altitude mid-subtropical evergreen broad-leaved forest, which is a typical transitional zone linking plants of Southern and Northern China. The Pilot Area features one of the world’s few large areas of pristine natural secondary forest and a natural ecosystem representative of the local region. The Pilot Area covers the Suzhuang, Changhong, Hetian, and Qixi townships, including 19 administrative villages and 72 natural villages, and has a total population of 9744. The Pilot Area is not only rich in natural ecological resources, but the residents of local communities also contribute agricultural and forestry products unique to East China; in addition, local cultural traditions are important among the local villagers. Thus, the Pilot Area has the characteristic features of the local natural and cultural heritage.

Figure 1.
Location of the Qianjiangyuan National Park System Pilot Area.
2.2. Method
This study employed the eye-tracking test method, semantic differential method (SD method), and K-means clustering algorithm.
The eye-tracking test is a method to infer the psychological process of the subjects by recording and analyzing their eye movement data []. In this study, a Tobii eye tracker was used to capture and record eye-tracking data of subjects viewing pictures of landscapes. Visual analysis was then conducted, and the visual behavior mechanism of the subject was examined.
The SD method is a psychological measurement method proposed by American psychologist Charles Egerton Osgood (1916–1991), in which a psychological score of the subjects is obtained by allowing them to report their perceptions on a verbal scale. The SD method often selects multiple pairs of adjectives to represent the psychological feelings of the evaluation project, which is conducive to the quantitative evaluation of color richness and spatial airtightness in this study []. In this study, landscape color and landscape space of national parks were evaluated using the SD method with a five-point Likert scale (2, 1, 0, 1, 2). A score of 2 shows that the participants prefer the right adjective, while a score of -2 indicates that subjects more frequently chose the adjective on the left (Table 1).

Table 1.
Evaluation items and description of SD method.
The K-means clustering algorithm is a clustering analysis algorithm and an iterative solution method; the goal is to find a cluster center that represents a particular region of the data. The K-means clustering algorithm was used to classify the Pilot Area landscapes according to different classification standards. According to landscape type, the photo samples were divided into forest landscape group, wetland landscape group, rural landscape group, and recreational landscape group; according to color diversity, the samples were divided into color diversity group, color neutrality group, and color unity group; and according to spatial confinement, the samples were divided into the space-confined group, semi-confined group, and open group.
2.3. Procedures
2.3.1. Sample Materials and Processing
In this study, there are several main considerations for the acquisition and selection of images. First of all, through several field investigations and in-depth interviews with local villagers and tourists, the research group selected typical scenic spots and landscapes that can reflect the regional characteristics of the national park for photography. Second, the research group took the photos from 8:00 a.m. to 10:00 and from 15:00 to 17:00 p.m. on sunny days to ensure the consistency of objective conditions such as sunshine, light, and weather to the greatest extent.
A total of 369 photos were taken, and 53 representative photos were used in the experiments, which were labeled T1–T53. In terms of the selection of representative photos, First of all, the research group eliminated some dim or blurry photos. Then, the research group invited 15 experts from the fields of ecology, forestry, landscape architecture, tourism management, and ecological management to screen together. The samples consisted of four landscape types, three color diversities, and three degrees of spatial confinement. Three of the photos were used as preheating photos to avoid the primacy effect. Preheating photos refer to the unselected photos (316 photos) that were randomly selected in order to provide subjects with a landscape overview of the test area. These photos were placed before the evaluation photos as interference photos. The primacy effect refers to the influence of the information input at the first impression on the subsequent cognition of the object in the process of cognition. In the change of public visual behavior, the public’s impression of the first national park landscape sample is likely to affect the evaluation of subsequent image samples. In this study, a blank control was set between the experimental images, and the blank control time was 15 s to ensure that the fixation position of the eyes of the subjects when viewing different images remained consistent to the greatest extent. In addition, in order to ensure the randomness of the image samples viewed by the subjects, this study altered the order of the samples and did not inform the subjects, who only knew the general content of the experiment.
2.3.2. Selection of Subjects
The subjects were randomly selected through volunteer recruitment in order to ensure that the results were more accurate. The interviewers selected college students as public representatives, mainly because college students generally have a certain travel experience and aesthetic perception. Conventional psychological experiments with more than 30 subjects are generally referred to as large-sample experiments. In this study, 96 undergraduate and graduate students from Renmin University of China and the Chinese Academy of Forestry with “normal vision and naked or corrected visual acuity above 1.0” were used as subjects. Excluding invalid data, a total of 64 sets of data from subjects were collected. There were 25 male subjects (39%) and 39 female subjects (61%) (Table 2). Subjects had bachelor’s, master’s, and Ph.D. degrees, but most had only bachelor’s and master’s degrees. Nineteen of the subjects were majoring in art (e.g., traditional Chinese painting, oil painting, and design), 26 in forestry (e.g., forest silviculture, forest genetic breeding, and forest protection science), and 19 in other majors (e.g., business administration, finance, and Chinese language and literature), accounting for 30%, 40%, and 30%, respectively. There were 29 subjects from the eastern region (Shandong, Anhui, and Zhejiang), 11 subjects from the central region (Henan and Hubei), and 24 subjects from the western region (Gansu and Sichuan), accounting for 45%, 17%, and 38%, respectively. The reliability analysis results of the SD questionnaire data showed that Cronbach’s alpha value was 0.786, which indicates a good reliability. Overall, the data collected were reliable.

Table 2.
Information of the subjects.
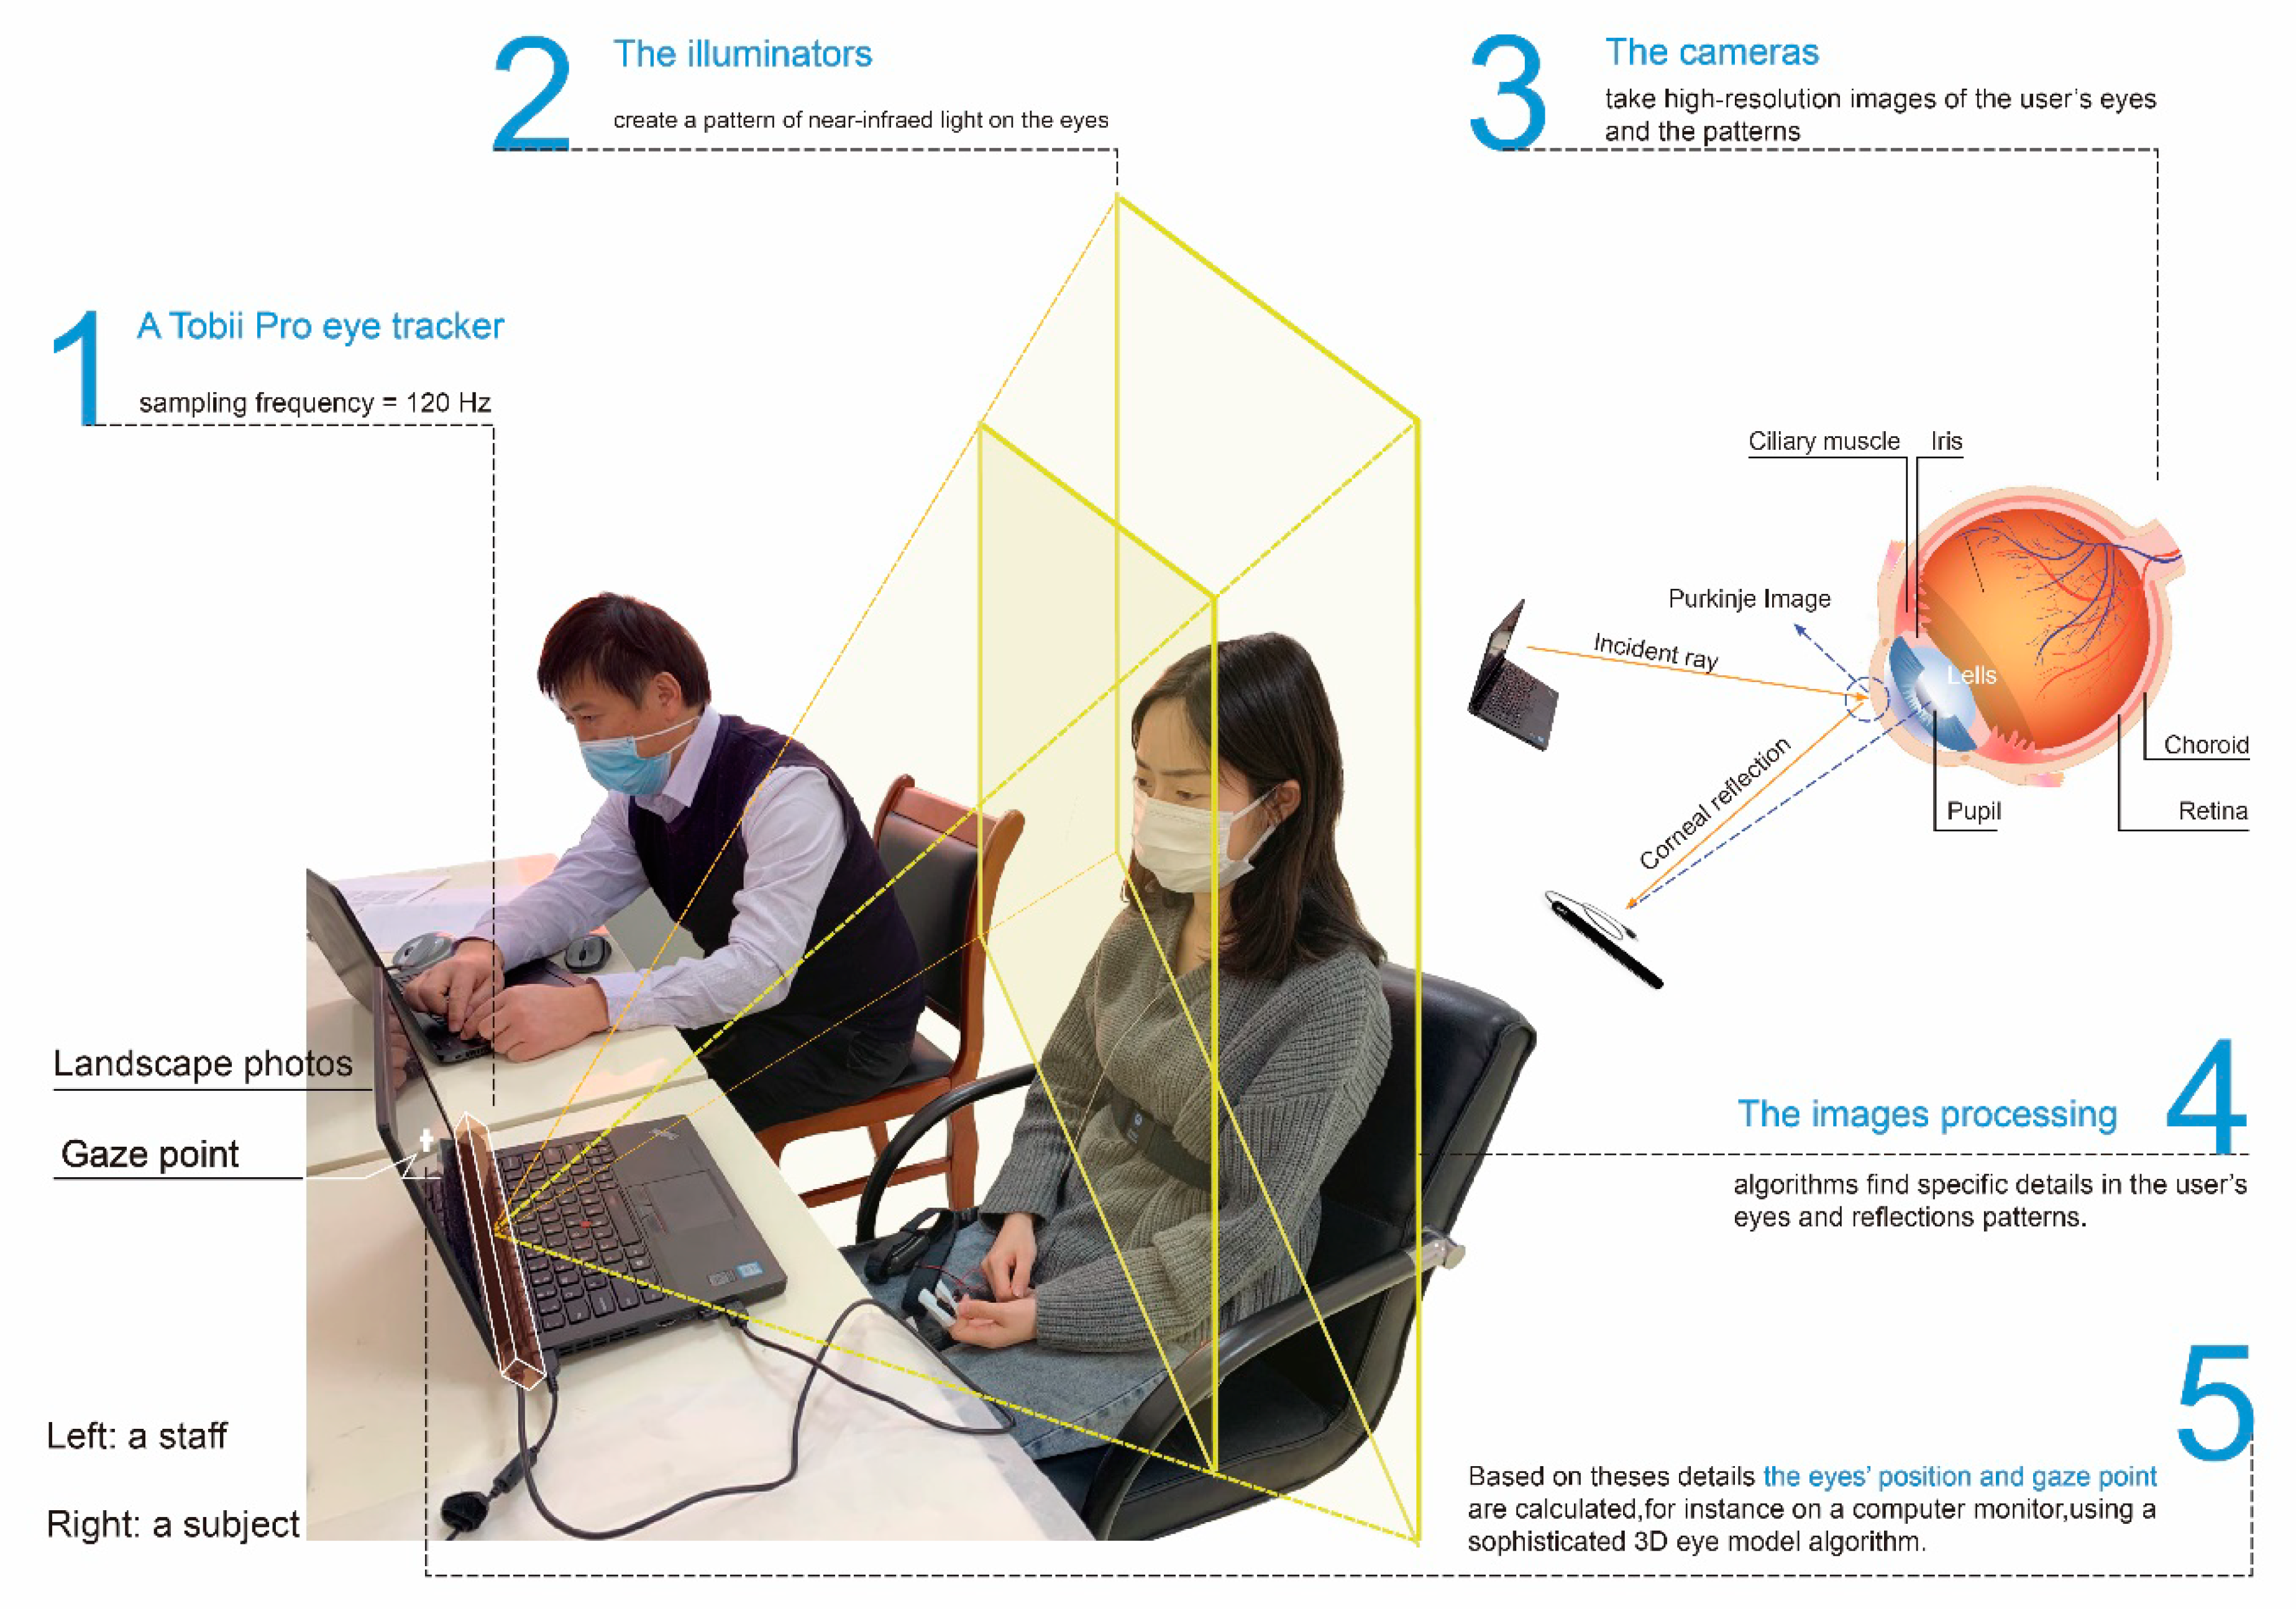
2.3.3. Eye-Tracking Test
A Tobii Pro X3-120 screen eye tracker (sampling frequency = 120 Hz) and two ThinkPad X1 laptops (LCD display resolution 1920 × 1080, screen size 14 inches) were used for visual tracking tests. The experiment was carried out in the landscape laboratory of the Chinese Academy of Forestry. The external influence conditions (such as light and noise conditions) of the experiment were well controlled to ensure the stability of the experiment. The main experimental procedures were as follows: (1) the subjects sat at ca. 60 cm in front of the eye tracker screen with their eyes facing the center of the monitor, and the administrator explained the purpose, process, and requirements of the experiment. (2) Before testing, a calibration was performed to adjust the seated position of the subject to ensure that it was stable. (3) Three preheated photographs were presented without the subject’s knowledge, and then 53 experimental photographs were presented at random. The subjects were asked to stare at the screen in front of them and avoid squinting at the screen. The eye tracker then began to collect the eye-tracking data until the presentation of the photographs ceased (Figure 2). Based on the characteristics of psychological experiments, the contents of the photographs, and previous studies [,,], each photograph was presented for 8 s to ensure that the subjects had enough time to view its contents while also minimizing the fixation time (in colloquial terms, time of activity stimulating the fovea of the eye) and saccade time (in colloquial terms, the time of rapid movement between fixations).

Figure 2.
Principles of the eye-tracking technology.
2.3.4. Selection of Eye-Tracking Indexes
According to psychological and behavioral research [], the main forms of eye movement behaviors are fixation, saccade, and following. This experiment requires the subjects to remain still to observe the sample photos. Hence, eye movement behaviors consist of fixation and saccade behaviors. Based on previous studies [,,,], along with the landscape characteristics of the Pilot Area, we used the fixation duration average (FDA), first fixation duration (FFD), saccade velocity average (SVA), saccade amplitude average (SAA), fixation frequency (FF), and saccade frequency (SF) as the eye-tracking indexes (see Table 3).

Table 3.
Eye-tracking indexes for landscapes in the Pilot Area.
2.4. Data Processing
After the experiment, the eye-tracking data were extracted with Tobii analysis software, and the data were statistically analyzed using Excel 2010 and IBM SPSS Statistics 21. The thermodynamic diagrams and path diagrams generated by the eye tracker were imported into Adobe Photoshop CS 6 and Illustrator CS 5 for image processing. The eye movement thermodynamic diagrams were used to show the visual attractiveness of different landscapes to the subjects and the attention of subjects to different landscapes, and the fixation track charts were used to reveal the observation position, observation time sequence, and fixation duration of subjects for different landscapes.
3. Results
3.1. Eye-Tracking Data for Different Landscape Types in the Pilot Area
According to the landscape type classification, the numbers of forest, wetland, rural, and recreational landscapes were 16, 14, 14, and 9, respectively. In order to effectively analyze the eye-tracking data of different types of landscapes, first of all, the authors conducted a variance homogeneity test (F-test) on the eye-tracking data. The results of the variance homogeneity test showed that there was no significant difference in the variances of each group at the level of a = 0.05; that is, the variances were homogeneous, which met the conditions for further multiple comparisons. Then, the authors used the least significant difference (LSD) method to conduct further multiple comparative analyses. The eye-tracking data of the four types of landscapes were analyzed using single-factor analysis of variance (ANOVA) (Table 4). The results revealed significant differences in the FDA, SVA, SAA, and SF among the four types of landscapes. The values of the eye-tracking indexes varied among the different landscapes of the Pilot Area. The FDA of the forest landscape significantly differed from that of the other three groups of landscapes. The differences in the eye movement characteristics between the forest landscape and recreational landscape were greater than the differences between other groups. The FDA (231.30 ms) of the forest landscape was the longest, SVA (104.84 °/s) was the fastest, and SAA (2.47°) was the largest. Moreover, the FFD (203.26 ms) of the recreational landscape was the longest, FF (1.49 count/s) was the largest, and SF (0.77 count/s) was the largest.

Table 4.
Effects of different landscape types in the Pilot Area on eye-tracking indexes.
A sample from each of the four groups of landscapes was selected for study (Figure 3). In terms of eye-tracking heat map, the visual excitation area of the forest landscape was distributed close to the image center and diverged around the visual center. The visual fixation range of the wetland landscape was relatively concentrated around the wetland and water body. Rural landscape generally has multiple visual excitation areas, and the number of fixation points of agricultural elements such as farmland and tea garden is large, and the distribution is relatively dense. The focus of recreational landscape was the most concentrated, and the area of visual excitement was scattered and mainly concentrated in stone tablets, wind and rain pavilions, sculptures, and other artificial landscapes, especially artificial elements with words. In terms of eye-tracking path trajectory, the first focus of forest landscape was generally located at the junction of different plant communities, after which the focus moved up and down and then back and forth. The gaze path of wetland landscape followed the flow direction of the river system. The gaze path of rural landscape mainly followed the trajectory movement of forest–farmland–forest. Landscape structures such as inscriptions and stone carvings play an important guiding role in the path trajectory of recreational landscape.

Figure 3.
Visualization of eye-tracking data corresponding to different landscape types.
According to previous research experience, we initially extracted six eye-tracking indexes for research. However, according to the results in Table 3, the change trends of some indexes are very similar. Therefore, before further analysis, the six eye-tracking indexes were analyzed by Pearson correlation analysis (Table 5). FDA was significantly correlated with FFD, SVA was significantly correlated with SAA, and SF was significantly correlated with FF. The results showed that the pairings of these three groups of indicators were highly consistent. Therefore, the three indicators of FFD, SAA, and FF were eliminated in the subsequent analysis of this study. The subjects were divided according to gender, place of origin, and major. The independent sample t-test method and the LSD method in one-way ANOVA were used to test the mean value of the three eye-tracking indexes (FDA, SVA, SF) in order to reveal the psychological mechanism underlying the public perception of landscapes.

Table 5.
Pearson correlation analysis of the eye-tracking indexes.
There were significant differences in the SVA of forest, wetland, and rural landscapes among different genders (Figure 4). Compared with males, the FDA was longer, SVA faster, and SF larger for females. Subjects from different places of origin significantly differed in SF for forest landscapes; FDA, SVA, and SF for wetland landscapes; and SF for rural landscapes. Subjects of different majors significantly differed in FDA and SF for wetland, village, and recreational landscapes.

Figure 4.
Eye-tracking data for different group characteristics based on multiple landscape types. Note: “ER” represents eastern region; “CR” represents central region; “WR” represents western region; “AM” represents art major; “FM” represents forestry major; “OM” represents other major. Data with different letters ("a" and "b") are significantly different.
3.2. Eye-Tracking Data for Different Color Diversities of Landscapes in the Pilot Area
For color diversity, the Pilot Area landscape was divided into the color diversity group, color neutral group, and color unity group. The color diversity of the color diversity group, color neutral group, and color unity group decreased successively according to the K-means clustering results. The numbers of samples in the color diversity group, the color neutral group, and the color unification group were 11, 26, and 16, respectively, accounting for 20.75%, 49.06%, and 30.19% of all samples. In the color diversity group, the cumulative number of samples of the color neutral group reached 69.81%, and the overall Pilot Area forest landscape color was relatively rich and diverse.
The eye-tracking data of the three groups of landscapes were analyzed by one-way ANOVA (Table 6). There were significant differences in FDA among the three groups. The FDA (207.30 ms) was the shortest, FFD (187.09 ms) was the shortest, and FF (1.3 count/s) was the smallest in the color diversity group. The SVA (101.60 count/s) was the slowest, SAA (2.37°) was the smallest, FF (1.43 count/s) was the largest, and SF (0.72 count/s) was the highest in the color neutral group. FDA (228.77 ms) was the longest, FFD (207.41 ms) was the longest, SVA (103.53 count/s) was the fastest, SAA (2.44°) was the largest, and SF (0.64 count/s) was the smallest in the color unity group. Additionally, the eye-tracking indexes also differed among the different groups. The FDA (228.769 ms) of the color unity group was the longest, which was significantly different from that of the other two groups. The neutral color group (213.47 ms) was the second longest, and the color diversity group (207.30 ms) was the shortest.

Table 6.
Effects of different color diversities of landscapes in the Pilot Area on eye-tracking indexes.
A sample from each of the three groups of landscapes was selected for study (Figure 5). In terms of eye-tracking heat map, the visual excitement area of the color diversity group was scattered; the subject line of sight was mainly far away. The visual excitement area of the color neutral group was clustered. The focus of the subject was mainly the humanistic landscape element, and the eye movement path was greatly affected by tone. In the color unity group, the visual fixation range of the landscape was relatively concentrated, and the attention was mainly concentrated in the trunks of the trees. When the color was uniform and harmonious, the effects of simple colors on visual behaviors were low, whereas the effects of morphological characteristics of the landscape on the visual behaviors were more pronounced. When the landscape color diversity is high, the visual behavior is greatly affected by hue, saturation, and brightness. When the color is uniform, the effect of color on visual behavior is low, while the effect of landscape morphological features on visual behavior is more significant. In terms of eye movement, the gaze path of the color diversity group was affected by landscape brightness and saturation. The eye movement path of the color unified group was mainly affected by landscape elements but was less affected by hue, saturation, and brightness.

Figure 5.
Visualization of the eye-tracking data for different color diversities.
The average values of the eye-tracking data by gender, place of origin, and major are shown in Table A1. The results show that: (1) there were no significant differences in FDA and SF in the color diversity group, color neutral group, and color unity group between genders, but there were significant differences in SVA between genders in the color neutral group and color unity group. (2) There were significant differences in landscape SF in the three color diversity groups among subjects differing in place of origin, and the SF of subjects in the central region was the fastest. The FDA and SVA of the color neutral group and the SVA of the color unity group also significantly differed among subjects differing in place of origin. (3) There were significant differences in FDA and SF in the three color diversity groups among subjects with different majors. The FDA of subjects majoring in art was the longest, the FDA of subjects majoring in forestry was the second longest, and the FDA of subjects with other majors was the shortest. In addition, the SF was significantly higher for subjects majoring in art than in subjects majoring in forestry and other majors.
3.3. Eye-Tracking Data for Different Degrees of Spatial Confinement of Landscapes in the Pilot Area
According to the degree of spatial confinement, the Pilot Area landscape was divided into three groups: the space-confined group, spatial semi-confined group, and open group. The spatial confinement of the space-confined group, semi-confined group, and open group decreased, and the numbers of samples in these groups were 26, 17, and 10, respectively, accounting for 49.06%, 32.07%, and 18.87% of the samples. The cumulative number of samples for the space-confined group and semi-confined group was 81.13%; the overall space of the Pilot Area landscape was relatively confined, and the forest canopy density was high.
The eye-tracking data of the three groups of landscapes were analyzed by one-way ANOVA (Table 7). There were significant differences in FDA and FFD among the three groups. In the confined group, FDA (223.02 ms) was the longest, FFD (211.01 ms) was the longest, FF (1.46 count/s) was the smallest, and SF (0.70 count/s) was the largest; in the spatial semi-confined group, SVA (105.51 count/s) was the fastest, SAA (2.48°) was the largest, FDA (205.98 ms) was the shortest, FFD (183.54 ms) was the shortest, SVA (99.58 count/s) was the slowest, SAA (2.36°) was the smallest, FF (1.38 count/s) was the smallest, and SF (0.68 count/s) was the smallest. The values of the eye-tracking indexes also differed among the different groups, and there were significant differences between the space-confined group and the other two groups. For example, the FFD (211.01 ms) of the space-confined group was the longest, followed by the semi-confined group (190.20 ms) and the open group (183.54 ms).

Table 7.
Effects of different degrees of spatial confinement in the Pilot Area on eye-tracking indexes.
One sample from each of the three groups of landscapes was selected, and the analysis of visual behaviors showed that the visual excitation area was relatively concentrated in the space-confined group. Furthermore, the visual range was larger, scattered from the center to the surrounding area, and was in the form of a concentric circle extending outward. The eye movement path of this group was shorter, and the starting point and end point of path movement were more concentrated and had fewer scattered points. The line of sight of the semi-confined group was greatly affected by the spatial characteristics, and the visual path moved along the junction of the landscape elements, resulting in the generation of multiple stopping points, and the path was clear. The visual range of the open group had specific cluster characteristics, and the visually exciting area was in the long-range, middle-range, and close-range areas (Figure 6).

Figure 6.
Visualization of the eye-tracking data for the different degrees of spatial confinement.
The mean values of the eye-tracking data of the three groups of landscapes were compared according to subject characteristics (Table A2). The results showed that: (1) there were no significant differences in FDA and SF between genders in the three landscape groups, but there was a significant difference in SVA between genders in the space-confined group. The SVA was significantly higher for females than for males. (2) There were significant differences in SF of the three groups, SVA of the space-confined group, and FDA of the space semi-confined group among subjects differing in place of origin. (3) There were significant differences in FDA and SF of the three groups and SVA of the space-confined group among subjects with different majors.
4. Discussion
4.1. Effects of Landscape Type in the Pilot Area on Public Visual Behaviors
There were significant differences in FDA and SF of the four landscape types, indicating that landscapes could be designed with different themes in a way that would help viewers obtain more landscape information faster and more effectively, enhance visual satisfaction, and thus increase the attractiveness of landscapes in National Parks to the public. The effect of landscape types on public visual behaviors was strongly related to the characteristics of landscape constituent elements. The characteristics of the Pilot Area forest landscape are distinct, and the large-scale low-altitude mid-subtropical evergreen broad-leaved forest is aesthetically pleasing. The development of the forest tourism industry has resulted in the construction of several recreational facilities. Consequently, the fixation duration of the forest landscape and recreational landscape is long, and the instant attractiveness is strong. However, because the wetland landscape and rural landscape have no abrupt points, the fixation duration of these two types of landscapes is generally short, the degree of visual attention is low, and the instant attractiveness is relatively weak. Research on eye movement behaviors in advertising [] showed that if subjects gaze at a certain part of a photo for a long period and several times, their interest in this part of the photo increases. The eye-tracking indexes indicated that the forest and recreational landscapes received the most interest. Li et al. [] conducted a study of tourist visual behaviors using photography and eye-tracking tests and showed that the public was attracted to natural landscapes with superior ecological conditions. They concluded that recreational landscapes have high ornamental value, which is consistent with the results of this study.
4.2. Effects of Color Diversity of Landscapes in the Pilot Area on Public Visual Behaviors
When color diversity increased, public attention and instant attractiveness decreased; when the color diversity decreased, public attention and instant attractiveness increased. The public prefers landscapes with uniform colors and harmonious tones because this type of landscape increases viewer comfort. The work of Gong et al. [] examining the effect of colors on the visual search efficiency of icons also supported this point. The effect of color unity on the visual search efficiency of the public was clear. Thus, optimizing the construction of the landscapes of the Pilot Area requires matching landscape color elements, optimizing landscape color patterns, and highlighting different seasonal color changes. Regardless of the strength of the color contrast of the landscape, when the public observes a sample image, the first fixation point is generally located in the center of the sample image, and then the line of sight moves back and forth along the visual areas of interest with different brightness levels. The public thus mainly perceives the entire landscape as the first fixation point. Although eye tracking is useful for exploring the location of observation, other indicators that can more directly characterize psychological activity, including the galvanic skin response (skin conductance activity) and electroencephalograms, are needed to understand the behavioral mechanism underlying the visual representation.
4.3. Effects of Spatial Confinement of the Landscape in the Pilot Area on Public Visual Behaviors
As the degree of spatial confinement increased, the instant attractiveness of the landscape to the public increased. The Pilot Area forest is rich in resources, and forest cover reaches 81.19%. Landscapes with high degrees of spatial confinement are also high in canopy density. Thus, the landscape planning of the Pilot Area should emphasize the protection and rational utilization of forest resources as well as highlight the forest characteristics of the Pilot Area. Additionally, the visual thermal form of the confined group can be summarized as a concentrated radiation type, and the shape is in the form of a concentric circle extending outward. While the landscape forms of the semi-confined group and open group generally had two or more visual fixation points, the thermodynamic forms can be classified into strip type and cluster type. In this study, the eye-tracking data were used to characterize the visual behaviors, which provides new insights applicable to landscape visual quality evaluation. Nevertheless, there is a need for more research to be conducted in this area in the future.
4.4. Effects of Group Characteristics on Visual Preferences
Compared with male subjects, the FDA of female subjects was longer, the SVA was faster, and the SF was larger. For example, males have a longer FDA for the recreational landscape and the open group compared with females, and males also have a greater SF for the color diversity group. Li et al. [] analyzed the visual behaviors of a campus landscape. They found that females tended to prefer natural landscapes, whereas males preferred humanistic architectural landscapes, which is consistent with the results of this study. As the Pilot Area landscapes are dominated by natural features, females were more interested in the Pilot Area landscapes. Analysis of the effect of place of origin on visual behaviors revealed that subjects from the central and western regions had longer FDA, faster SVA, and larger SF compared with subjects from the eastern region. This indicates that subjects in the central and western regions paid more attention to the Pilot Area landscape. Analysis of the effect of visual behaviors revealed that art students preferred landscapes with strong humanistic attributes, such as rural areas and recreational landscapes, whereas students majoring in forestry preferred landscapes with natural attributes, such as forests and wetlands. Additionally, the SF of art students was greater than that of students of the other two majors, indicating that the eyes of art students more intensively scanned the Pilot Area landscape, which might be related to the fact that art students possess less knowledge of ecology.
In sum, the public prefers landscapes with uniform and harmonious colors, clear dominant tones, high canopy density, and certain cultural characteristics; landscapes that do not receive as much attention are those with various colors and low canopy density. This suggests that the public’s visual attention to landscapes in national parks is related to the characteristics of the constituent elements of the landscape. The visual focus of artificial landscapes is often more prominent compared with natural landscapes, and the FFD is longer, especially for artificial landscapes (e.g., stone tablets, gates) with text []. Guo et al. [] conducted a visual perception analysis of the mountain tourism landscape in Eastern China. The results showed that people had lower instant attractiveness to natural landscapes such as mountains, waters, and clouds, whereas temples, Taoist temples, and hotels had higher instant attractiveness. Their conclusions are also consistent with the results of our study. A comprehensive analysis of the effect of the type, color diversity, and degree of spatial confinement of landscapes on public visual behaviors demonstrated that forest ecological elements, recreation and leisure elements, harmonious and uniform landscape colors, and spatial confinement with high canopy density contain more landscape aesthetic information and are thus more likely to promote changes in visual behavior and visual interest. However, the public’s interpretation of vernacular architecture elements, river wetland elements, complex color elements, and open space elements requires some preliminary information. Due to the limited duration of our experiments, visual interest in the above landscapes was difficult to arouse, which is a finding consistent with previous studies []. Cultural dimension of public perceptions can also affect the visual evaluation of landscape. Stephenson constructed a cultural value model to study the landscape of New Zealand communities, and his findings suggest that part of the power of landscapes lies in how they represent and make visible multiple cultures [].
It is worth noting that most of the studies on eye-tracking analysis are based on photographs, mainly because the experiments conducted with photographs are more operable and less costly than the outdoor experiments. Although relevant scholars have proved that the experimental results are highly consistent [,,], the number of photographs, shooting techniques, and other factors will still cause a certain degree of deviation in the national park landscape images. Therefore, photographs cannot completely replace the actual landscape, and the experimental form of photographs has some limitations. In future experiments, eye-tracking tests can be combined with 3D, VR, and other virtual technologies. If the subjects participate in eye-tracking tests in a virtual reality scene, more accurate evaluation results will be obtained. Additionally, psychologists have shown that eye tracking can enhance our understanding of the public perception of landscapes and provide an effective approach for revealing the psychological mechanism underlying human brain information processing. However, additional experiments are needed to establish the effect of landscape visual quality on mediating these psychological changes.
5. Conclusions
The eye-tracking indexes measured in this study revealed the eye movement characteristics of subjects viewing different landscapes within a national park and explained the mechanism by which landscapes affect public visual behaviors. Specifically, we found that: (1) compared with color diversity and degree of spatial confinement, the effect of landscape type on visual behaviors was stronger, which was mainly related to the characteristics of the constituent elements of landscapes. (2) Subjects preferred recreational landscapes with high ornamental value and forest landscapes, wetland landscapes, and rural landscapes with superior ecological conditions. Preliminary information was required to interpret certain landscape elements, as otherwise these elements could be easily overlooked. When the colors were more uniform and harmonious, the fixation duration of subjects and the instant attractiveness increased. When the landscape space was more confined, the fixation duration of the public and the instant attractiveness increased, and the SF was greater. (3) Subject background can affect visual behavior preferences. Females were more interested in the Pilot Area landscapes, whereas males were more interested in landscapes with prominent humanistic architecture, complex colors, and open space. Art students generally preferred landscapes with strong humanistic attributes, whereas students majoring in forestry preferred landscapes with strong natural attributes.
The National Parks of China are in a critical early stage of development. Although ecological protection is the primary goal of the National Park system, public visual perception of landscapes in national parks is closely tied to the effectiveness of ecological protection. Public participation has become a trend in national park management in many countries. For example, the mechanism of public participation runs through the establishment, planning and decision-making, management, and operation of national parks in the United States. Among the scientific research projects approved by Yellowstone National Park every year, nearly a quarter are completed by foundations and other social organizations. Hence, in the process of Chinese National Park construction, public perception of landscape aesthetics needs to be factored into management decisions. In addition, both “top-down” and “bottom-up” planning of national parks should be promoted. Visual landscape quality is necessary for landscape planning and policymaking, and the public’s preference for landscape visual behaviors could affect the effectiveness of landscape conservation and restoration. This study provides information that could aid conservation management of National Park System Pilot Areas and the sustainable management of landscapes in national parks following the completion of the pilot project.
Author Contributions
Conceptualization, P.W.; methodology, P.W. and W.Y.; Writing, P.W. and W.Y.; Supervision, D.W. and Y.H.; Validation. All authors have read and agreed to the published version of the manuscript.
Funding
This research was funded by the National Natural Science Foundation of China (52008389) and the Key Project of National Forestry and Grassland Administration (500102-5102; 500102-5100).
Acknowledgments
All authors gratefully acknowledge the support from the National Natural.
Conflicts of Interest
All authors declare no conflict of interest.
Appendix A

Table A1.
Eye-tracking data for different group characteristics based on color diversities of landscapes.
Table A1.
Eye-tracking data for different group characteristics based on color diversities of landscapes.
Eye-Tracking Indexes | Landscape Groups | Gender | Average | Sig. | Place of Origin | Average | Sig. | Major | Average | Sig. |
---|---|---|---|---|---|---|---|---|---|---|
FDA (ms) | Color diversity group | Male | 204.847 | 0.722 | ER | 197.367 | 0.564 | FM | 209.689 | 0.031 |
Female | 208.562 | CR | 215.732 | AM | 222.350 | |||||
WR | 208.696 | OM | 184.130 | |||||||
Color neutral group | Male | 207.992 | 0.332 | ER | 204.561 | 0.012 | FM | 221.630 | 0.000 | |
Female | 216.835 | CR | 212.752 | AM | 225.486 | |||||
WR | 244.427 | OM | 182.336 | |||||||
Color unity group | Male | 224.083 | 0.445 | ER | 220.843 | 0.097 | FM | 236.473 | 0.001 | |
Female | 231.609 | CR | 239.339 | AM | 241.220 | |||||
WR | 217.794 | OM | 198.458 | |||||||
SVA (°/s) | Color diversity group | Male | 92.506 | 0.074 | ER | 93.647 | 0.169 | FM | 100.912 | 0.862 |
Female | 108.728 | CR | 109.761 | AM | 104.847 | |||||
WR | 104.573 | OM | 100.875 | |||||||
Color neutral group | Male | 92.943 | 0.001 | ER | 94.123 | 0.047 | FM | 100.972 | 0.077 | |
Female | 106.099 | CR | 108.087 | AM | 106.372 | |||||
WR | 103.745 | OM | 96.568 | |||||||
Color unity group | Male | 89.481 | 0.000 | ER | 91.993 | 0.004 | FM | 104.560 | 0.109 | |
Female | 110.709 | CR | 109.050 | AM | 107.891 | |||||
WR | 120.452 | OM | 96.180 | |||||||
SF (count/s) | Color diversity group | Male | 0.722 | 0.550 | ER | 0.635 | 0.017 | FM | 0.754 | 0.000 |
Female | 0.689 | CR | 0.799 | AM | 0.810 | |||||
WR | 0.616 | OM | 0.475 | |||||||
Color neutral group | Male | 0.679 | 0.185 | ER | 0.642 | 0.000 | FM | 0.769 | 0.000 | |
Female | 0.736 | CR | 0.818 | AM | 0.787 | |||||
WR | 0.623 | OM | 0.529 | |||||||
Color unity group | Male | 0.608 | 0.200 | ER | 0.565 | 0.034 | FM | 0.691 | 0.000 | |
Female | 0.663 | CR | 0.721 | AM | 0.695 | |||||
WR | 0.620 | OM | 0.491 |
Note: “ER” represents eastern region; “CR” represents central region; “WR” represents western region; “AM” represents art major; “FM” represents forestry major; “OM” represents other major.

Table A2.
Eye-tracking data for different group characteristics based on degree of spatial confinement.
Table A2.
Eye-tracking data for different group characteristics based on degree of spatial confinement.
Eye-Tracking Indexes | Landscape Groups | Gender | Average | Sig. | Place of Origin | Average | Sig. | Major | Average | Sig. |
---|---|---|---|---|---|---|---|---|---|---|
FDA (ms) | Spatial confined group | Male | 216.622 | 0.204 | ER | 219.409 | 0.732 | FM | 223.913 | 0.000 |
Female | 226.759 | CR | 224.599 | AM | 241.938 | |||||
WR | 229.075 | OM | 195.072 | |||||||
Spatial semi-confined group | Male | 207.385 | 0.391 | ER | 194.183 | 0.018 | FM | 229.173 | 0.001 | |
Female | 217.500 | CR | 225.003 | AM | 215.688 | |||||
WR | 237.244 | OM | 183.596 | |||||||
Spatial open group | Male | 208.873 | 0.712 | ER | 201.736 | 0.780 | FM | 213.483 | 0.006 | |
Female | 204.441 | CR | 206.939 | AM | 221.089 | |||||
WR | 214.635 | OM | 174.846 | |||||||
SVA (°/s) | Spatial confined group | Male | 86.512 | 0.000 | ER | 90.814 | 0.000 | FM | 103.492 | 0.021 |
Female | 108.944 | CR | 107.358 | AM | 103.836 | |||||
WR | 113.056 | OM | 93.942 | |||||||
Spatial semi-confined group | Male | 100.495 | 0.124 | ER | 98.808 | 0.386 | FM | 99.744 | 0.074 | |
Female | 108.577 | CR | 112.124 | AM | 113.942 | |||||
WR | 105.712 | OM | 105.069 | |||||||
Spatial open group | Male | 90.804 | 0.136 | ER | 90.829 | 0.167 | FM | 102.184 | 0.421 | |
Female | 104.755 | CR | 106.503 | AM | 100.847 | |||||
WR | 103.834 | OM | 93.060 | |||||||
SF (count/s) | Spatial confined group | Male | 0.663 | 0.156 | ER | 0.610 | 0.001 | FM | 0.746 | 0.000 |
Female | 0.719 | CR | 0.792 | AM | 0.762 | |||||
WR | 1.660 | OM | 0.519 | |||||||
Spatial semi-confined group | Male | 0.694 | 0.839 | ER | 0.625 | 0.018 | FM | 0.758 | 0.000 | |
Female | 0.683 | CR | 0.778 | AM | 0.756 | |||||
WR | 0.599 | OM | 0.495 | |||||||
Spatial open group | Male | 0.628 | 0.164 | ER | 0.622 | 0.006 | FM | 0.704 | 0.000 | |
Female | 0.704 | CR | 0.779 | AM | 0.784 | |||||
WR | 0.556 | OM | 0.493 |
Note: “ER” represents eastern region; “CR” represents central region; “WR” represents western region; “AM” represents art major; “FM” represents forestry major; “OM” represents other major.
References
- Borrini-Feyerabend, G.; Dudley, N.; Jaeger, T.; Lassen, B.; Pathak Broome, N.; Phillips, A.; Sandwith, T. Governance of Protected Areas: From Understanding to Action; IUCN: Gland, Switzerland, 2013; pp. 10–29. [Google Scholar]
- Huang, B.R.; Wang, Y.; Su, L.Y.; Zhang, C.L.; Cheng, D.W.; Sun, J.; He, S.Y. Pilot Programs for National Park System in China: Progress, Problems and Recommendations. Bull. Chin. Acad. Sci. 2018, 33, 76–85. (In Chinese) [Google Scholar]
- Collen, B. Conservation prioritization in the context of uncertainty. Anim. Conserv. 2015, 18, 315–317. [Google Scholar] [CrossRef]
- Brown, G.; Hausner, V.H.; Grodzińska-Jurczak, M.; Pietrzyk-Kaszyńska, A. Cross-cultural values and management preferences in protected areas of Norway and Poland. J. Nat. Conserv. 2015, 28, 89–104. [Google Scholar] [CrossRef]
- Speed, J.M.; Austrhein, G.; Birksbcd, H.J.; Johnson, S.M.; Kvamme, M.; Nagy, L.; Sjögren, P.; Skar, B.; Stone, D.; Svensson, E.; et al. Natural and cultural heritage in mountain landscapes: Towards an integrated valuation. Int. J. Biodivers. Sci. Ecosyst. Serv. Manag. 2012, 8, 313–320. [Google Scholar] [CrossRef]
- Zhao, J.Z.; Liu, X.; Dong, R.C.; Shao, G.F. Landsenses ecology and ecological planning toward sustainable development. Int. J. Sustain. Dev. World Ecol. 2016, 23, 293–297. [Google Scholar] [CrossRef]
- Shao, J.; Qiu, Q.; Qian, Y.; Tang, L. Optimal visual perception in land-use planning and design based on landsenses ecology. Int. J. Sustain. Dev. World Ecol. 2020, 27, 233–239. [Google Scholar] [CrossRef]
- Madureira, H.; Nunes, F.; Oliveira, J.V.; Cormier, L.; Madureira, T. Urban residents′beliefs concerning green space benefits in four cities in France and Portugal. Urban. For. Urban. Green. 2015, 14, 56–64. [Google Scholar] [CrossRef]
- Coon, J.T.; Boddy, K.; Stein, K.; Whear, R.; Barton, J.; Depledge, M.H. Does participating in physical activity in outdoor natural environments have a greater effect on physical and mental wellbeing than physical activity indoors? A systematic review. Environ. Sci. Technol. 2011, 45, 1761–1772. [Google Scholar] [CrossRef] [PubMed]
- Fu, B.J.; Li, Y. Bidirectional coupling between the Earth and human systems is essential for modeling sustainability. Natl. Sci. Rev. 2016, 3, 397–398. [Google Scholar] [CrossRef]
- Fu, B.J.; Forsius, M. Ecosystem services modeling in contrasting landscapes. Landsc. Ecol. 2015, 30, 375–379. [Google Scholar] [CrossRef]
- Sutherland, W.J.; Freckleton, R.P.; Godfray, H.C.; Beissinger, S.R.; Benton, T.; Cameron, D.D.; Carmel, Y.; Coomes, D.A.; Coulson, T.; Emmerson, M.C. Identification of 100 fundamental ecological questions. J. Ecol. 2013, 101, 58–67. [Google Scholar] [CrossRef]
- Cabana, D.; Ryfield, F.; Crowe, T.P.; Brannigan, J. Evaluating and communicating cultural ecosystem services. Ecosyst. Serv. 2020, 42. [Google Scholar] [CrossRef]
- Tang, L.N.; Li, J.; Qiu, Q.Y.; Shi, L.Y.; Wang, H.W.; Zheng, S.N. Review of methods and practices of landsenses ecology. Actaecologica Sin. 2020, 40, 8015–8021. (In Chinese) [Google Scholar]
- Gobster, P.H.; Nassauer, J.I.; Daniel, T.C.; Fry, G. The Shared Landscape: What does Aesthetics Have to do with Ecology? Landsc. Ecol. 2007, 22, 959–972. [Google Scholar] [CrossRef]
- Mallarch, J.M. Values of Protected Landscapes and Seascapes: Protected Landscapes and Cultural and Spiritual Values; GTZ, IUCN and Obra Social de Caixa Catalunya: Heidelberg, Germany, 2008; pp. 9–20. [Google Scholar]
- Agnolett, M. Rural landscape, nature conservation and culture: Some notes on research trends and management approaches from a (Southern) European perspective. Landsc. Urban. Plan. 2014, 126, 66–73. [Google Scholar] [CrossRef]
- Zhou, N.X.; Huang, Z.F.; Jiang, M.P.; Liang, Y.Y. The relationships between forest landscape visual quality and landscape spatial pattern index of Mount Lushan. Geogr. Res. 2012, 31, 1224–1232. (In Chinese) [Google Scholar]
- Chang Chien, Y.M.; Carver, S.; Comber, A. An Exploratory Analysis of Expert and Nonexpert-Based Land-Scape Aesthetics Evaluations: A Case Study from Wales. Land 2021, 10, 192. [Google Scholar] [CrossRef]
- Vukomanovic, J.; Orr, B.J. Landscape Aesthetics and the Scenic Drivers of Amenity Migration in the New West: Naturalness, Visual Scale, and Complexity. Land 2014, 3, 390–413. [Google Scholar] [CrossRef]
- Dramstad, W.E.; Tveit, M.S.; Fjellsta, W.; Fry, G. Relationships between visual landscape preferences and mapbased indicators of landscape structure. Landsc. Urban. Plan. 2006, 78, 465–474. [Google Scholar] [CrossRef]
- Yang, Y.; Tang, X.L. The Evaluation and Factor Analysis of the Visual Quality of Scenic Forest Landscape:A Case Study of Purple Mountain National Forest Park in Nanjing. Chin. Landsc. Archit. 2020, 36, 135–140. (In Chinese) [Google Scholar]
- Meo, I.D.; Cantiani, P.; Paletto, A. Effect of Thinning on Forest Scenic Beauty in a Black Pine Forest in Central Italy. Forests 2020, 11, 1295. [Google Scholar] [CrossRef]
- Liu, Y.P.; Hu, M.J.; Zhao, B. Audio-visual interactive evaluation of the forest landscape based on eye-tracking experiments. Urban. For. Urban. Green. 2019, 46, 126476. [Google Scholar] [CrossRef]
- Zhang, W.D.; Fang, H.L.; Zhang, D.S.; Zhang, Q.F. An Assessment of City Greening Langscape Appreciation. Psychol. Sci. 2008, 4, 823–826. (In Chinese) [Google Scholar]
- Dupont, L.; Antrop, M.; Van Eetvelde, V. Does landscape related expertise influence the visual perception of landscape photographs? Implications for participatory landscape planning and management. Landsc. Urban Plan. 2015, 141, 68–77. [Google Scholar] [CrossRef]
- Zhao, Y.; Lin, J.H.; Liu, Y. Research on visual evaluation of tourism scenery based on eye movement experiment:a case of tangjia ancient town in zhuhai. Hum. Geogr. 2020, 35, 130–140. (In Chinese) [Google Scholar]
- Nordh, H.; Hagerhall, C.M.; Holmqvist, K. Tracking restorative components:Patterns in eye movements as a consequence of a restorative rating task. Landsc. Res. 2013, 38, 101–116. [Google Scholar] [CrossRef]
- Zhang, Z. Study on Forest Color Characteristics and Its Influence Based on Public Response Evaluation—A Case Study of Autumn Forest in Jiuzhaigou, Sichuan Province; Chinese Academy of Forestry: Beijing, China, 2017. (In Chinese) [Google Scholar]
- Xiaoting, H.; Wenxuan, L. An experimental study on eye movement. Tour. Guide 2017, 1, 91–95. [Google Scholar]
- Zhang, J. Investigation Analysis and Practice in Planning and Design; Architecture and Building Press: Beijing, China, 2005. (In Chinese) [Google Scholar]
- Yu, Z.Y.; Liu, Y. Reflection and prospect of the application of eye movement experiment in tourism psychology research. Tour. Trib. 2020, 3, 7–8. (In Chinese) [Google Scholar]
- Duffy, A.M. Two-way street: How smartphones and the social web impact the traveller’s liminal gaze. Mob. Media Commun. 2018, 7, 60–75. [Google Scholar] [CrossRef]
- Dong, W.H.; Liao, H.; Zhan, Z.C.; Liu, B.; Wang, S.K.; Yang, T.Y. New research progress of eye tracking-based map cognition in cartography since 2008. Acta Geogr. Sin. 2019, 74, 599–614. [Google Scholar]
- Ghi, C.F.; Lin, Y.H.; Lan, W.S. Measurement of information processing load and visual load on a dynamic information processing task. Behav. Inf. Technol. 2003, 22, 365–374. [Google Scholar]
- Wu, Y.Y.; Liu, Y.Q.; Tsai, R.; Yau, S.T. Investigating the role of eye movements and physiological signals in search satisfaction prediction using geometric analysis. J. Assoc. Inf. Sci. Technol. 2019, 7, 981–999. [Google Scholar] [CrossRef]
- Scott, N.; Le, D.; Becken, S.; Connolly, R.M. Measuring perceived beauty of the Great Barrier Reef using eyetracking technology. Curr. Issues Tour. 2019, 23, 2492–2502. [Google Scholar]
- Yan, G.L.; Bai, X.J. Eye Movement Analyses in Advertisement Psychology and Its Research Trend. Psychol. Sci. 2004, 2, 459–461. (In Chinese) [Google Scholar]
- Li, Y.; Gao, X.H.; Huang, J.X.; Wu, M. Visual Behavior Analysis of Tourists Based on Photography and Eye-tracking Experiment—A Case of Xiamen University. Tour. Trib. 2020, 35, 41–52. (In Chinese) [Google Scholar]
- Gong, Y.; Zhang, S.Y.; Liu, Z.F.; Shen, F. Eye movement study on color effects to icon visual search efficiency. J. Zhejiang Univ. 2016, 50, 1987–1994. (In Chinese) [Google Scholar]
- Li, X.Q.; Zhao, N.X.; Wang, C.Z.; Wang, M.; Huang, H. A preliminary study on the application of eye tracker to the landmark landscape of campus tourism—Taking the north building of Nanjing University as an example. Acta Agric. Jiangxi 2011, 23, 148–151. (In Chinese) [Google Scholar]
- Li, Q.; Huang, Z.J.; Christianson, K. Visual attention toward tourism photographs with text:an eye tracking study. Tour. Manag. 2016, 54, 243–258. [Google Scholar] [CrossRef]
- Guo, S.L. Research on Visual Perception and Assessment of Mountain Landscape in Eastern China Based on Eye Movement; Nanjing University: Nanjing, China, 2018. (In Chinese) [Google Scholar]
- Stephenson, J. The Cultural Values Model: An integrated approach to values in landscapes. Landsc. Urban Plan. 2008, 84, 127–139. [Google Scholar] [CrossRef]
Publisher’s Note: MDPI stays neutral with regard to jurisdictional claims in published maps and institutional affiliations. |
© 2021 by the authors. Licensee MDPI, Basel, Switzerland. This article is an open access article distributed under the terms and conditions of the Creative Commons Attribution (CC BY) license (https://creativecommons.org/licenses/by/4.0/).