1. Introduction
New policies in Colombia include the use of a multipurpose cadaster that allows for the formalization and registration of land and property rights in rural areas where cadaster systems and data are outdated. Many projects are being developed in Colombia that aim to update the Colombian cadaster, especially in rural areas. One of them is known as the ‘Modernization Land Administration Project’, the aim of which is the collection of cadastral data (physical, legal, and economic) as a basis for public policy design and implementation of a Land Management System, in which is essential the production of quality information according to the standards established by the cadaster and mapping agency (IGAC) [
1]. Therefore, the possibility of implementing a fast, simple, and low-cost methodology for land administration, such as a Fit-For-Purpose approach, allows the right holders to register the boundaries of their parcels using a smartphone application connected to a GPS receiver. Using this methodology, landholders walk along the borders of their land to survey their parcels by collecting points, creating a polygon as a spatial representation of their land parcels. Then, in a public inspection process in a community meeting, the owners or possessors mutually agree on the boundaries of their parcels. This is related to an efficient process of conflict resolution and the parcels can be formalized by the government organizations in charge of this mission in the country [
2].
In the Colombian context, the Fit for Purpose Land Administration methodology has been implemented in several pilot projects with the participation of governmental organizations involved in the land administration process and in join efforts with academic institutions such as ITC of Twente University and the Universidad Distrital Francisco José de Caldas to evaluate this methodology in the Colombian context through a Memorandum of Understanding with the Cadastre, Land Registry and Mapping Agency (Kadaster) of the Netherlands [
3].
The implementation of Fit for Purpose Land Administration in Colombia is restricted by rigid rules regarding data acquisition procedures for cadastral information, especially in terms of the quality of the data. For this reason, it is necessary to determine how to control and measure the data quality for the data collected with the FFPLA methodology in order to ensure the correct application of the technical specifications for cadastral surveys in the country, and thus to show that it is not only about the question if the procedure of this methodology is applicable in Colombia, but also about ensuring the quality of the data.
This paper aims to show the results of a project that had as its primary purpose the creation of the Fit for Purpose Land Administration quality assurance model, which includes the application of ISO 19100 technical standards for spatial data and the concepts of the product life cycle and the FFPLA data quality model. In order to validate the quality assurance model, the quality elements of Positional Accuracy and Logical consistency were measured in order to demonstrate how well a dataset conforms to the product specifications and to determine whether FFPLA data are of sufficient quality for the Colombian multipurpose cadaster.
2. Materials and Methods
The Fit for Purpose Land Administration methodology is based on gradual quality upgrades, which must guarantee total coverage of cadastral data with adequate quality to be included in the Colombian Multipurpose Cadastral System. This implies that the capturing and recording of land information must be maintained permanently until gradually reaching the highest levels of quality; in other words, the methodology involves the following five levels of quality [
4]:
- (a)
Quality Level 1: Recording of Land Interest;
- (b)
Quality Level 2: Recording of Land Claim;
- (c)
Quality Level 3: Recording of Recognition;
- (d)
Quality Level 4: Registered Land Right;
- (e)
Quality Level 5: Published Land Right.
In Colombia, the Fit for Purpose Land Administration approach was focused for the Land Titling process; for this reason, we considered starting with a basic quality level, which means quality levels one to four, and then making continuous improvements to reach optimal quality with level five [
4].
2.1. FFP Quality Assurance Model
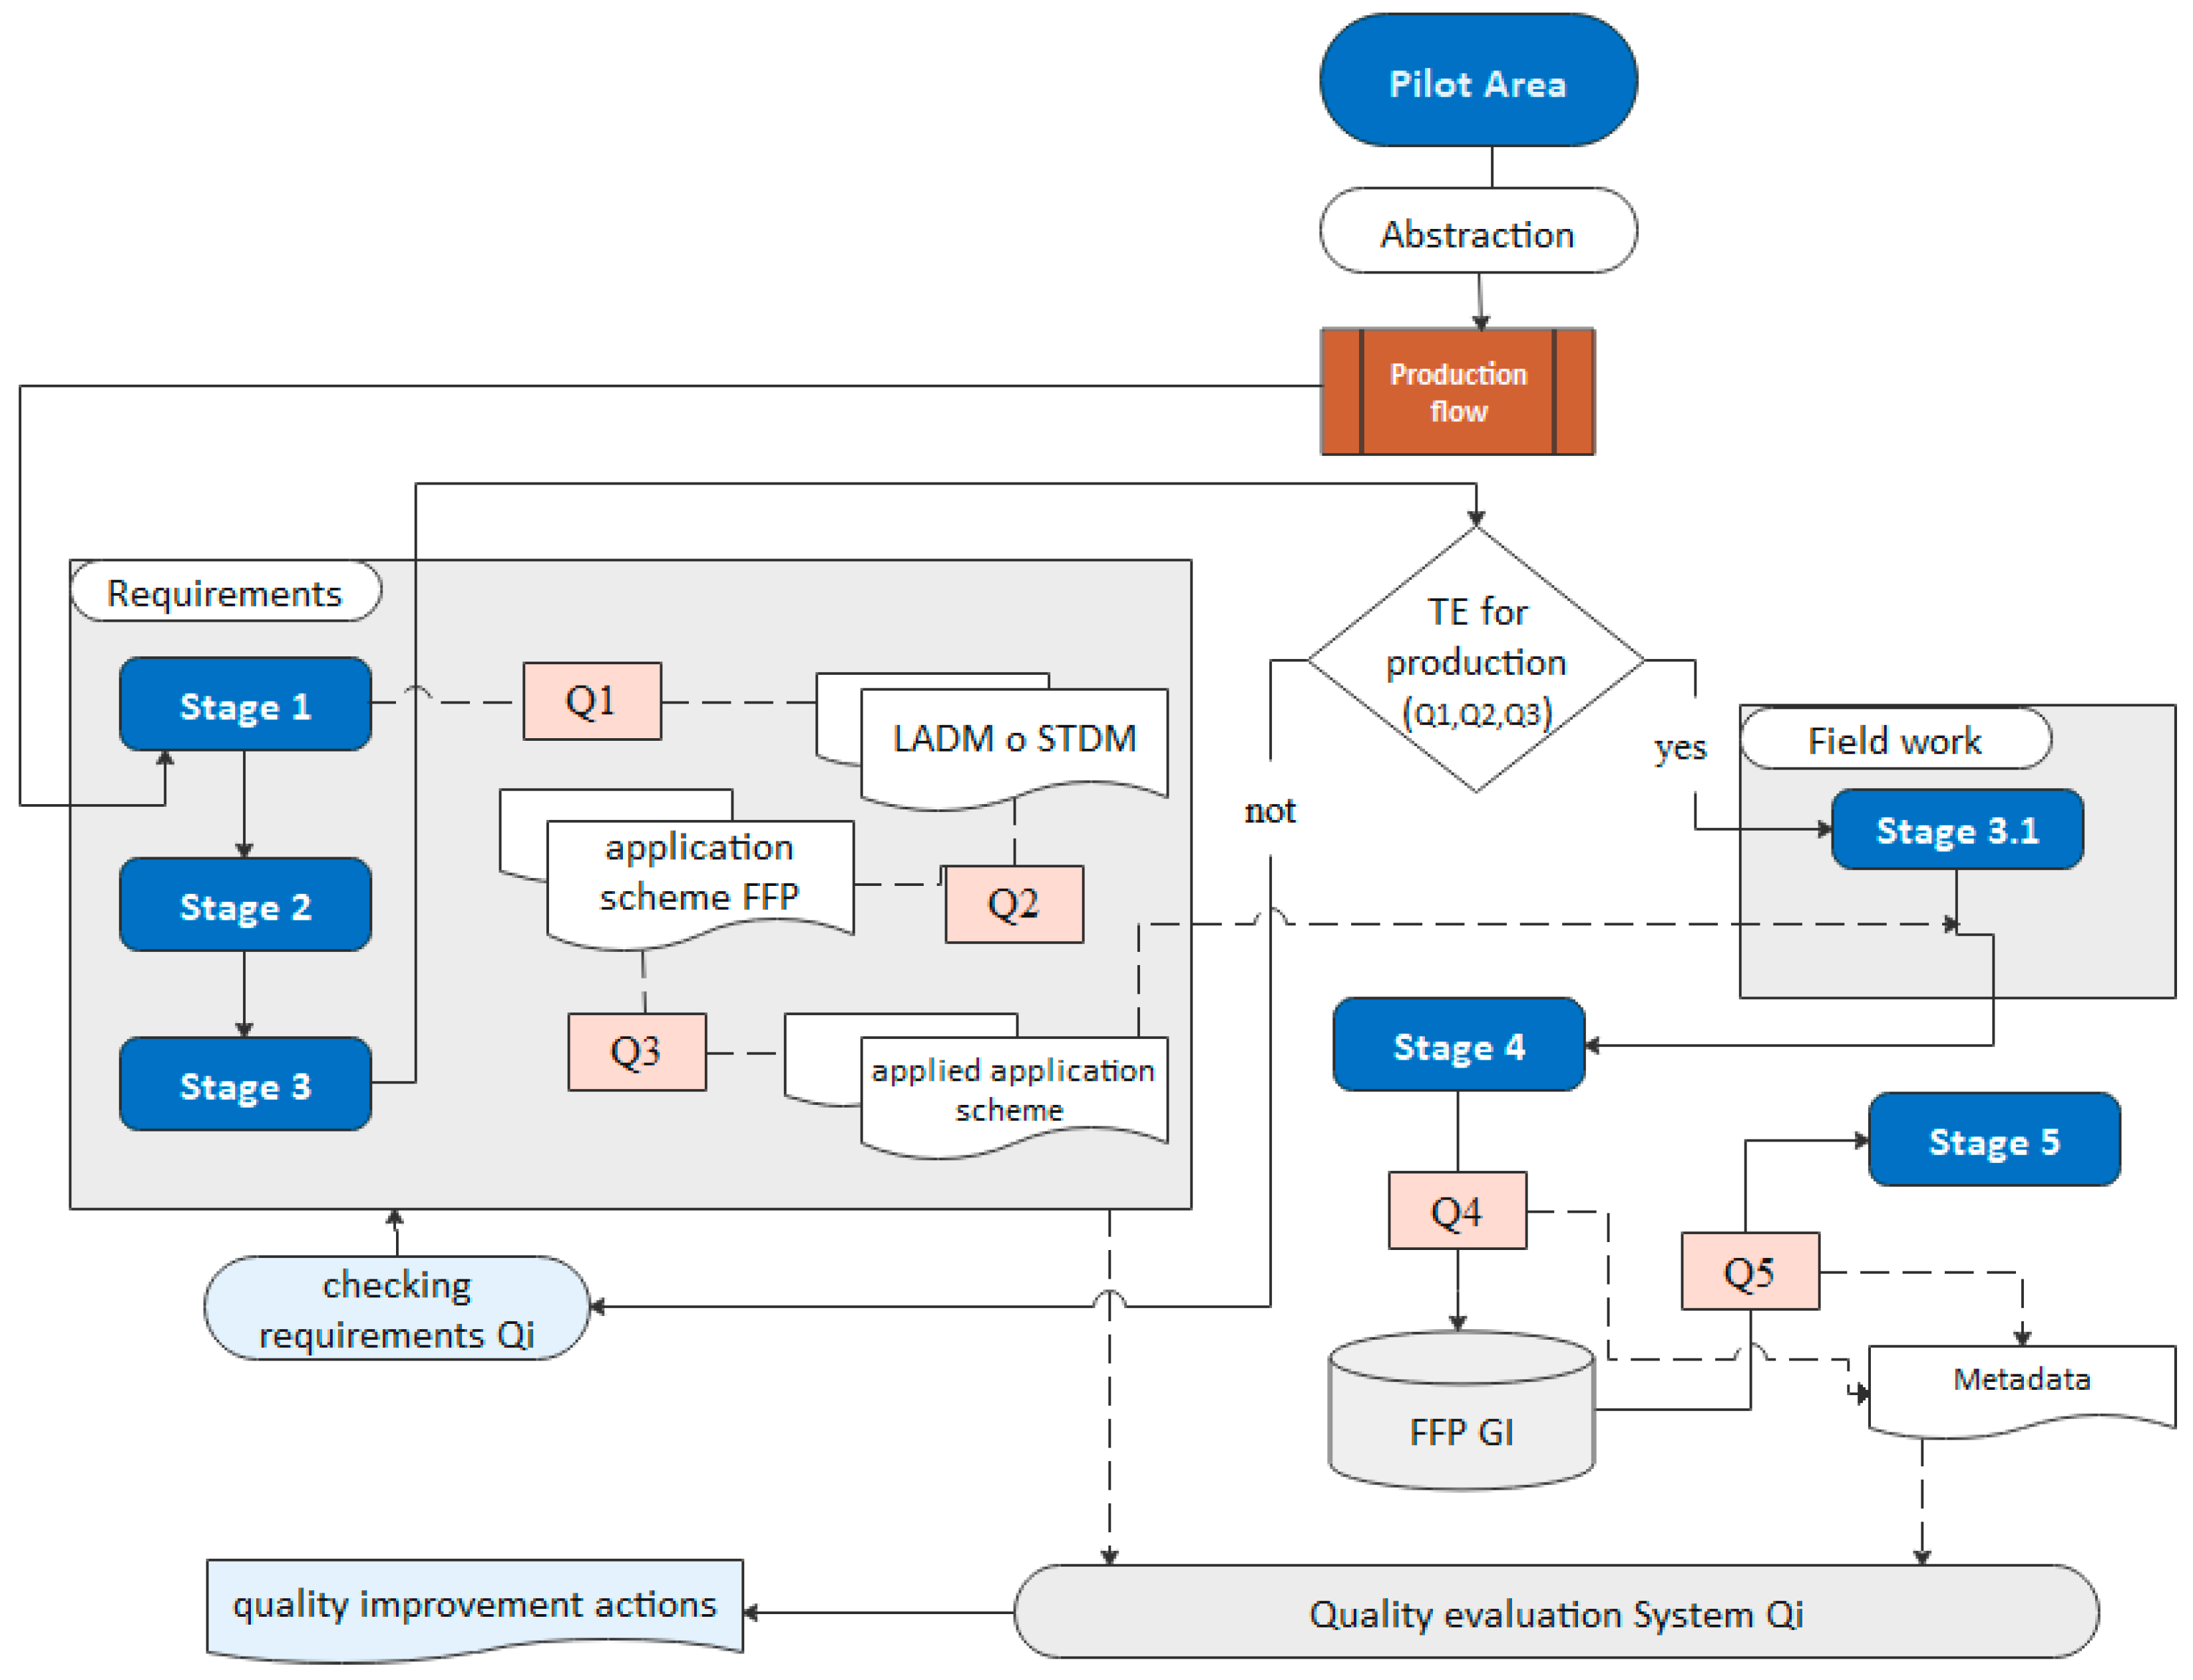
The Fit for Purpose (FFP) quality assurance model, as shown in
Figure 1, integrates the methodology’s production flow, the product’s life cycle (stage 1 to stage 5), and the quality evaluation specifications (Q1 to Q5); therefore, this model involves the following stages in the Colombian context [
5]:
Stage 1: The people involved must understand and become familiar with the FFPLA methodology and the activities in which the respective technical specifications must be applied.
Stage 2: The main activity is focused on exploring and analyzing existing information in different databases of governmental entities (municipalities) in the area to be measured.
Stage 3: Field work preparation and data collection are the activities carried out at this stage. Likewise, the technical specifications for the creation of the property data must be defined (Q1, Q2, and Q3 requirements, according to the level of quality).
Stage 4: Data storage and post-processing are then carried out, applying the technical specifications to accomplish the quality requirements.
Stage 5: This stage involves activities such as public inspection, FFP validation and product elaboration, quality evaluation, and quality reporting (Q4 and Q5 requirements, according to the level of quality).
The quality assurance model comprises five types of conformance (
Figure 1), namely Q1, Q2, and Q3, associated with the conceptual quality assessment, Q4, associated with the internal product evaluation, and Q5, referring to the valuation of data confronted with those in the terrain. The conformance results in functions Q1–Q5 are registered in the verification system, a conformance report that allows for a clear vision of the product’s quality and for improvement actions to be carried out based on that report.
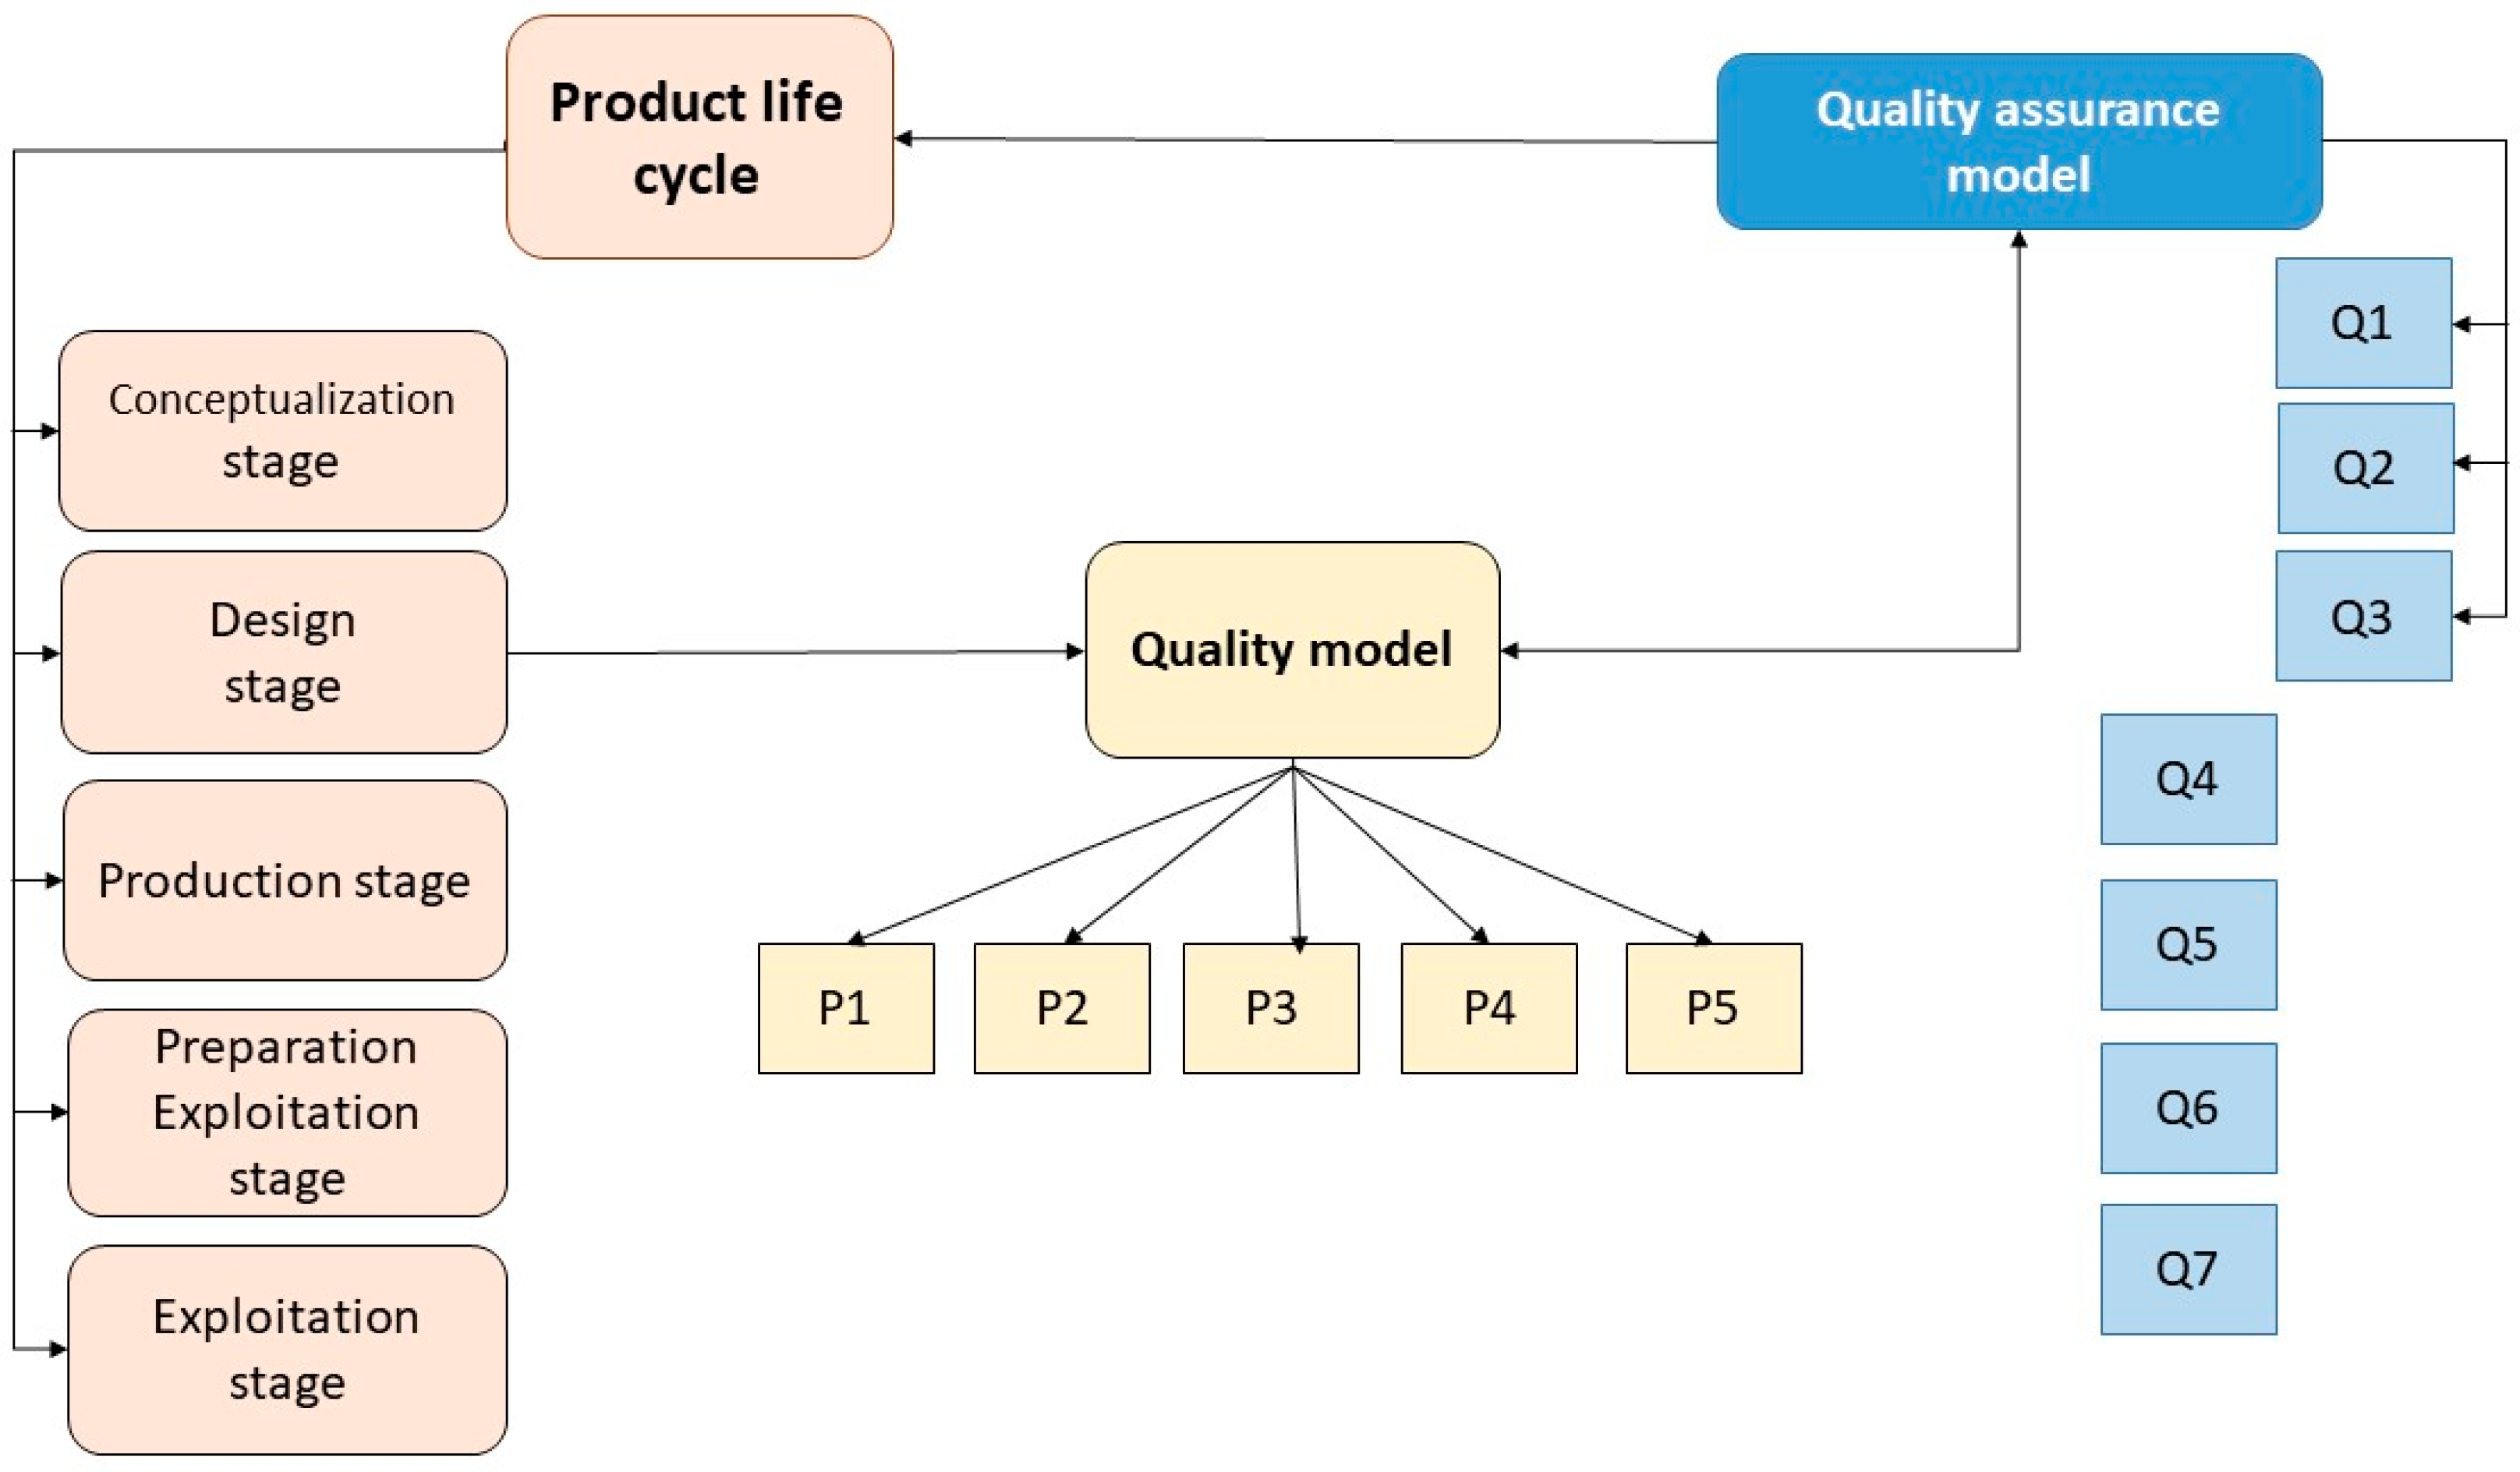
Quality Model
The FFP quality model determines the first activity as defining the quality of the product framed in the product life cycle, which involves five stages, as follows (
Figure 2) [
6]:
- (a)
Conceptualization stage: defines the needs and demands of the product and describes the general product features;
- (b)
Design stage: defines the product itself and includes evaluating its effectiveness, the definition of the quality model and the production methods, and quality control;
- (c)
Production stage: this activity is based on the Product Specifications (Technical specifications);
- (d)
Stage of preparation for exploitation: defines the activities before the exploitation of the product itself;
- (e)
Exploitation stage: defines the activities after the production, and it refers to geographic information or the product itself.
In this way, the FFPLA quality model is defined as a model describing the quality of spatial data as a component of the quality assurance model (
Figure 2). The conceptual model of the FFP quality model includes three components according to ISO 19157:2013, namely requirements, conformance, and evaluation processes, which address the following items [
7]:
P1—Product specification: here, the definition of the specification of the desired product is given such as is specified in the international standard ISO 19131;
P2—Quality objectives: the quality objectives and requirements are identified, addressing the quality elements of the ISO 19157 standard, thus giving complete product specifications;
P3—Production specifications: this item addresses product control, establishing requirements and production guidelines, where established procedures, manuals, and documentation are related to quality;
P4—Quality evaluation, reporting, and monitoring specifications: this item focuses on control methods, routine checks, quality sampling, and aspects to be used to evaluate the quality of the elements of interest. The quality is checked with levels of conformity pre-established according to the ISO 19157 standard;
P5—Quality improvement specifications: this item establishes the need for specific methods and tools for quality improvement in the product and production processes; thus, feedback on the quality of the product in each production process allows for the execution of improvement actions.
In addition, the quality model establishes an action framework for the quantitative information of the dataset from the quality elements; the production through its requirements and technical specifications; the evaluation specification that establishes control and checking methods, sampling methods, the way in which the quality of the product should be informed; and the production stage, articulated by a quality assurance model and a general quality scheme [
7].
As a relevant component of the quality model, the “Technical Specifications Profile for the Fit for Purpose LA methodology in Colombia” defines the FFPLA dataset’s characteristics. At the same time, it defines appropriate items that allow for the control of elements such as spatial and temporal reference systems, the type of spatial data, the conceptual model of the dataset, and others. Therefore, as part of the action framework, the evaluation of positional accuracy and logical consistency evaluation was carried out considering the FFP quality model and the FFP technical specifications profile [
6].
Quality Standards for FFP
For this work, the ISO 19000 standards of geographic information, published by the Spanish AENOR Technical Standardization Committee 148 [
8], were adopted by the Colombian government. Therefore, these series of standards were formalized in the year 2020 by the Geographic Institute “Agustin Codazzi”, the cadastral and mapping agency of Colombia, to produce cadastral information in the frame of the multipurpose cadastral project. Consequently, for this study, these standards were explored, and the definition of how to apply them to the FFPLA quality assurance model is presented in
Figure 3.
An analysis of the applicable Colombian regulatory framework for field data collection and geographic information management was also made, taking into account the principles of the Fit for Purpose methodology. In this way, Resolution 471 of 2020 of IGAC [
9] establishes the measures, methods, and levels of conformity for each quality element of topographic data, without the concept of the quality assurance model that is open to producers, who have to report the data quality in a document. This resolution makes an adaptation to the quality measures of ISO 19157, such as the Root Mean Square Error (RMSE), which uses an external direct method for quality evaluation and implies the use of more accurate external sources and a confidence level of 95% [
9].
In addition, the authors analyzed the IGAC resolution 643 of 2018 [
10], which adopts the technical specifications for planimetric surveying of massive rural property data within the framework of the social ordering of rural property implemented by the National Land Agency (ANT). Therefore, based on this resolution, in the case of rural premises, the positional accuracy must ensure a 95% level of conformity and an RMSE of 0.41 m.
Finally, due to the Colombian context, the FFP methodology focuses on the capture of parcel borders and legal information related to the property. In this work, the authors adopted the specifications for capturing borders given by the ANT, which indicate the application of a direct method using GNSS equipment for small parcels or orthophotos for large parcels in order for the parcels to reflect their real form on the terrain.
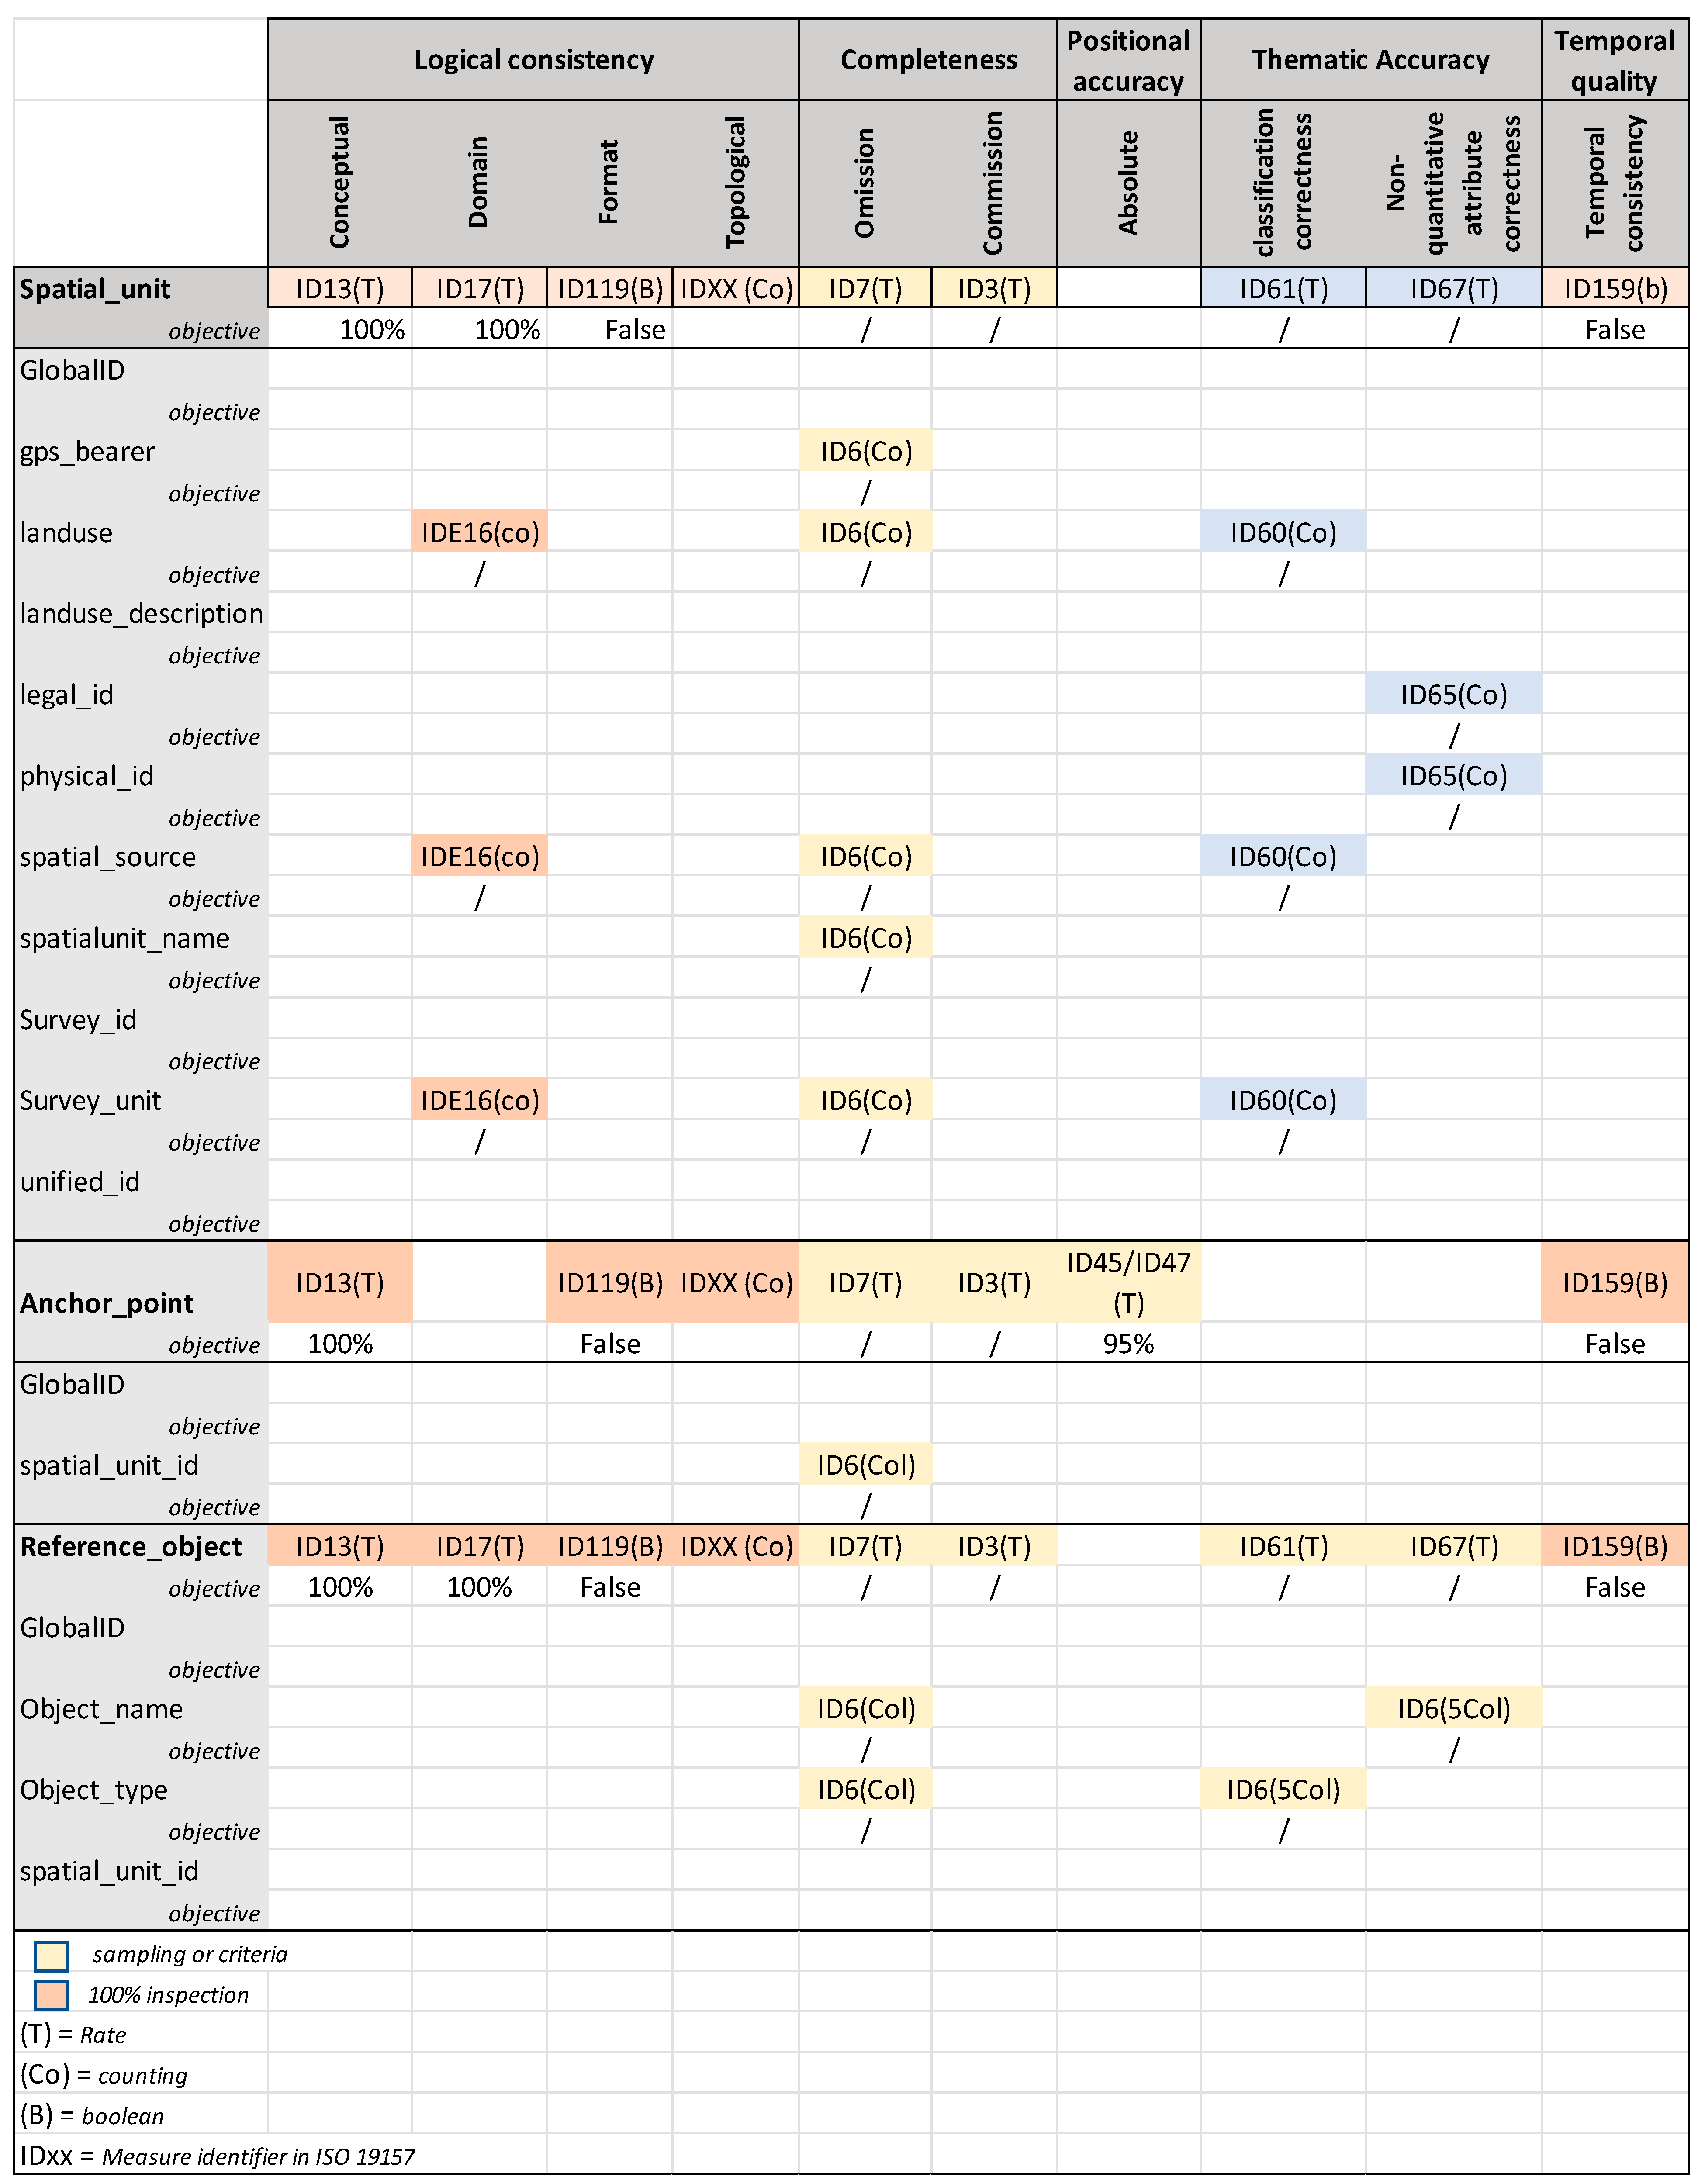
Quality Scheme for FFP
The concept of a quality scheme, according to the NTCA_01003, is the materialization and synthesis of a quality model and is a matrix tool with product-related categories and attributes arranged in a simple and orderly manner. The categories are the objects, which are established in columns, and the quality elements to be evaluated are arranged in rows, with their respective measures and sampling methods to be applied according to the nature of the predefined product [
7].
The quality scheme is a simple way of organizing and showing the information depicted in the FFP methodology’s general quality model applied in Colombia (
Figure 4).
The quality scheme in
Figure 4 shows the geographic objects defined for the FFPLA approach in the Colombian context, such as spatial unit, anchor point, and reference object. The quality elements to be measured for each object include logical consistency, completeness, positional accuracy, thematic accuracy, and temporal accuracy [
11]. The quality scheme also includes the identifiers of the quality measure (ID) [
11], the quality measure expressed in rate (T) or indicators as count (Co) and Boolean (B), and the conformity expressed as a percentage (%). The yellow color indicates the sampling criteria objects selected for evaluation, and the peach color means the inspection is conducted for 100% of the data.
For instance, for the Anchor point object in
Figure 4, the quality element “absolute positional accuracy” is presented in the following way [
5]:
In the case of the positional accuracy quality element, sampling can be carried out by selecting the geographical objects; however, the selection of the elements based on the area can also be considered. For this work, the population was defined for the sampling—first the object-based selection and then the object area-based selection, according to the specifications given by ANT [
12].
A procedure was performed, as shown in
Figure 5, to evaluate the quality of the data regarding the positional accuracy quality element [
13].
3. Results
Once the quality assurance model was determined based on the quality model and the quality scheme for FFP, the quality elements according to the ISO 19157:2013 standard [
11] were determined to evaluate the quality of the data collected in the Municipality of Apartadó (Vereda Los Mandarinos) in the year 2018 using the FFP methodology. The results of this work are presented below, and the points related to the parcels are classified as presented in
Figure 6 [
6]:
- (a)
Anchor point: a point located in more than two boundaries, or it represents a change in the type of boundary (e.g., the change from river boundary to road boundary);
- (b)
Vertex point: the point between two anchor points (without a change in owner or type of boundary);
- (c)
Reference point: this point records the type of object hat borders the boundary; it indicates the element of the landscape that is part of the boundary, such as rivers, roads,, etc.
3.1. Positional Accuracy Evaluation
The quality evaluation of the positional accuracy element [
11] was performed for data collected in the Vereda Los Mandarinos, using the following product specifications [
5]:
Quality measure: UNE-EN ISO 19157 standard [
11];
Circular error to 95% of significance level (CE95): identifier 45 [
11];
Root Mean Square error: identifier 47 [
11].
Quality evaluation method:
The quality evaluation method applied was direct intern, where the population was based on the polygon area, and by criteria sampling. Data acquisition involved fieldwork using a GPS receiver.
Conformance results:
The sampling criteria were based on the following elements:
Anchor points (boundary points) must be collected by fieldwork. The points collected by another source are excluded;
One anchor point must have two measurements;
The sampling data must be distributed homogeneously in the dataset.
The anchor points were classified into four classes, as shown in
Table 1 [
5].
The Root Mean Square Error of planimetry (RMSE-P) corresponds to a measure in meters (m) of additional control that verifies the data’s behavior in the evaluation process (
Table 1). The radius in meters (m) describes a circle where the true location of a point with 95% probability is located (
Table 1). Classes A, B, C, and D establish a quality classification to discriminate different levels of data quality. In this way, at least 90% of the points must have a classification so that the dataset can be considered reliable and conforming (
Figure 7).
The result of this evaluation of data quality in Los Mandarinos, regarding the positional accuracy quality element for the total 52 points, was 96%, thus meeting the established conformance levels, and the points were classified within one of the four classes.
3.2. Logical Consistency Evaluation
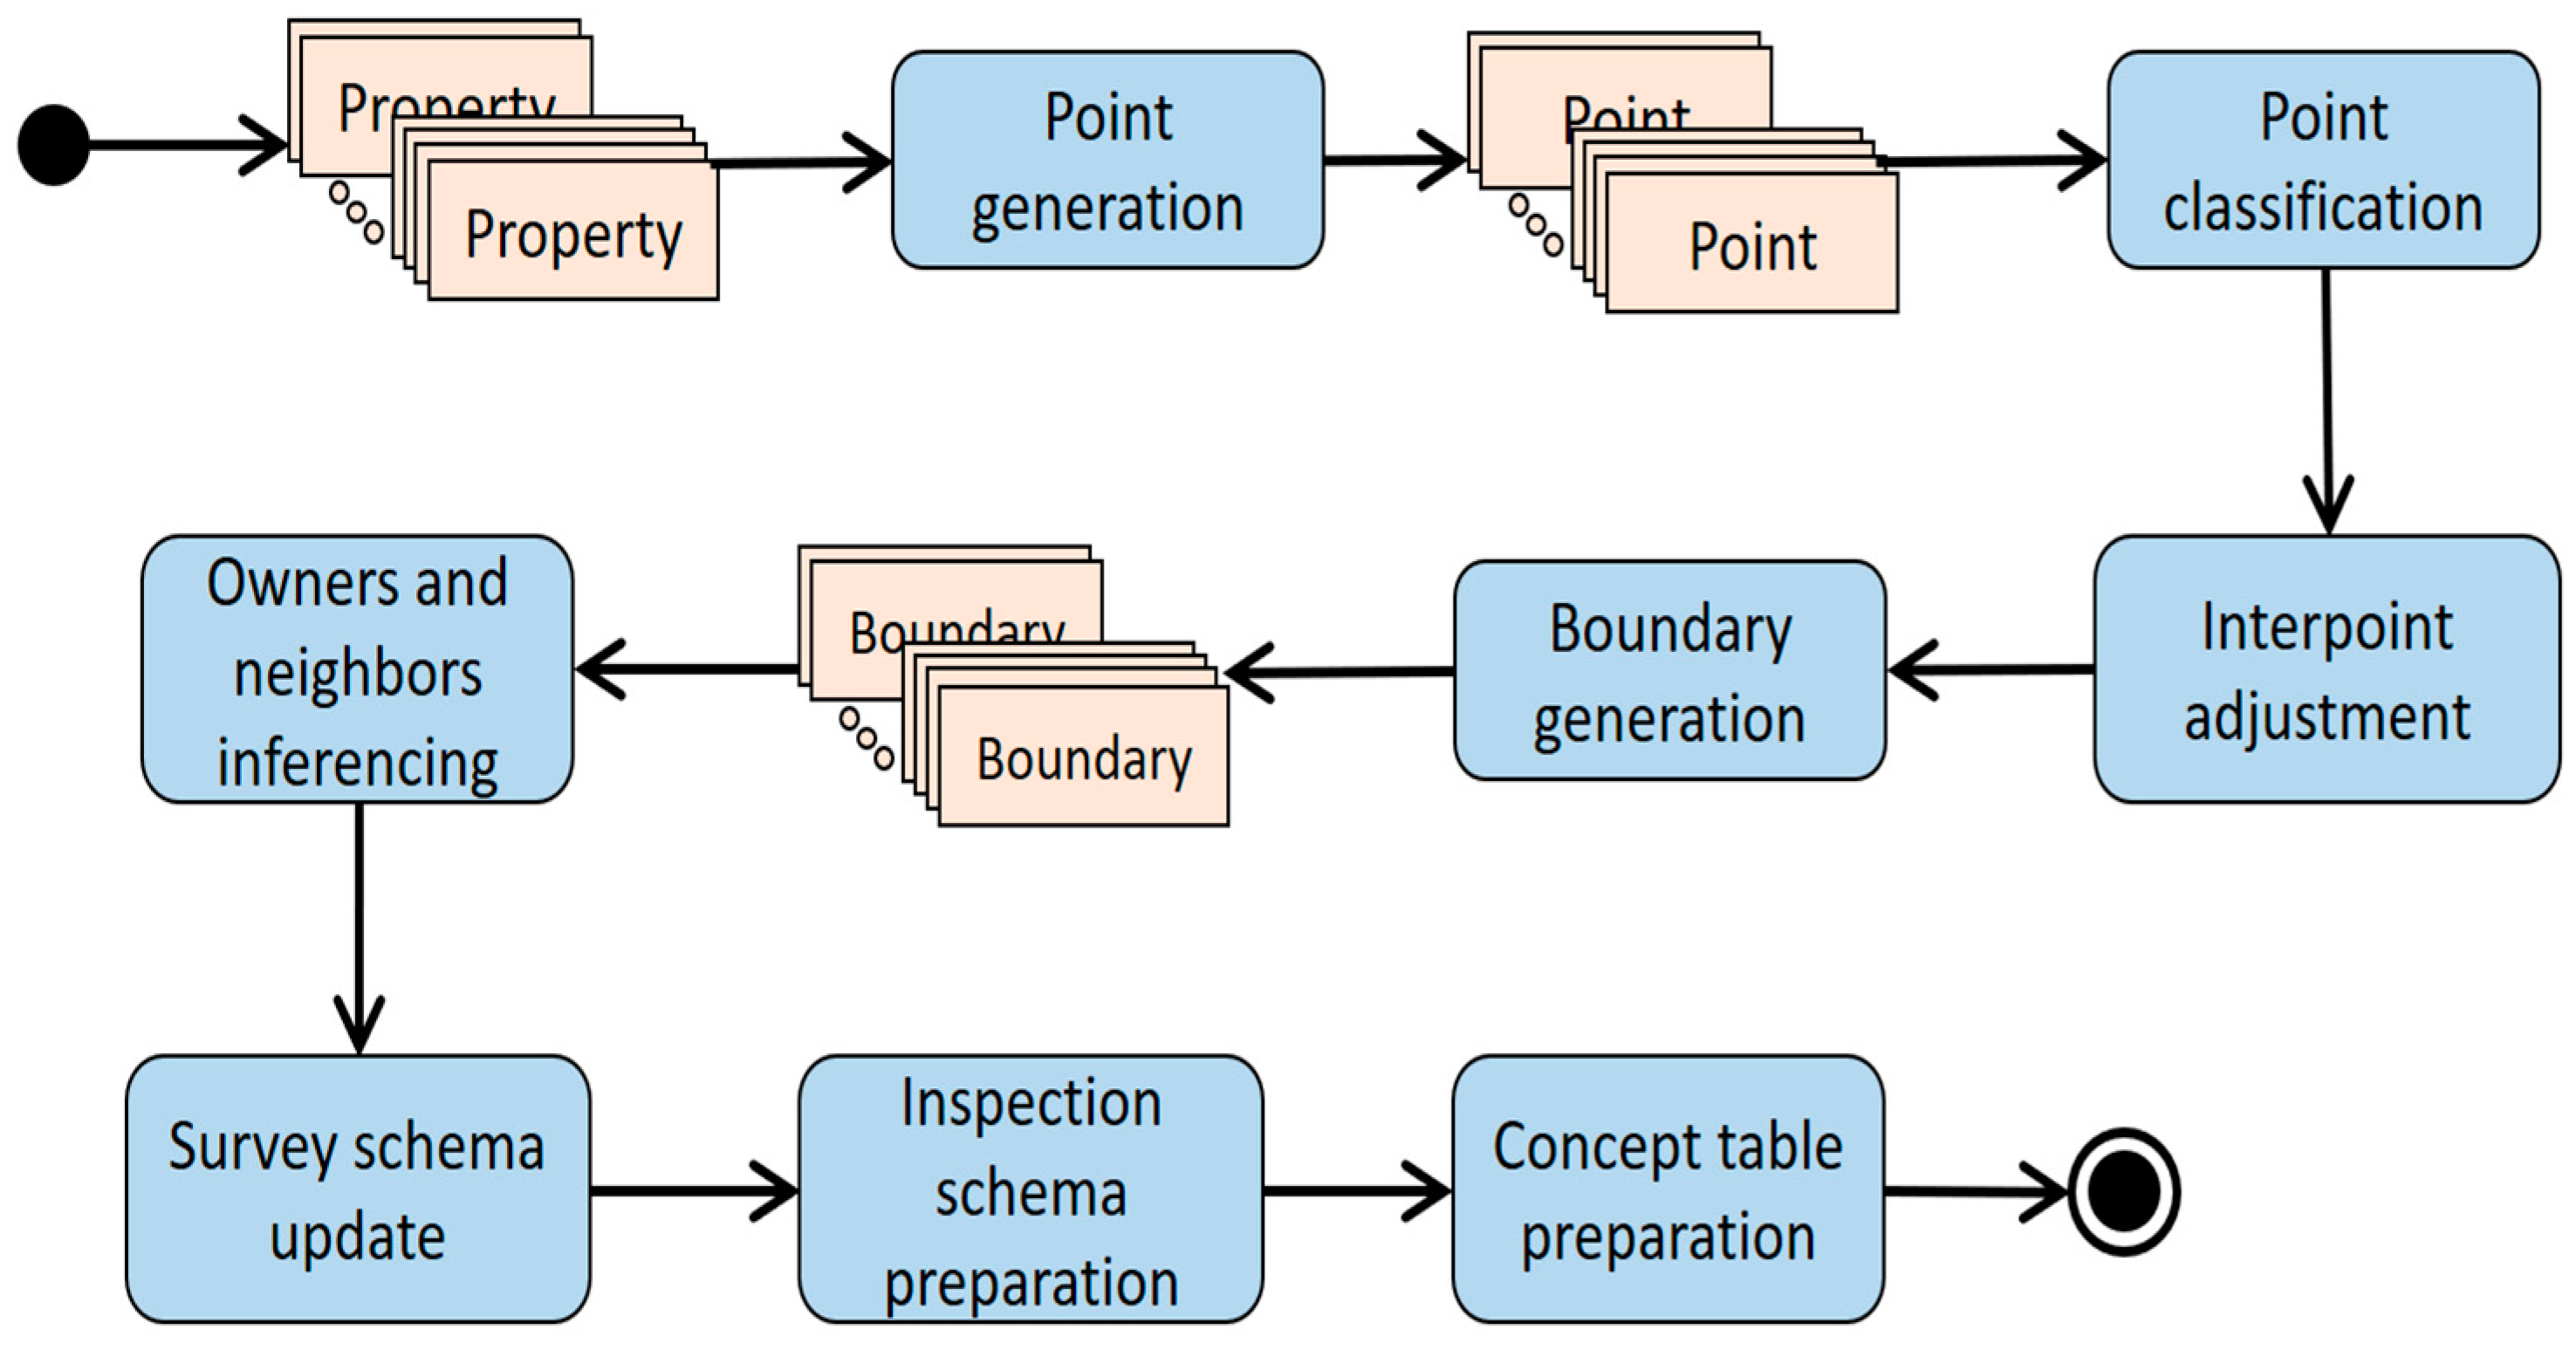
Next, the logical consistency was evaluated in the post-processing phase, which began by loading information into PostgreSQL from the ArcGIS Geodatabase, since the latest version of Collector for ArcGIS can generate information in a PostgreSQL scheme. The post-processing activities are shown in
Figure 8.
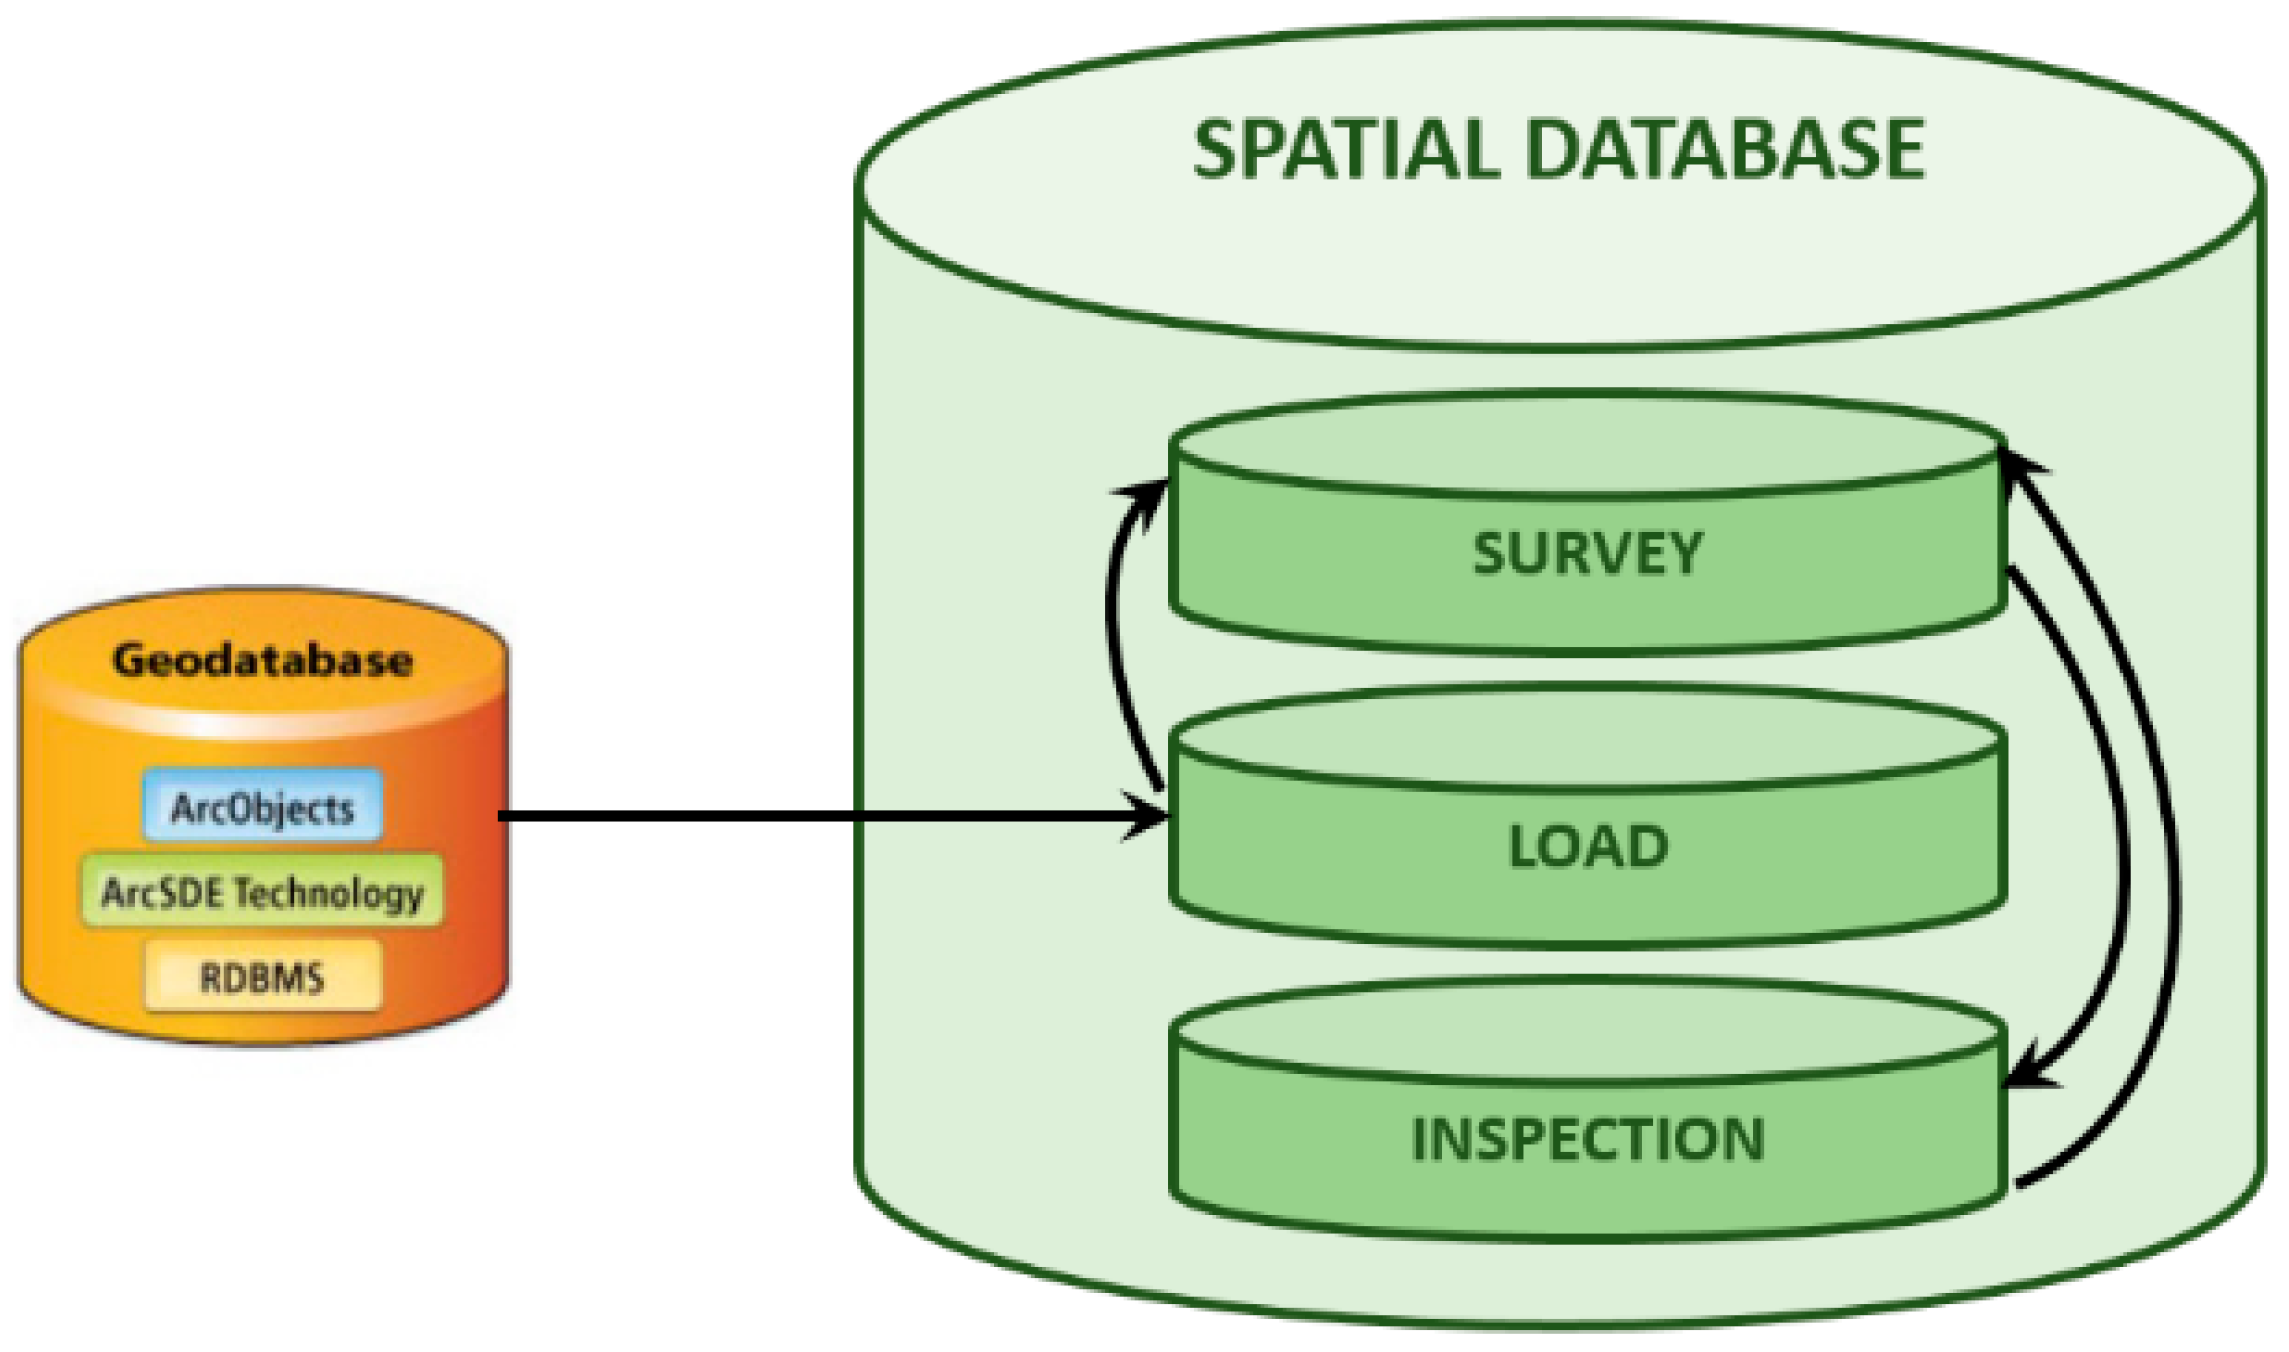
The spatial database was built using the following three schemes with specific purposes (
Figure 9) [
14]:
- (a)
Survey: Scheme to store the final information. It contains all the information of the area of study for this case, namely the data of Vereda Los Mandarinos.
- (b)
Load: Scheme to load the information from external sources. In this schema, the data are cleaned, and the topology consistency verification between neighboring boundaries is carried out.
- (c)
Inspection: Schema used in the public inspection. Shows and verifies the information from the owner’s point of view, including the adjustment between neighbors’ boundaries. The database is prepared to store all participants’ concepts, digital signatures and fingerprints in the public inspections.
After loading the information into the database, the spatial information is included in the form of a polygon feature; likewise, the data can also be stored as points and its accuracy. If the points do not exist, it is necessary to generate them, because they will apply the algorithms that adjusts from the polygon representations of the parcel boundaries to real line (boundary)-based topology (starting from the situation as visualized in
Figure 6).
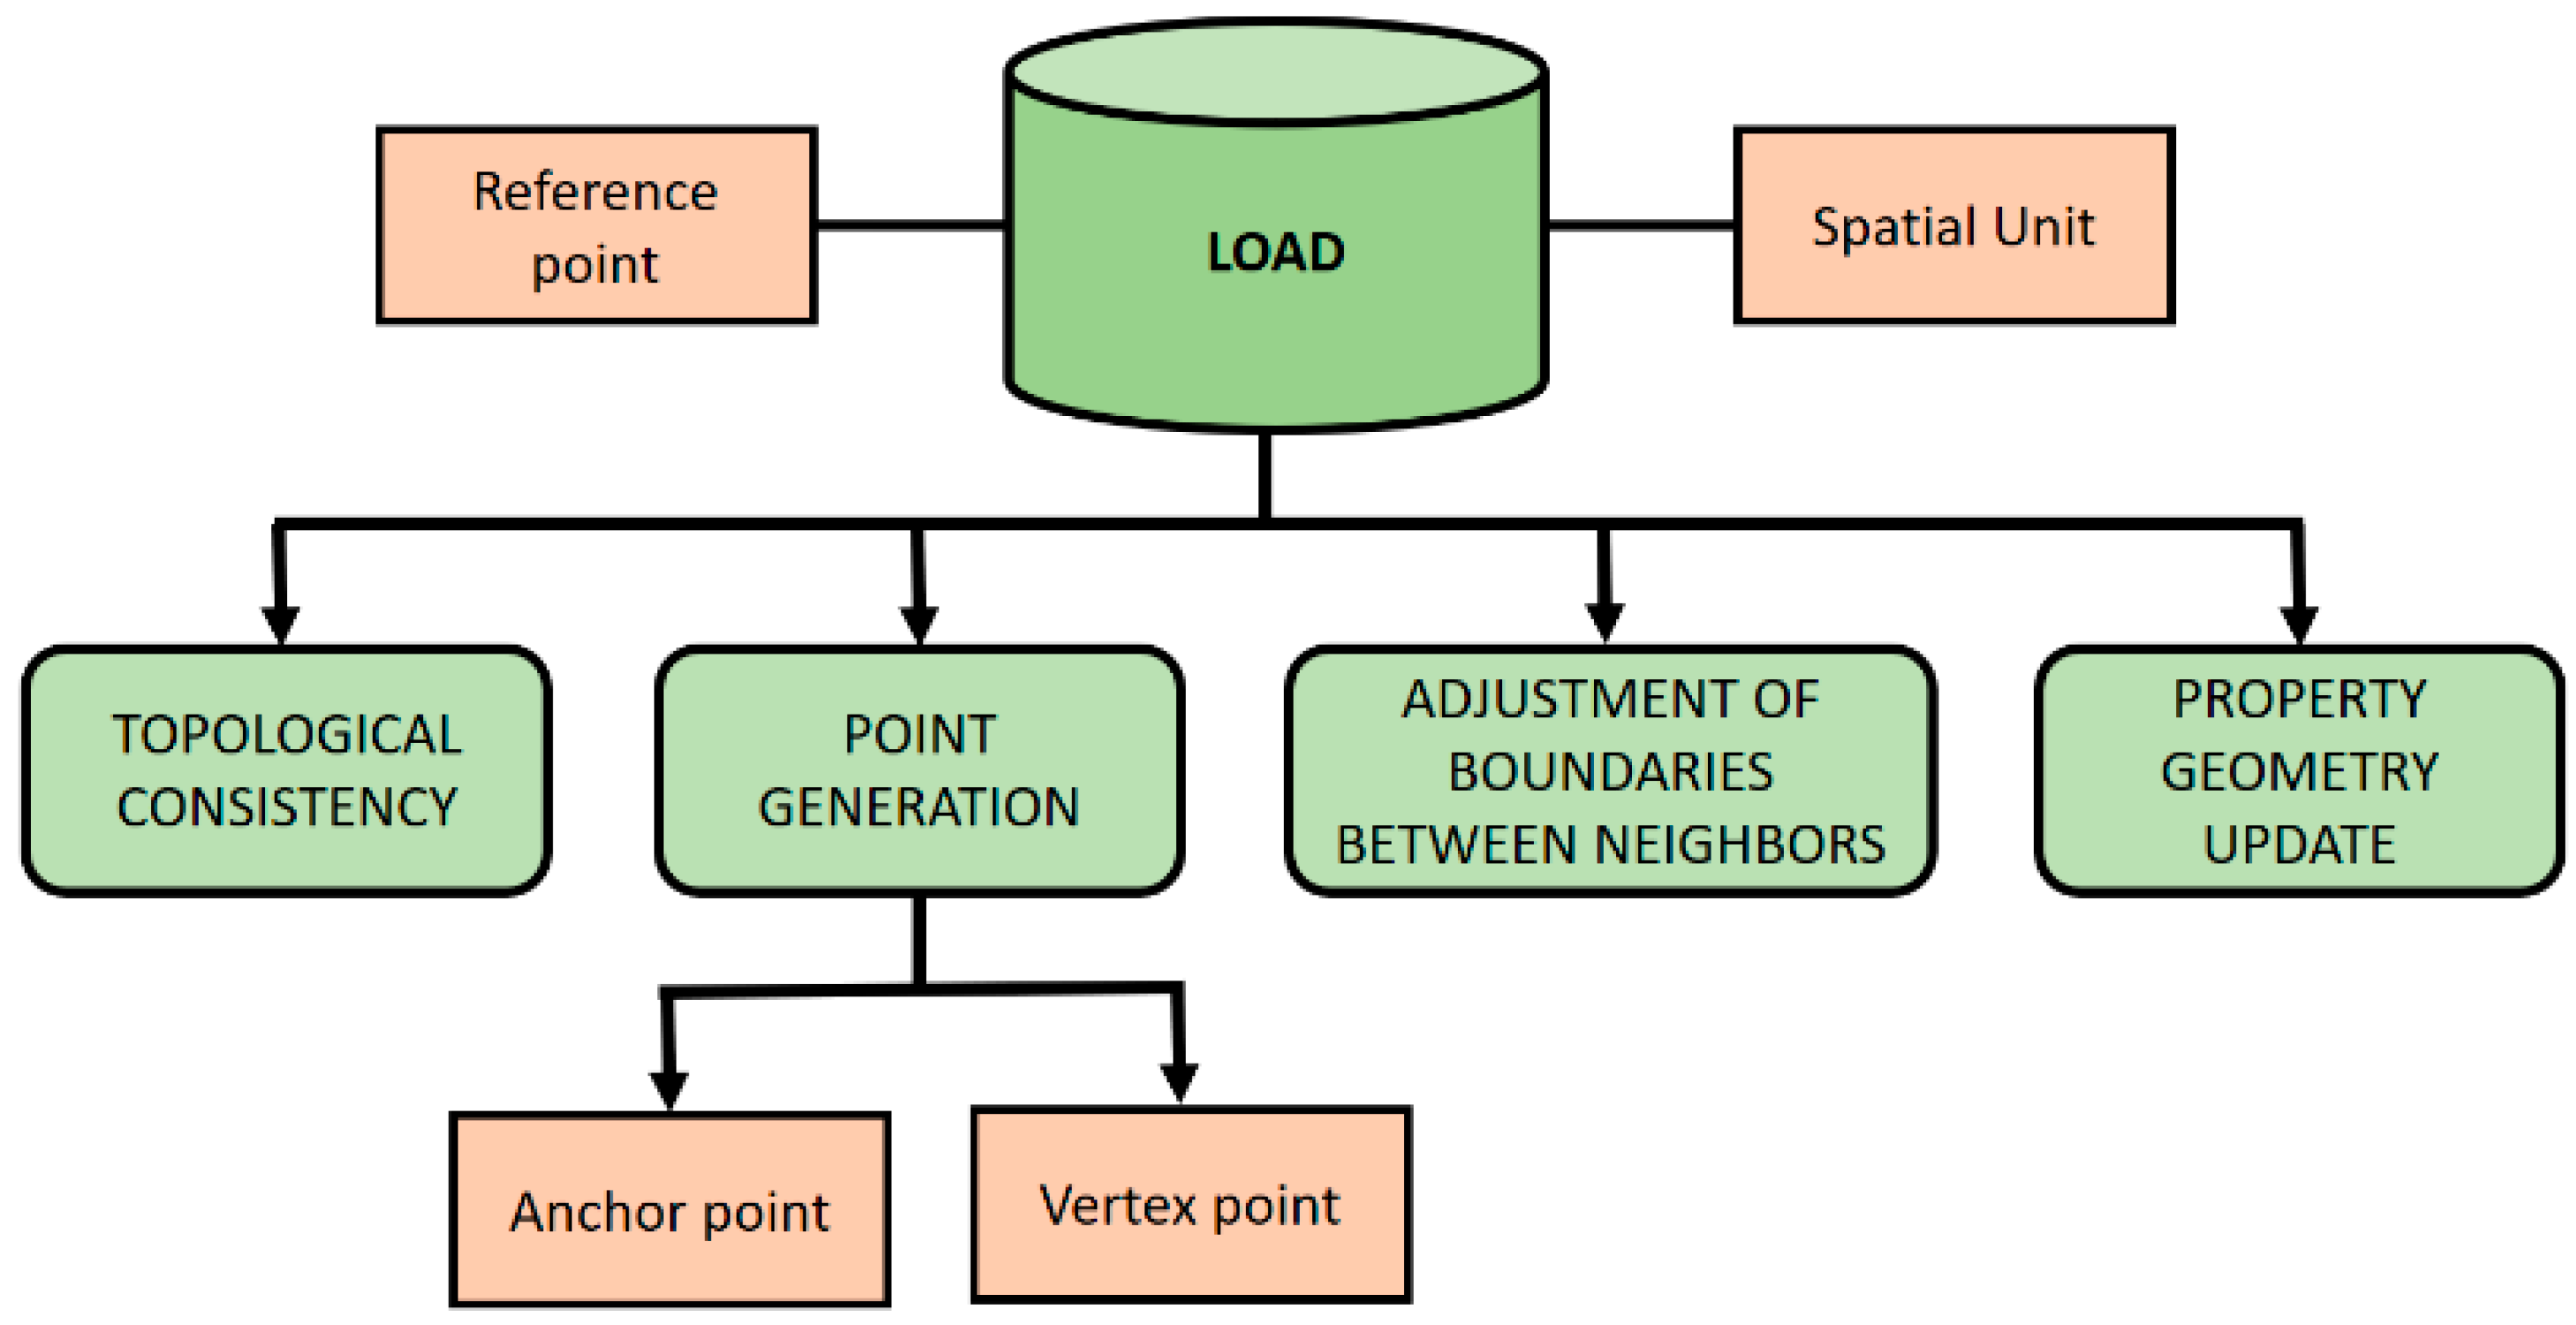
Figure 10 represents the objects and activities performed in the load schema.
A distance tolerance between points is defined according to the scale. Those points (from polygon representations of the different parcels) within the tolerance distance will be merged unless a reference point is associated with a boundary parcel that includes the merge points. The adjustment between points is accomplished by the “Weighted Symmetric Adjustment Algorithm” (WSAA), which works with two (
Figure 11 and
Figure 12), three (
Figure 13 and
Figure 14), or four points, and the function of which is to find an adjustment point, where the other points converge, using the accuracy of the GPS points to obtain the best locations for the placement of each point.
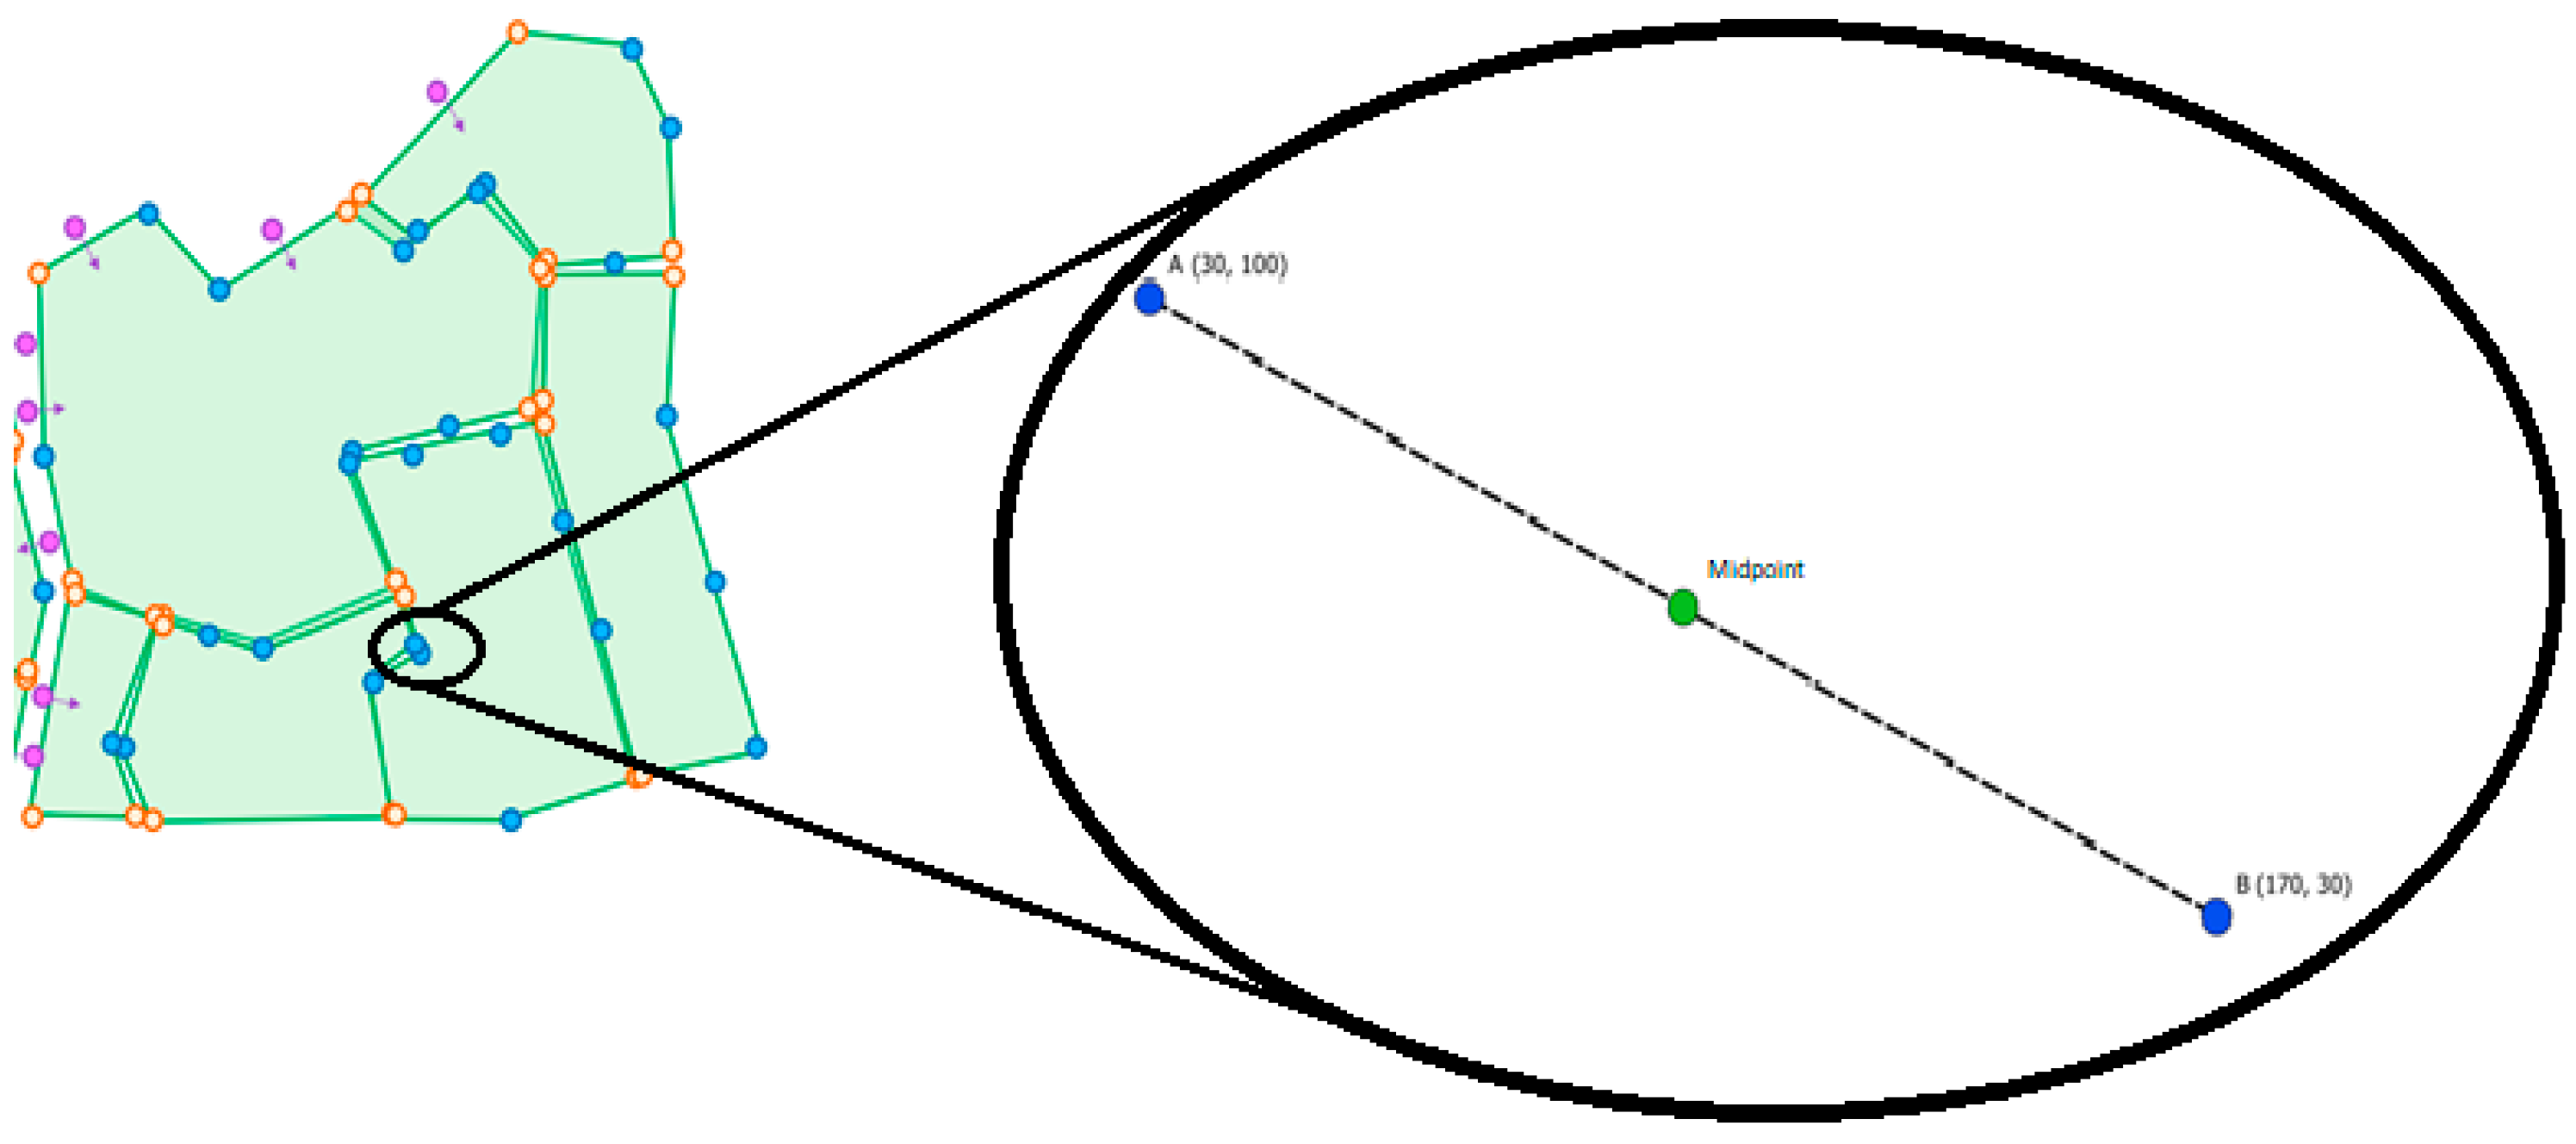
For example, suppose that two points in two parcel boundaries have been captured with a GPS device (A and B), at different times, but which reference the same point. The distance between points A and B is 156.5 cm. If the precision of the GPS collected points is not captured, the best alternative is the automatic adjustment of the two points in a common position to find the midpoint of the line that joins the two points, assuming that the real point is found somewhere between the two points in the space between them, as shown in
Figure 11.
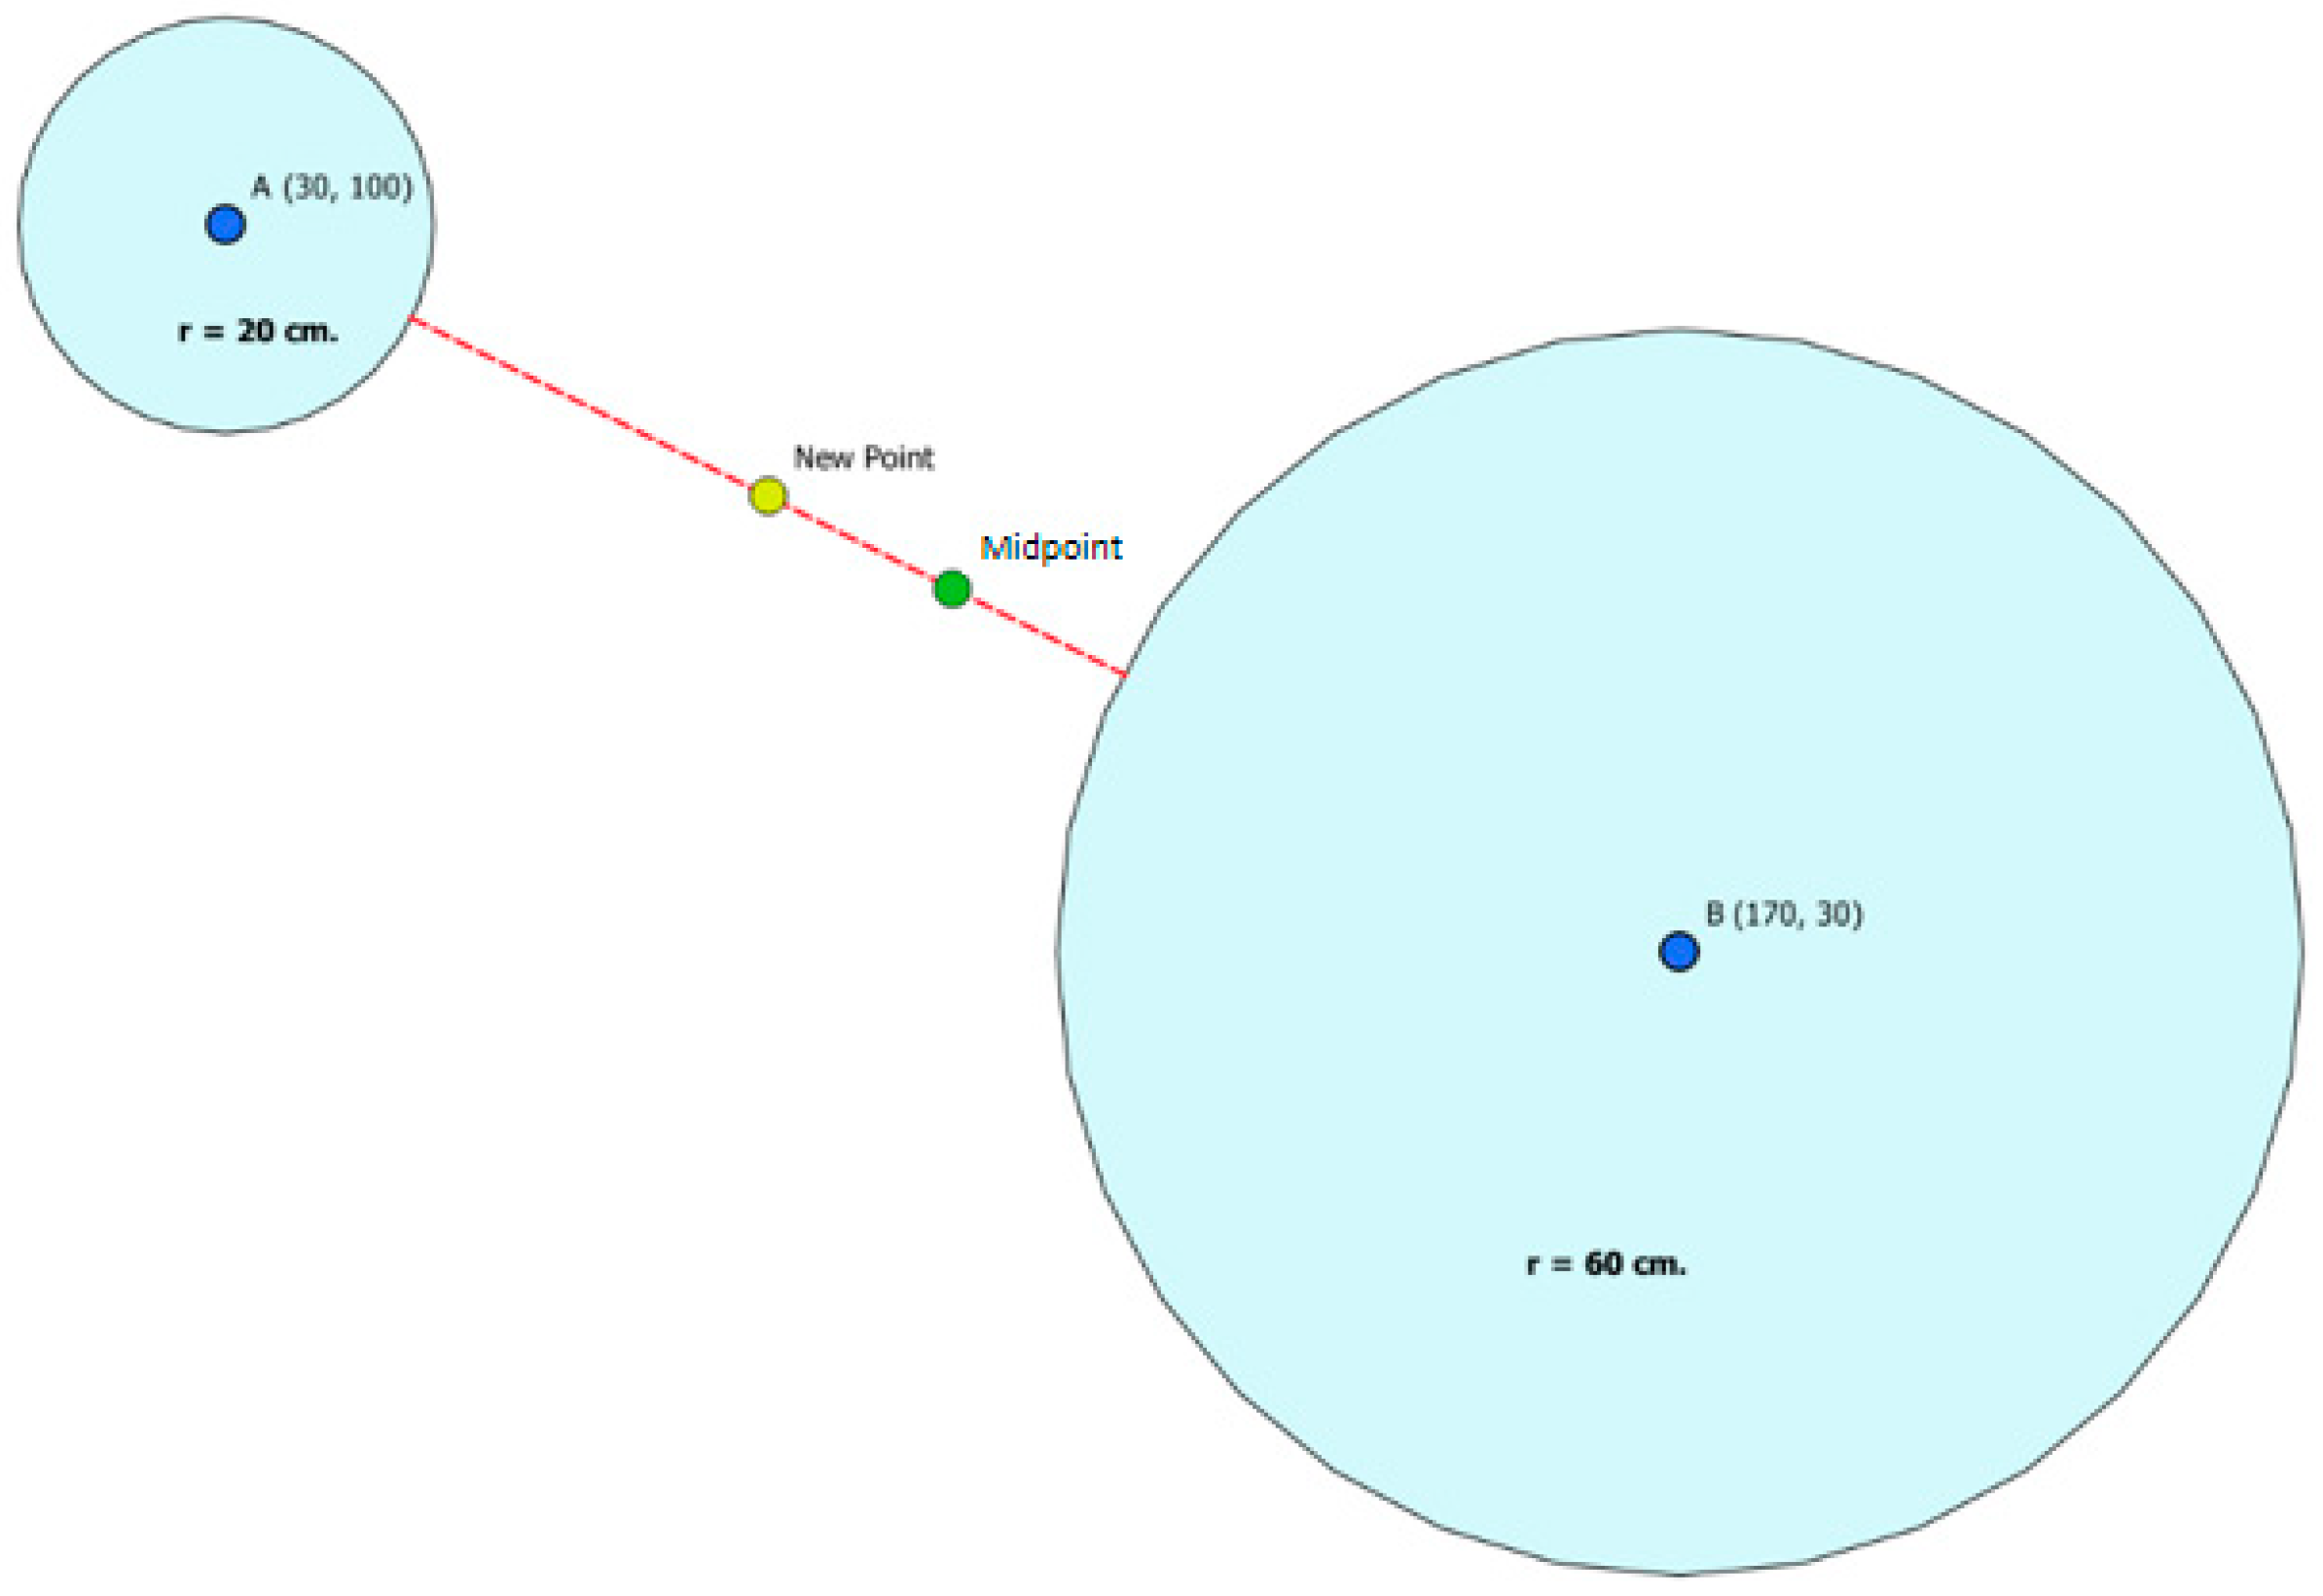
However, as the accuracy values associated with each point are provided, an automatic adjustment can be made that favors the point with the best accuracy. Assuming that the real point must be somewhere between the two points, the two points A and B are identified as the limits of the distances of the accuracy of each point in the direction of the other point. Then, the midpoint of the line formed between the accuracy limits is determined, as shown in
Figure 12. In the example, the new point is 19.91 cm nearer to point A with better accuracy.
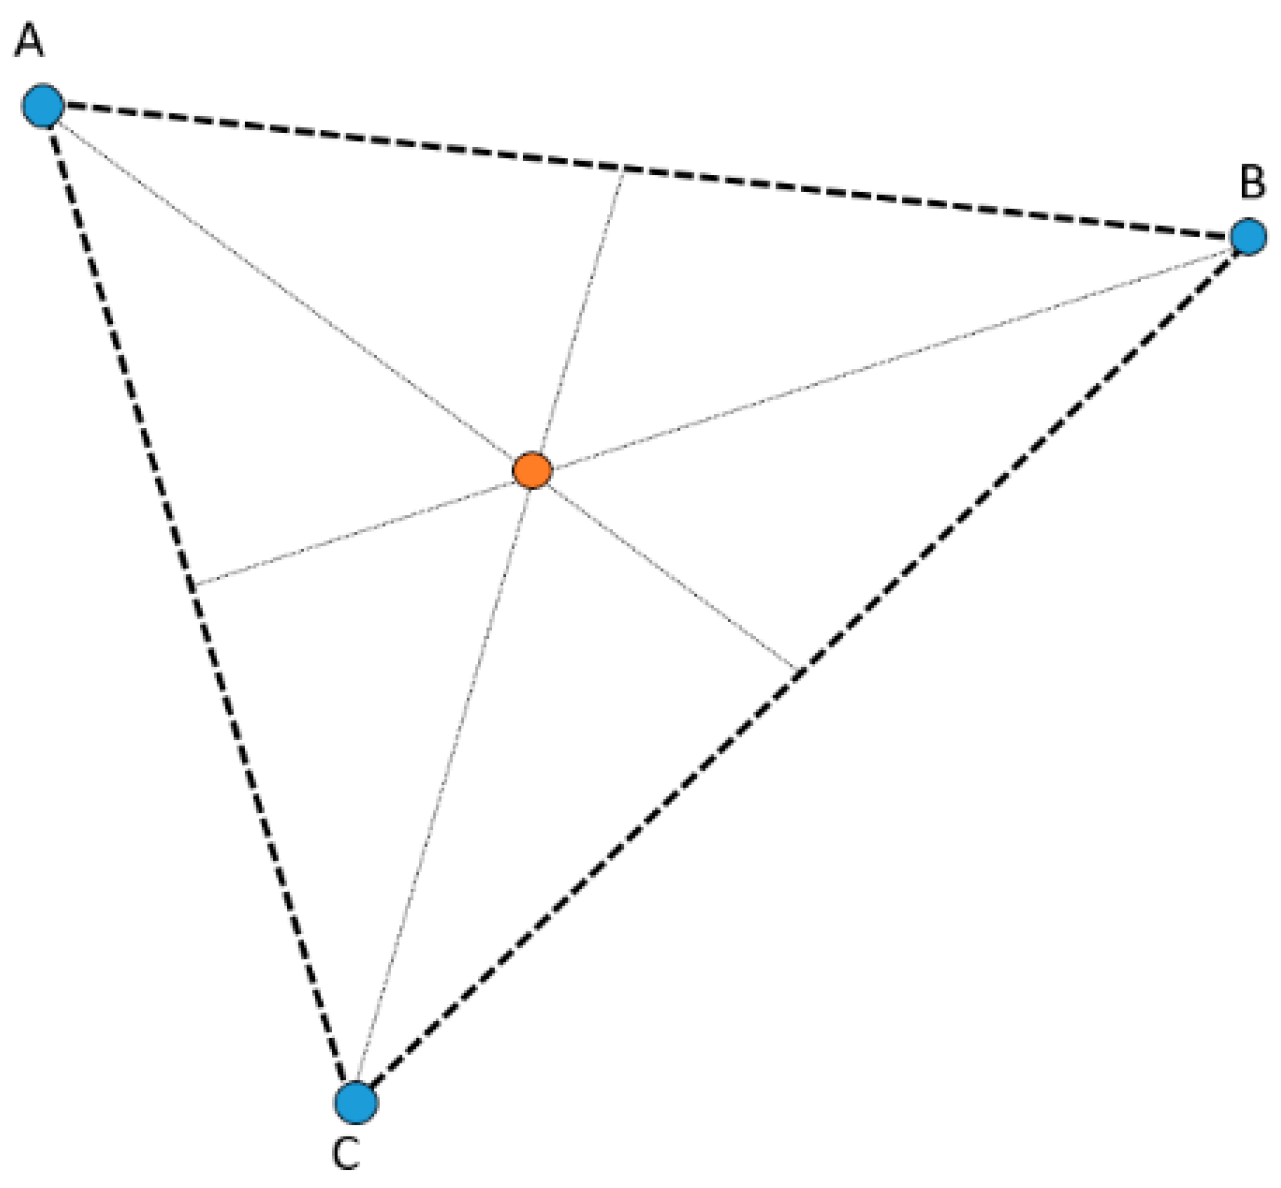
When there are three points as an input, none of which register the accuracy, the algorithm finds the barycenter of the triangle, as shown in
Figure 13.
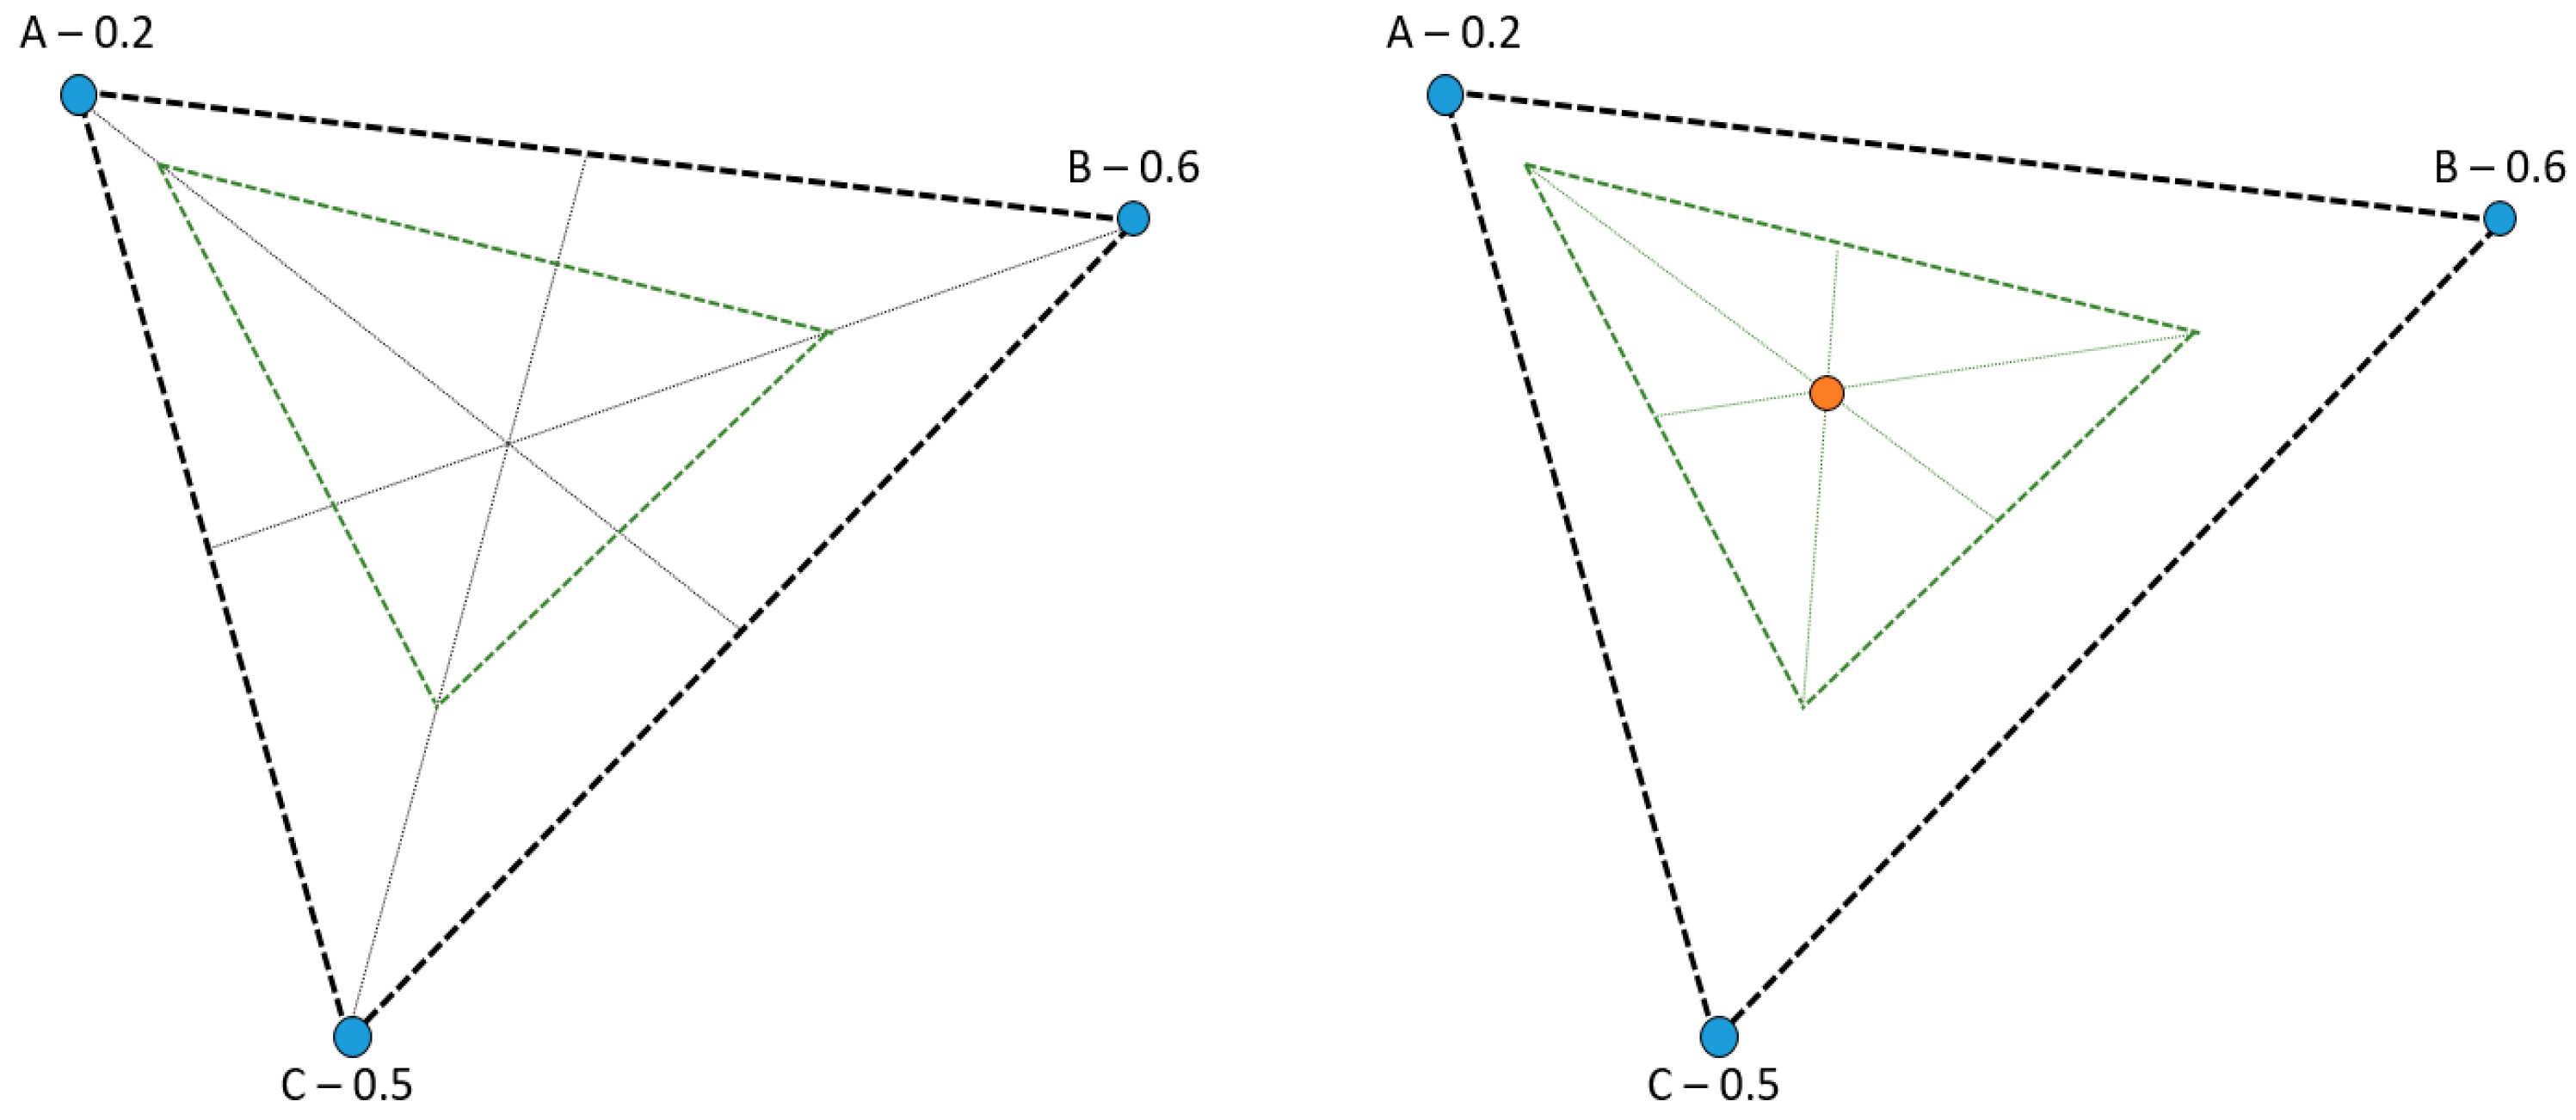
In the event that the three points in three boundaries register accuracy, a new position is determined for each point as a percentage of the distance, according to the accuracy of the distance of the barycenter of the triangle, assuming that the adjustment error is in the barycenter direction of the triangle formed by the three points. Once the new points are found, a new triangle is created with a new barycenter as an adjustment point (
Figure 14).
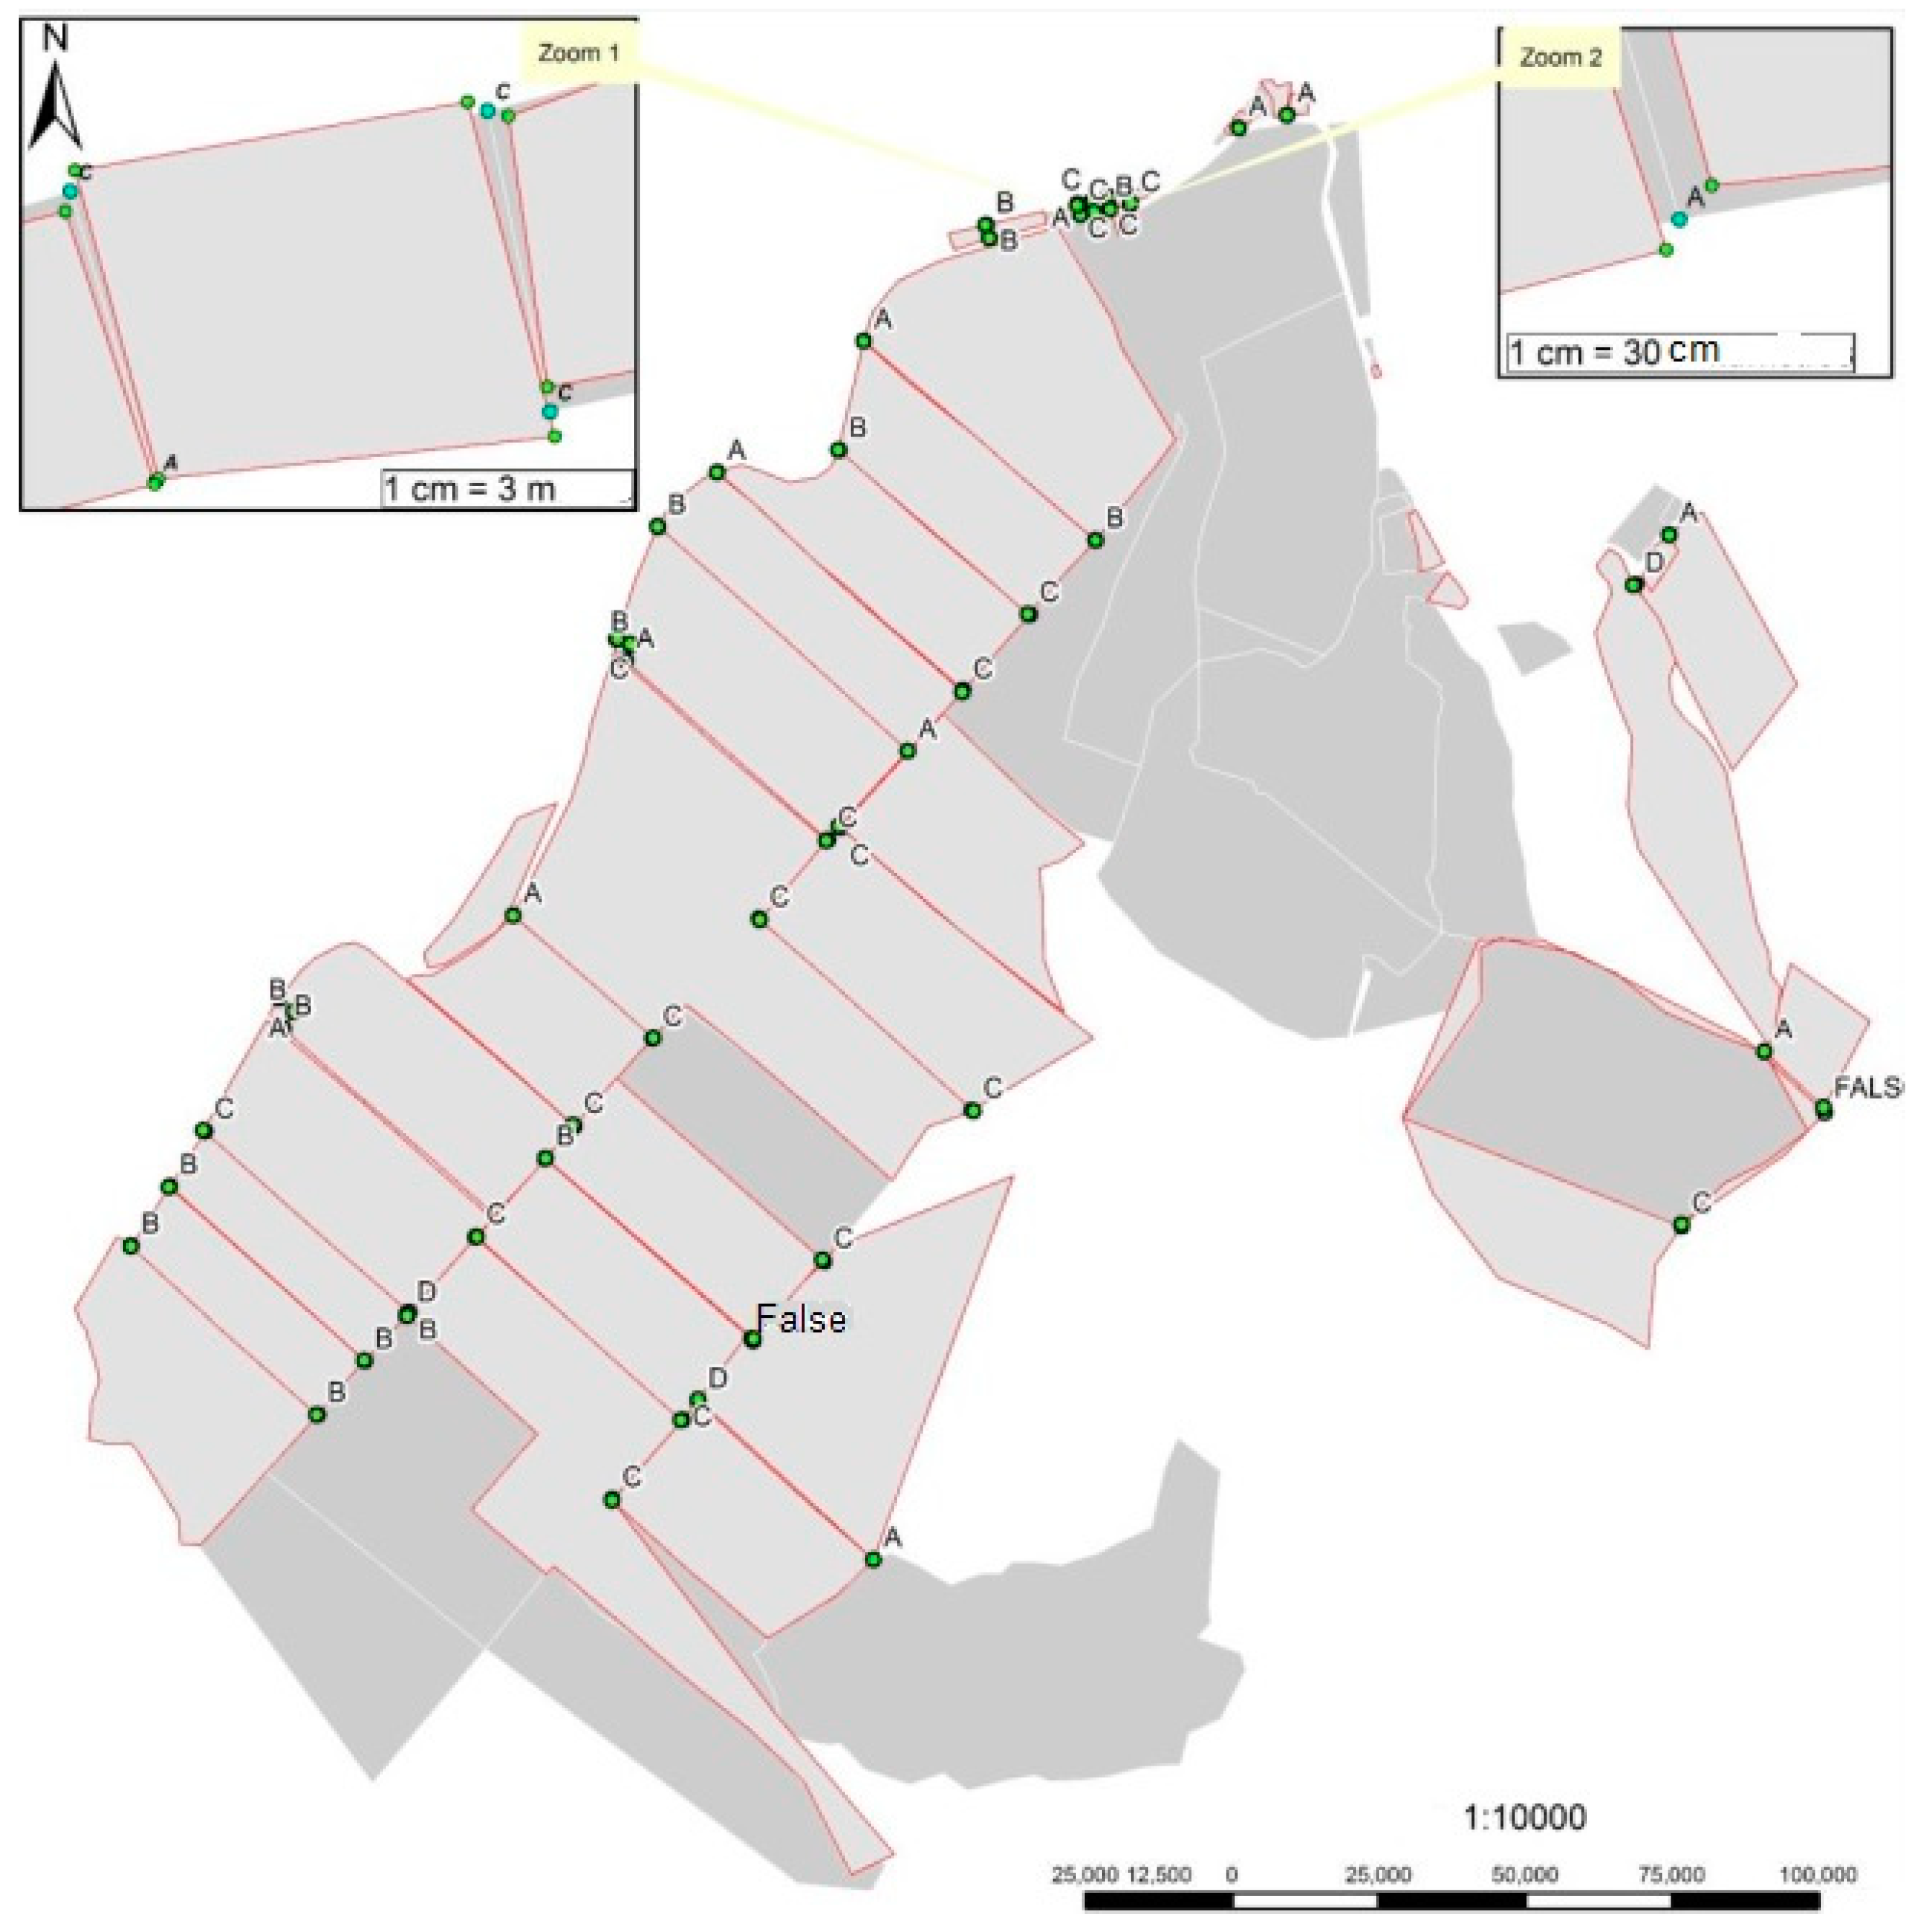
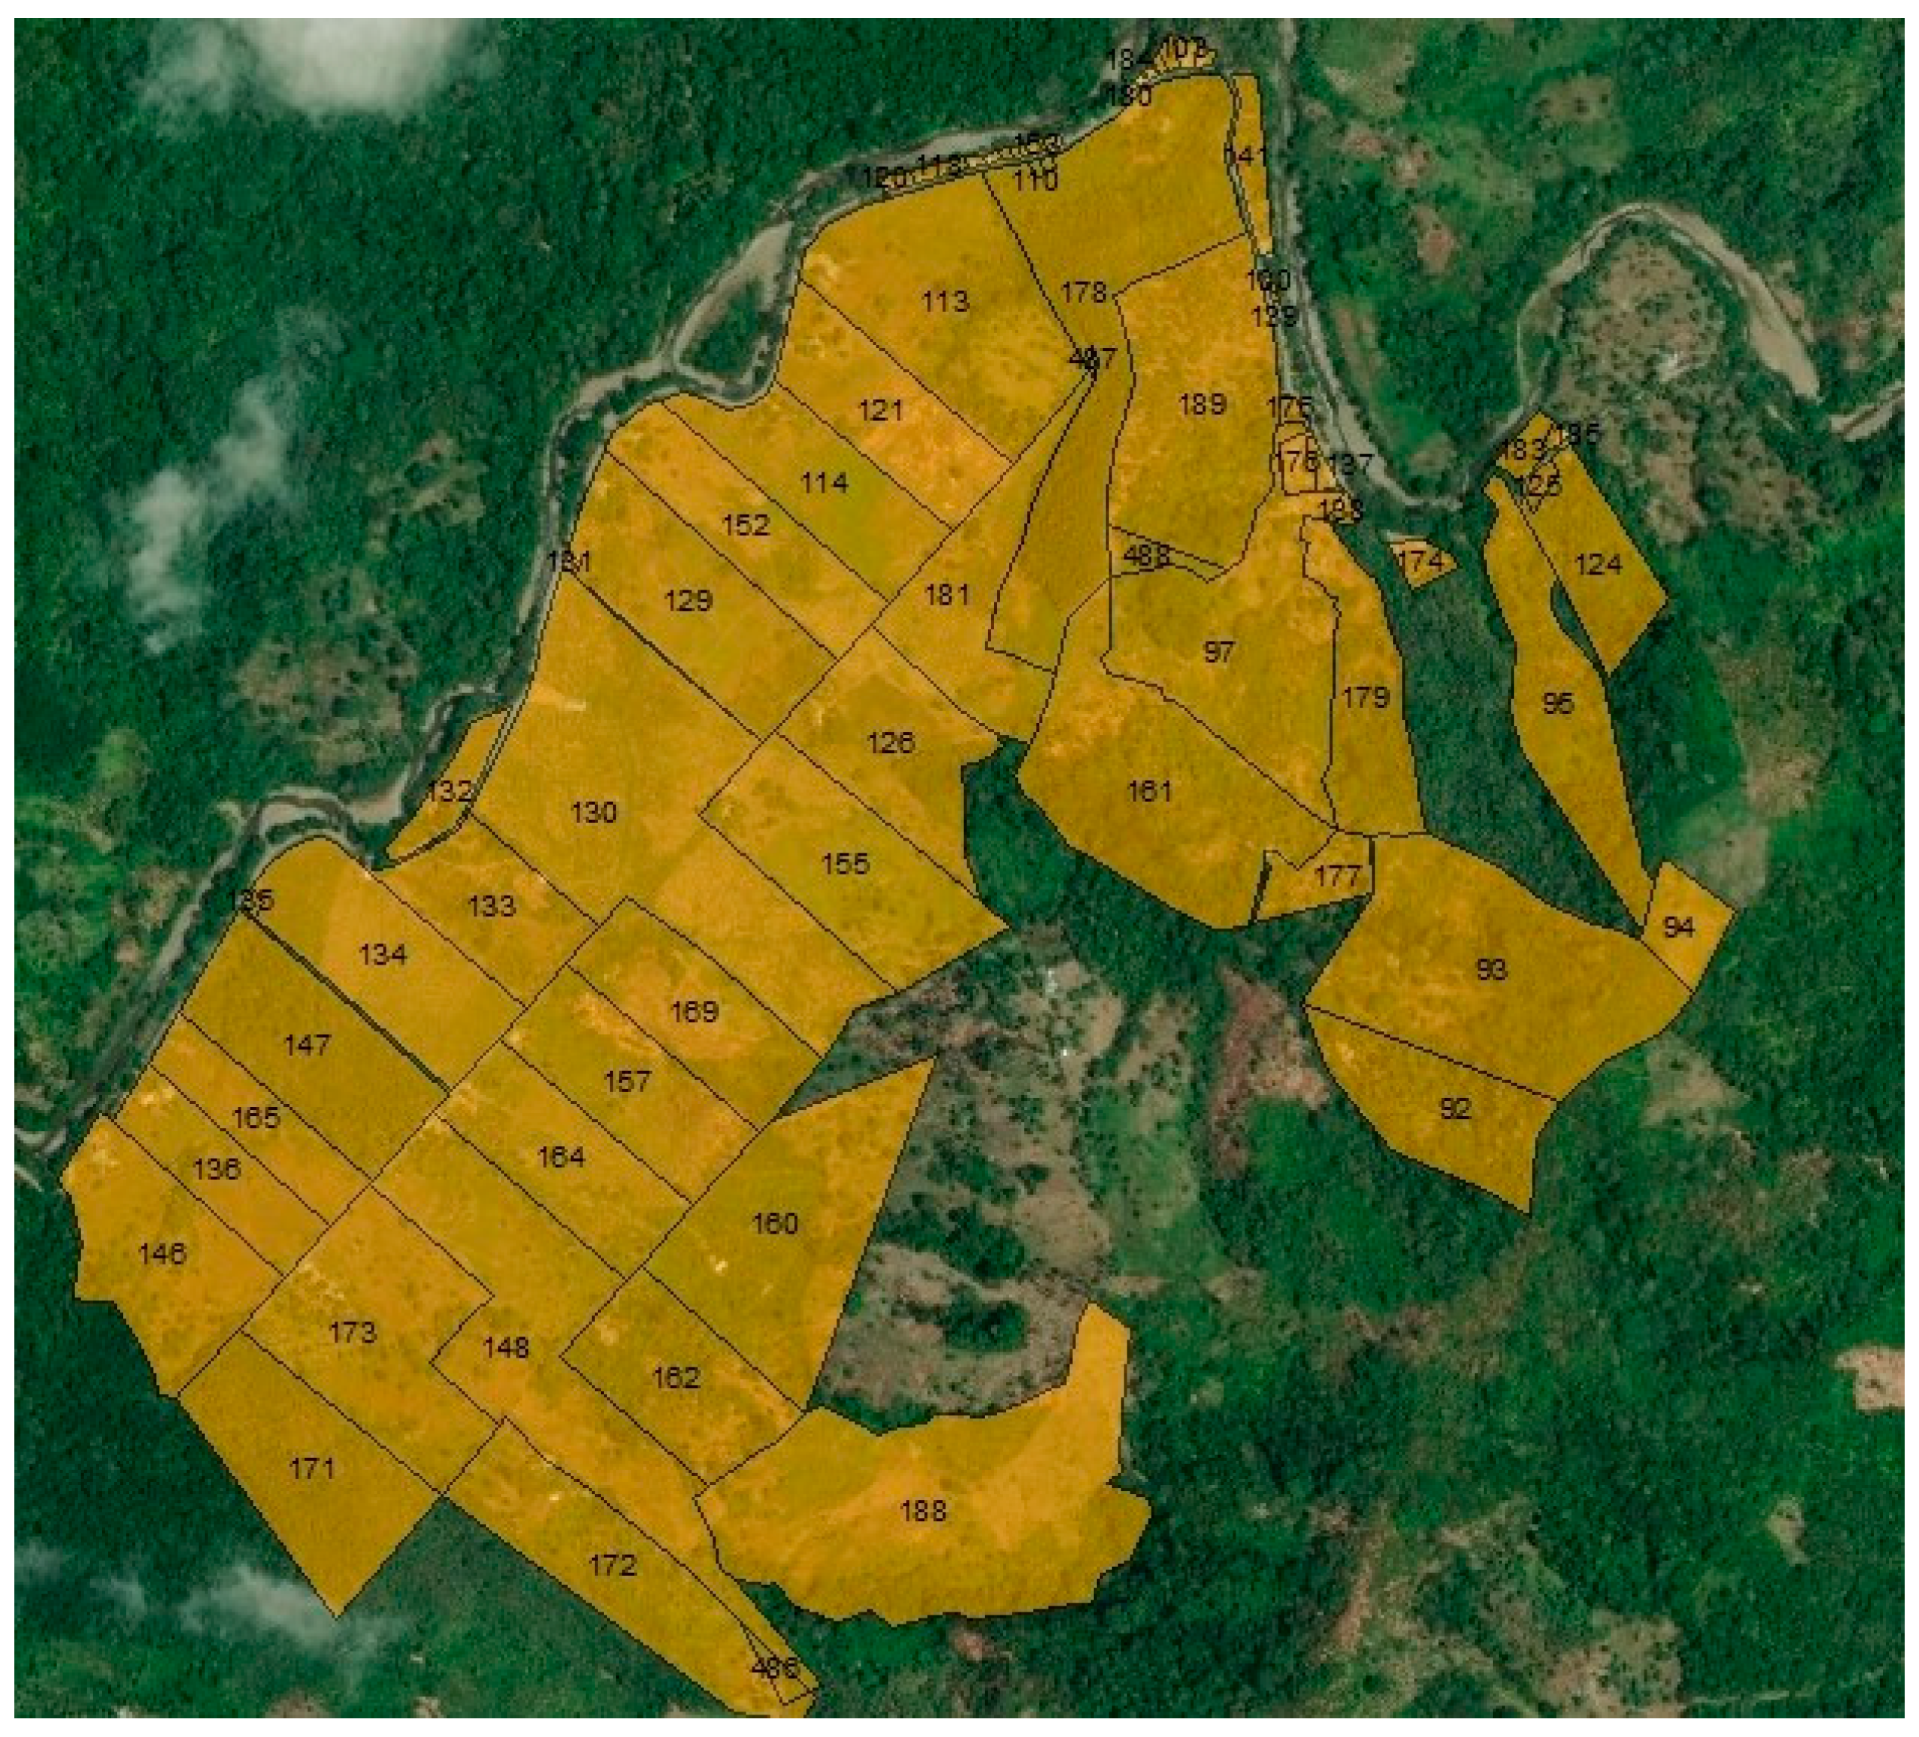
Figure 15 shows an example with some rural parcels where the Weighted Symmetric Adjustment Algorithm (WSAA) was successfully applied, which was one of the real cases where this algorithm was tested for the total number of parcels (100%) of the study area of Los Mandarinos.
Once the adjustment is made, the parcels’ geometries are updated in the database in the Survey scheme (
Figure 16).
4. Discussion
The quality assurance model for the “Fit-For-Purpose Land Administration” approach in Colombia is the framework of action of the implementation of the FFPLA methodology, which allows for quality control of the data collected in the field for the purpose of land titling in the country. The model supports the creation of a product quality life cycle and a quality model in the Colombian context, as shown in
Figure 2.
In order to apply the quality assurance model, one of the objectives of the project was to measure the quality of FFPLA data. This objective was accomplished because the project showed how well a dataset conformed to its product specification and was able to determine whether FFPLA data were of sufficient quality for the Colombian multipurpose cadaster, specifically in the case of positional accuracy and logical consistency. The results show that the data quality assurance model for the FFPLA approach allows one to evaluate how the dataset meets the criteria of the product specifications defined for FFP data according to the quality scheme shown in
Figure 4. In addition, as the quality scheme is a tool for supporting the understanding and application of the quality model, it also allowed us to understand the methods, measures, and the evaluation procedures for the quality elements and attributes of the dataset in order to accomplish the required levels of conformity [
10,
13].
The technical specification profile for the positional accuracy quality element was an essential issue for the project and permitted us to evaluate the quality of the dataset according to the national standards and ISO 19157. The quality classification permits one to determine whether the classes are heterogeneous; in other words, the anchor points in a parcel may have all the quality classes, but classes C and B are pre-dominant for this evaluation since they are related to scales of representation between 1:1000 and 1:5000 in those areas with low land densities. As a result, the quality evaluation of the positional accuracy for the complete dataset (52 points) was 96% in conformity, a value that is adequate for the FFP perspective.
The weighted symmetric adjustment algorithm (WSAA) allows one to save time in the topology construction, and it processes most cases to adjust the boundaries between neighbors. It can be used with rural and urban properties effectively with the appropriate tolerance values. However, a review of the results is needed to ensure that everything was correctly processed. It is important to highlight that the algorithm was built specifically for this FFP project.
As the FFP quality assurance model is essentially producer driven, it is important to include the level of conformance that permits the usability of the data to be evaluated from the user’s point of view. In the same way, it is suggested that the other quality elements, such as completeness, also be evaluated.
One of the problems in measuring the positional accuracy element in the country under study is that Colombia experiences tectonic plate displacements that can reach several centimeters per year, which generate accuracy problems between geographic datasets.
It was, therefore, necessary to adapt the MAGNA-SIRGAS reference system (WKID: 4686) and the reference year to 2018. Therefore, not only should international standards such as ISO 19157 be taken into account, but they must also be adaptable to national standards generated by the geographical and physical conditions of the country.
5. Conclusions and Recommendations
The study results were positive, showing that the FFPLA methodology can be established for the land administration processes in the country, as framed by the Modernization Land Administration project with a highly participatory approach and with a simple user interface [
15]. This concerns not only the implementation of processes, but also the quality of the data collected in the field according to the standards used in Colombia for a rural cadastral survey. However, as the FFPLA methodology is still in the process of being implemented, this work is significant because it is the first project carried out in Colombia to apply new FFPLA data quality standards.
Finally, in future work, it is recommended that the FFP quality assurance model be applied in the process of implementation of the FFP methodology to facilitate the comparison and selection of the dataset best suited to application needs and technical requirements in the framework of the multipurpose cadaster and according to variations in the data of the terrain.
Author Contributions
Conceptualization and writing—original draft preparation, all authors; writing—review and editing, L.A.R.; J.M. and A.O. All authors have read and agreed to the published version of the manuscript.
Funding
Funding of the publication costs for this article was kindly provided by the School of Land Administration Studies, University of Twente, in combination with Kadaster International, the Netherlands.
Institutional Review Board Statement
Not applicable.
Informed Consent Statement
Not applicable.
Data Availability Statement
Not applicable.
Acknowledgments
The authors would like to acknowledge the support of Kadaster International, ITC Faculty, University of Twente, and the Universidad Distrital Francisco José de Caldas.
Conflicts of Interest
The authors declare no conflict of interest.
References
- Consejo Nacional de Política Económica y Social CONPES 3859. Política Para la Adopción e Implementación de un Catastro Multipropósito Rural—Urbano; Departamento Nacional de Planeación: Bogotá, Colombia, 2016; p. 4.
- Molendijk, M.; Santos, T.; Lemmen, C. Land and Peace in Colombia: FFP Methodology for Field Data Collection and Data Handling. Land Governance in an interconnected World. In Proceedings of the Annual World Bank Conference on Land and Poverty, Washington, DC, USA, 19–23 March 2018. [Google Scholar]
- Rocha, L.A.; Ortiz, A.E.; Suarez, E. Introducción de metodologías participativas en la modernización de la Administración de Tierras en Colombia acercando la tecnología a la comunidad. RISTI 2019, E17, 775–786. [Google Scholar]
- Saers, P.; Meijer, C.; Molendijk, M. Integrating Land Data Sets—Towards Inclusive Land Information Systems. Responsible Land Governance: Towards and evidence Based Approach. In Proceedings of the Annual World Bank Conference on Land and Poverty, Washington, DC, USA, 20–24 March 2017. [Google Scholar]
- Montoya, J. Diseño del Modelo de Calidad para los Datos Geográficos Generados a Partir de la Metodología “Fit For Purpose”. Tesis de Pregrado, Universidad Distrital Francisco José de Caldas, Bogotá, Colombia, 2020. [Google Scholar]
- Rocha, L.A.; Montoya, J. Spatial Data Quality Model for “Fit-For-Purpose” Methodology in Colombia; FIG Working Week 2020: Amsterdam, The Netherlands, 2020. [Google Scholar]
- Comisión Interdepartamental Estadística y Cartográfica. Modelo de Calidad para la Información Geográfica en Andalucía; NTCA_01003; Instituto de Estadística y Cartografía de Andalucía: Sevilla, España, 2011. [Google Scholar]
- López, F.J.; Rodríguez, P. Introducción a la Normalización en Información Geográfica: La familia ISO 19100; Universidad de Jaén: Jaén, España, 2008; ISBN 978-84-612-2075-5. [Google Scholar]
- IGAC. Resolución No. 471 DE 2020. Por Medio de la cual se Establecen las Especificaciones Técnicas Mínimas que Deben Tener los Productos de la Cartografía Básica Oficial de Colombia; Instituto Geográfico Agustín Codazzi: Bogotá, Colombia, 2020. [Google Scholar]
- IGAC. Resolución 643 DE 2018. Por la cual se Adoptan las Especificaciones Técnicas de Levantamiento Planimétrico para las Actividades de Barrido Predial Masivo y las Especificaciones Técnicas del Levantamiento Topográfico Planimétrico para Casos Puntuales; Diario Oficial No. 50.611 de 1 de junio de 2018; Instituto Geográfico Agustín Codazzi: Bogotá, Colombia, 2018. [Google Scholar]
- ISO 19157:2013, Geographic Information—Data Quality. Available online: https://www.iso.org/obp/ui/#iso:std:iso:19157:ed-1:v1:en (accessed on 16 January 2020).
- Agencia Nacional de Tierras. Lineamiento de Exactitud Posicional de los Levantamientos Planimétricos para Procesos Adelantados en el Marco del Barrido Predial Masivo; Agencia Nacional de Tierras: Bogotá, Colombia, 2018. [Google Scholar]
- ICDE. Guía de Implementación Para la Evaluación de la Calidad de Información Geográfica. Obtenido de Central de Documentos ICDE. 2017. Available online: http://www.icde.org.co/node/1043 (accessed on 28 January 2021).
- Morales, J.; Lemmen, C.; de By, R.; Molendijk, M.; Oosterbroek, E.-P.; Ortiz Davila, A.E. On the Design of a Modern and Generic Approach to Land Registration: The Colombia Experience. 2019. Available online: https://doi.org/10.4233/uuid:39072a6f-1ca8-4897-95bc-48f0f422ef38 (accessed on 20 February 2021).
- ICDE-AT. Proyecto de Modernización de la Administración de Tierras en Colombia. Obtenido de ICDE-AT. Available online: https://www.proadmintierra.info/descargas-2/ide-at/ (accessed on 20 February 2021).
| Publisher’s Note: MDPI stays neutral with regard to jurisdictional claims in published maps and institutional affiliations. |
© 2021 by the authors. Licensee MDPI, Basel, Switzerland. This article is an open access article distributed under the terms and conditions of the Creative Commons Attribution (CC BY) license (https://creativecommons.org/licenses/by/4.0/).


