Article

Pollination Potential in Portugal: Leveraging an Ecosystem Service for Sustainable Agricultural Productivity

Campus de Campolide, NOVA Information Management School (NOVA IMS), Universidade Nova de Lisboa, 1070-312 Lisbon, Portugal
*
Author to whom correspondence should be addressed.
Land 2021, 10(4), 431; https://doi.org/10.3390/land10040431
Submission received: 12 March 2021 / Revised: 9 April 2021 / Accepted: 15 April 2021 / Published: 17 April 2021
(This article belongs to the Special Issue Multiple Roles for Landscape Ecology in Future Farming Systems)

Abstract

:
As urbanization and agriculture increase worldwide, habitats and food sources for wild pollinators are often fragmented or destroyed. As wild pollinators contribute both resilience and variety to agricultural fields, it is desirable to implement land management practices that preserve their well-being and ability to contribute to food production systems. This study evaluates continental Portugal for its change in suitability to host bee’s pollinator species (Apis mellifera) from 1990 to 2018. It uses the InVEST crop pollination modeling tool and CORINE Land Cover, as well as parameterization to produce pollinator abundance and supply maps. These are generalized to municipality boundaries to provide actionable insights to farmers and policymakers and strengthen land management practices. It finds that the potential for pollination services is growing, with averages of both pollinator abundance and supply indices improving by 8.76% across the continental territory in 28 years. The study results are validated using another pollination index derived from a study that is based on expert opinion and field sampling in a sub-region of Portugal. This method of aggregation of model results and comparison of the percent difference by administrative boundary has the potential to better inform both policymakers and farmers about the pollination potential on a local level, as well as inspire interventions for future productivity.

1. Introduction

Ecosystem services are natural processes from which human benefit, whether directly or indirectly [1]. Because natural “capital” (i.e., trees, atmosphere, carbon, information, nourishment, etc.) and human reliance on it is difficult to quantify economically [2] its value is often discounted in policy development. However, these services have tremendous effects on our wellbeing, resilience, and markets [3], making them a valuable addition to discussions about sustainable land management practices [4].
Pollination is one of these services from which humans reap significant benefit [5]. Though wild bees provide essential pollination services to both wild plants and crops alike [6], “agricultural intensification jeopardizes wild bee communities and their stabilizing effect on pollination services at the landscape scale” [7,8]. This type of loss has impacts on national economies. The estimated annual value of ecosystem services provided by wild insects and other animal pollinators (including pollination, dung burial, pest control, and wildlife nutrition) equates to more than USD 57 billion [9]. Other estimates project losses of USD 1.4 billion of the gross domestic product (GDP) between 2011 and 2050 in the US alone due to pollinator loss [4]. Insect pollination accounted for 35% of global food production in 2004 as well as 75% of crop types, [8,10]. Losses in crop pollinators are expected to affect the world supply of fruits, vegetables, oilseeds, and cotton, leading to direct and indirect effects on global commodity supplies and prices [4]. Worldwide declines of pollinators can catalyze similar trends in wild plant species [7]. These implications on both human well-being and environmental vibrancy necessitate the utilization of models that can characterize the effects of current trends, as well as predict and evaluate potential future scenarios [11].
Though there is a multitude of species responsible for the pollination of human consumable crops [7], many farmers employ domestic bees for managed pollination. However, the utilization of wild bees increases temporal stability as well as additional efficiency for certain crop species [6]. Though not strictly necessary, some vegetable species yield higher quality and more pest-resilient crops, in addition to improved seed production [10] after being visited by wild pollinators. Heterogeneous and organic fields are usually more suitable, both in terms of habitat appeal as well as in food resources, which may attract pollinators within their foraging ranges [4,12,13]. Understanding these types of behavior and interdependencies can improve the way farmers and policymakers adjust their practices to improve yields, as well as maintain sustainable supplies of pollination services into the future [7].
Previous studies on pollinator suitability have been performed in sub-national regions around the world [13] at more general continental or global levels [2], are limited to specific crop types [14], or landscape types [10]. Some of the previous literature provide frameworks for incorporation into future studies [5], some leverage or derive theoretical monetization models [15] and some do not incorporate spatial dependence into their models [9]. Derivation and validation of these studies range from labor intensive field sampling [16] or leveraging of primary sources [7], to expert opinion [17], to predictions of models derived from environmental inputs (such as Land Use Land Cover (LULC), climate, or topology [8]).
This study demonstrates the viability of applying a spatially dependent model of pollinator suitability to an entire continental area (corresponding to the mainland area of Portugal, designated by the Nomenclature of Territorial Units for Statistics (NUTS) level 1 code PT1: “Continente” in Portuguese, or “continental” in English) and then aggregating the interim results to subregions (NUTS subdivision 3) to evaluate both overall trends and local changes over time. This aggregation provides new opportunities for land management and innovation practices applicable to various levels of local administration. This type of investigation has not yet been applied to Portugal.
To this end, the study evaluates the changes in pollination suitability in continental Portugal from 1990 to 2018 of a representative guild characterizing the behavior of the European honeybee (Apis mellifera). It derives pollinator abundance and supply indices from input LULC raster maps for the area as well as parameterized pollinator guilds. These are processed by the Integrated Valuation of Ecosystem Services and Trade-offs (InVEST) crop pollination model, which incorporates spatial dependency of nearby floral resources and nesting sites in relation to pollinator foraging ranges. The resulting raster maps are aggregated to administrative municipalities, and the percent variation (PV) is calculated. The results are evaluated for their trajectories of change and validated via the extrapolation of a local pollinator index based on in-field sample collected data and expert opinion.

2. Materials and Methods
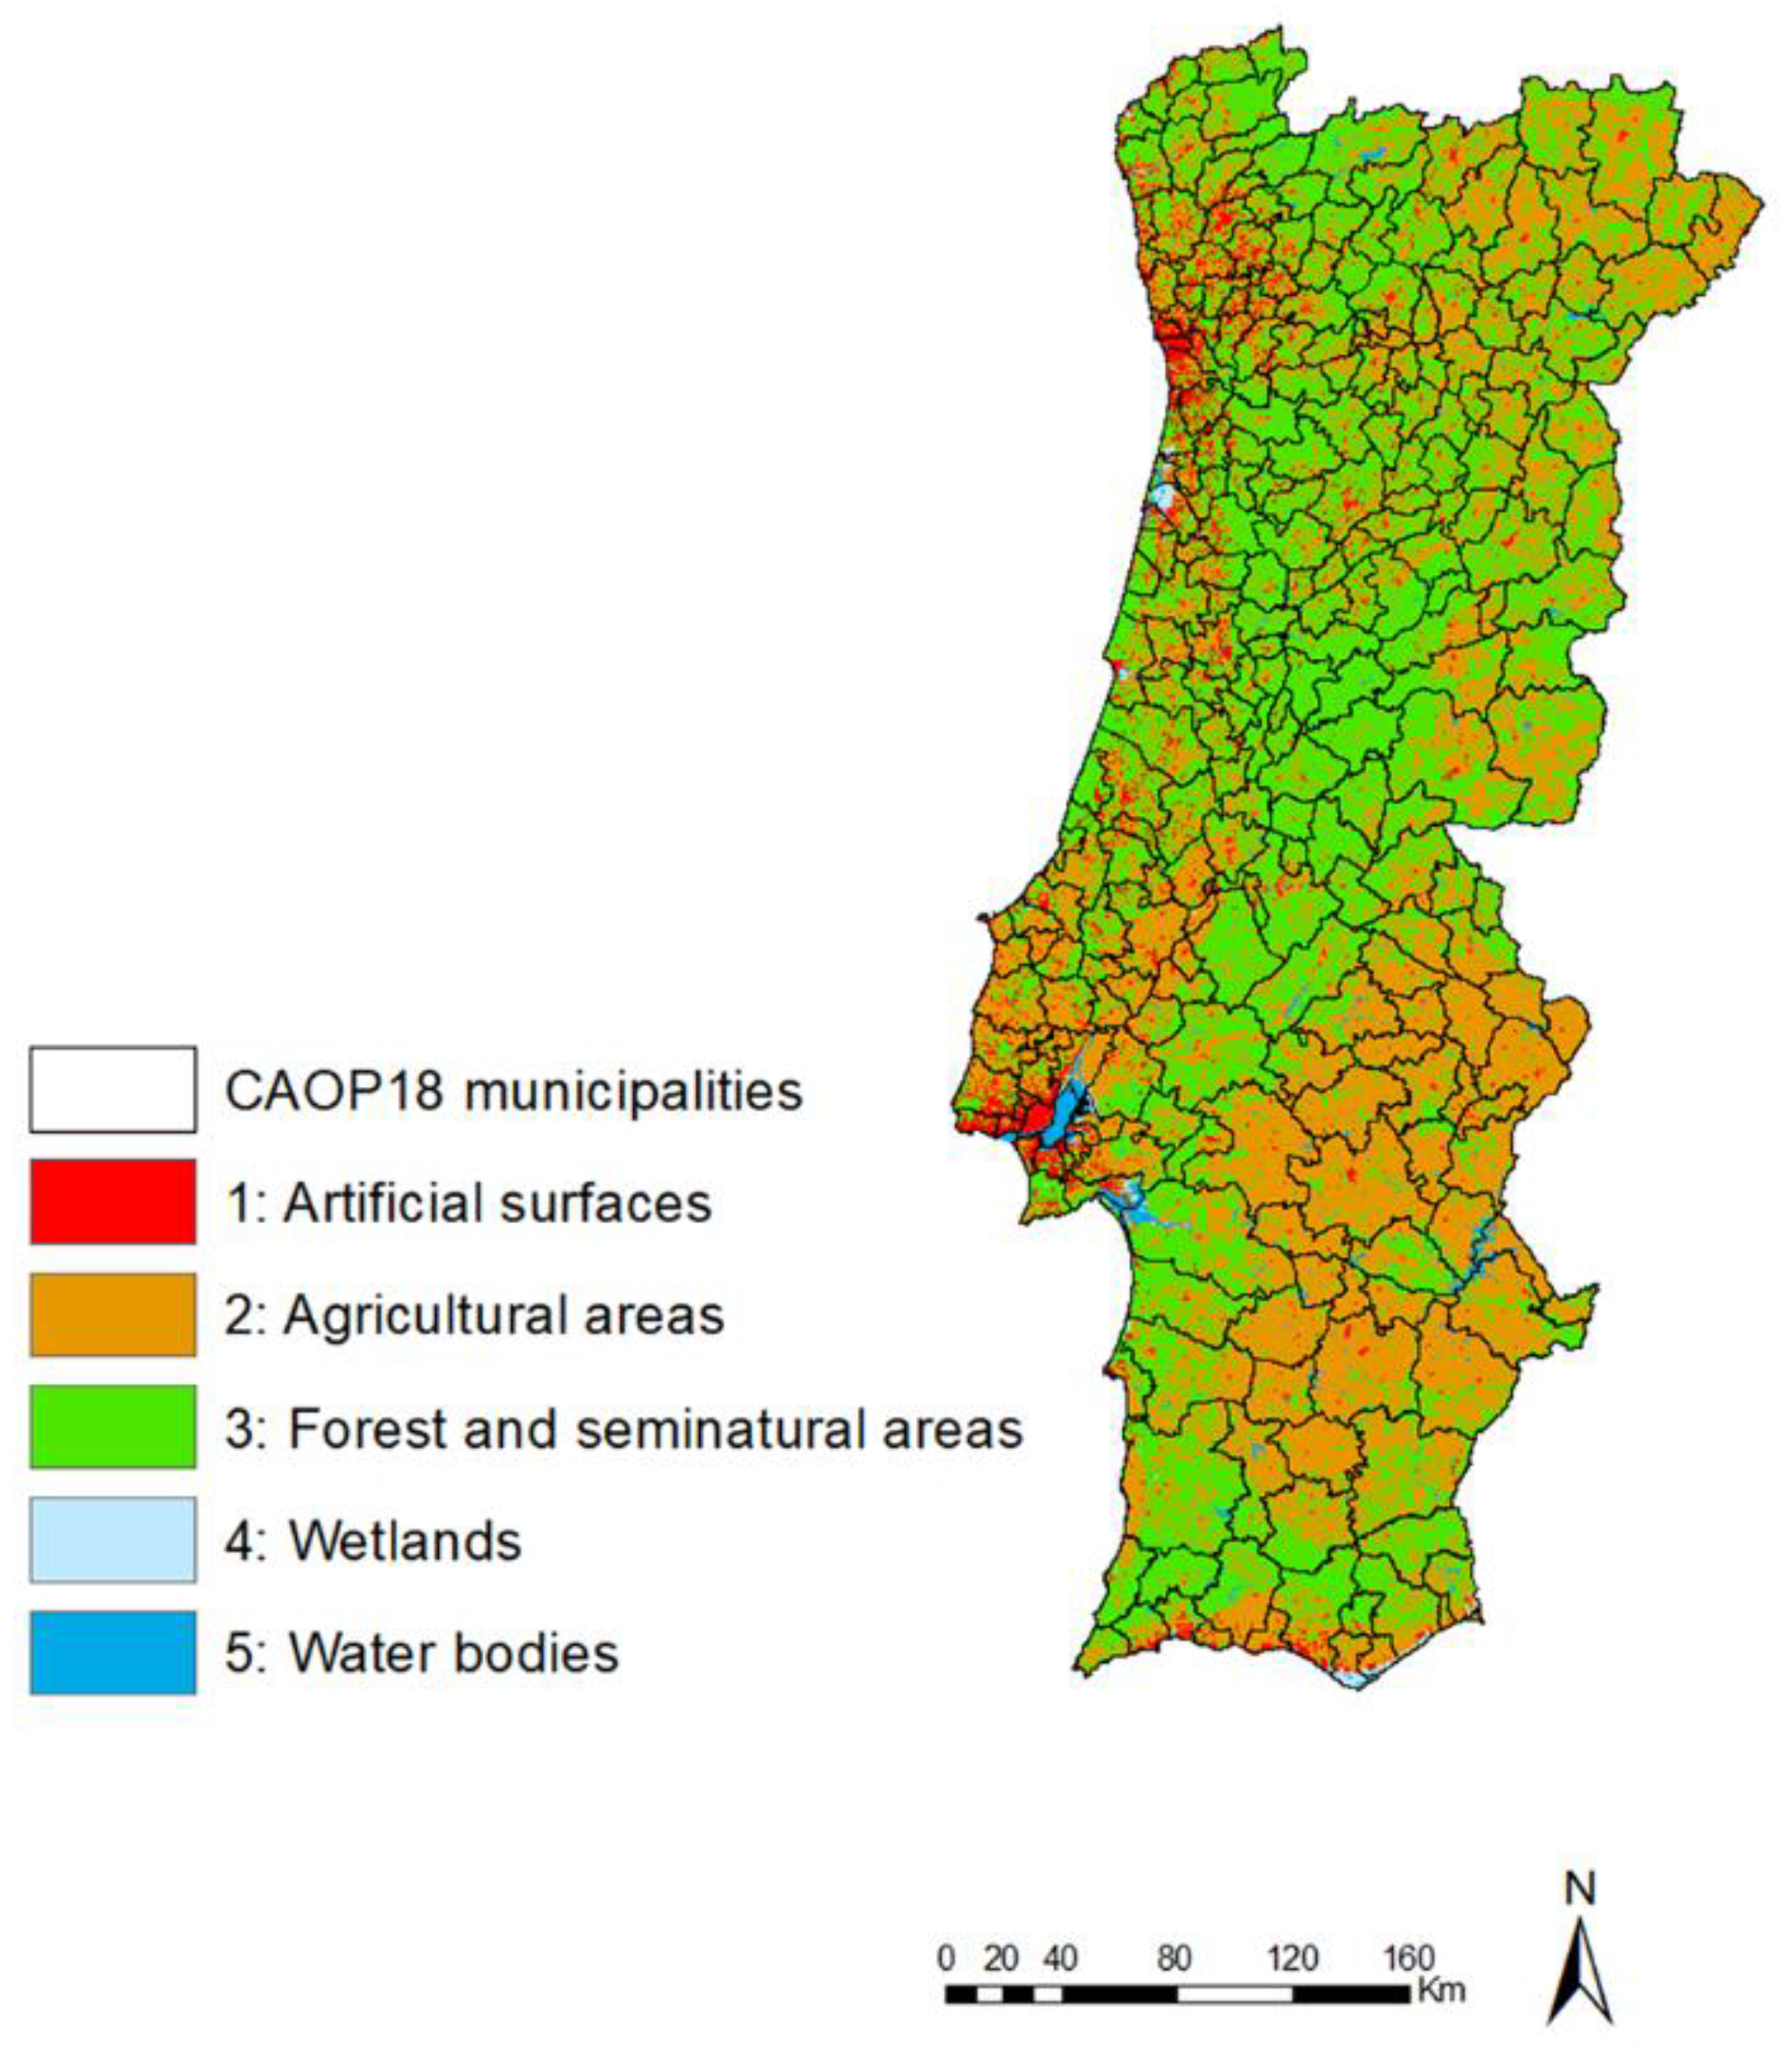
2.1. Study Area

Portugal is a European country of about 92,212 square kilometers on the southwestern corner of the Iberian Peninsula [18]. It contains the most western point in continental Europe and shares a land border with Spain. Portugal experiences Mediterranean climate of dry, hot summers and wet, cool winters [19], though this varies throughout the territory’s microclimates (generally categorized as cooler and rainier in the north while drier and hotter in the south). According to CORINE Land Cover (CLC) of 2018, approximately 3.83% of the country’s land cover is artificial surfaces, 47.81% is agricultural land, and 46.48% forests, with the remainder, made up of wetlands and water bodies (Figure 1) [20]. 28 years prior, artificial surfaces only covered 1.9% of the land, with 47.80% and 47.92% of the area dedicated to agricultural and forest land, respectively. This sizeable increase in artificial cover is consistent with the high rates of urbanization seen in and around Portugal’s major cities. Desertification, the degradation of dryland also affects the changing classifications of land cover especially in the interior of the country [21].
Portugal is composed of 308 “concelhos” (municipalities, NUTS 3), with 278 of these located on the mainland [18]. Of Portugal’s 240.7 billion USD GDP in 2018, 2.05% was produced by the agriculture, forestry and fishing industry [22]. With almost half of continental Portugal’s land surface devoted to agriculture, there is tremendous value in ensuring the successful production of cultivated crops. It is estimated that Portugal is home to more than one thousand pollinating insect species, including a variety of bee, hoverfly, butterfly, and flower beetle species [16,23,24]. As of 2018, 680 distinct bee species have been collected and catalogued in Portugal [25]. Within the River Minho area alone, 200 distinct species were catalogued for a smaller scale study on pollination services [16]. According to the Joint Research Centre (JRC) Technical Report, Portugal demonstrated the “highest increase of pollination potential” from 2000 to 2006 in the European Union (EU) [26]. The main pollination season in Portugal can range from March to September, which includes the season of most active airborne pollen particles in the country as well as the general period for crop pollinator foraging in the north half of the globe [19,26].

2.2. Software and Data Management

This study was carried out using the free and open source InVEST crop pollination model, available under the open data license [27,28]. It also leverages the proprietary ArcGIS software (ArcMap 10.6) to perform the spatial temporal variation model, visualize the results, and for validation. All data included in the study is open data freely available to the public through the portals described in Section 2.3.

2.3. InVEST Crop Pollination Model

InVEST is a software platform of the Natural Capital Project and a suite of models to evaluate and chart a variety of ecosystem services, ultimately to inform decisions on how to manage these natural resources by quantifying their economic impact. It has been used in previous academic studies to marry macroeconomic scales with local environmental processes to predict multiple future scenarios of varying degrees of environmental action to “resonate with political economy audiences” [4].
The InVEST crop pollination model produces pollinator abundance and supply indices, which are scaled from 0 (least suitable) to 1 (most suitable) [27]. Abundance index represents the likely location of their activity, while supply index describes the likelihood, based on proximal nesting sites and food resources of the location and foraging ranges of the species, for pollinators to nest in a space. The results characterize wild bee pollinator guilds (groups of bee pollinators demonstrating similar nesting and foraging preferences as well as foraging distances and relative abundance).
The model utilizes land cover raster maps as well as persistent bio and guild tables as inputs. It incorporates habitat parameters (estimated nesting site and floral resource availabilities, and relative abundance per guild) for each cell of the input raster, considering the floral parameters of its neighbors [20,26]. One of the key features of the model is the incorporation of foraging distance, which allows the model to bridge the possible spatial separations of nesting and foraging habitats [8,12,29]. This model was selected for its accommodation of the spatial dependency required in such geographically explicit studies.
To make meaningful comparisons between time frames, pollinator abundance and supply indices for each pixel were generalized via zonal statistics into the 278 municipalities under study. The resulting statistical means of each municipality were utilized to calculate the variation from 2018 to 1990, according to Equation (1):
P V c = A b u n d a n c e 2018 c A b u n d a n c e 1990 c A b u n d a n c e 1990 c
where P V c is the percentage variation index for delivering pollination abundance for year 2018 in comparison to the baseline year 1990 for each concelho ©. The general flow is depicted in Figure 2, with a comprehensive modeling workflow for the percent variation of abundance index. This process was executed in ArcGIS software (ArcMap 10.6).

2.4. Spatial Data

Land cover raster maps utilized are available from the Copernicus project, provided by the European Environmental Agency (EEA) [20]. The CLC classification includes 44 distinct subcategories that fall within five major areas: artificial surfaces, agricultural areas, forest and semi-natural areas, wetlands, and water bodies. As this study seeks to understand the change of ecosystem services over time, the earliest and latest available years (1990, 2018) are used. The raster data have a spatial resolution of 100 m and a minimum mapping unit of 25 ha [20]. All “slivers”, landmasses associated with continental Portugal but removed by water, have been excluded from the study area. All data in the study is in the common coordinate system ETRS_1989_Portugal_TM06.
The biophysical table (required for InVEST crop pollination) corresponds to the LULC classifications to establish suitability for nesting and floral resources of each raster input (see [27] for additional details). Of particularly high suitability are certain agricultural areas and forest edges, both of which tend to provide heterogeneity of habitat in the form of diverse nesting space and floral resources within a small area, often promoting insect activity [8]. Nesting and floral resources parameter values are provided in the supplementary material of [8]. The values are derived from expert opinion and leveraged in their European continent level of pollination, also utilizing CLC input raster maps.
This study utilizes the CLC classification conversion provided in a study on pollination services across the European continent [8], as it is directly applicable to the study area (Appendix A). The conversion parameterizes all 44 classifications of CLC, generalized as a single season (versus representation of seasonal pattern variations spanning a calendar year) and a single nesting substrate (no distinction between cavity or ground preference), thus the results are representative of these generalizations.
Guild parameters assign values to represent the different behavior patterns of various bee species. These patterns include preferences for different nesting sites and floral resources, as well as relative prevalence and foraging ranges (Appendix A).
Though InVEST has the capability to model multiple nesting types, seasons, and bee guilds, insufficient data exists in previous literature to leverage the full potential of the tool (let alone the variation of parameter values due to environmental conditions [12]). Therefore, values for individual parameters were aggregated from a variety of sources [8,14,30] to describe one pollinator guild. Apis mellifera, better known as the European honeybee, is considered “the most economically valuable [pollinator] of crop monocultures worldwide” [8] and is widely employed in managed crop pollination and honey production and is native to mainland Portugal. This species is well studied and can be easily characterized as per requirements of the InVEST model.
The Carta Administrative Official de Portugal 2018 (CAOP 2018) is originally available from DGT (Direção-Geral do Território), a portal providing geodesic and geographic information services by the Portuguese ministry of agriculture, sea, and environment, and territorial management [2,11,13]. It includes 278 continental Portugal administrative territories, ranging in size from 7.94 to 1720 km2 (São João da Madeira and Odemira municipalities, respectively).

2.5. Validation

The InVEST ecosystem service modeling toolset is well established and widely used in academic study [15,27], which supports its reliability. However, it has some recognized shortcomings and is subject to the quality of input data [16]. Validation of the results is required prior to their influence on future decisions on the management of ecosystem services.
So that the study results can be meaningfully compared to the validation methods, the pollination indices are normalized such that they are distributed between their reported minimum index (adjusted to 0) and their reported maximum value (normalized to 1). Another study performed in a subsection of continental Portugal is leveraged as validation. The study developed a Pollination Suitability Index for Riverine Landscapes (PSIRL) in the River Minho (norther border of Portugal with Spain) in 2018 [27]. Though this approach has its own limitations (the study considers insect pollinators in general, not just Apis mellifera and it derives specifically for riparian areas, requiring generalization and translation to the input CLC LULC), its index is derived from expert judgment, floral diversity, and actual field surveys, increasing the overall confidence in the results. No other spatially comprehensive yet reliable data exist in Portugal for validation.
The validation process is depicted in Figure 3. The original PSIRL index is translated to land use codes used by the CLC LULC (see Appendix A), The “unclassified” features representing water areas are selected then intersected to create water edge lines. These are buffered by 10 m and merged with the LULC polygons. These are then converted back to rasters and zonal statistics are applied. These are joined to the CAOP municipal boundaries, normalized, and then compared to the normalized index values of the results.

3. Results

3.1. Land Use Land Cover Evolution from 1990 to 2018

Table 1 demonstrates the land surface utilization (LULC areal data) within Portugal in 1990, and then the percent variation from this baseline to 2018. These have been generalized to the broadest category (CORINE Land Cover designation level 1). Note that each L1 category is not associated with homogeneous biophysical parameters. The table demonstrates a doubling of artificial surfaces between 2018 and 1990 (largely inhospitable to bees), as well as a 1.8% and 3.0% drop in largely appealing habitats (agricultural and forest cover, respectively) over time. This would suggest an overall decrease in pollination services over time.

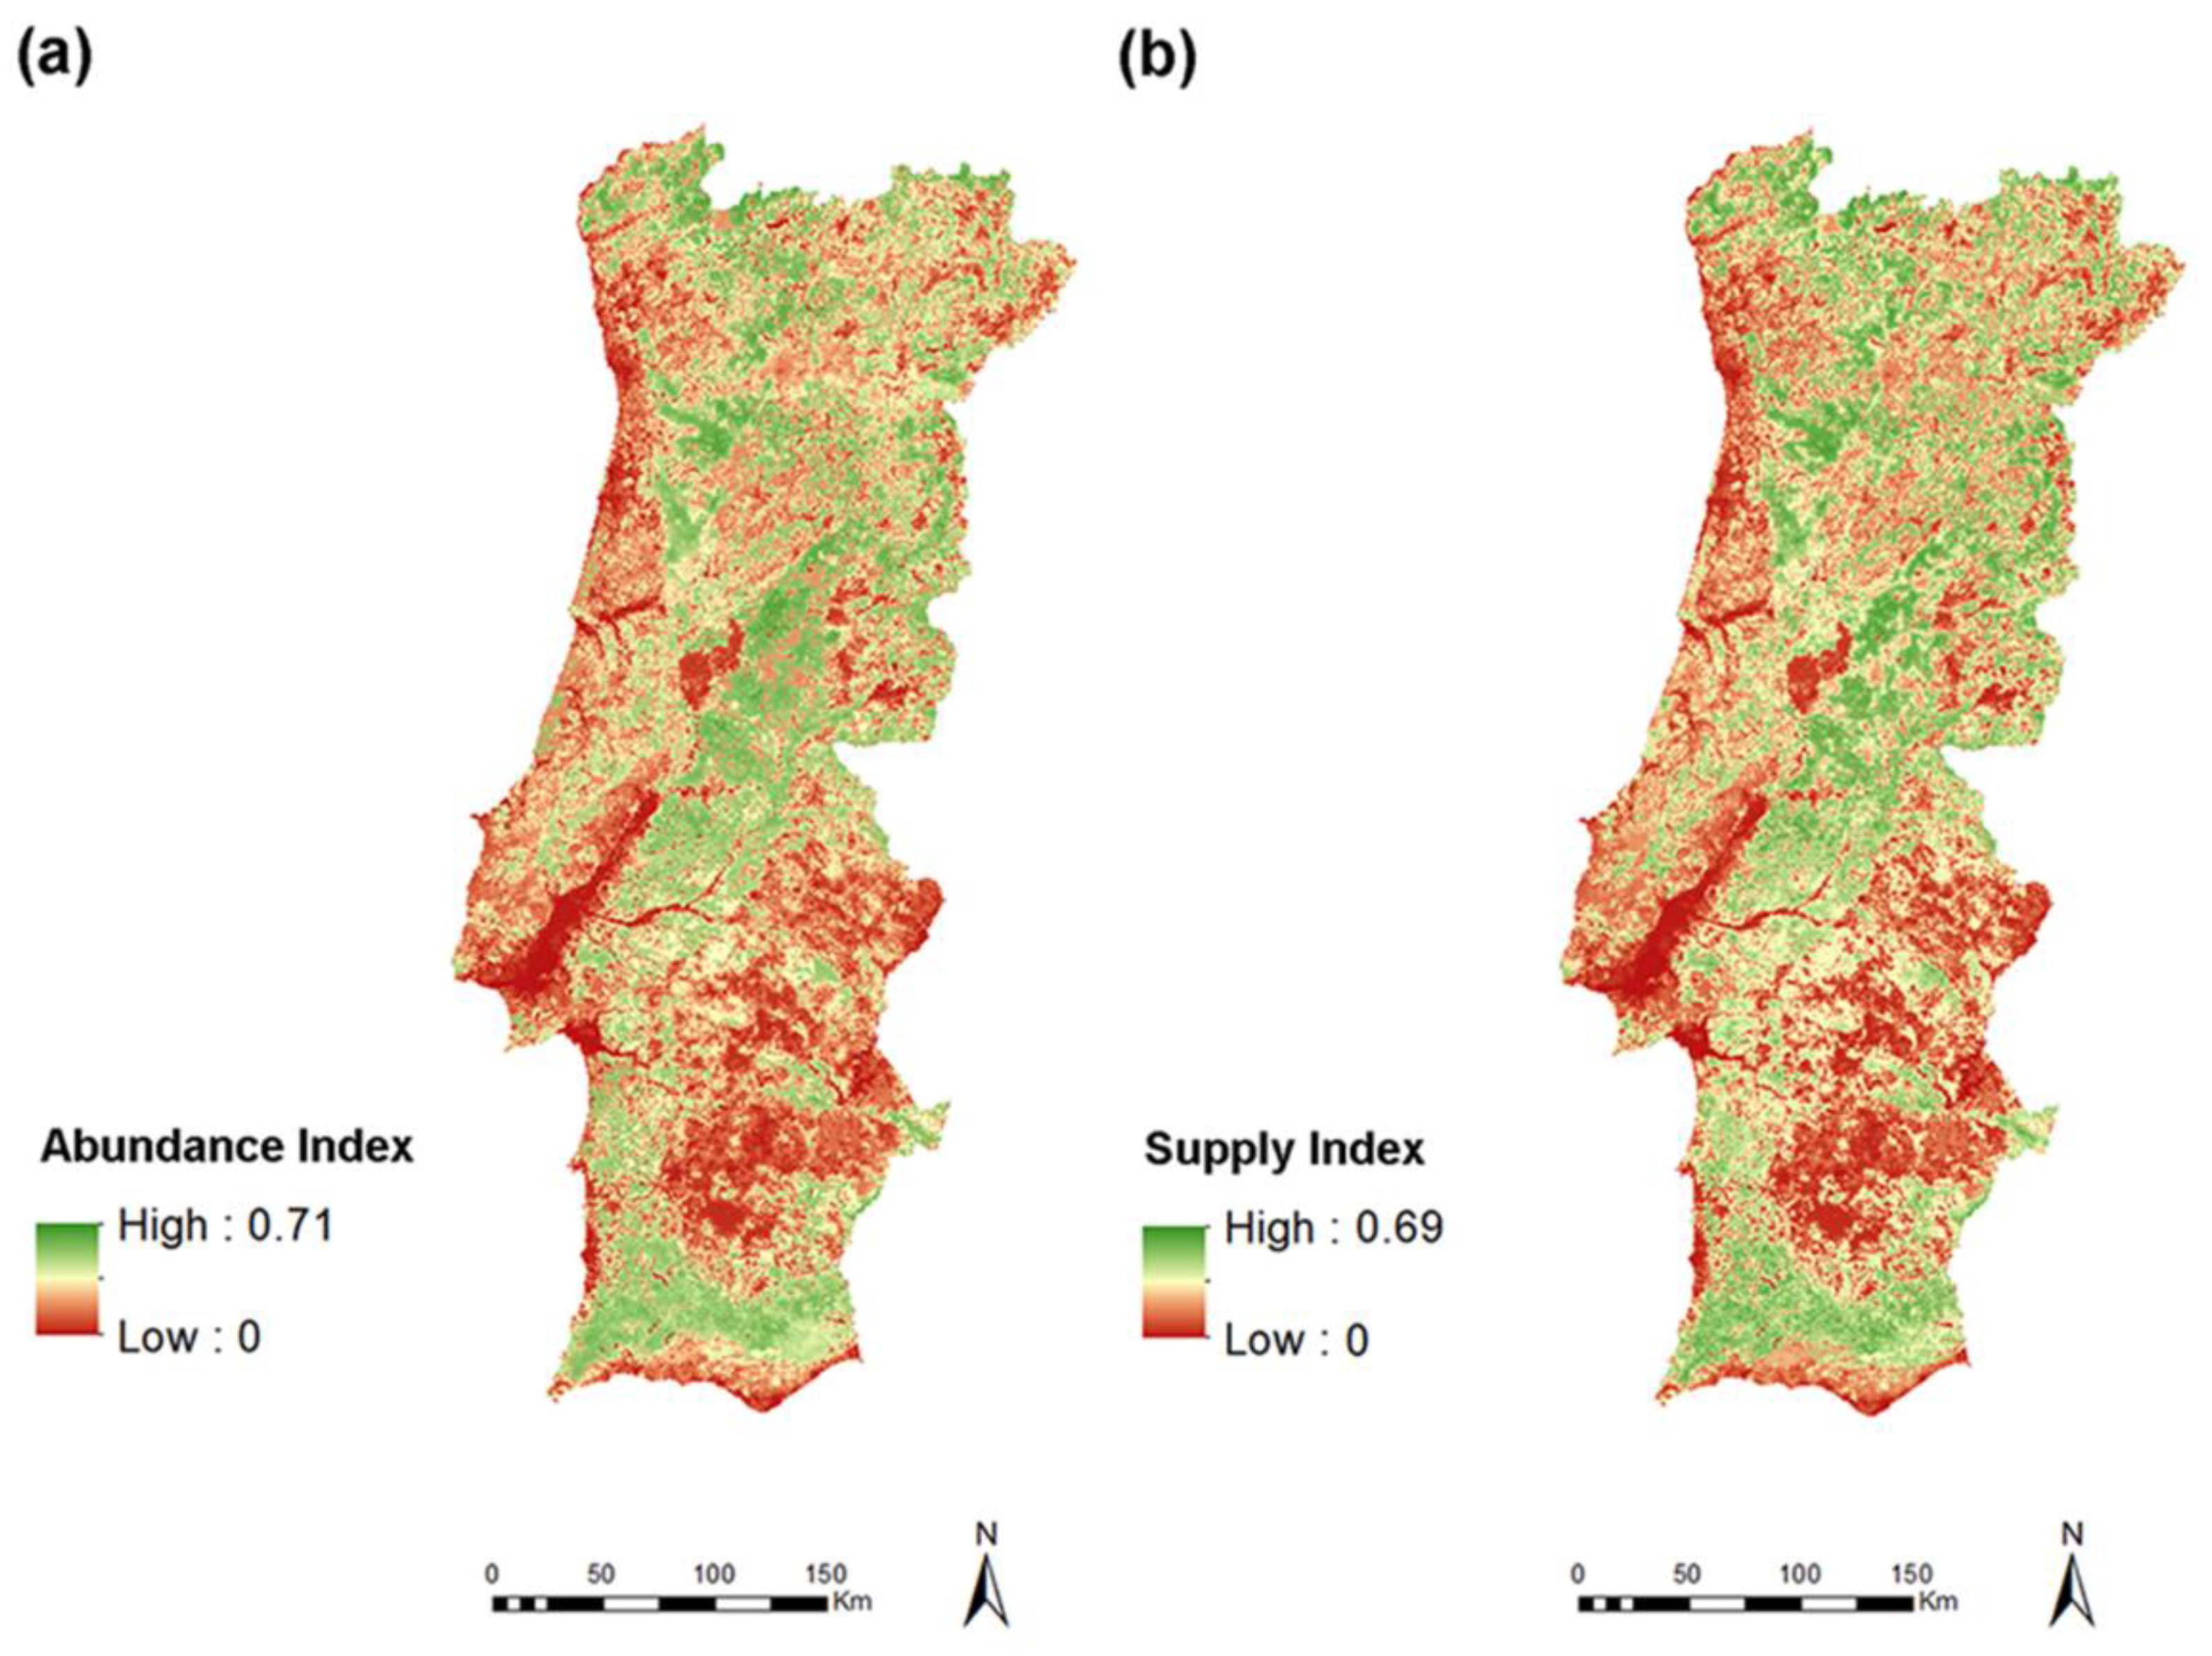
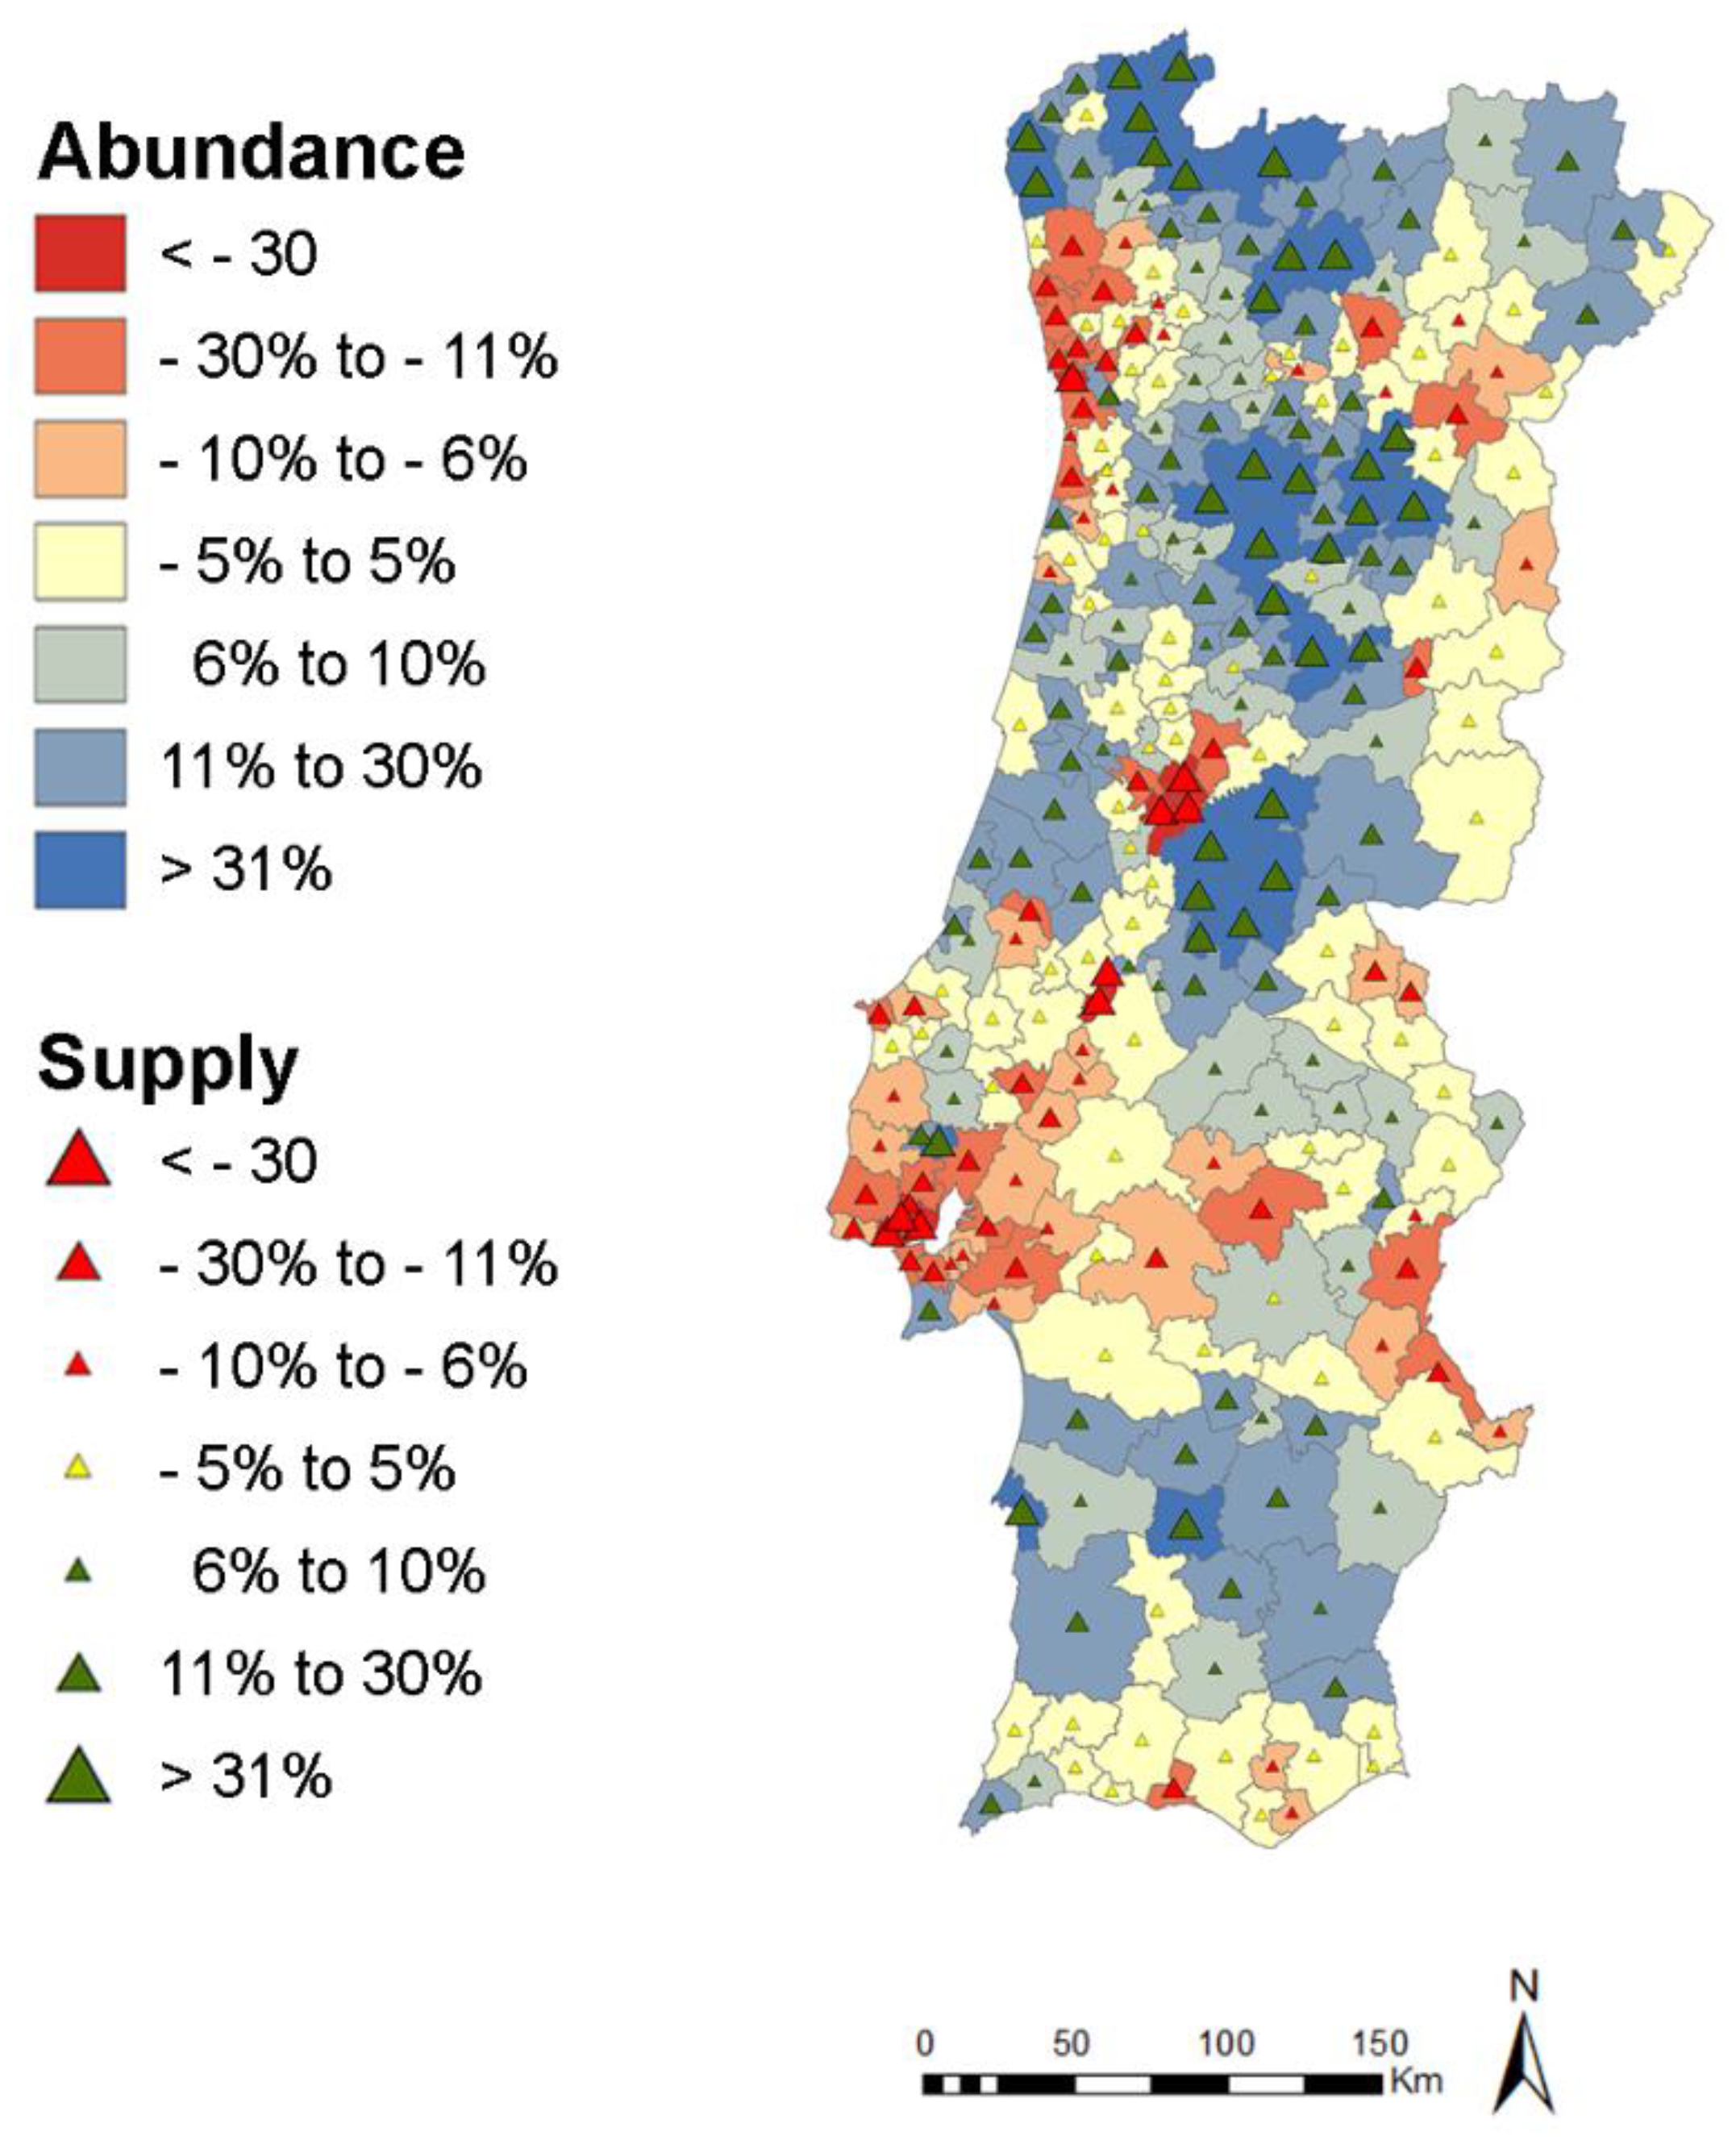
3.2. Pollinator Abundance and Supply Indices

Figure 4 depicts the spatial variation of pollinator abundance and supply indicators for 2018. As one would expect, both indices follow similar spatial patterns: less hospitable in the urban and water areas (red), more hospitable in forested areas (green). Coastal areas are particularly unfriendly, both in the West and the South, with much of eastern Alentejo region exhibiting low suitability as well. On the other hand, much of north eastern Portugal and around the border of Alentejo and the Algarve regions appear to be quite suitable along both indices.
Table 2 displays the general statistics of the raster results. The minimum index value remains zero for those areas that are unsuitable for pollinator activity (both inhospitable to bee nests as well as outside of the range of foraging). Overall, the means and maximum values for each index have increased between 1990 and 2018, indicating that the overall suitability for pollination services in Portugal is growing. This yields a slightly larger standard deviation, which reflects a greater range of index values distributed across continental Portugal.

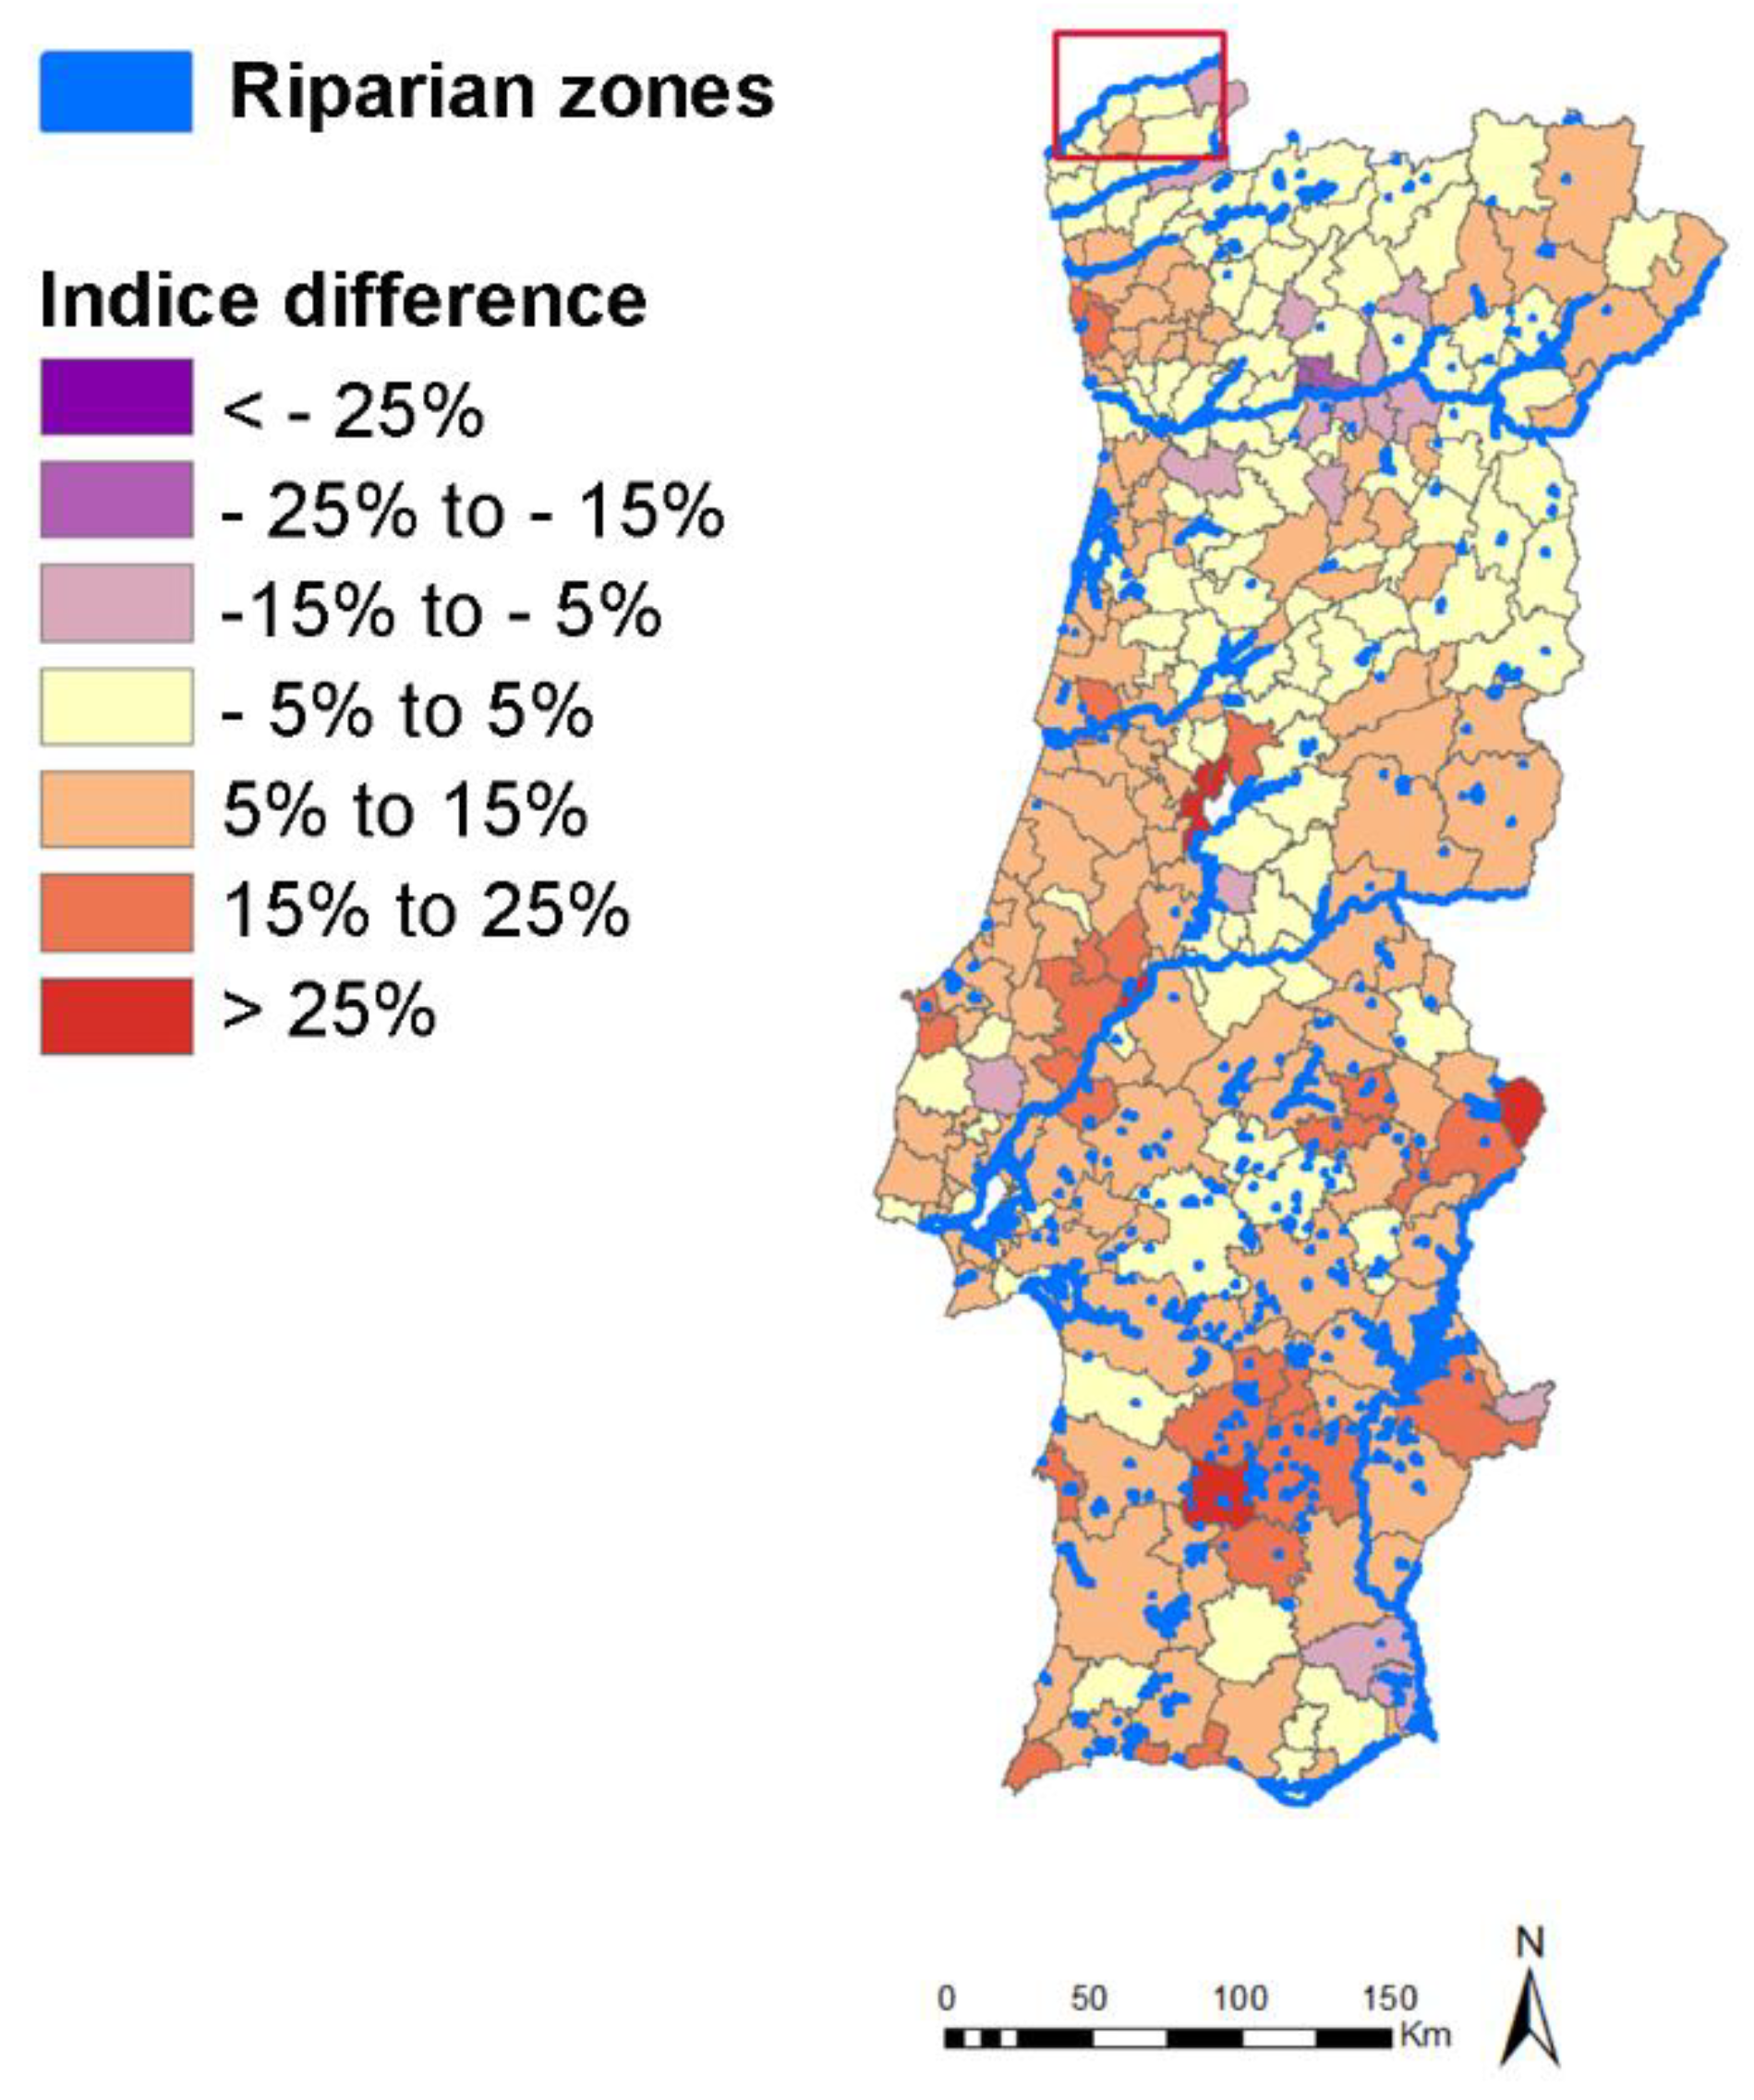
3.3. Pollination Service Changes from 1990 to 2018

Once the results are associated by municipality, inferences about trends for each administrative boundary are more easily understood. Ideally, this will contribute to better policy making at the district level. Figure 5 displays both the percent variation of abundance (color of polygon area) and supply (color and size of overlaying triangle,) from a baseline of 1990 to 2018. Red colors indicate negative changes in suitability indices, while green and blue indicate positive trends. Yellow indicates no significant change over the 28-year study period. The triangle size also indicates the degree of deviation of supply from the 1990 baseline. Both changes in supply and abundance tend to fall into the same categorizations. Those areas that experience differences are usually (but not exclusively) characterized by a supply index that is slightly more extreme than that of abundance. This suggests that the pollinators may be more selective about their habitats (origins) than in the areas they are willing to traverse in search of food.

3.4. Validation

The PSIRL validation technique required translation of the given PSIRL index values to the original input LULC raster map (Appendix A). The resulting difference map (Figure 6) includes an overlay of the riparian areas (including a buffer of 300 m from water areas), as well as an indication of the area of which the PSIRL index was originally derived (the River Minho area in north western Portugal, identified with a red box). The yellow zones indicate those in which the validation demonstrates good coincidence with the results of the study (within a 5% tolerance), whereas the stronger purple and red colors indicate larger discrepancies between the two methods (a maximum discrepancy of 38%). Clearly the results incorporate some amount of spatial autocorrelation, though surprisingly these are not necessarily correlated with riparian adjacent areas as one might expect. The PSIRL tends to slightly over-predict the supply of pollinators as compared to the results of the study. The difference map indicates a strong spatial similarity between the two models, strengthening the confidence in the study results.

4. Discussion

4.1. Study Significance

Bees require suitable places to nest and sufficient food sources near nesting sites to sustain them [1]. These and other factors have been applied to a model that produces maps of projected pollinator activity within Portugal. Too often, stakeholders (farmers, policy makers, economists, etc.) ignore the subtle interactions between ecosystem services and production, which can be to their own detriment when those nebulous costs outstrip their values [4]. It is estimated that, at the current rate of land use transformation, the United States gross domestic product (GDP) will suffer a loss of 0.02% (or 15 billion USD) due to reduced wild pollinator habitats near agricultural sites [8], which can have ripple effects in other industries to compensate for the deficit.
Results of this study and other such investigation will ideally support farmers, land developers, and policy makers alike with better information from which to make decisions about how to better manage these resources as well as improve economics systems that depend on them by maximizing their sustainability. Agriculture and thriving pollinator communities are not mutually exclusive. In fact, well-managed cropland can be economically and ecologically productive [6,7,10,11]. For instance, farmers could identify locations for crops based on maximizing exposure to wild pollinators, adjust their management towards organic practices, or maintain heterogeneous nesting substrates that would attract diverse and productive pollinator populations [13]. Likewise, configuring farms towards a variety of pollinators (instead of just the domesticated varieties) can produce better yields, as different pollinators are associated with varying levels of productivity for certain crops [29]. Even the understanding of the tendency of larger bees to populate new fields and smaller bees to prefer older fields [8], or the observed abundance and variety of pollinators in forest edges and grasslands [6] can assist with the development of management strategies. Further, the understanding of the relationships between space, crops, and pollinators may provide an incentive to better care for areas beyond crop fields [31] or mitigate the appeal of monoculture practices [7]. In fact, there is potential for the benefits of ecosystem services management practices to positively impact other areas within foraging distances of the appealing habitat sites. On the flip side, poor planning regarding conversion patterns of forest to agriculture can have devastating impacts on wild bee populations that will also undercut the productivity of the new agricultural land [7].
The association to municipalities provides a simplification of the detailed information to ease comprehension of the big picture, such that areas requiring intervention (those tending towards lower suitability) can be triaged and evaluated more efficiently. Though pollination may not be strictly required to achieve sufficient caloric intake, indeed many staple foods do not require this type of sexual reproduction, the production of many valuable nutrients require pollination [27], and pollination services haves been linked to qualitative (nutritional content, appearance) and quantitative (production yields) factors that boost economic value of agricultural production [32]. Ideally, stakeholders will be able to model and evaluate different policies and their effects on farm productivity, optimizing both resilient biodiversity as well as economic yields [1,6,10]. Methods to achieve this could be coordinating reserved land areas that provide pollination services through integration of natural areas throughout agricultural areas [31]. Further, incentive programs that promote healthy management practices or payment schemes could be organized, in addition to the inherent benefits experienced by the implementing farmers [26]. As this is a relatively new concept, there is much room for novel methods of accounting for ecosystem services within the economic structure of farmers and other land managers.

4.2. Critical Analysis

This study provides a valuable baseline indicator of pollinator services within continental Portugal. Overall, since 1990 there have been significant, polarizing tendencies of municipalities across Portugal. The percent variation of likelihood for pollinators to be active between 1990 and 2018 swings from −69% (Pedrógão Grande) to 107% (Ponte da Barca and Vila de Rei). As one would expect, there are concentrations of negative trend areas that are associated with major city areas and likely rapid urbanization (such as Lisbon, and Porto areas), as well as some areas of vast agriculture swaths (the south west portion of Alentejo Central), which are less hospitable. On the other hand, it is promising to see the constant improvement through central northern Portugal. Interestingly the areas of greatest percent increase and decrease are located adjacent to each other: the municipalities along the border of Médio Tejo and Beira Baixa both exhibit extremely positive trends since 1990, yet just across the border, several municipalities in Região de Leiria include some of the most negative changes in the same time frame. This is due to recent fires resulting in large swatch of burnt areas in these regions, making them inhospitable to pollinators, though their neighboring forested areas demonstrate favorable habitats. Some areas have significantly changed from the 1990 baseline. Ponte da Barca continues to improve its tendency towards pollinator likelihood in both abundance and supply, rising to a high of 107 and 109 percent variation increases, respectively.
The positive trend of pollinator abundance and supply indicators are consistent with the findings of another study that Portugal demonstrated impressive improvements in pollination potential [7]. From the maps of Figure 5, policy makers and farmers alike may better understand the existing trends of pollinator suitability since 1990, using this information to support new interventions that may increase pollinator suitability within each municipality. Of course, pollinator suitability may not be a priority to certain urban areas such as Lisbon or Porto, or municipalities specifically cultivating crops that do not require pollination such as the Douro region. Other areas of agricultural swatches that demonstrate reduced or unchanging suitability may benefit from a re-organization of agricultural land to better suit natural pollinator activity. These include areas such as Alentejo Central and Algarve areas, though many other persistent or worsening regions are distributed throughout Portugal.

4.3. Additional Findings

The results also demonstrate the stark impacts of forest fires on pollinator suitability, such as the dramatic changes in the Região de Leiria. Portugal is prone to fires in the hot, dry summers. Though these are often uncontrollable natural phenomena, understanding their effects on pollinator activity among other ecosystem services in conjunction with social loss may strengthen the attempts to better manage forest areas and inspire more radical interventions to recover the areas in the wake of such devastation. More granular studies may consider excluding burnt areas from their studies, though they were retained here as they contribute to the overall trends (encompassing both natural and human influence) in mainland Portugal.

4.4. Research Limitations

Though the results of this study are promising, there are several limitations of note and opportunities for future improvement. The results of this study are limited the to the available data and certainly leave much opportunity for further evolution. Because pollinators can differ significantly from ecosystem to ecosystem [16], leveraging the parameters of similar studies in other regions is often inappropriate. Better characterization of local bee species throughout the study area may yield more accurate characterization of the potential of this ecosystem service. For example: the pollination potential characterized in this study is relative only to Apis mellifera, which has different habitat and foraging preferences and activities (such as potential foraging distances) than other smaller, wild species. However, due to scarcity of data on the behaviors and preferences of other wild bee guilds in Portugal, only a single bee specie was characterized. The application of the methodology undertaken by [26] in the Minho river area (counting the number and characterization of pollinators active in a particular area) to the entire country was outside of the scope of this project but this and the inclusion of expert based models (EBM) could enhance future research [27]. In addition to better characterization of pollinators, more detailed parameterization of the biophysical table of LULC designations (such as the inclusion of multiple nesting substrates and seasons) could more accurately reflect the actual pollination activity throughout the year.
InVEST models measure the potential of the study area to provide pollination for bee pollinators. Additional considerations outside of the model purview will affect the actual pollination supply, such as the lack of accounting for pollinator persistence over time. Likewise, many other non-bee pollinators (such as butterflies, bats, moths, and birds) that are active in Portugal are not accommodated in the model. These and other such inherent limitations are described in the InVEST documentation in greater detail [11]. Notably, the model does not distinguish between natural or artificially initiated changes in pollination potential-discerning the source requires savvy technicians and good understanding of the local context to presume.
Regarding the input raster maps, the minimum mapping unit of 25 hectares of the CLC LULC data does not accommodate the impact of potential pollinator habitats or foraging supplies smaller than this area (such as in green spaces in urban areas). Similarly, the study does not accommodate the implementation of agricultural practices that may alter the desirability of the area for pollinators, such as the accommodation of nesting sites or use of pesticides. Though pollination is sensitive to both aggregation and spatial resolution as an ecological service that involves stocks and dynamics, it is expected that the CLC mapping units are appropriate for the scale of study [27]. Likewise, the study is subject to the accuracy of the CLC classifications. Any assumptions or misclassifications will propagate through this study.

4.5. Future Opportunities

The InVEST crop pollination model, in additional to providing suitability indices of pollinator habitat and foraging supply, can model a yield index for pollination impacts on existing agriculture [8]. This requires vector data detailing the geospatial location of farms along with their crop types, dependence on pollinators, abundance of managed pollinators, farm nesting sites and floral resources. This study did not have access to national farm data, and the establishment of the required attributes would require additional investigation outside of the scope of this project, likely including the need of expert opinion to properly assign values to these parameters. This is an area of potential study in future endeavors.
Suitability of edge environments has been noted to differ from that of non-edge environments. For example, forest edges are particularly suitable as pollinator habitat [13,16], but are not accommodated in the InVEST model. Other studies have included additional characterization of these areas, which could improve the approach with this additional nuance. Roadsides and riparian areas are further examples of opportunities for model adjustment and finer characterization. The study could also benefit from the accommodation of more granular parameterization, including that of urban areas hosting managed bee colonies or integrating green and biodiverse areas within the built environment, distinction between forest compositions, or refuge areas that may experience different pollinator assemblages.

5. Conclusions

The land use land cover impact on pollination services distributed over time and space was studied in the context of continental Portugal. The InVEST crop pollination service modeling tool was leveraged to understand the spatial relationship between pollinator abundance relative to a landscape’s available habitat and food resources in accordance with their behavior and preferences. The results demonstrated an overall improvement in wild pollinator hospitality across the country, though several municipalities are becoming increasingly weaker in their suitability for such services. The relative distribution of pollinator hospitality indices was validated via a local pollination index based on field sampling and expert opinion.
In Portugal the measured distribution of tons of crop production in the country is almost equally distributed between known dependency (34.2%), non-dependency (33.4%) and unknown dependency on pollinators [32] With more than a third (and potentially up to two thirds) of the production weight relying on pollinators, there is a large economic incentive for agro-farmers, the primary beneficiary of pollinator services [33], to incorporate pollination ecosystem services into their practices and protect these resources. Further, secondary beneficiaries—such as consumers of more nutrient dense crops or governments receiving greater tax revenues—will experience positive effects from the products of these measures as well.

Author Contributions

Conceptualization, C.W., F.S.C., J.D. and P.C.; methodology, C.W., F.S.C., J.D. and P.C.; formal analysis, C.W.; investigation, C.W., F.S.C., J.D. and P.C.; writing—original draft preparation, C.W.; writing—review and editing, C.W., F.S.C. and P.C.; visualization, C.W. and F.S.C.; supervision, F.S.C. and P.C.; project administration, P.C. All authors have read and agreed to the published version of the manuscript.

Funding

This study was supported through the FCT (Fundação para a Ciência e a Tecnologia) under the projects PTDC/CTA-AMB/28438/2017—ASEBIO and UIDB/04152/2020—Centro de Investigação em Gestão de Informação (MagIC).

Institutional Review Board Statement

Not applicable.

Informed Consent Statement

Not applicable.

Data Availability Statement

The data that support the findings of this study are available on reasonable request from the corresponding author.

Acknowledgments

The authors would like to thank the anonymous Reviewers for their comments which helped improving the quality of this manuscript.

Conflicts of Interest

The authors declare no conflict of interest.

Appendix A. Model Parameterization

Table A1. Land Use Land Cover (LULC) classes, parameterization of the biophisical table for the InVEST model (nesting and floral resources), and PSIRL final scores used in validation.
ClassesNesting ResoursesFloral ResoursesPSIRL Final Scores
Riparian scrubland0.80.90.83
Broad-leaved forest0.80.90.83
Natural grassland0.810.81
Moors and heathland0.810.81
Sclerophyllous vegetations0.810.81
Transitional woodland scrub0.810.81
Riparian forest0.80.50.78
Fruit trees and berry plantations0.40.90.6
Olive groves0.50.40.6
Mixed forest0.80.60.55
Sparsely vegetated areas0.70.350.52
Inland marshes0.30.750.52
Salt marshes0.30.550.52
Coniferous forest0.80.30.49
Annual crops associated with permanent crops0.40.50.47
Complex cultivation patterns0.40.40.47
Land principally occupied by agriculture0.70.750.47
Agro-forestry areas10.50.47
Non-irrigated arable land0.20.20.39
Permanently irrigated land0.20.050.39
Rice fields0.20.050.39
Pastures0.30.20.39
Continuous urban fabric0.10.050.23
Discontinuous urban fabric0.30.30.23
Industrial or commercial units0.10.050.23
Road and rail networks0.30.250.23
Port areas0.300.23
Airports0.300.23
Mineral extraction sites0.30.050.23
Dump sites0.0500.23
Green urban areas0.30.250.23
Sport and leisure facilities0.30.050.23
Vineyards0.40.60.2
Burnt areas0.30.20.13

References

  1. Costanza, R.; D’Arge, R.; de Groot, R.; Farber, S.; Grasso, M.; Hannon, B.; Limburg, K.; Naeem, S.; O’Neill, R.V.; Paruelo, J.; et al. The Value of the World’s Ecosystem Services and Natural Capital. Nature 1997, 387, 253–260. [Google Scholar] [CrossRef]
  2. Chaplin-Kramer, R.; Sharp, R.P.; Weil, C.; Bennett, E.M.; Pascual, U.; Arkema, K.K.; Brauman, K.A.; Bryant, B.P.; Guerry, A.D.; Haddad, N.M.; et al. Global Modeling of Nature’s Contributions to People. Science 2019, 366, 255–258. [Google Scholar] [CrossRef]
  3. Grafius, D.R.; Corstanje, R.; Harris, J.A. Linking Ecosystem Services, Urban Form and Green Space Configuration Using Multivariate Landscape Metric Analysis. Landsc. Ecol. 2018, 33, 557–573. [Google Scholar] [CrossRef] [Green Version]
  4. Johnson, J.A.; Baldos, U.; Hertel, T.; Liu, J.; Nootenboom, C.; Polasky, S.; Roxburgh, T. Global Futures: Modelling the Global Economic Impacts of Environmental Change to Support Policy-Making; WWF UK: Woking, UK, 2020. [Google Scholar]
  5. Patrício-Roberto, G.B.; Campos, M.J.O. Aspects of Landscape and Pollinators-What Is Important to Bee Conservation? Diversity 2014, 6, 158–175. [Google Scholar] [CrossRef] [Green Version]
  6. Kennedy, C.M.; Lonsdorf, E.; Neel, M.C.; Williams, N.M.; Ricketts, T.H.; Winfree, R.; Bommarco, R.; Brittain, C.; Burley, A.L.; Cariveau, D.; et al. A Global Quantitative Synthesis of Local and Landscape Effects on Wild Bee Pollinators in Agroecosystems. Ecol. Lett. 2013, 16, 584–599. [Google Scholar] [CrossRef]
  7. Klein, A.M.; Vaissière, B.E.; Cane, J.H.; Steffan-Dewenter, I.; Cunningham, S.A.; Kremen, C.; Tscharntke, T. Importance of Pollinators in Changing Landscapes for World Crops. Proc. R. Soc. B 2007, 274, 303–313. [Google Scholar] [CrossRef] [PubMed] [Green Version]
  8. Zulian, G.; Maes, J.; Paracchini, M.L. Linking Land Cover Data and Crop Yields for Mapping and Assessment of Pollination Services in Europe. Land 2013, 2, 472–492. [Google Scholar] [CrossRef] [Green Version]
  9. Losey, J.E.; Vaughan, M. The Economic Value of Ecological Services Provided by Insects. BioScience 2006, 56, 311–323. [Google Scholar] [CrossRef] [Green Version]
  10. Picanço, A.; Gil, A.; Rigal, F.; Borges, P.A.V. Pollination Services Mapping and Economic Valuation from Insect Communities: A Case Study in the Azores (Terceira Island). Nat. Conserv. 2017, 18, 1–25. [Google Scholar] [CrossRef] [Green Version]
  11. Grafius, D.R.; Corstanje, R.; Warren, P.H.; Evans, K.L.; Hancock, S.; Harris, J.A. The Impact of Land Use/Land Cover Scale on Modelling Urban Ecosystem Services. Landsc. Ecol. 2016, 31, 1509–1522. [Google Scholar] [CrossRef] [Green Version]
  12. Greenleaf, S.S.; Williams, N.M.; Winfree, R.; Kremen, C. Bee Foraging Ranges and Their Relationship to Body Size. Oecologia 2007, 153, 589–596. [Google Scholar] [CrossRef]
  13. Groff, S.C.; Loftin, C.S.; Drummond, F.; Bushmann, S.; McGill, B. Parameterization of the InVEST Crop Pollination Model to Spatially Predict Abundance of Wild Blueberry (Vaccinium angustifolium) Native Bee Pollinators in Maine, USA. Environ. Model. Softw. 2016, 79, 1–9. [Google Scholar] [CrossRef] [Green Version]
  14. Lonsdorf, E.; Kremen, C.; Ricketts, T.; Winfree, R.; Williams, N.; Greenleaf, S. Modelling Pollination Services across Agricultural Landscapes. Ann. Bot. 2009, 103, 1589–1600. [Google Scholar] [CrossRef] [PubMed] [Green Version]
  15. Roxburgh, T.; Ellis, K.; Johnson, J.A.; Baldos, U.L.; Hertel, T.; Nootenboom, C.; Polasky, S. Global Futures: Assessing the Global Economic Impacts of Environmental Change to Support Policy-Making; WWF UK: Woking, UK, 2020. [Google Scholar]
  16. Santos, A.; Fernandes, M.R.; Aguiar, F.C.; Branco, M.R.; Ferreira, M.T. Effects of Riverine Landscape Changes on Pollination Services: A Case Study on the River Minho, Portugal. Ecol. Indic. 2018, 89, 656–666. [Google Scholar] [CrossRef]
  17. Koh, I.; Lonsdorf, E.V.; Williams, N.M.; Brittain, C.; Isaacs, R.; Gibbs, J.; Ricketts, T.H. Modeling the Status, Trends, and Impacts of Wild Bee Abundance in the United States. Proc. Natl. Acad. Sci. USA 2016, 113, 140–145. [Google Scholar] [CrossRef] [PubMed] [Green Version]
  18. Direção Geral do Território (DGT); Carta Administrativa Oficial de Portugal: Lisboa, Portugal, 2018.
  19. Camacho, I.; Caeiro, E.; Nunes, C.; Morais-Almeida, M. Airborne Pollen Calendar of Portugal: A 15-Year Survey (2002–2017). Allergol. Immunopathol. 2020, 48, 194–201. [Google Scholar] [CrossRef]
  20. Copernicus Program, CORINE Land Cover. Available online: https://land.copernicus.eu/paneuropean/corine-land-cover (accessed on 30 March 2020).
  21. ECA. Desertification in the EU.; Background Paper; European Court of Auditors (ECA)—Guardians of the EU Finances: Luxembourg, 2018. [Google Scholar]
  22. World Bank Open Data—Indicators. Available online: https://data.worldbank.org/indicator/SP.POP.TOT?locations=PT&most_recent_value_desc=true (accessed on 3 April 2020).
  23. Ciência Viva. Polinizadores em ação. Available online: http://www.cienciaviva.pt/aprenderforadasalaeaula/index.asp?accao=showobj&id_obj=1532 (accessed on 31 March 2020).
  24. BioDiversity4All. Observations, Apis Mellifera. Available online: https://www.biodiversity4all.org/observations?place_id=7122&q=abelha&view=species&iconic_taxa=Insecta (accessed on 30 March 2020).
  25. Baldock, D.W.; Wood, T.J.; Smit, J.T. The Bees of Portugal (Hymenoptera: Apoidea: Anthophila). Entomofauna Suppl. 2018, 22, 164. [Google Scholar]
  26. Vallecillo, S.; la Notte, A.; Polce, C.; Zulian, G.; Alexandris, N.; Ferrini, S.; Maes, J. Ecosystem Services Accounting: Part I—Outdoor Recreation and Crop Pollination; Publications Office of the European Union: Luxembourg, 2018; ISBN 9789279773334. [Google Scholar]
  27. Sharp, R.; Douglas, J.; Wolnie, S.; Arkema, K.; Bernhardt, J.; Bierbower, W.; Chaumont, N.; Denu, D.; Fisher, D.; Glowinski, K.; et al. InVEST 3.8.9 User’s Guide; The Natural Capital Project, Standford University, University of Minnesota, The Nature Conservancy, and World Wildlife Fund: Standford, CA, USA, 2020; Available online: https://invest-userguide.readthedocs.io/en/latest/ (accessed on 9 April 2021).
  28. BSD License Definition. Available online: http://www.linfo.org/bsdlicense.html (accessed on 23 September 2020).
  29. Gathmann, A.; Tscharntke, T. Foraging Ranges of Solitary Bees. J. Anim. Ecol. 2002, 71, 757–764. [Google Scholar] [CrossRef]
  30. Hammond, G.; Blankenship, M. Apis Mellifera. Available online: https://animaldiversity.org/accounts/Apis_mellifera/ (accessed on 17 September 2020).
  31. Chaplin-Kramer, R.; Sharp, R.P.; Mandle, L.; Sim, S.; Johnson, J.; Butnar, I.; Milà, I.; Canals, L.; Eichelberger, B.A.; Ramler, I.; et al. Spatial Patterns of Agricultural Expansion Determine Impacts on Biodiversity and Carbon Storage. Proc. Natl. Acad. Sci. USA 2015, 112, 7402–7407. [Google Scholar] [CrossRef] [Green Version]
  32. Porto, R.G.; de Almeida, R.F.; Cruz-Neto, O.; Tabarelli, M.; Viana, B.F.; Peres, C.A.; Lopes, A.V. Pollination Ecosystem Services: A Comprehensive Review of Economic Values, Research Funding and Policy Actions. Food Secur. 2020, 12, 1425–1442. [Google Scholar] [CrossRef]
  33. Tashie, A.; Ringold, P.A. Critical Assessment of Available Ecosystem Services Data According to the Final Ecosystem Goods and Services Framework. Ecosphere 2019, 10, e02665. [Google Scholar] [CrossRef] [PubMed] [Green Version]
Figure 1. CORINE Land Cover of 2018 (level 1) distribution in Portugal, with municipal boundary definition (Carta Administrativa Oficial de Portugal: CAOP 2018).
Land 10 00431 g001
Figure 2. Schematic representation for analyzing the statistical comparison model flow.
Land 10 00431 g002
Figure 3. Pollination Suitability Index for Riverine Landscapes (PSIRL) validation flow.
Land 10 00431 g003
Figure 4. Spatial distribution of InVEST crop pollination model outputs (a) abundance index and (b) supply index in 2018.
Land 10 00431 g004
Figure 5. Percent variation (PV) from 1990 to 2018 of abundance and supply indices by municipality.
Land 10 00431 g005
Figure 6. Difference between study results and Pollination Suitability Index for Riverine Landscapes (PSIRL) with riparian zone overlay. Red box indicates River Minho area, in north western Portugal.
Land 10 00431 g006
Table 1. Land Use Land Cover (LULC) percentage by 1990 and its percent variation (PV) by 2018.
LULC1990 LULC (%)2018 PV (%)
Artificial surfaces1.90101.27%
Agricultural areas48.70−1.83%
Forests and seminatural areas47.92−3.00%
Wetlands0.327.08%
Water bodies1.1533.59%
Table 2. Statistics of InVEST crop pollination model results in 1990 and 2018.
YearIndexMinMaxMeanStd
1990Abundance 0.0000.7000.2740.163
1990Supply 0.0000.7090.2740.163
2018Abundance0.0000.7110.2980.174
2018Supply0.0000.6940.2980.174
Publisher’s Note: MDPI stays neutral with regard to jurisdictional claims in published maps and institutional affiliations.

