
Assessment of River-Sea Interaction in the Danube Nearshore Area (Ukraine) by Bioindicators and Statistical Mapping


Abstract
1. Introduction
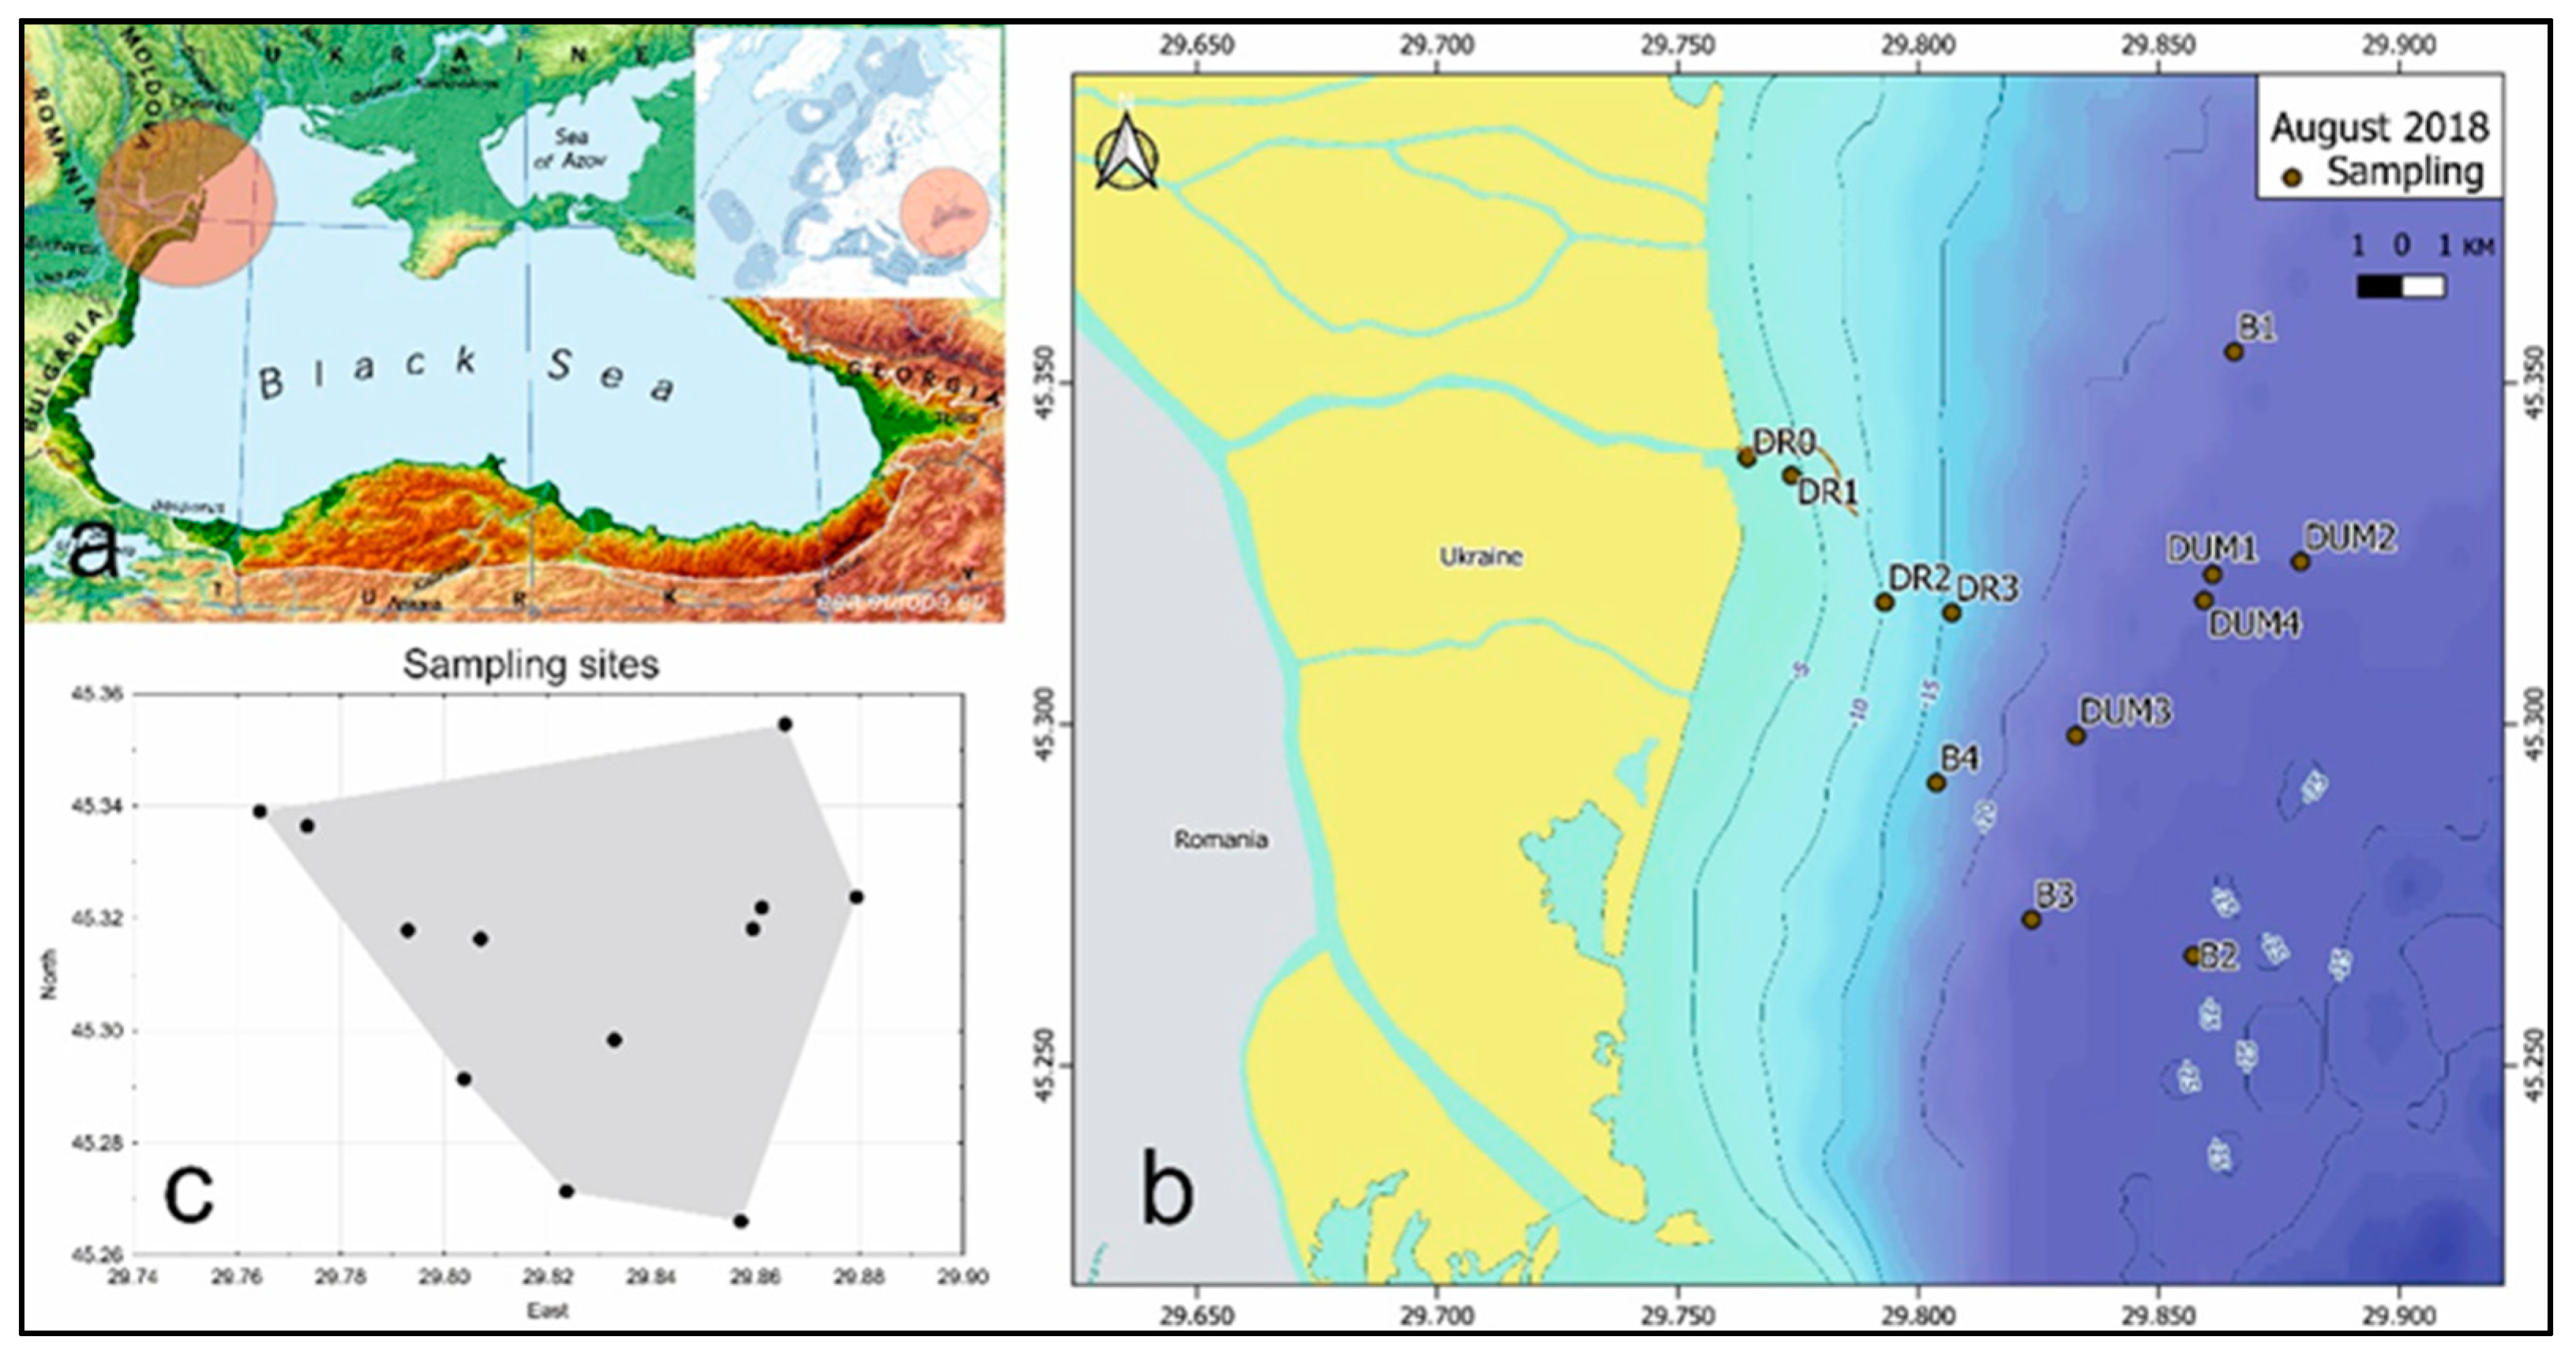
2. Materials and Methods
3. Results
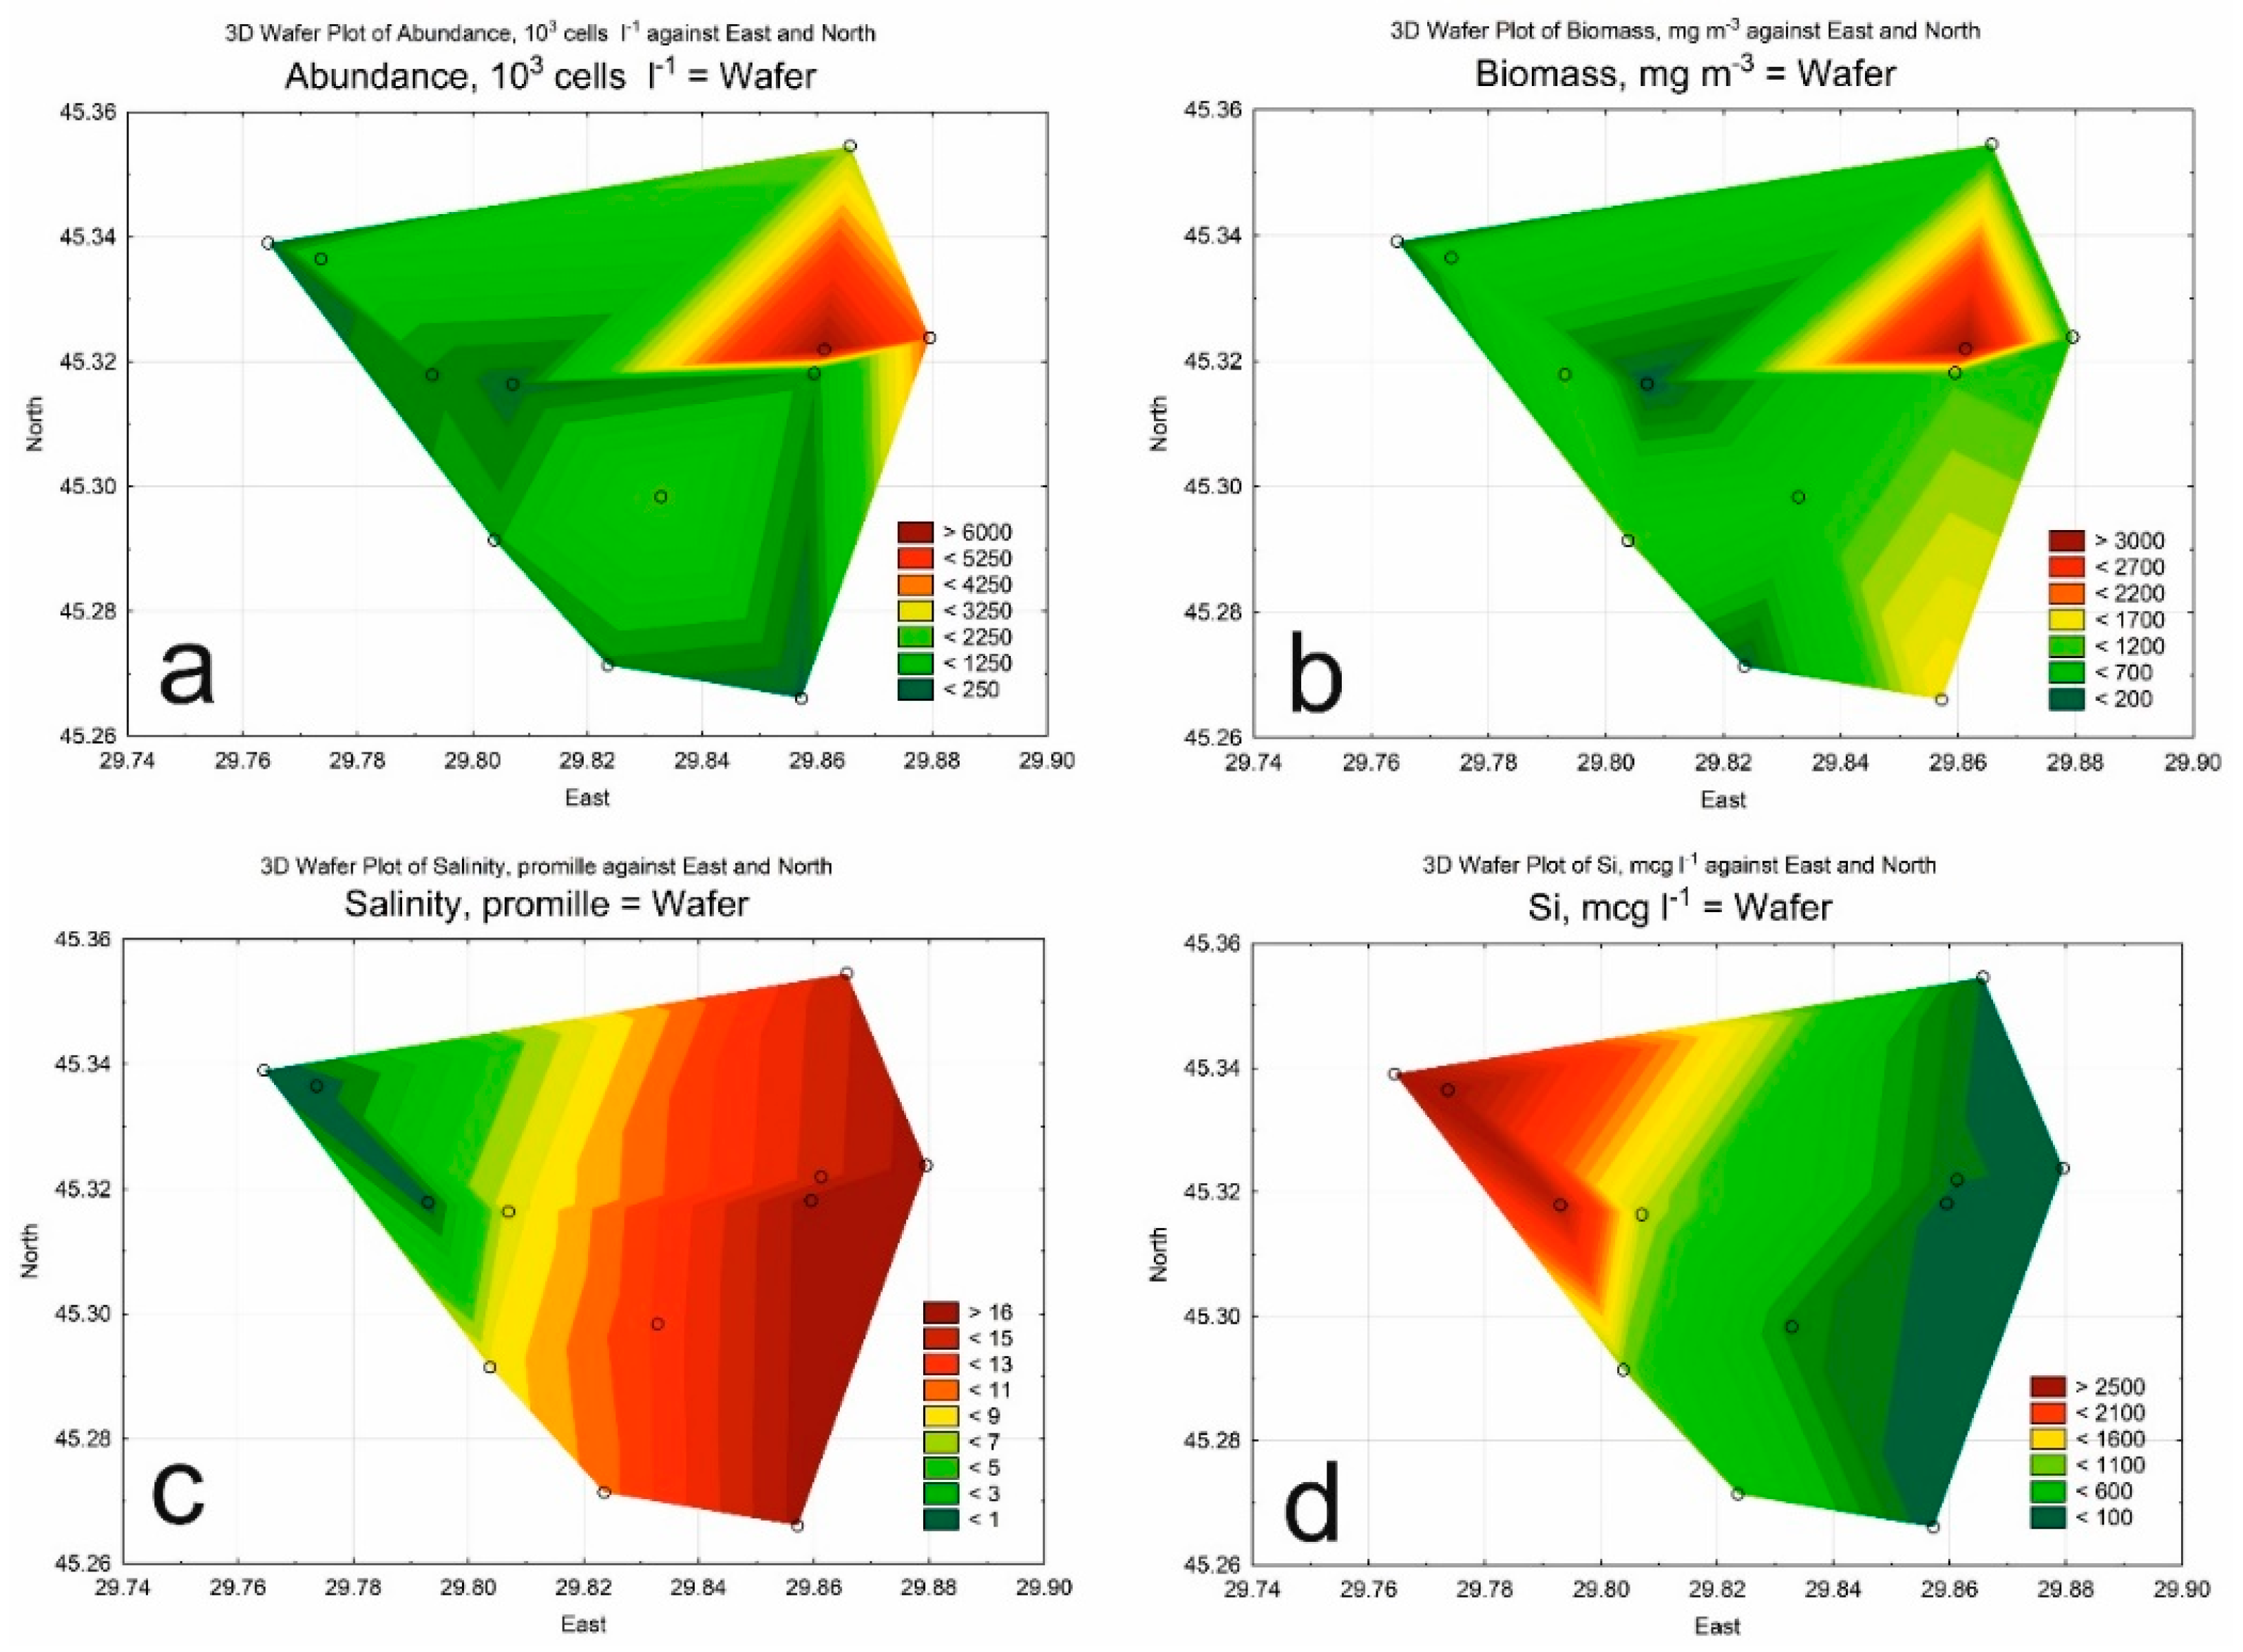
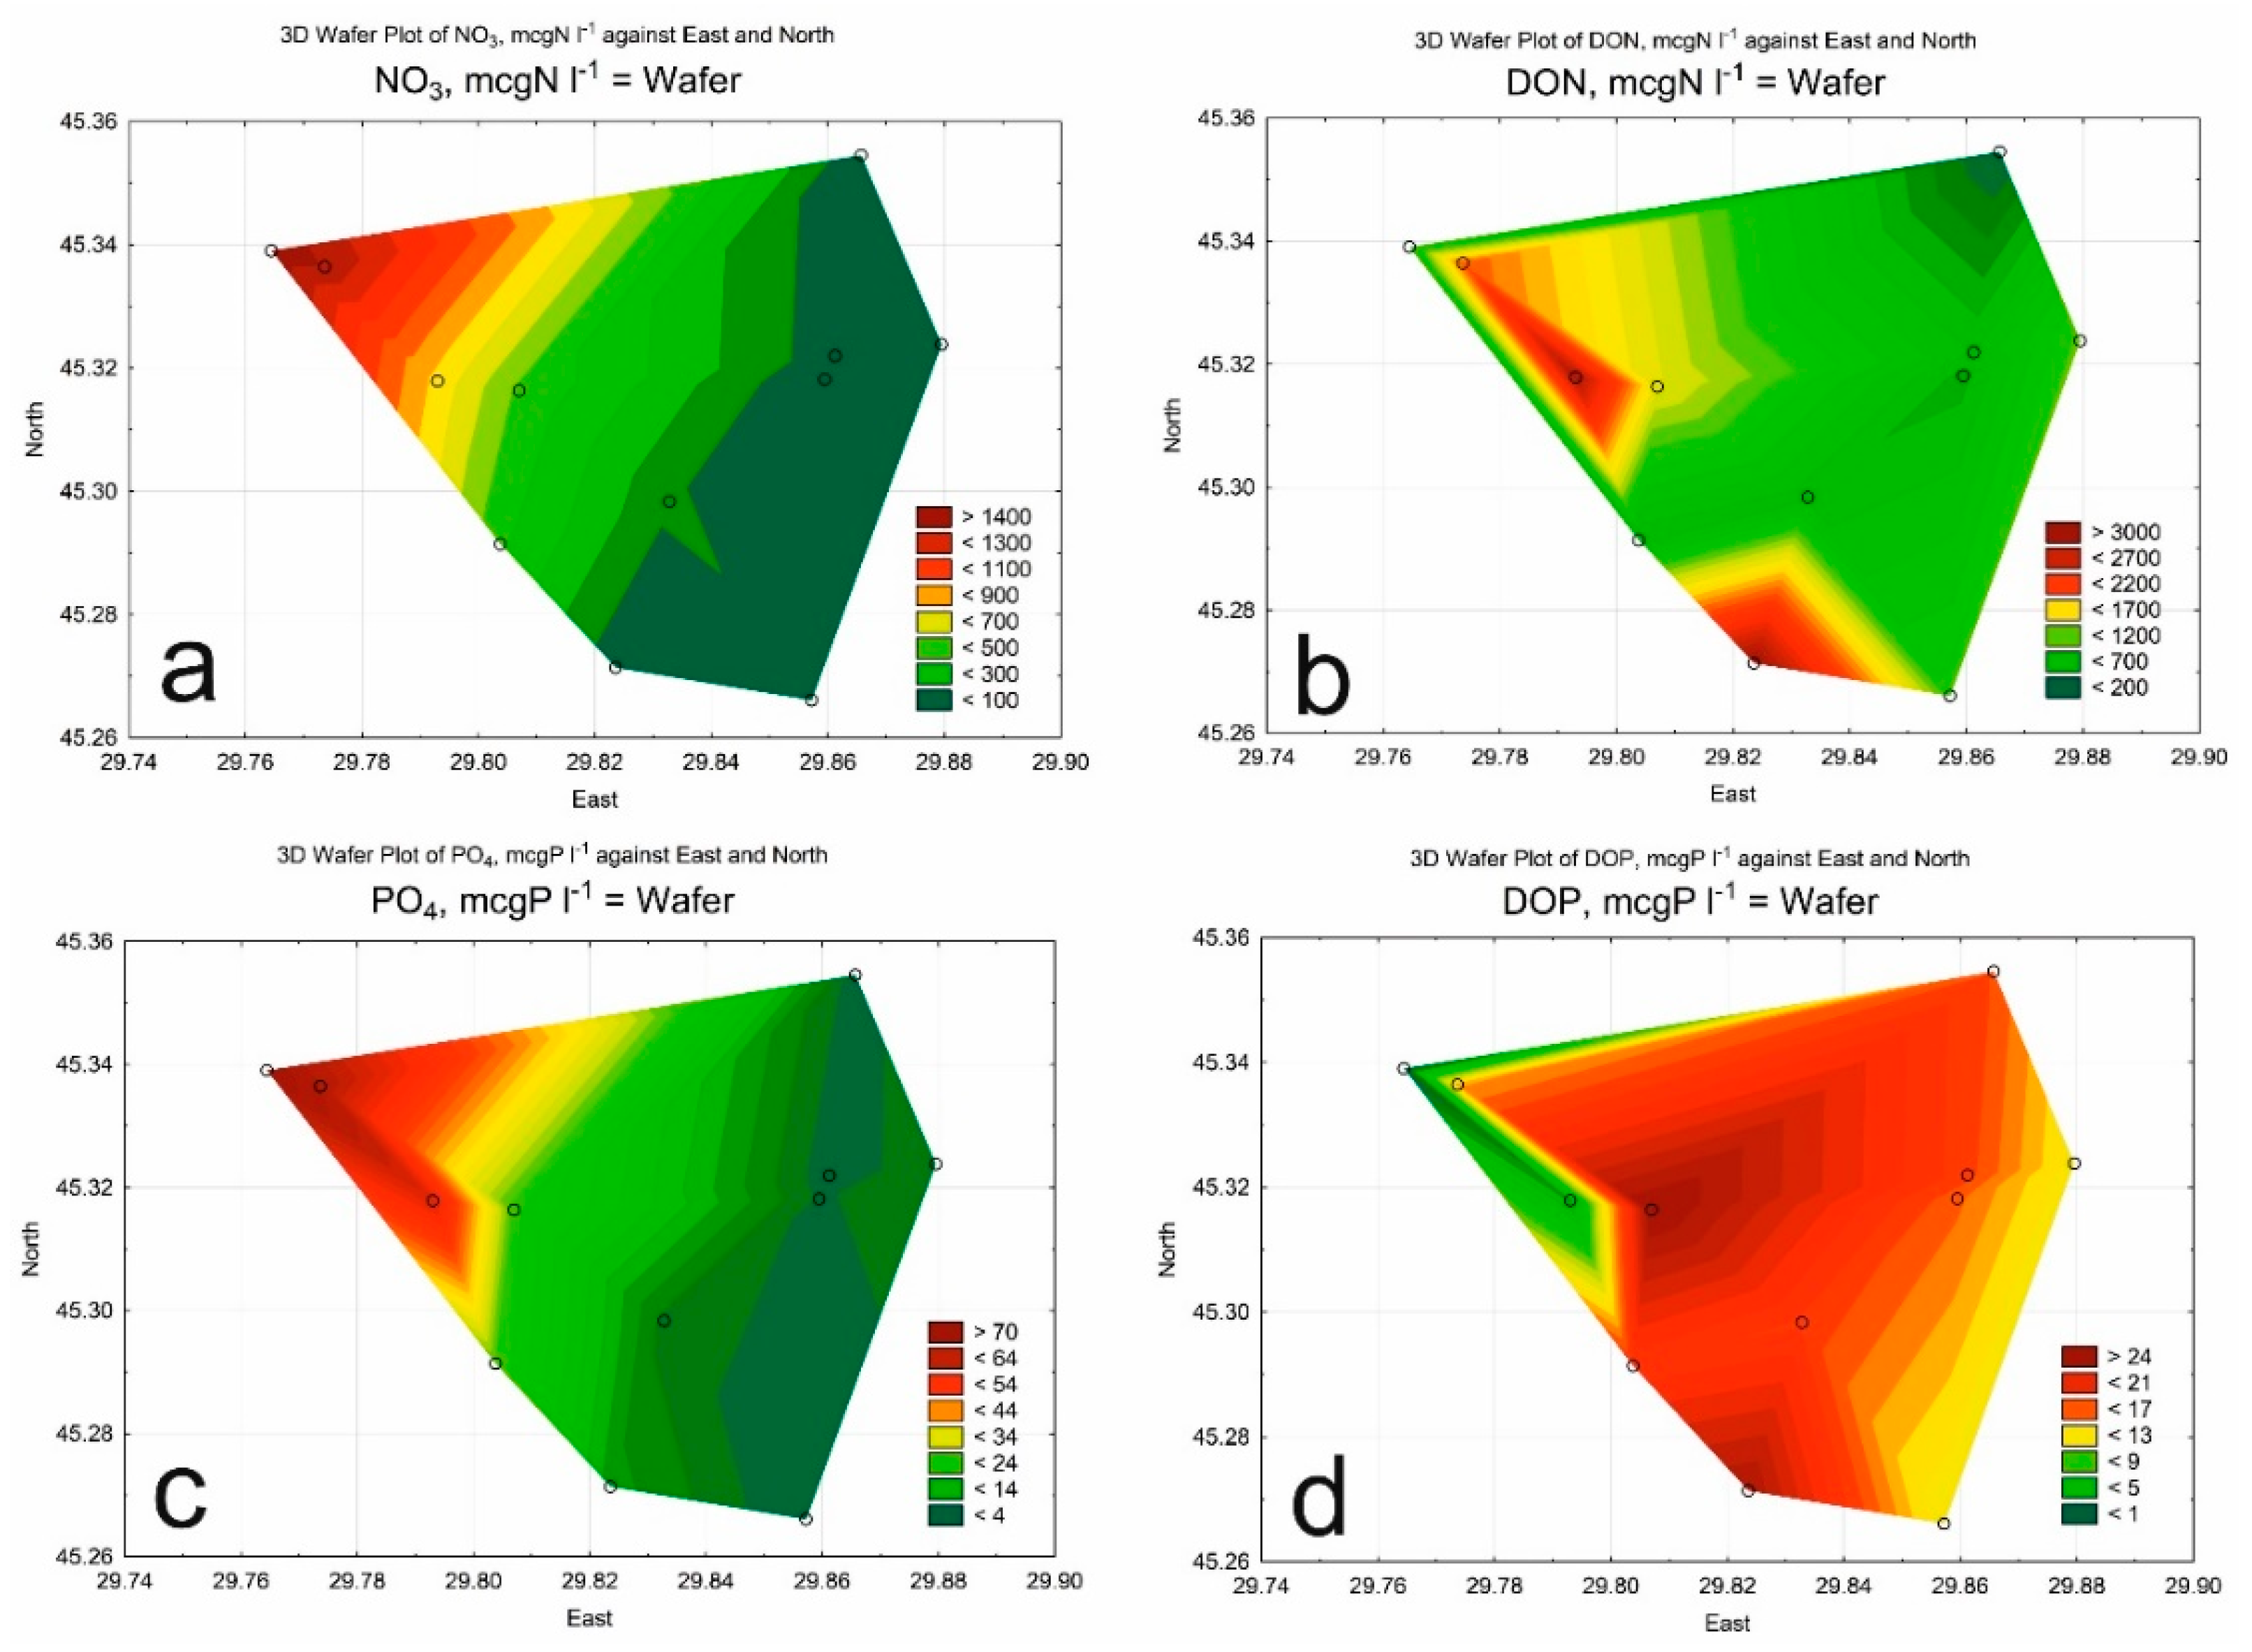
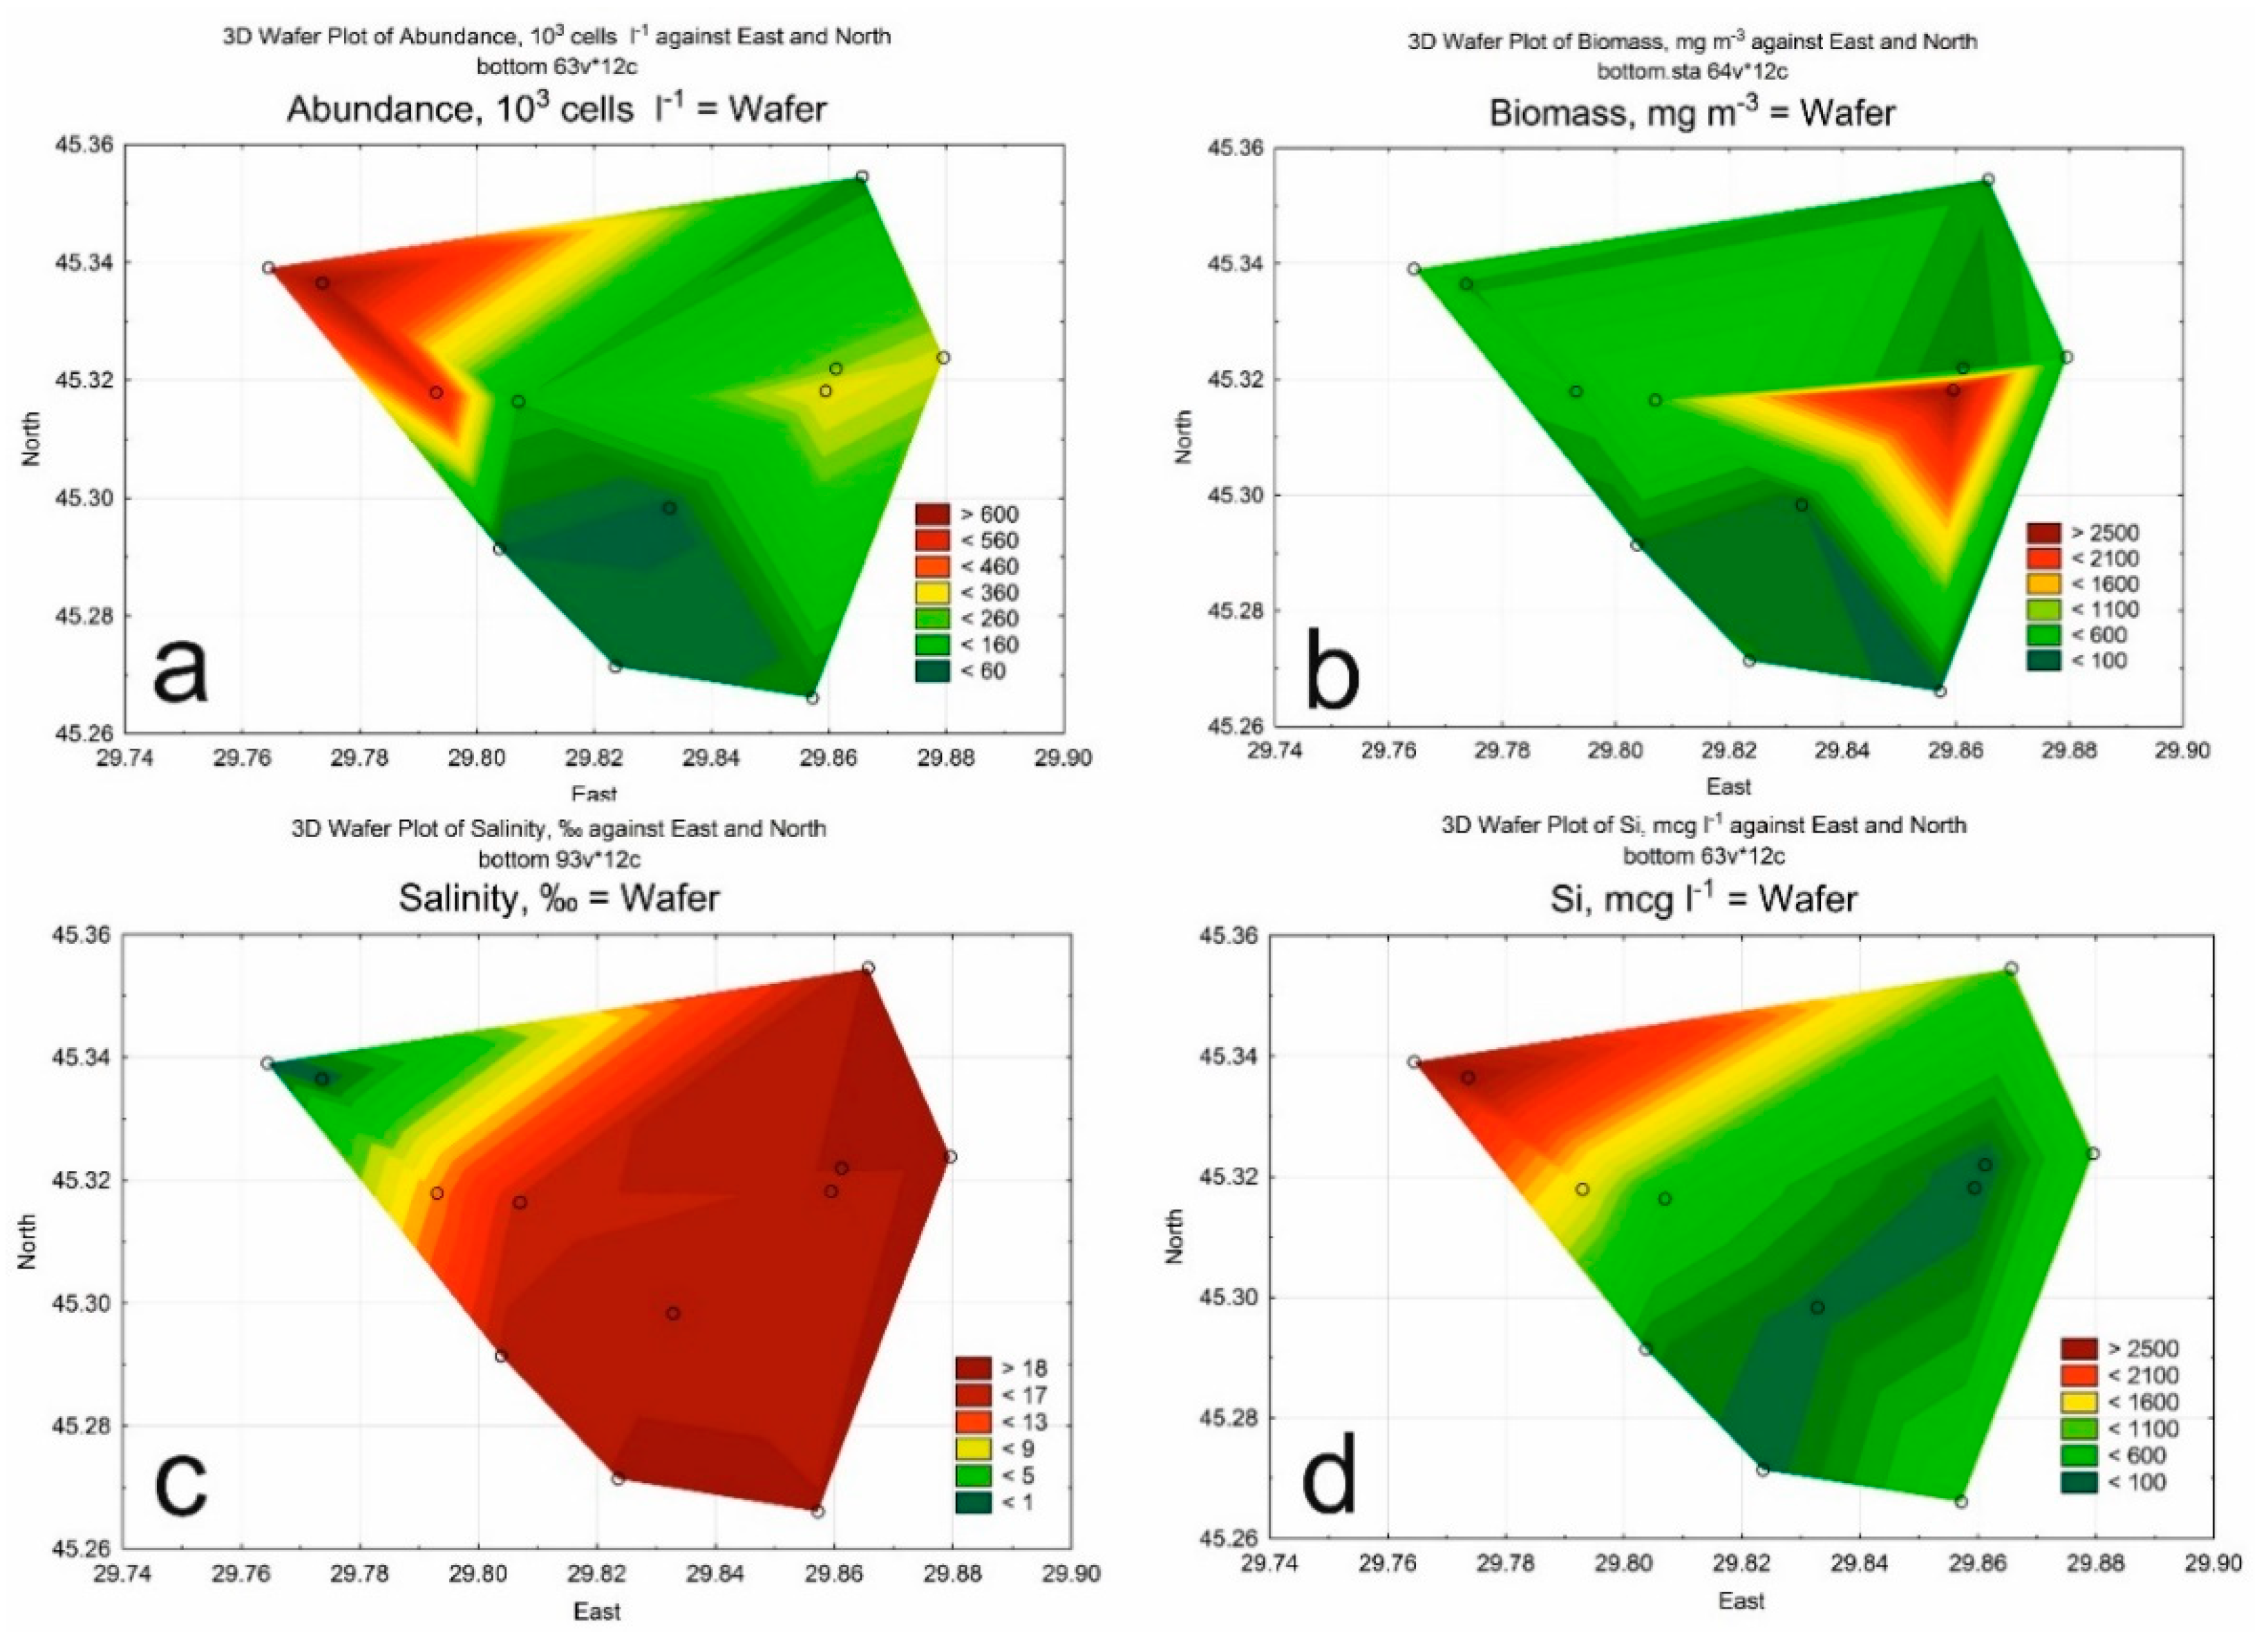
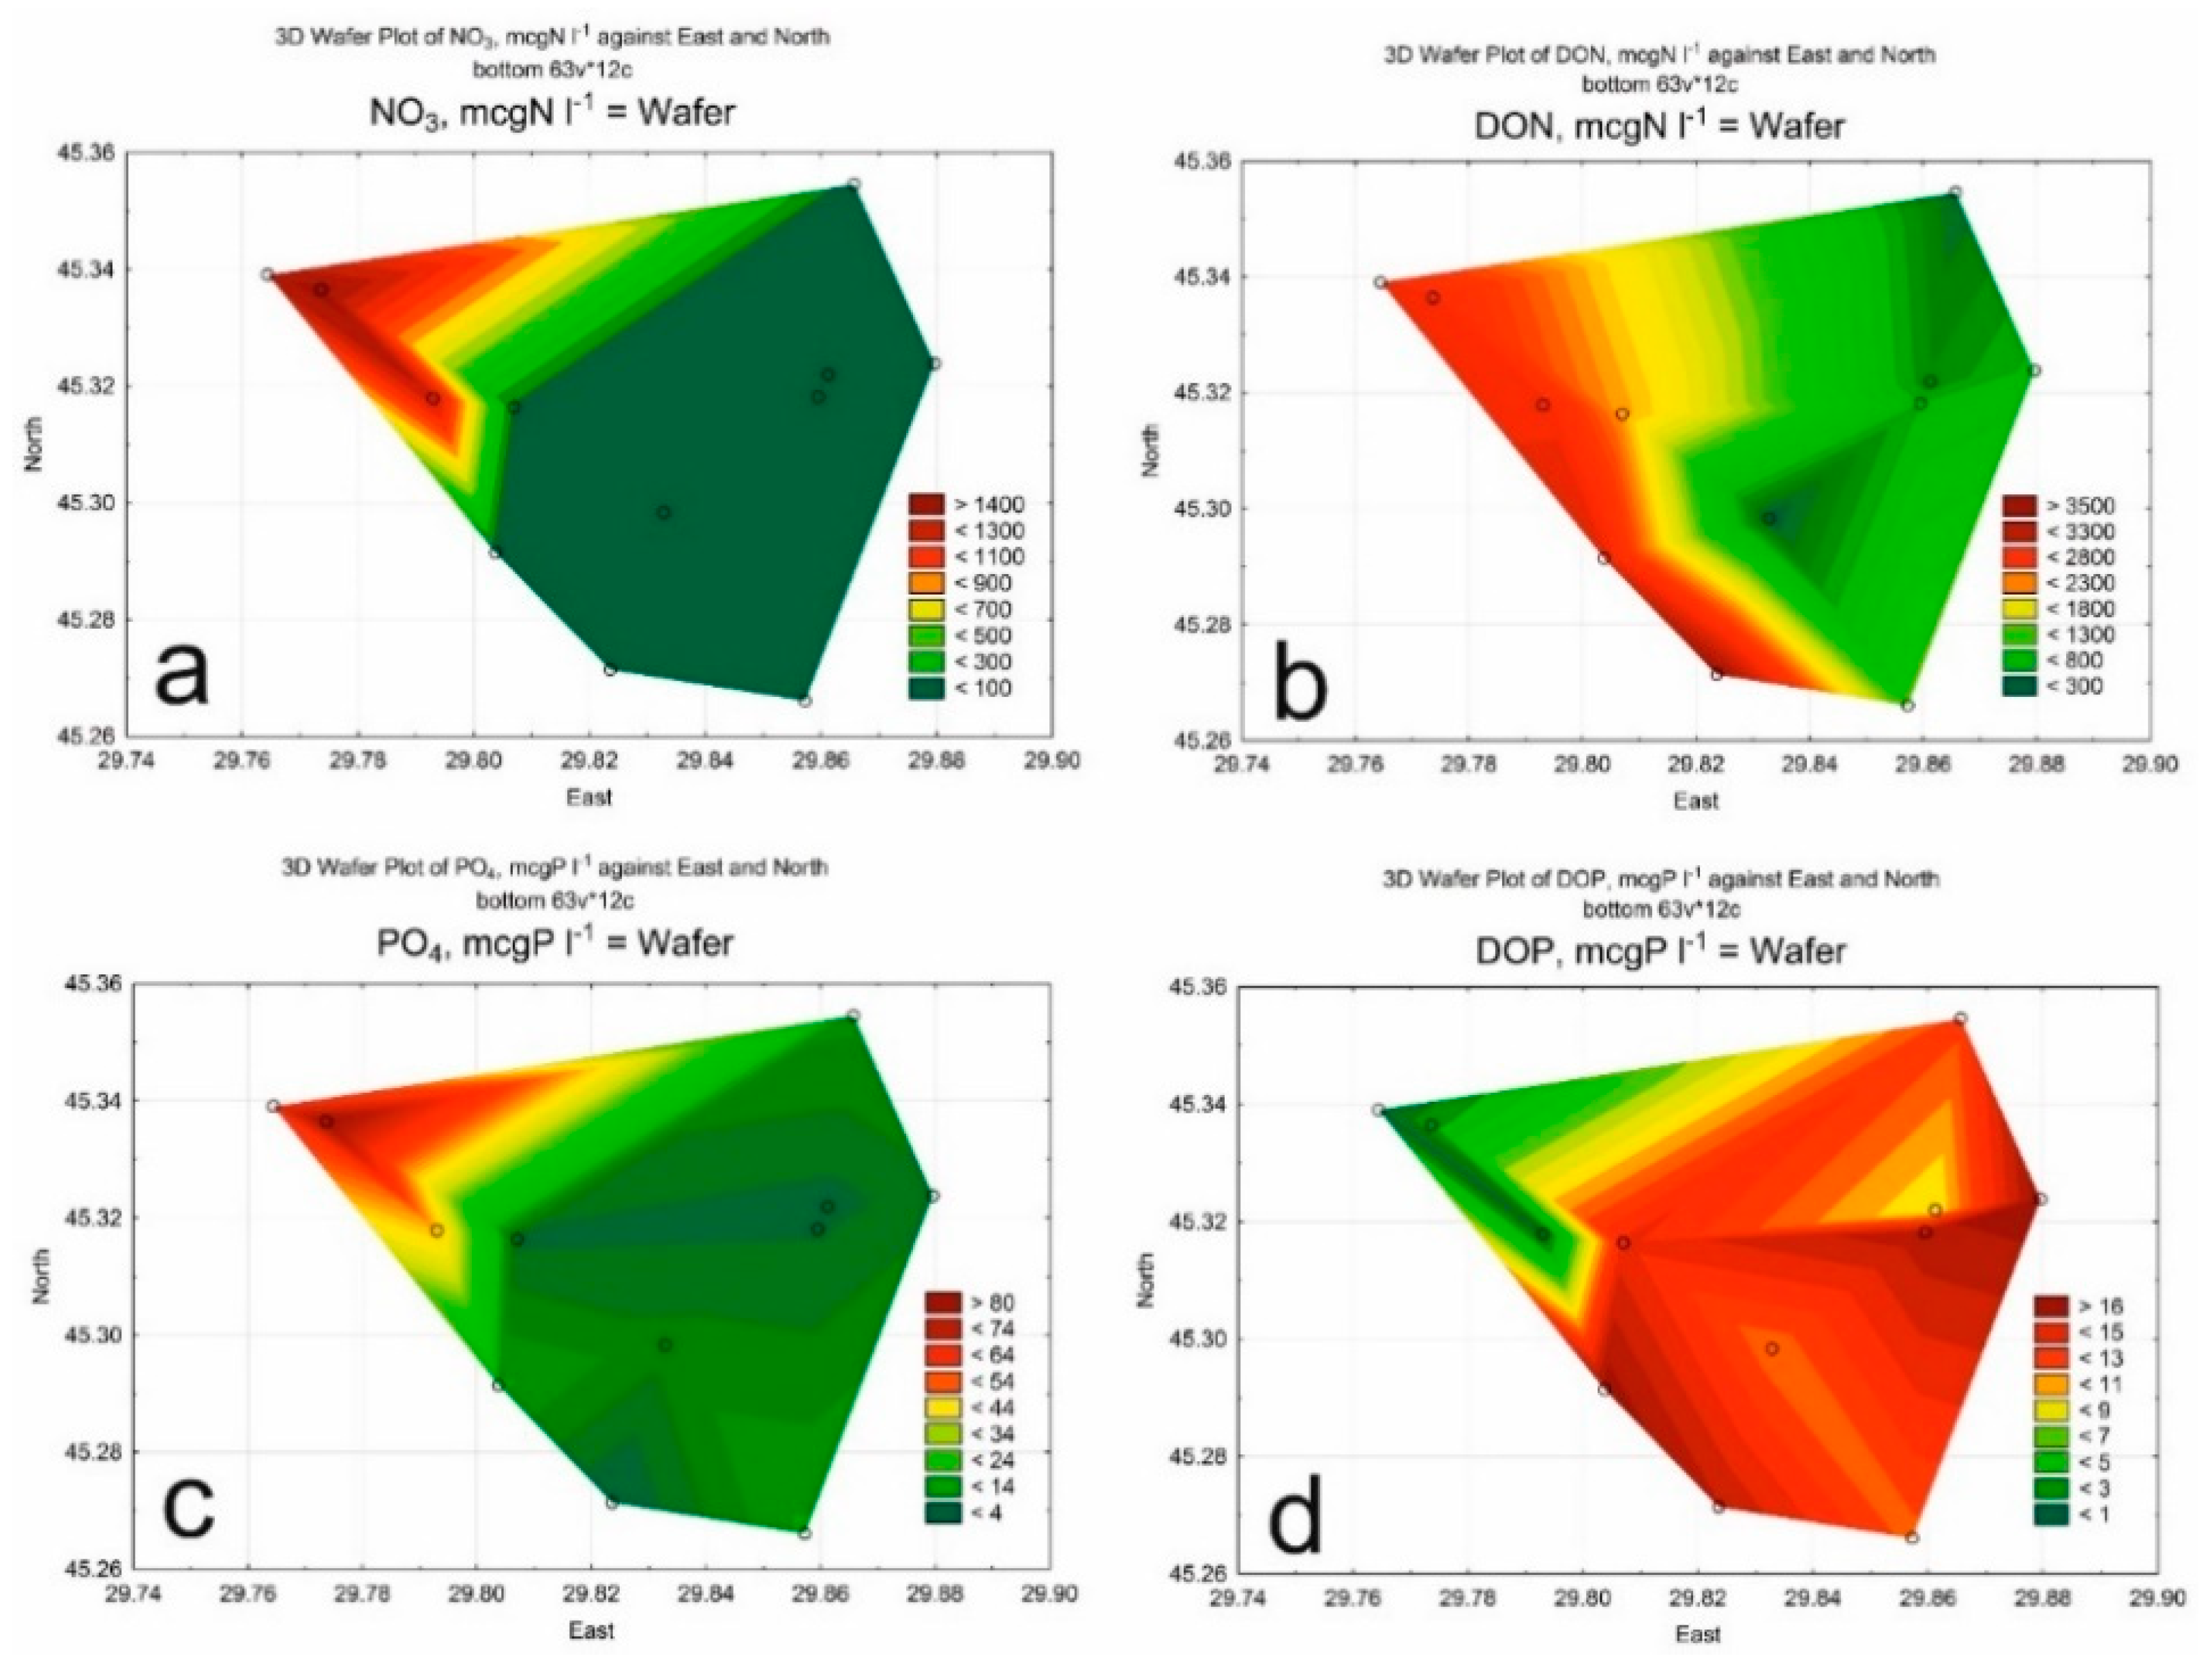
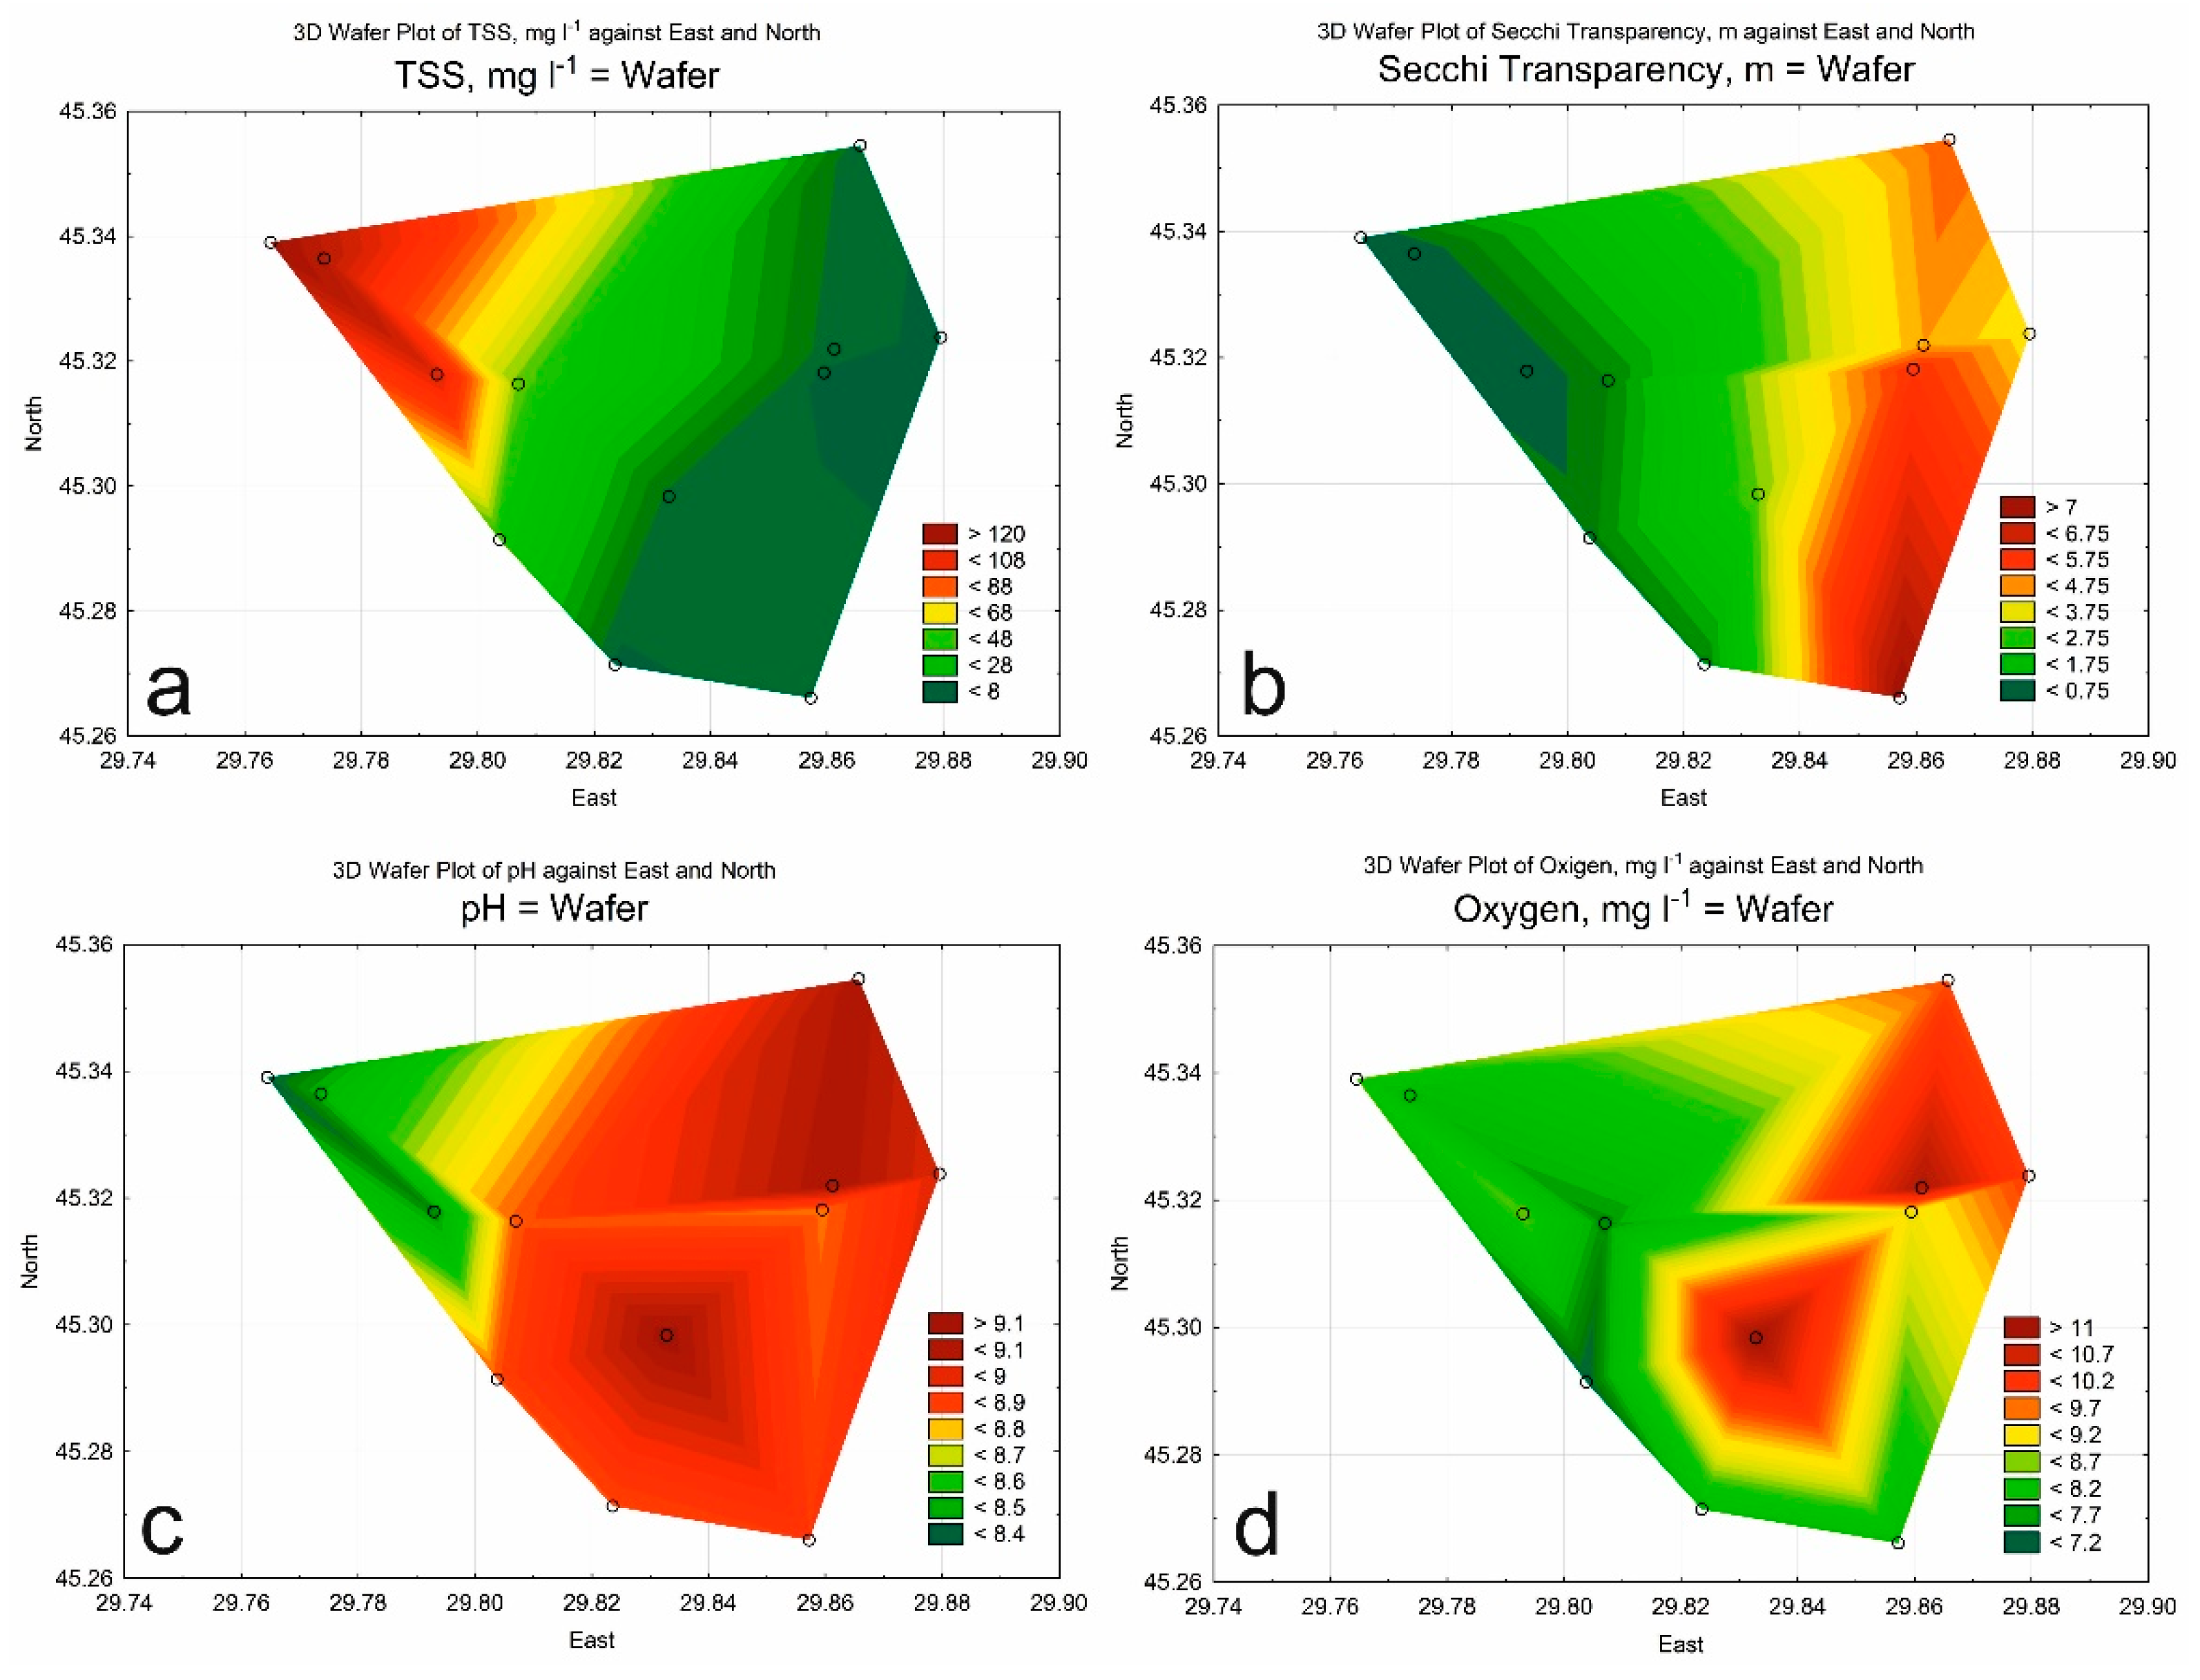
3.1. Hydrological and Hydrochemical Parameters
3.2. Phytoplankton
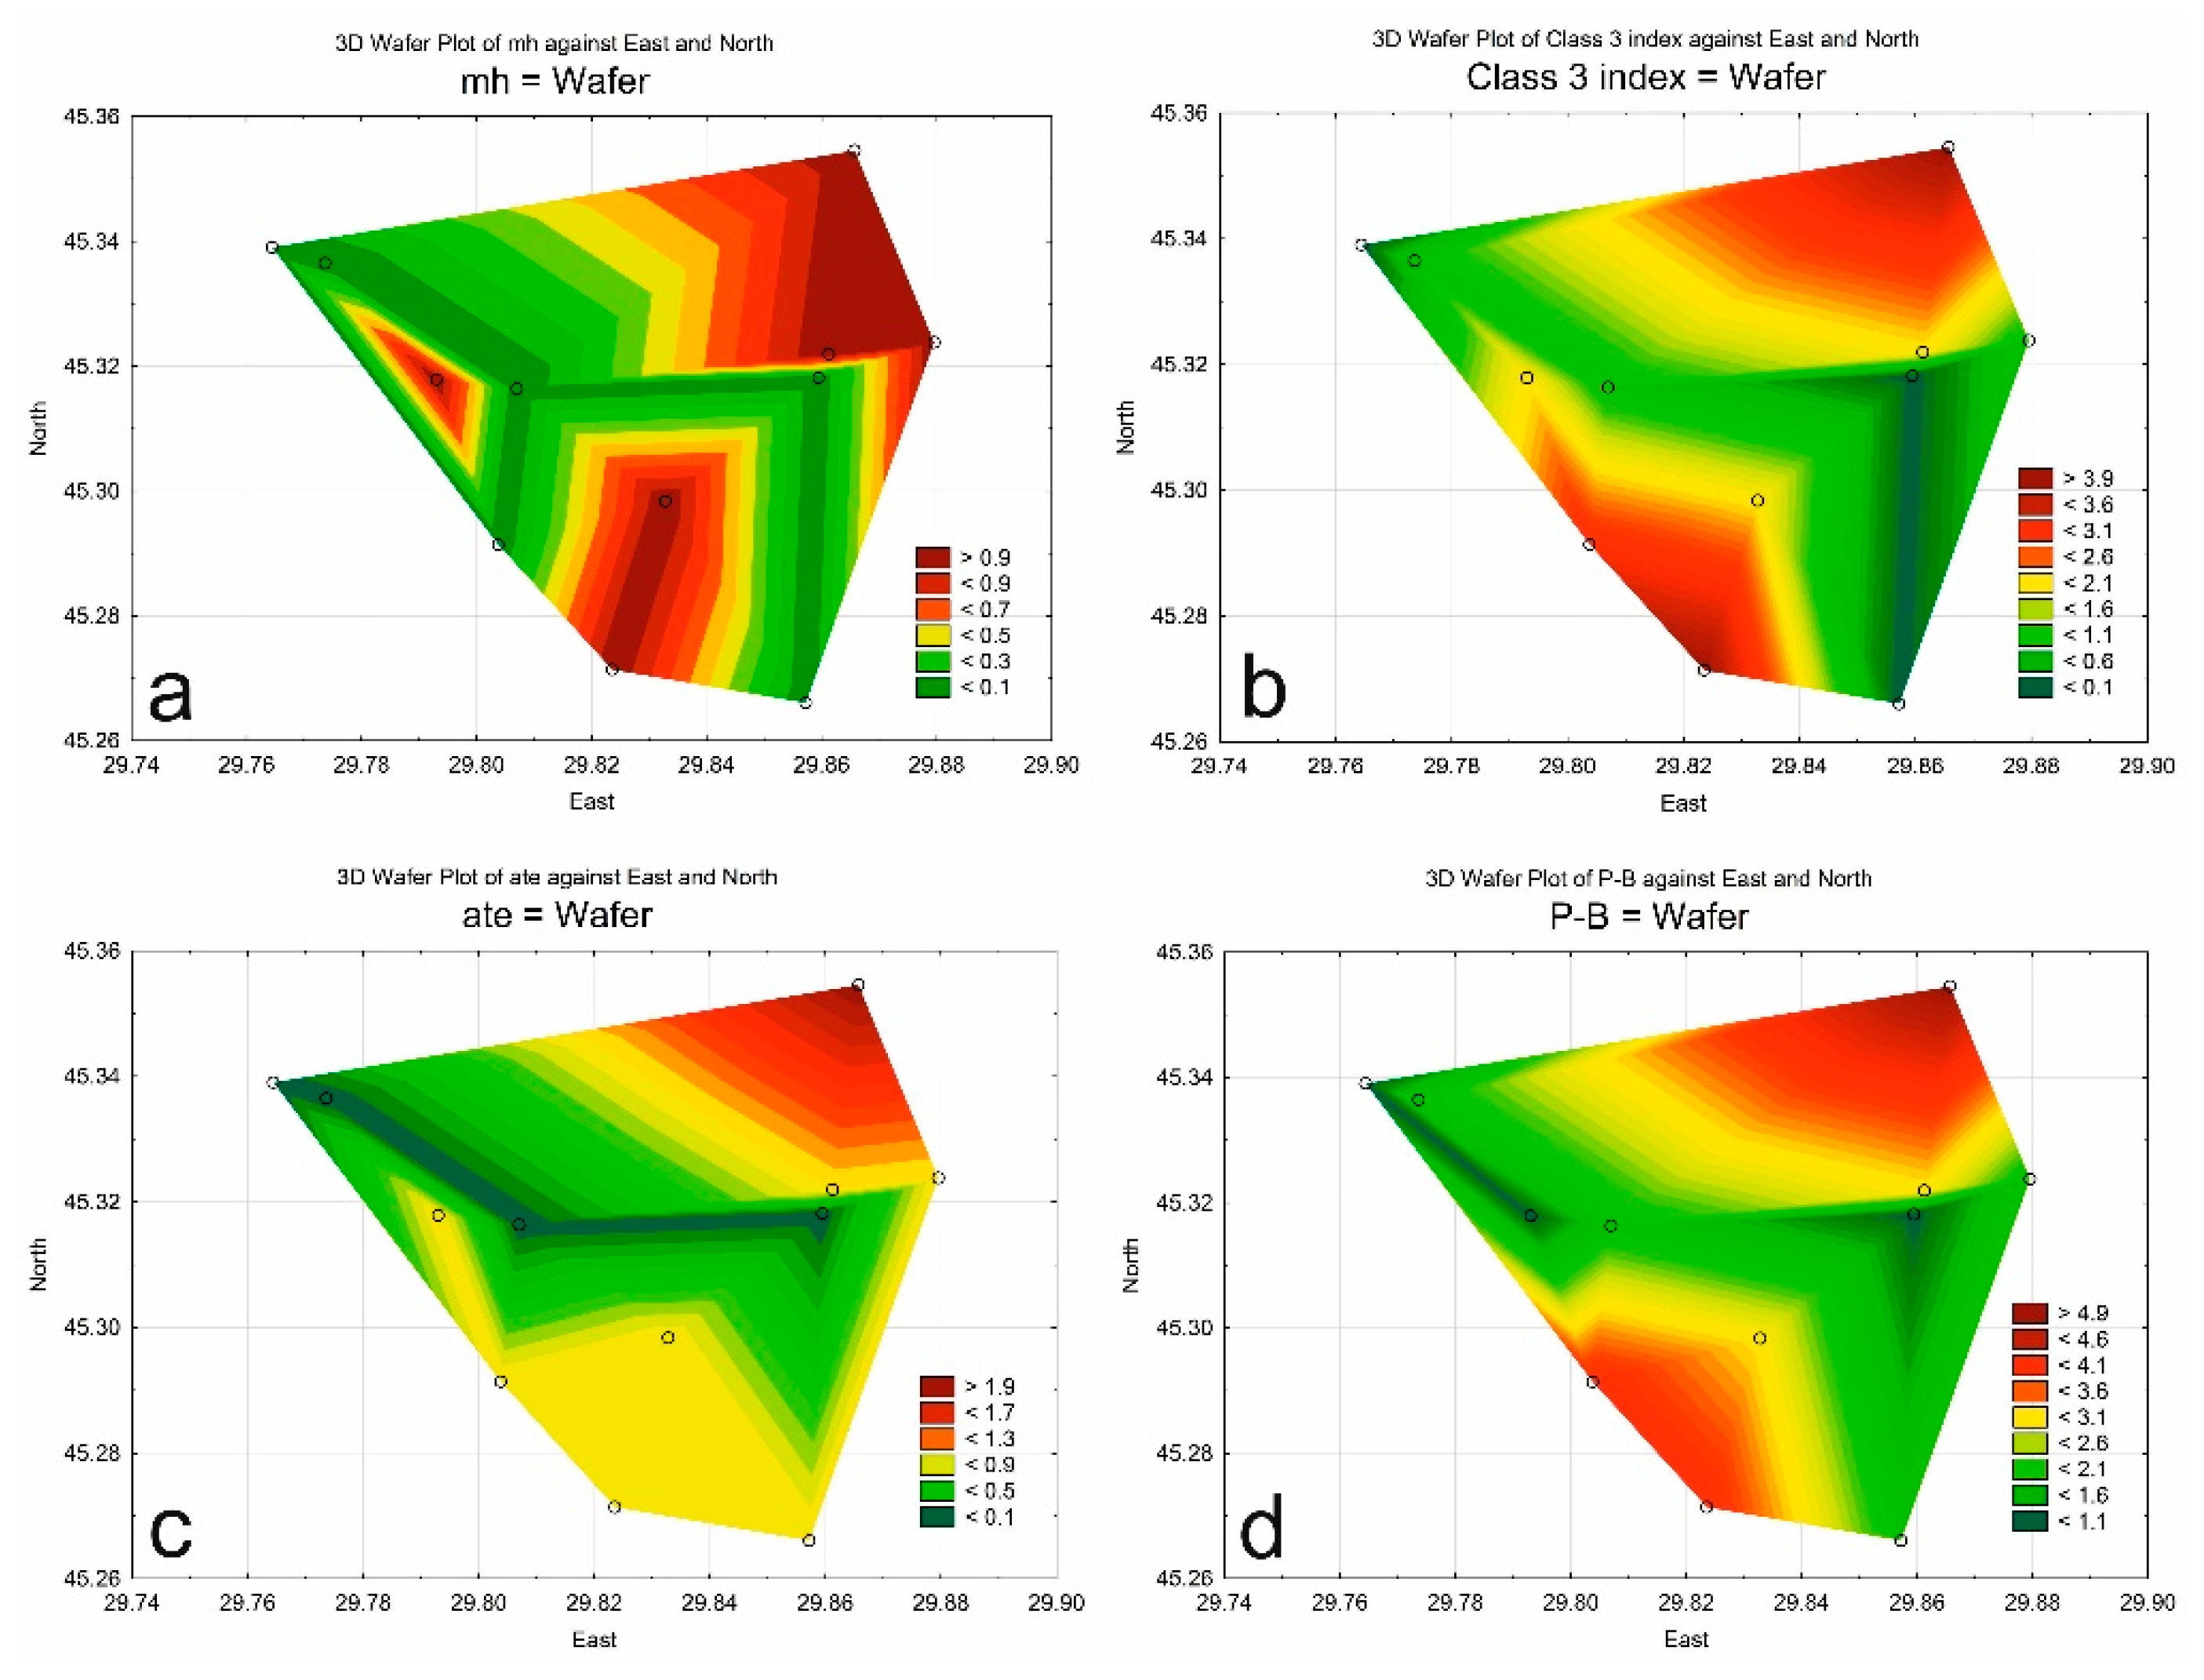
3.3. Indices
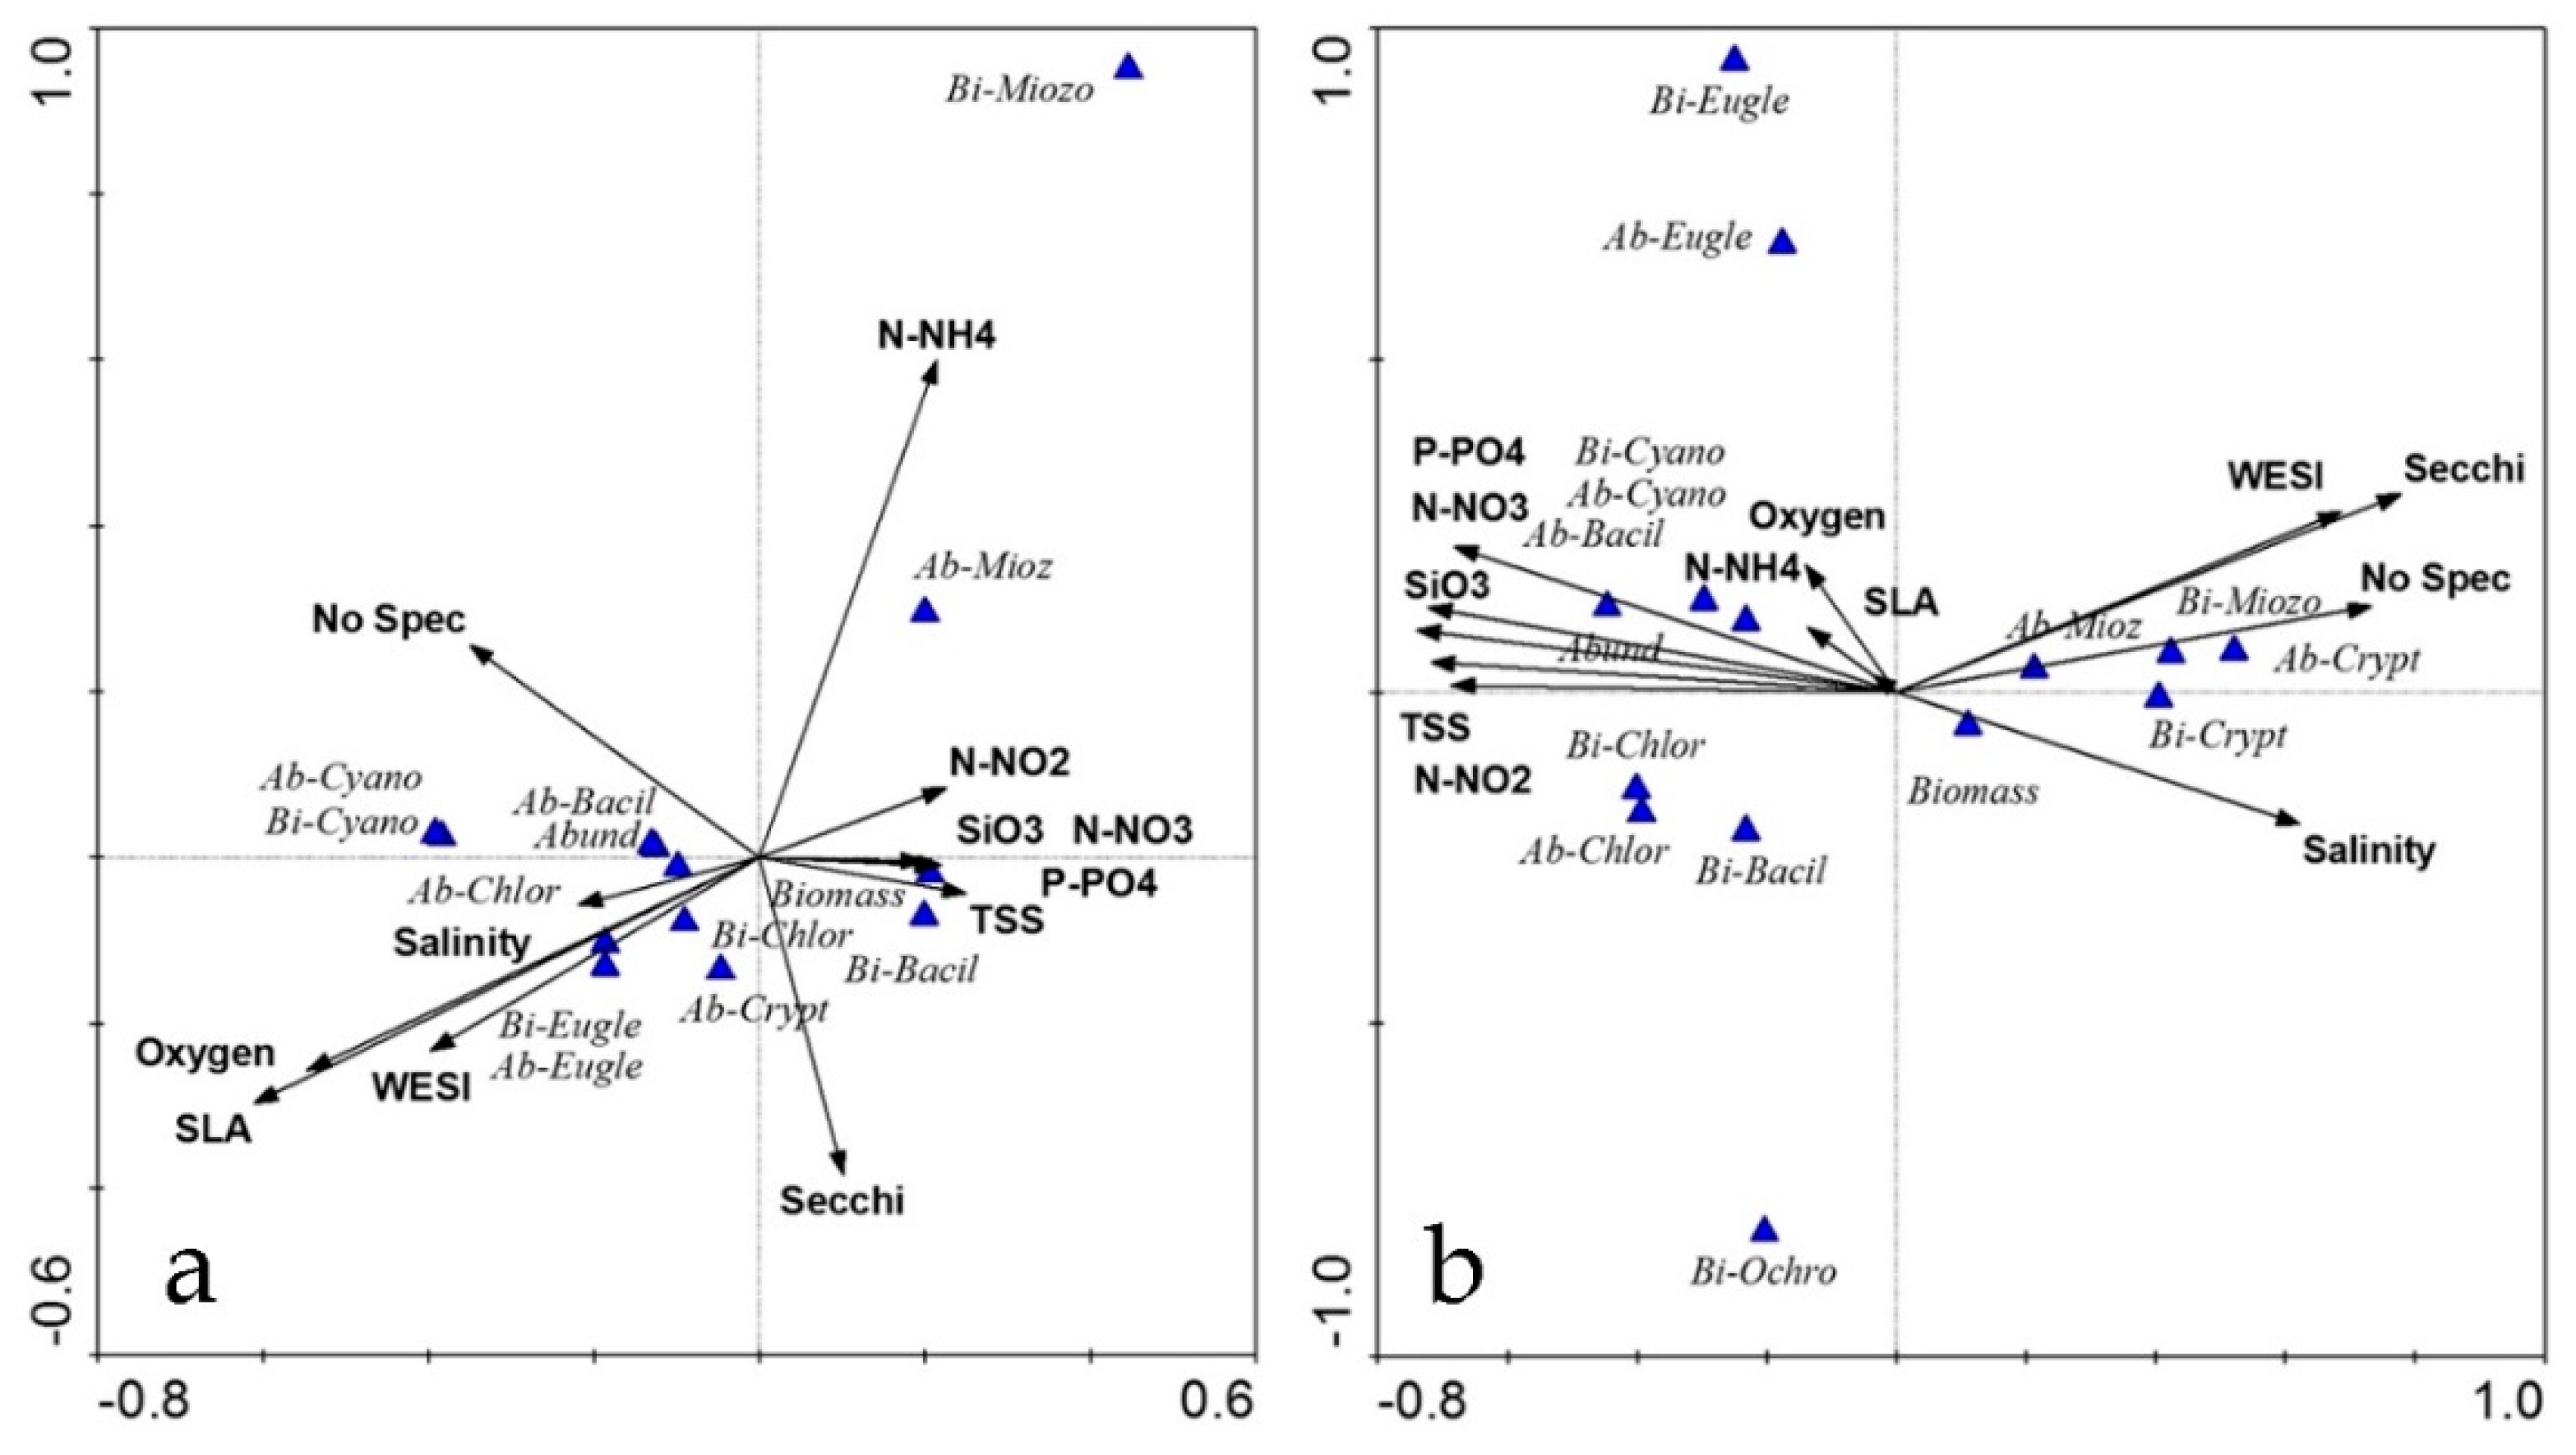
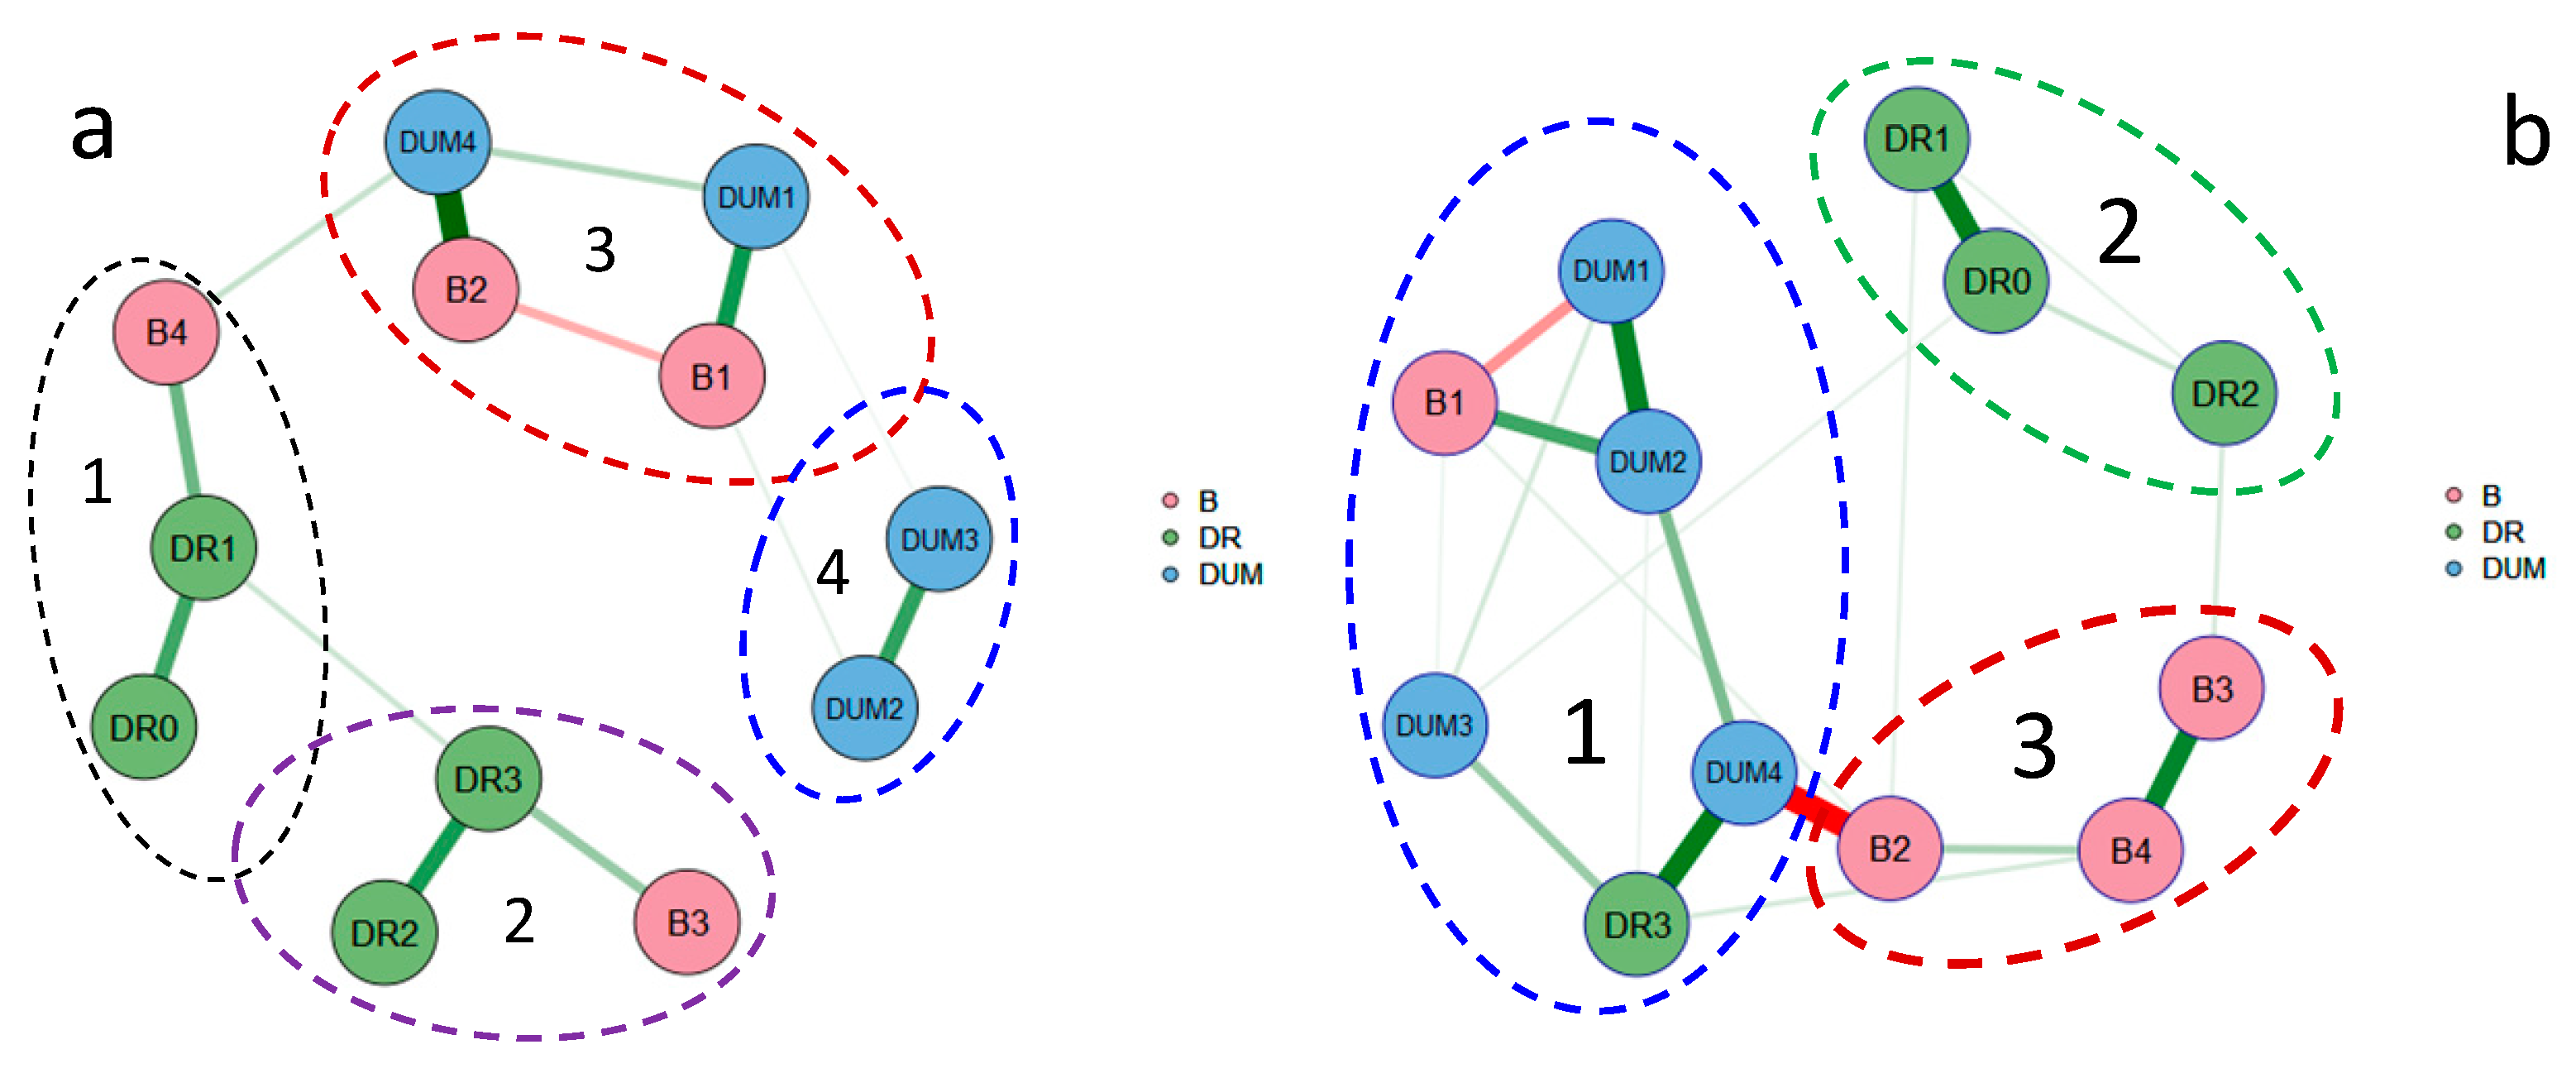
3.4. Diagrams and Clusters
4. Discussion
5. Conclusions
Author Contributions
Funding
Institutional Review Board Statement
Informed Consent Statement
Data Availability Statement
Acknowledgments
Conflicts of Interest
Appendix A

| Site | B1 | B2 | B3 | B4 | DR0 | DR1 | DR2 | DR3 | DUM1 | DUM2 | DUM3 | DUM4 |
| Surface | 1 | 2 | 3 | 4 | 5 | 6 | 7 | 8 | 9 | 10 | 11 | 12 |
| North | 45.35 | 45.27 | 45.27 | 45.29 | 45.34 | 45.34 | 45.32 | 45.32 | 45.32 | 45.32 | 45.30 | 45.32 |
| East | 29.87 | 29.86 | 29.82 | 29.80 | 29.76 | 29.77 | 29.79 | 29.81 | 29.86 | 29.88 | 29.83 | 29.86 |
| Depth, m | 21.0 | 25.0 | 19.3 | 14.0 | 6.6 | 5.5 | 4.0 | 9.8 | 19.0 | 23.0 | 19.8 | 17.2 |
| pH | 9.09 | 8.90 | 8.87 | 8.87 | 8.39 | 8.50 | 8.45 | 8.86 | 9.10 | 9.00 | 9.12 | 8.84 |
| Secchi, m | 5.0 | 7.5 | 1.0 | 0.9 | 0.5 | 0.5 | 0.5 | 1.0 | 4.5 | 4.0 | 3.0 | 5.5 |
| TSS, mg L−1 | 9.10 | 8.78 | 7.59 | 43.20 | 130.00 | 120.00 | 111.00 | 50.20 | 9.15 | 7.25 | 10.70 | 7.70 |
| Salinity,‰ | 14.88 | 16.34 | 10.53 | 8.16 | 0.17 | 0.23 | 0.34 | 7.51 | 14.55 | 16.74 | 12.22 | 16.54 |
| Oxygen, mg L−1 | 9.80 | 7.99 | 7.96 | 7.17 | 8.32 | 7.86 | 8.59 | 7.54 | 11.00 | 9.92 | 11.20 | 9.06 |
| NH4+, μg N L−1 | 0 | 0 | 0 | 53.5 | 0 | 0 | 17.6 | 0 | 25.3 | 0 | 0 | 0 |
| NO2−, μg N L−1 | 2.11 | 0.70 | 8.39 | 9.43 | 24.37 | 13.87 | 16.23 | 12.31 | 1.59 | 1.59 | 3.14 | 0.92 |
| NO3−, μg N L−1 | 16.90 | 79.50 | 31.80 | 417.00 | 1490.00 | 1390.00 | 765.00 | 477.00 | 39.20 | 22.80 | 112.00 | 1.99 |
| PO43−, μgP L−1 | 5.12 | 3.92 | 10.90 | 25.70 | 70.10 | 66.20 | 59.20 | 24.80 | 4.52 | 7.54 | 7.24 | 5.73 |
| SiO3, μg L−1 | 93 | 13 | 794 | 1060 | 2834 | 2936 | 2724 | 1189 | 103 | 93 | 252 | 64 |
| Bottom | B1 | B2 | B3 | B4 | DR0 | DR1 | DR2 | DR3 | DUM1 | DUM2 | DUM3 | DUM4 |
| pH | 8.30 | 8.33 | 8.88 | 8.81 | 8.39 | 8.44 | 8.72 | 8.83 | 8.73 | 8.32 | 8.34 | 8.70 |
| Secchi, m | 5.0 | 7.5 | 1.0 | 0.9 | 0.5 | 0.5 | 0.5 | 1.0 | 4.5 | 4.0 | 3.0 | 5.5 |
| TSS, mg L−1 | 11.80 | 10.80 | 4.16 | 53.70 | 130.00 | 116.00 | 170.00 | 14.60 | 9.33 | 16.50 | 10.30 | 8.07 |
| Salinity, ‰ | 18.02 | 18.06 | 18.06 | 17.22 | 0.23 | 0.27 | 11.21 | 16.50 | 18.13 | 18.50 | 17.90 | 17.20 |
| Oxygen, mg L−1 | 5.63 | 3.52 | 7.82 | 7.16 | 8.32 | 8.43 | 8.41 | 7.52 | 10.60 | 5.47 | 5.01 | 7.96 |
| NH4+, μg N L−1 | 15.0 | 21.1 | 15.0 | 15.0 | 15.0 | 15.0 | 15.0 | 15.0 | 15.0 | 15.0 | 15.0 | 15.0 |
| NO2−, μg N L−1 | 5.80 | 4.03 | 1.07 | 2.40 | 10.54 | 16.97 | 26.29 | 2.11 | 1.00 | 4.18 | 5.36 | 0.63 |
| NO3−, μg N L−1 | 33.80 | 19.90 | 9.93 | 39.70 | 1371.00 | 1439.00 | 1281.00 | 69.50 | 1.49 | 27.80 | 27.80 | 0.99 |
| PO43−, μgP L−1 | 10.60 | 12.40 | 3.92 | 12.40 | 63.20 | 80.40 | 46.20 | 5.73 | 5.12 | 7.24 | 8.75 | 5.73 |
| SiO3, μg L−1 | 964 | 741 | 123 | 323 | 2885 | 2936 | 1401 | 745 | 95 | 822 | 143 | 95 |
References
- Berlinsky, N.; Bogatova, Y.; Garkavaya, G. Estuary of the Danube. In Estuaries. The Handbook of Environmental Chemistry; Springer: Berlin, Germany, 2005; Volume 5H, pp. 233–264. [Google Scholar] [CrossRef]
- Bogatova, Y. Hydrochemical Regime of the Ukrainian Part of Danube Nearshore Area. Water Resour. 2013, 40, 305–314. [Google Scholar] [CrossRef]
- Bolshakov, V.S. Transformation of River Waters in the Black Sea; Naukova Dumka: Kiev, Ukraine, 1970; p. 328. (In Russian) [Google Scholar]
- Tziavos, I.N.; Alexandridis, T.; Aleksandrov, B.; Andrianopoulos, A.; Doukas, I.D.; Grigoras, I.; Grigoriadis, V.N.; Papadopoulou, I.D.; Savvaidis, P.; Stergioudis, A.; et al. Development of a Web-based GIS monitoring and environmental assessment system for the Black Sea: Application in the Danube Delta area. Environ. Monit. Assess. 2016, 188, 492. [Google Scholar] [CrossRef]
- Bondarenko, A.S. Polychaete taxocene in the seaside estuary of the Danube River. Mar. Ecol. J. 2011, 2, 11–16. (In Russian) [Google Scholar]
- Nesterova, D.A.; Terenko, L.M. Species diversity of phytoplankton in the zone of direct influence of the Danube waters. Environ. Saf. Coast. Shelf Zones Integr. Use Shelf Resour. 2007, 15, 541–555. (In Russian) [Google Scholar]
- Genkal, S.I.; Terenko, L.M.; Nesterova, D.A. New data on the flora of centric diatoms (Centrophyceae) of the Danube region of the Black Sea. Hydrobiol. J. 2009, 45, 52–72. (In Russian) [Google Scholar] [CrossRef]
- Török, L. The analysis of the information on algae and revised checklist from Danube Delta Biosphere Reserve. Sci. Ann. Danub. Delta Inst. 2009, 15, 47–66. [Google Scholar]
- Directive 2000/60/EC of the European Parliament and of the Council of 23 October 2000 establishing a framework for Community action in the field of water policy. J. Ref. OJL 2000, 327, 1–73.
- Directive 2008/56/EC of the European Parliament and of the Council of 17 June 2008 establishing a framework for community action in the field of marine environmental policy (Marine Strategy Framework Directive) (Text with EEA relevance). Off. J. Eur. Union 2008, L 164, 19–40.
- Bosso, L.; De Conno, C.; Russo, D. Modelling the risk posed by the zebra mussel Dreissena polymorpha: Italy as a case study. Environ. Manag. 2017, 60, 304–313. [Google Scholar] [CrossRef] [PubMed]
- Jha, M.K.; Shekhar, A.; Jenifer, M.A. Assessing groundwater quality for drinking water supply using hybrid fuzzy-GIS-based water quality index. Water Res. 2020, 179, 115867. [Google Scholar] [CrossRef] [PubMed]
- Barinova, S. On the Classification of Water Quality from an Ecological Point of View. Int. J. Environ. Sci. Nat. Res. 2017, 2, 555581. [Google Scholar] [CrossRef]
- Barinova, S. Ecological Mapping in Application to Aquatic Ecosystems BioIndication: Problems and Methods. Int. J. Environ. Sci. Nat. Resour. 2017, 3, 1–7. [Google Scholar] [CrossRef]
- Barinova, S.S.; Bilous, O.P.; Tsarenko, P.M. Algal Indication of Water Bodies in Ukraine: Methods and Perspectives; University of Haifa Publisher: Haifa, Israel, 2019; p. 367. [Google Scholar]
- Gasiūnaitė, Z.R.; Cardoso, A.C.; Heiskanen, A.-S.; Henriksen, P.; Kauppila, P.; Olenina, I.; Pilkaitytė, R.; Purina, I.; Razinkovas, A.; Sagert, S.; et al. Seasonality of coastal phytoplankton in the Baltic Sea: Influence of salinity and eutrophication. Estuar. Coast. Shelf Sci. 2005, 65, 239–252. [Google Scholar] [CrossRef]
- Moncheva, S.; Parr, B. Manual for phytoplankton sampling and analysis in the Black Sea. Phytoplankton Manual, UP-GRADE Black Sea Scene Project, FP7. 2010, p. 67. Available online: http://blacksea-commission.org/Downloads/Phytoplankton_%20Mannual-Final-1.pdf (accessed on 13 March 2021).
- Herrero, F.S.; Teixeira, H.; Poikane, S.A. Novel Approach for Deriving Nutrient Criteria to Support Good Ecological Status: Application to Coastal and Transitional Waters and Indications for Use. Front. Mar. Sci. 2019, 6, 255. [Google Scholar] [CrossRef]
- Lazar, L.; Boicenco, L.; Beken, C.; Dzhurova, B.; Moncheva, S.; Shtereva, G.; Vasiliu, D. Western Black Sea eutrophication status according to Black Sea eutrophication asessment tool, BEAST–MISIS cruise results. Cercet. Mar. 2015, 46, 48–60. [Google Scholar]
- Barinova, S.; Bondarenko, A.; Ryabushko, L.; Kapranov, S. Microphytobenthos as an indicator of water quality and organic pollution in the western coastal zone of the Sea of Azov. Oceanol. Hydrobiol. Stud. 2019, 48, 21–35. [Google Scholar] [CrossRef]
- Ryabushko, L.I.; Bondarenko, A.V.; Barinova, S.S. Indicator benthic microalgae in assessment of the degree of organic pollution on the example of Crimea coastal waters of the Sea of Azov. Mar. Biol. J. 2019, 4, 69–80. [Google Scholar] [CrossRef]
- Barinova, S.S.; Klochenko, P.D.; Belous Ye, P. Algae as indicators of the ecological state of water bodies: Methods and prospects. Hydrobiol. J. 2015, 51, 3–21. [Google Scholar] [CrossRef]
- Nevrova, E.L.; Snigireva, A.A.; Petrov, A.N.; Kovalova, G.V. Guidelines from Quality Control of the Black Sea. Microphytobenthos; N.Orianda: Sevastopol, Russia, 2015; p. 176. (In Russian) [Google Scholar]
- Minicheva, G.G. Use of the macrophytes’ morphofunctional parameters to assess Ecological status class in accordance with the EU WFD. Mar. Ecol. J. 2013, 3, 5–21. [Google Scholar]
- Zotov, A.B. The use of specific surface index in analyzing the morpho-structural organization of phytoplankton. Int. J. Algae 2008, 10, 379–387. [Google Scholar] [CrossRef]
- Zotov, A.B. Application of the Resource-Ratio Theory in Analyzing Structural Changes of Marine Phytoplankton Communities. Int. J. Algae 2020, 22, 7–24. [Google Scholar] [CrossRef]
- Borja, A.; Rodriguez, J.G. Problems associated with the “one-out, all-out” principle, when using multiple ecosystem components in assessing the ecological status of marine waters. Mar. Pollut. Bull. 2010, 60, 1143–1146. [Google Scholar] [CrossRef]
- Kim, H.-K.; Kwon, Y.-S.; Kim, Y.-J.; Kim, B.-H. Distribution of Epilithic Diatoms in Estuaries of the Korean Peninsula in Relation to Environmental Variables. Water 2015, 7, 6702–6718. [Google Scholar] [CrossRef]
- Barinova, S.; Bilous, O.; Ivanova, N. New Statistical Approach to Spatial Analysis of Ecosystem of the Sasyk Reservoir, Ukraine. Int. J. Ecotoxicol. Ecobiol. 2016, 1, 118–126. [Google Scholar] [CrossRef]
- Bilous, O.P.; Barinova, S.S.; Ivanova, N.O.; Huliaieva, O.A. The use of phytoplankton as an indicator of internal hydrodynamics of a large seaside reservoir-case of the Sasyk Reservoir, Ukraine. Ecohydrol. Hydrobiol. 2016, 16, 160–174. [Google Scholar] [CrossRef]
- Barinova, S. Essential and practical bioindication methods and systems for the water quality assessment. Int. J. Environ. Sci. Nat. Resour. 2017, 2, 1–11. [Google Scholar] [CrossRef]
- Ryabushko, L.; Lishaev, D.; Kovrigina, N. Species Diversity of Epilithon Diatoms and the Quality of the Waters of the Donuzlav Gulf Ecosystem (Crimea, the Black Sea). Diversity 2019, 11, 114. [Google Scholar] [CrossRef]
- Guidelines on Chemical Analysis of the Marine Waters; Hydrometeoizdat: Saint-Petersberg, Russia, 1993; p. 263. (In Russian)
- Olenina, I.; Hajdu, S.; Edler, L.; Andersson, A.; Wasmund, N.; Busch, S.; Göbel, J.; Gromisz, S.; Huseby, S.; Huttunen, M.; et al. Biovolumes and size-classes of phytoplankton in the Baltic Sea. In Baltic Sea Environmental Proceedings; No 106; Helsinki Commision: Washington, DC, USA, 2006; pp. 1–144. [Google Scholar]
- Tsarenko, P.M. Brief Guide to Chlorococcal Algae of the Ukrainian SSR; Palamar-Mordvintseva, G.M., Ed.; N.G. Kholodny Institute of Botany of USSR Academy of Sciences; Naukova Dumka: Kyiv, Ukraine, 1990; p. 208. (In Russian) [Google Scholar]
- Tomas, C.R. Identifying Marine Plankton; Academic Press: Cambridge, MA, USA, 1997; p. 858. [Google Scholar]
- Hoppenrath, M.; Elbrachter, M.; Drebes, G. Marine Phytoplankton. Selected Microphytoplankton Species from the North Sea around Helgoland and Sylt; Kleine Senckenberg-Reihe: Frankfurt, Germany, 2009; p. 264. [Google Scholar]
- Krakhmalnyi, A.F. Dinophyte algae of Ukraine (Illustrated Guide); Tsarenko, P.M., Ed.; Alterpres: Kiev, Ukraine, 2010; p. 444. (In Russian) [Google Scholar]
- Guiry, M.D.; Guiry, G.M. AlgaeBase. World-Wide Electronic Publication. National University of Ireland, Galway. Available online: http://www.algaebase.org (accessed on 24 September 2020).
- Sládeček, V. System of Water Quality from the Biological Point of View. Arch. Hydrobiol. 1973, 7, 218. [Google Scholar]
- Sládeček, V. Diatoms as indicators of organic pollution. Acta Hydroch. Hydrobiol. 1986, 14, 555–566. [Google Scholar] [CrossRef]
- Ter Braak, C.J.F.; Šmilauer, P. CANOCO Reference Manual and CanoDraw for Windows User’s Guide: Software for Canonical Community Ordination (Version 4.5); Microcomputer Power Press: Ithaca, NY, USA, 2002; p. 500. [Google Scholar]
- Love, J.; Selker, R.; Marsman, M.; Jamil, T.; Dropmann, D.; Verhagen, A.J.; Ly, A.; Gronau, Q.F.; Smira, M.; Epskamp, S.; et al. JASP: Graphical statistical software for common statistical designs. J. Stat. Softw. 2019, 88, 1–17. [Google Scholar] [CrossRef]
- Dedić, A.; Gerhardt, A.; Kelly, M.G.; Stanić-Koštroman, S.; Šiljeg, M.; Kalamujić Stroil, B.; Kamberović, J.; Mateljak, Z.; Pešić, V.; Vučković, I.; et al. Innovative methods and approaches for WFD: Ideas to fill knowledge gaps in science and policy. Water Solut. 2020, 3, 30–42. [Google Scholar]
- Nędzarek, A. Sources, diversity and circulation of biogenic compounds in Admiralty Bay, King George Island, Antarctica. Antarct. Sci. 2008, 20, 135–145. [Google Scholar] [CrossRef]
- Armstrong, N.E.; Hinson, M.O., Jr.; Collins, J.H.; Fruh, E.G. Biochemical Cycling of Carbon, Nitrogen, and Phosphorus in Saltwater Marshes of Lavaca Bay, Texas; Final Report to the Texas Water Development Board, 24 January, 1975; Center for Research in Water Resources, The University of Texas at Austin: Austin, TX, USA, 1975; p. 316. [Google Scholar]
- Hensen, C.; Zabel, M.; Schulz, H.N. Early Diagenesis at the Benthic Boundary Layer: Oxygen, Nitrogen, and Phosphorus in Marine Sediments. In Marine Geochemistry; Schulz, H.D., Zabel, M., Eds.; Springer: Berlin/Heidelberg, Germany, 2006; pp. 207–240. [Google Scholar] [CrossRef]
- Redfield, A.C. The biological control of Chemical Factors in the environment. Am. Sci. 1958, 46, 205–221. [Google Scholar]
- Macias, D.; Huertas, I.E.; Garcia-Gorriz, E.; Stips, A. Non-Redfieldian dynamics driven by phytoplankton phosphate frugality explain nutrient and chlorophyll patterns in model simulations for the Mediterranean Sea. Prog. Oceanogr. 2019, 173, 37–50. [Google Scholar] [CrossRef]
- Fransner, F.; Gustafsson, E.; Tedesco, L.; Vichi, M.; Hordoir, R.; Roquet, F.; Nycander, J. Non-Redfieldian dynamics explain seasonal pCO2 drawdown in the Gulf of Bothnia. J. Geophys. Res. Ocean. 2018, 123, 166–188. [Google Scholar] [CrossRef]
- Popa, G.-O.; Curtean-Bănăduc, A.; Bănăduc, D.; Florescu, I.E.; Burcea, A.; Dudu, A.; Georgescu, S.E.; Costache, M. Molecular Markers Reveal Reduced Genetic Diversity in Romanian Populations of Brown Trout, Salmo trutta L., 1758 (Salmonidae). Acta Zool. Bulg. 2016, 68, 399–406. [Google Scholar]
- El-Sherbiny, M.M.; Aamer, M.A.; Gab-Alla Ali, A.-F.A. Effect of Dredging and Dumping Operations on Zooplankton Community During the Construction of East Branch Harbor, Port Said, Eastern Mediterranean, Egypt. Catrina 2006, 1, 53–62. [Google Scholar]
- ICES. Effects of Extraction of Marine Sediments on Fisheries; Report No. 182; ICES: Burnaby, BC, Canada, 1992. [Google Scholar]
- Iannuzzi, T.J.; Weinstein, M.P.; Sellner, K.G.; Barrett, J.C. Habitat disturbance and marina development: An assessment of ecological effects. Changes in primary production due to dredging and marina construction. Estuaries 1996, 19, 257–271. [Google Scholar] [CrossRef]
- Snigirova, A. Benthic microalgae under the influence of beach nourishment in the Gulf of Odessa (the Black Sea). Bot. Lith. 2013, 19, 120–128. [Google Scholar] [CrossRef]
- Berthold, M.; Karsten, U.; von Weber, M.; Bachor, A.; Schumann, R. Phytoplankton can bypass nutrient reductions in eutrophic coastal water bodies. Ambio 2018, 47, 146–158. [Google Scholar] [CrossRef] [PubMed]


| Class of Water Quality | Saprobity Index (S) | Water Quality |
|---|---|---|
| I | 0–0.5 | Very good |
| II | 0.5–1.5 | Good |
| III | 1.5–2.5 | Fair |
| IV | 2.5–3.5 | Fairly poor |
| V | 3.5–4.0 | Poor |
| VI | >4.0 | Very poor |
| Region | Horizon | Depth, m | S, ‰ | DIN | NT | DIP | PT | NT:PT |
|---|---|---|---|---|---|---|---|---|
| μgN L−1 | μgP L−1 | |||||||
| Drainage area (DR) | Surface | 0 | 2.7 | 910 | 3000 | 50.1 | 64.8 | 46:1 |
| Bottom | 6.4 | 9.3 | 960 | 3600 | 44.1 | 50.0 | 72:1 | |
| Dumping area (DUM) | Surface | 0 | 15 | 63 | 760 | 6.3 | 22.4 | 34:1 |
| Bottom | 20 | 17.9 | 32 | 550 | 6.7 | 20.4 | 27:1 | |
| Background area (B) | Surface | 0 | 12.5 | 170 | 1400 | 11.4 | 30.0 | 47:1 |
| Bottom | 20.2 | 17.8 | 42 | 1900 | 12.0 | 27.0 | 70:1 | |
| Average | Surface | - | - | 380 | 1720 | 22.6 | 38.8 | 44:1 |
| Bottom | - | - | 345 | 2017 | 21.0 | 32.5 | 62:1 | |
| Taxa | Surf | Bott | Hab | Halob | Sap | SLA |
|---|---|---|---|---|---|---|
| Bacillariophyta | ||||||
| Actinocyclus normanii (W.Gregory ex Greville) Hustedt 1957 | 1 | 1 | P | mh | b | 2.3 |
| Aulacoseira islandica (O.Müller) Simonsen, 1979 | 1 | 0 | P-B | i | b-o | 1.6 |
| Cyclotella caspia Grunow 1878 | 1 | 1 | P | eu | - | - |
| Cyclotella meneghiniana Kützing, 1844 | 1 | 1 | P-B | hl | a-o | 2.8 |
| Lauderia confervacea Cleve, 1896 | 1 | 0 | P | eu | - | - |
| Diatoma tenuis C.A. Agardh, 1812 | 1 | 1 | P-B | hl | o | 1.3 |
| Leptocylindrus danicus P.T. Cleve, 1889 | 0 | 1 | P | eu | - | - |
| Melosira moniliformis (O.F. Müller) C. Agardh, 1824 | 1 | 0 | P-B | hl | b | 2 |
| Navicula cryptocephala Kützing, 1844 | 0 | 1 | P-B | i | b | 2.1 |
| Pantocsekiella kuetzingiana (Thwaites) K.T.Kiss and E.Ács | 1 | 1 | P-B | i | b | 2.1 |
| Proboscia alata (Brightwell) Sundström, 1986 | 1 | 1 | P | eu | - | - |
| Pseudo-nitzschia pseudodelicatissima (G.R. Hasle) G.R. Hasle 1993 | 1 | 1 | P | eu | - | - |
| Pseudosolenia calcar-avis (Schultze) B.G.Sundström, 1986 | 1 | 1 | P | eu | - | - |
| Skeletonema costatum (Greville) P.T. Cleve, 1878 | 1 | 1 | P | eu | - | - |
| Skeletonema subsalsum (A.Cleve) Bethge, 1928 | 0 | 1 | P | eu | - | - |
| Tabularia fasciculata (C.Agardh) D.M.Williams and Round, 1986 | 1 | 1 | P-B | mh | b-a | 2.5 |
| Miozoa | ||||||
| Prorocentrum balticum (Lohmann, 1908) Loeblich, 1970 | 1 | 0 | P | eu | - | - |
| Prorocentrum cordatum (Ostenfeld, 1901) Dodge, 1975 | 1 | 1 | P | eu | - | - |
| Prorocentrum micans Ehrenberg, 1834 | 1 | 1 | P | eu | - | - |
| Prorocentrum lima (Ehrenberg, 1860) Stein, 1975 | 1 | 1 | P | eu | - | - |
| Protoperidinium divergens (Ehrenberg, 1841) Balech, 1974 | 1 | 1 | P | eu | - | - |
| Scrippsiella aqcuminata (Ehrenberg) Kretschmann, Elbrächter, Zinssmeister, S.Soehner, Kirsch, Kusber and Gottschling 2015 | 1 | 0 | P | eu | - | - |
| Tripos furca (Ehrenberg) F.Gómez, 2013 | 1 | 1 | P | eu | - | - |
| Tripos fusus (Ehrenberg) F.Gómez, 2013 | 0 | 1 | P | eu | - | - |
| Chlorophyta | ||||||
| Actinastrum hantzschii Lagerheim, 1882 | 0 | 1 | P-B | i | b | 2.3 |
| Kirchneriella lunaris (Kirchner) K. Möbius, 1894 | 1 | 0 | P-B | i | o-a | 1.8 |
| Monactinus simplex (Meyen) Corda 1839 | 1 | 0 | P-B | - | b | 2 |
| Monoraphidium arcuatum (Korshikov) Hindák, 1970 | 1 | 1 | P-B | i | b | 2.1 |
| Monoraphidium contortum (Thuret) Komárková-Legnerová 1969 | 0 | 1 | P-B | i | b | 2.2 |
| Monoraphidium griffithii (Berkeley) Komárková-Legnerová, 1969 | 0 | 1 | P-B | i | b | 2.2 |
| Monoraphidium minutum (Nägeli) Komárková-legnerová 1969 | 1 | 0 | P-B | i | b-a | 2.5 |
| Cryptophyta | ||||||
| Cryptomonas erosa Ehrenberg, 1832 | 0 | 1 | P | - | b | 2.3 |
| Hillea fusiformis (J.Schiller) J.Schiller 1925 | 0 | 1 | P | eu | - | - |
| Cyanobacteria | ||||||
| Jaaginema kisselevii (Anissimova) Anagnostidis and Komárek, 1988 | 1 | 0 | P-B | mh | - | - |
| Phormidium nigroviride (Thwaites ex Gomont) Anagnostidis, Komárek, 1988 | 0 | 1 | P-B | eu | - | - |
| Site | Surface | Bottom | ||||||
|---|---|---|---|---|---|---|---|---|
| Abundance, 103 cells L−1 | Biomass, mg m−3 | Index Saprobity SLA | Index WESI | Abundance, 103 cells L−1 | Biomass, mg m−3 | Index Saprobity SLA | Index WESI | |
| B1 | 2591.62 | 966.31 | 2.32 | 5.00 | 101.35 | 333.93 | - * | - |
| B2 | 150.53 | 1700.56 | 1.80 | 4.00 | 86.96 | 45.02 | - | - |
| B3 | 672.04 | 162.60 | 2.03 | 5.00 | 69.84 | 209.00 | 2.25 | 5.00 |
| B4 | 936.28 | 1147.21 | 1.69 | 1.33 | 59.47 | 175.00 | 2.10 | 5.00 |
| Average | 1087.62 | 994.17 | 1.96 | 3.83 | 79.41 | 190.74 | 2.18 | 5.00 |
| DR0 | 263.77 | 279.02 | 2.80 | 1.20 | 597.32 | 656.07 | 2.80 | 1.20 |
| DR1 | 1724.56 | 1015.96 | 2.75 | 1.20 | 663.99 | 365.27 | 2.32 | 1.00 |
| DR2 | 702.39 | 1161.06 | 2.20 | 1.25 | 554.46 | 497.07 | 2.53 | 1.20 |
| DR3 | 324.26 | 125.13 | 2.45 | 1.67 | 141.79 | 899.67 | 2.10 | 1.25 |
| Average | 753.75 | 645.29 | 2.55 | 1.33 | 489.39 | 604.52 | 2.44 | 1.16 |
| DUM1 | 6683.35 | 3342.33 | 2.78 | 6.00 | 278.97 | 195.12 | 1.66 | 4.00 |
| DUM2 | 4302.36 | 1031.39 | 2.75 | 6.00 | 310.86 | 508.79 | 2.61 | 6.00 |
| DUM3 | 2288.47 | 995.41 | 2.76 | 3.00 | 53.44 | 101.01 | 2.50 | 5.00 |
| DUM4 | 793.99 | 1177.15 | 2.80 | 6.00 | 332.71 | 2764.94 | 2.43 | 5.00 |
| Average | 3517.04 | 1636.57 | 2.77 | 5.25 | 244.00 | 892.47 | 2.30 | 5.00 |
| Sites | B1 | B2 | B3 | B4 | DR0 | DR1 | DR2 | DR3 | DUM1 | DUM2 | DUM3 | DUM4 | Total |
|---|---|---|---|---|---|---|---|---|---|---|---|---|---|
| Surface | |||||||||||||
| Class 2 | 1 | 1 | 0 | 0 | 0 | 0 | 0 | 0 | 0 | 0 | 0 | 0 | 2 |
| Class 3 | 4 | 0 | 4 | 3 | 0 | 1 | 2 | 1 | 0 | 1 | 2 | 0 | 18 |
| Class 4 | 0 | 1 | 0 | 1 | 1 | 1 | 0 | 1 | 0 | 1 | 1 | 1 | 8 |
| Bottom | |||||||||||||
| Class 2 | 0 | 0 | 0 | 0 | 0 | 0 | 0 | 0 | 1 | 0 | 0 | 0 | 1 |
| Class 3 | 0 | 0 | 2 | 1 | 0 | 4 | 3 | 1 | 1 | 1 | 1 | 1 | 15 |
| Class 4 | 0 | 0 | 0 | 0 | 1 | 1 | 1 | 0 | 1 | 1 | 0 | 1 | 6 |
Publisher’s Note: MDPI stays neutral with regard to jurisdictional claims in published maps and institutional affiliations. |
© 2021 by the authors. Licensee MDPI, Basel, Switzerland. This article is an open access article distributed under the terms and conditions of the Creative Commons Attribution (CC BY) license (http://creativecommons.org/licenses/by/4.0/).
Share and Cite
Snigirova, A.; Bogatova, Y.; Barinova, S. Assessment of River-Sea Interaction in the Danube Nearshore Area (Ukraine) by Bioindicators and Statistical Mapping. Land 2021, 10, 310. https://doi.org/10.3390/land10030310
Snigirova A, Bogatova Y, Barinova S. Assessment of River-Sea Interaction in the Danube Nearshore Area (Ukraine) by Bioindicators and Statistical Mapping. Land. 2021; 10(3):310. https://doi.org/10.3390/land10030310
Chicago/Turabian StyleSnigirova, Anastasiia, Yuliya Bogatova, and Sophia Barinova. 2021. "Assessment of River-Sea Interaction in the Danube Nearshore Area (Ukraine) by Bioindicators and Statistical Mapping" Land 10, no. 3: 310. https://doi.org/10.3390/land10030310
APA StyleSnigirova, A., Bogatova, Y., & Barinova, S. (2021). Assessment of River-Sea Interaction in the Danube Nearshore Area (Ukraine) by Bioindicators and Statistical Mapping. Land, 10(3), 310. https://doi.org/10.3390/land10030310