Article

Bioengineering Solution to Prevent Rainfall-Induced Slope Failures in Tropical Soil

by
Ujwalkumar Dashrath Patil
1,*,
Austin J. Shelton III
2 and
Edriel Aquino
1
1
Department of Civil Engineering, School of Engineering, University of Guam, Mangilao 96923, Guam
2
Center for Island Sustainability and Sea Grant, University of Guam, Mangilao 96923, Guam
*
Author to whom correspondence should be addressed.
Land 2021, 10(3), 299; https://doi.org/10.3390/land10030299
Submission received: 5 January 2021 / Revised: 9 March 2021 / Accepted: 9 March 2021 / Published: 15 March 2021

Abstract

:
This paper presents test results of comprehensive laboratory and field-testing program efforts for the development of bioengineering solutions such as growing vegetation for protection of slopes from erosion and landslides in a tropical environmental setting. Saturated shear strength of soil was determined using direct shear tests and unsaturated soil properties, such as soil water retention curve (SWRC), were obtained using a computer-controlled hydraulic property analyzer (HYROP) system as well as a WP4C instrument. Climate data were obtained via field instrumentation and appropriate vegetation data were assumed to perform a finite element method-based transient seepage analysis and coupled slope stability analysis to test the potential of tropical hillslope to fail with and without vegetation over a period of one month. Results show that the factor of safety (FOS) for test slope considering case (a) the rainfall and bare ground, case (b) no rainfall with vegetation, and case (c) rainfall with vegetation were found to be 1.630, 1.763, and 1.650, respectively. Although FOS is marginally improved during storm events due to consideration of vegetation as compared to bare slope, this improvement in FOS is much pronounced during antecedent rainfall (i.e., long duration and small intensity) up to the first 26 days of analysis before the storm event (i.e., high intensity and short duration rainfall), which occurs on 27th day and can be instrumental in preventing slope failures. Similarly, the negative pore water pressure (i.e., matric suction) in the top layer is reduced for case (a) from −260 kPa to −40 kPa, increased for case (b) from −260 kPa to −320 kPa, and decreased for case (c) from −260 kPa to −60 kPa. The practical application of these findings is more applicable to the engineered slopes with vegetation during the dry season when the slope is more stable due to high FOS which, however, will need careful watering just to keep them healthy but prevent complete loss of developed matric suction resulting from root water uptake (RWU). In addition, the small improvement in FOS due to matric suction induced from RWU could play a key role in keeping the slope just stable during extreme storm events especially, when FOS of the bare slope is close to 1. To the best knowledge of the authors this is the first documented geotechnical study, using the tropical soil of Guam, which considers the hydro-mechanical effect of RWU-induced matric suction in slope stability analysis in a tropical setting.

1. Introduction

Guam is a tropical Island in the western pacific. Its southern part is mountainous and underlain by volcanic rock. Due to this typical kind of geology, its rivers, and hence its reservoirs, are a great source of water supply but they are also surrounded with steep hill slopes/mountainous environmental settings. An intense rainfall event could possibly trigger slope failures and landslides, eventually causing excessive sedimentation in reservoirs. Watershed management and erosion control activities are recommended to control such high sedimentation to protect coastal reefs and estuaries [1,2]. Being a tropical island, Guam is also hit with typhoons and cyclones that can bring heavy rainfall. On average, Guam receives average annual precipitation of about 85″–115″ [3]. Preliminary field visits by authors suggest that the major cause of rainfall-induced slope failures in southern Guam is the reduction in negative pore water pressure (i.e., matric suction) along sliding mass, which reduces the effective stress and shear strength of soil. However, the trigger factor may be more site-specific and, in many cases, in hill slopes it may be described as a typical unsaturated soil mechanics problem (Figure 1).
It has been well established from past research that landslide activities are mostly influenced by rainfall infiltration, soil properties, slope geometries, vegetation and groundwater table positions [4,5]. The triggering mechanism causing slide is governed by the complex interaction between hydrological, that is, permeability and soil water retention properties and geotechnical processes, that is, shear strength and compaction properties. Often, the typhoon events bring high intensity and short duration rainfall, which causes the topsoil layers to get saturated causing a sudden reduction in negative pore water pressure or matric suction. This phenomenon causes a reduction in effective stress and shear strength, eventually decreasing the factor of safety. This results in the topsoil layer along the slope to become unstable and susceptible to slide. Once the slide has occurred it may continue to move, transforming into a flow-like landslide [6]. Figure 1b illustrates a typical instability phenomenon where initially the slope failure occurred at the top of the hillslope by rotational sliding which very quickly turned into a flowing mass of debris. This flowing debris increased the weight acting on the nearly saturated top layers that are in front of it and along its path as it moves downhill, carrying with it a greater amount of this unstable soil from a shallow depth. This evolution from sliding to flow, causing more erosion of soil, is attributed to the steepness of the hillslope and continuous rainfall after sliding failure has occurred. It is now well established that the presence of matric suction increases the shear strength of soil due to an increase of apparent cohesion [7,8,9,10]. If proper vegetation is planted along slopes, then roots can extract water from within the root zone depth, causing a reduction in water content which will result in increasing the matric suction. This phenomenon of root water uptake, that is, transpiration, will increase the effective stress and hence the shear strength of the top few inches/feet of soil along hill slopes. In addition, soil and root properties influence the shear resistance offered by a soil–root reinforced composite system [11,12,13]. However, the present study focuses on rotational sliding type slope failures in which the depth of root zone is much less than the depth of potential failure slip surface, thereby, unlikely to help in resisting sliding forces through the mechanical reinforcement of soil. Hence, the root-reinforcement contribution in improving the slope stability is not included in this study.
Recently, Ni et al. [14] performed numerical simulations investigating the relative contribution of mechanical root reinforcement and hydrological effects of plant-induced matric suction in slopes made from completely decomposed granite (cohesionless) soil typically found in tropical and subtropical regions of Hong Kong, Brazil and South Korea. They concluded that mechanical reinforcement is effective only in shallow depths where root biomass is present. On the other hand, the hydrological reinforcement is relatively more significant at deeper depths (>1 m). In particular, during short duration rainfall, the root-induced matric suction was found to positively improve the slope stability, which may be lost during a prolonged rainfall event. Leung et al. [15] studied the effect of a root system of native shrubs and trees from Hong Kong on slope stability and concluded that young vegetation can bring an unsafe slope to marginal safety. Most notably, their analysis of results showed that the studied tree species and shrubs manifested similar reinforcement effects. Pollen-Bankhead and Simon [16] grew young riparian tress and switch grass in soil columns made from Grenada series silt-loam and collected matric suction data in the root zone via tensiometers and compared it with data from bare control columns. Their data analysis showed that apparent cohesion, which resulted from enhanced matric suction due to evapotranspiration, ranged from 1.0–3.1 kPa in spring and up to a maximum of 5.0 kPa in the summer. Furthermore, their sensitivity analysis showed that the change in soil matric suction from evapotranspiration improved the stream bank stability during the summer months. However, this effect was minimal in winter and spring months during which the root-reinforcement contributed more to an increasing factor of safety. Nonetheless, their laboratory and field experiments combined with numerical simulations illustrated positive effects of considering the mechanical and hydrological effects of roots while estimating the stability of root-permeated streambanks. Rahardjo et al. [17] investigated the role of Orange Jasmine and Vetiver grass in minimizing rainwater infiltration, for improving the stability of slopes made from native old alluvium soil (mostly silty and clayey sand with fines content 20–30%) in eastern and northwestern Singapore situated in a tropical climate setting. They concluded that the presence of both species along the slope reduced the rain-induced infiltration thereby preserving the matric suction and hence indirectly improving the shear strength and the stability of the slopes. Recently, Dias [18] studied the effect of local vegetation on slope stability at a test site in Mount Faito (Campania, Southern Italy). Their studies concluded that landslides were triggered during rainfall season when slopes made from pyroclastic soils with a soil friction angle between 36.5° to 38.5° that had a slope angle between 35° to 45° were not able to sustain the apparent increase in cohesion that resulted from the matric suction (0 to 10 kPa) during the wet season. However, the additional shear strength that resulted from root reinforcement was able to prevent slope failures up to a slope angle of 42°. Thus, there is some evidence from past research regarding the positive contribution of the hydraulic and mechanical effects of vegetation in different geological and climate settings to prevent landslides.
This study aims to understand the effect of vegetation and rainfall on the infiltration of water through the hill slope and its impact on slope stability. To simulate accurate slope response, one needs to know the saturated permeability and soil water retention properties of underlying soil, rate of infiltration, intensity and duration of rainfall, transient moisture seepage profiles, vegetation and climate properties, saturated shear strength of soil, and the variation of matric suction within the slope. In this study, an idealized slope profile was created based on field observations from site visits of Ija watershed in Guam and laboratory data were used as the input for properties of soil. Rainfall and major storm event recorded via rain gauge station installed at the site were considered. Transient seepage analysis was performed using finite element program to generate the pore water pressure profiles in response to the actual rainfall data over a period of one month. Transient pore water pressure profiles were imported and coupled slope stability analysis was performed on a test slope. Both the presence and absence of vegetation were considered, and discussions are made based on results of the analysis regarding the positive benefits of having vegetation along tropical hill slopes.

2. Site Description, Materials, and Methods

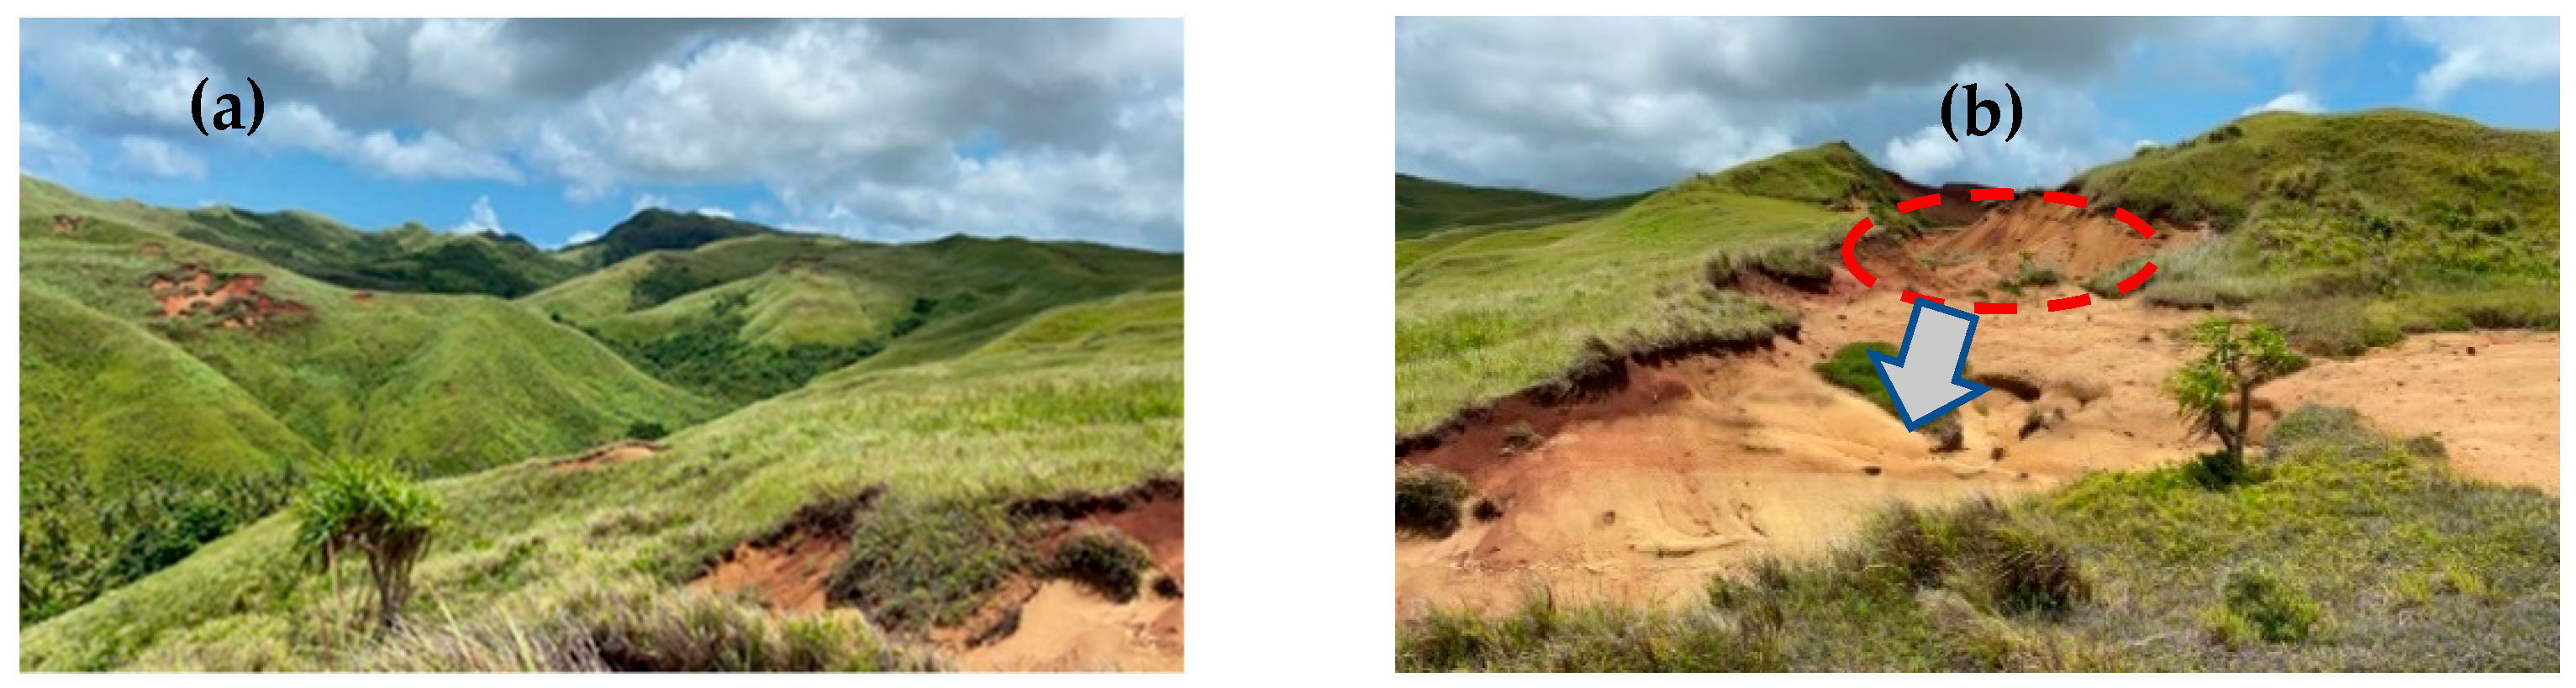
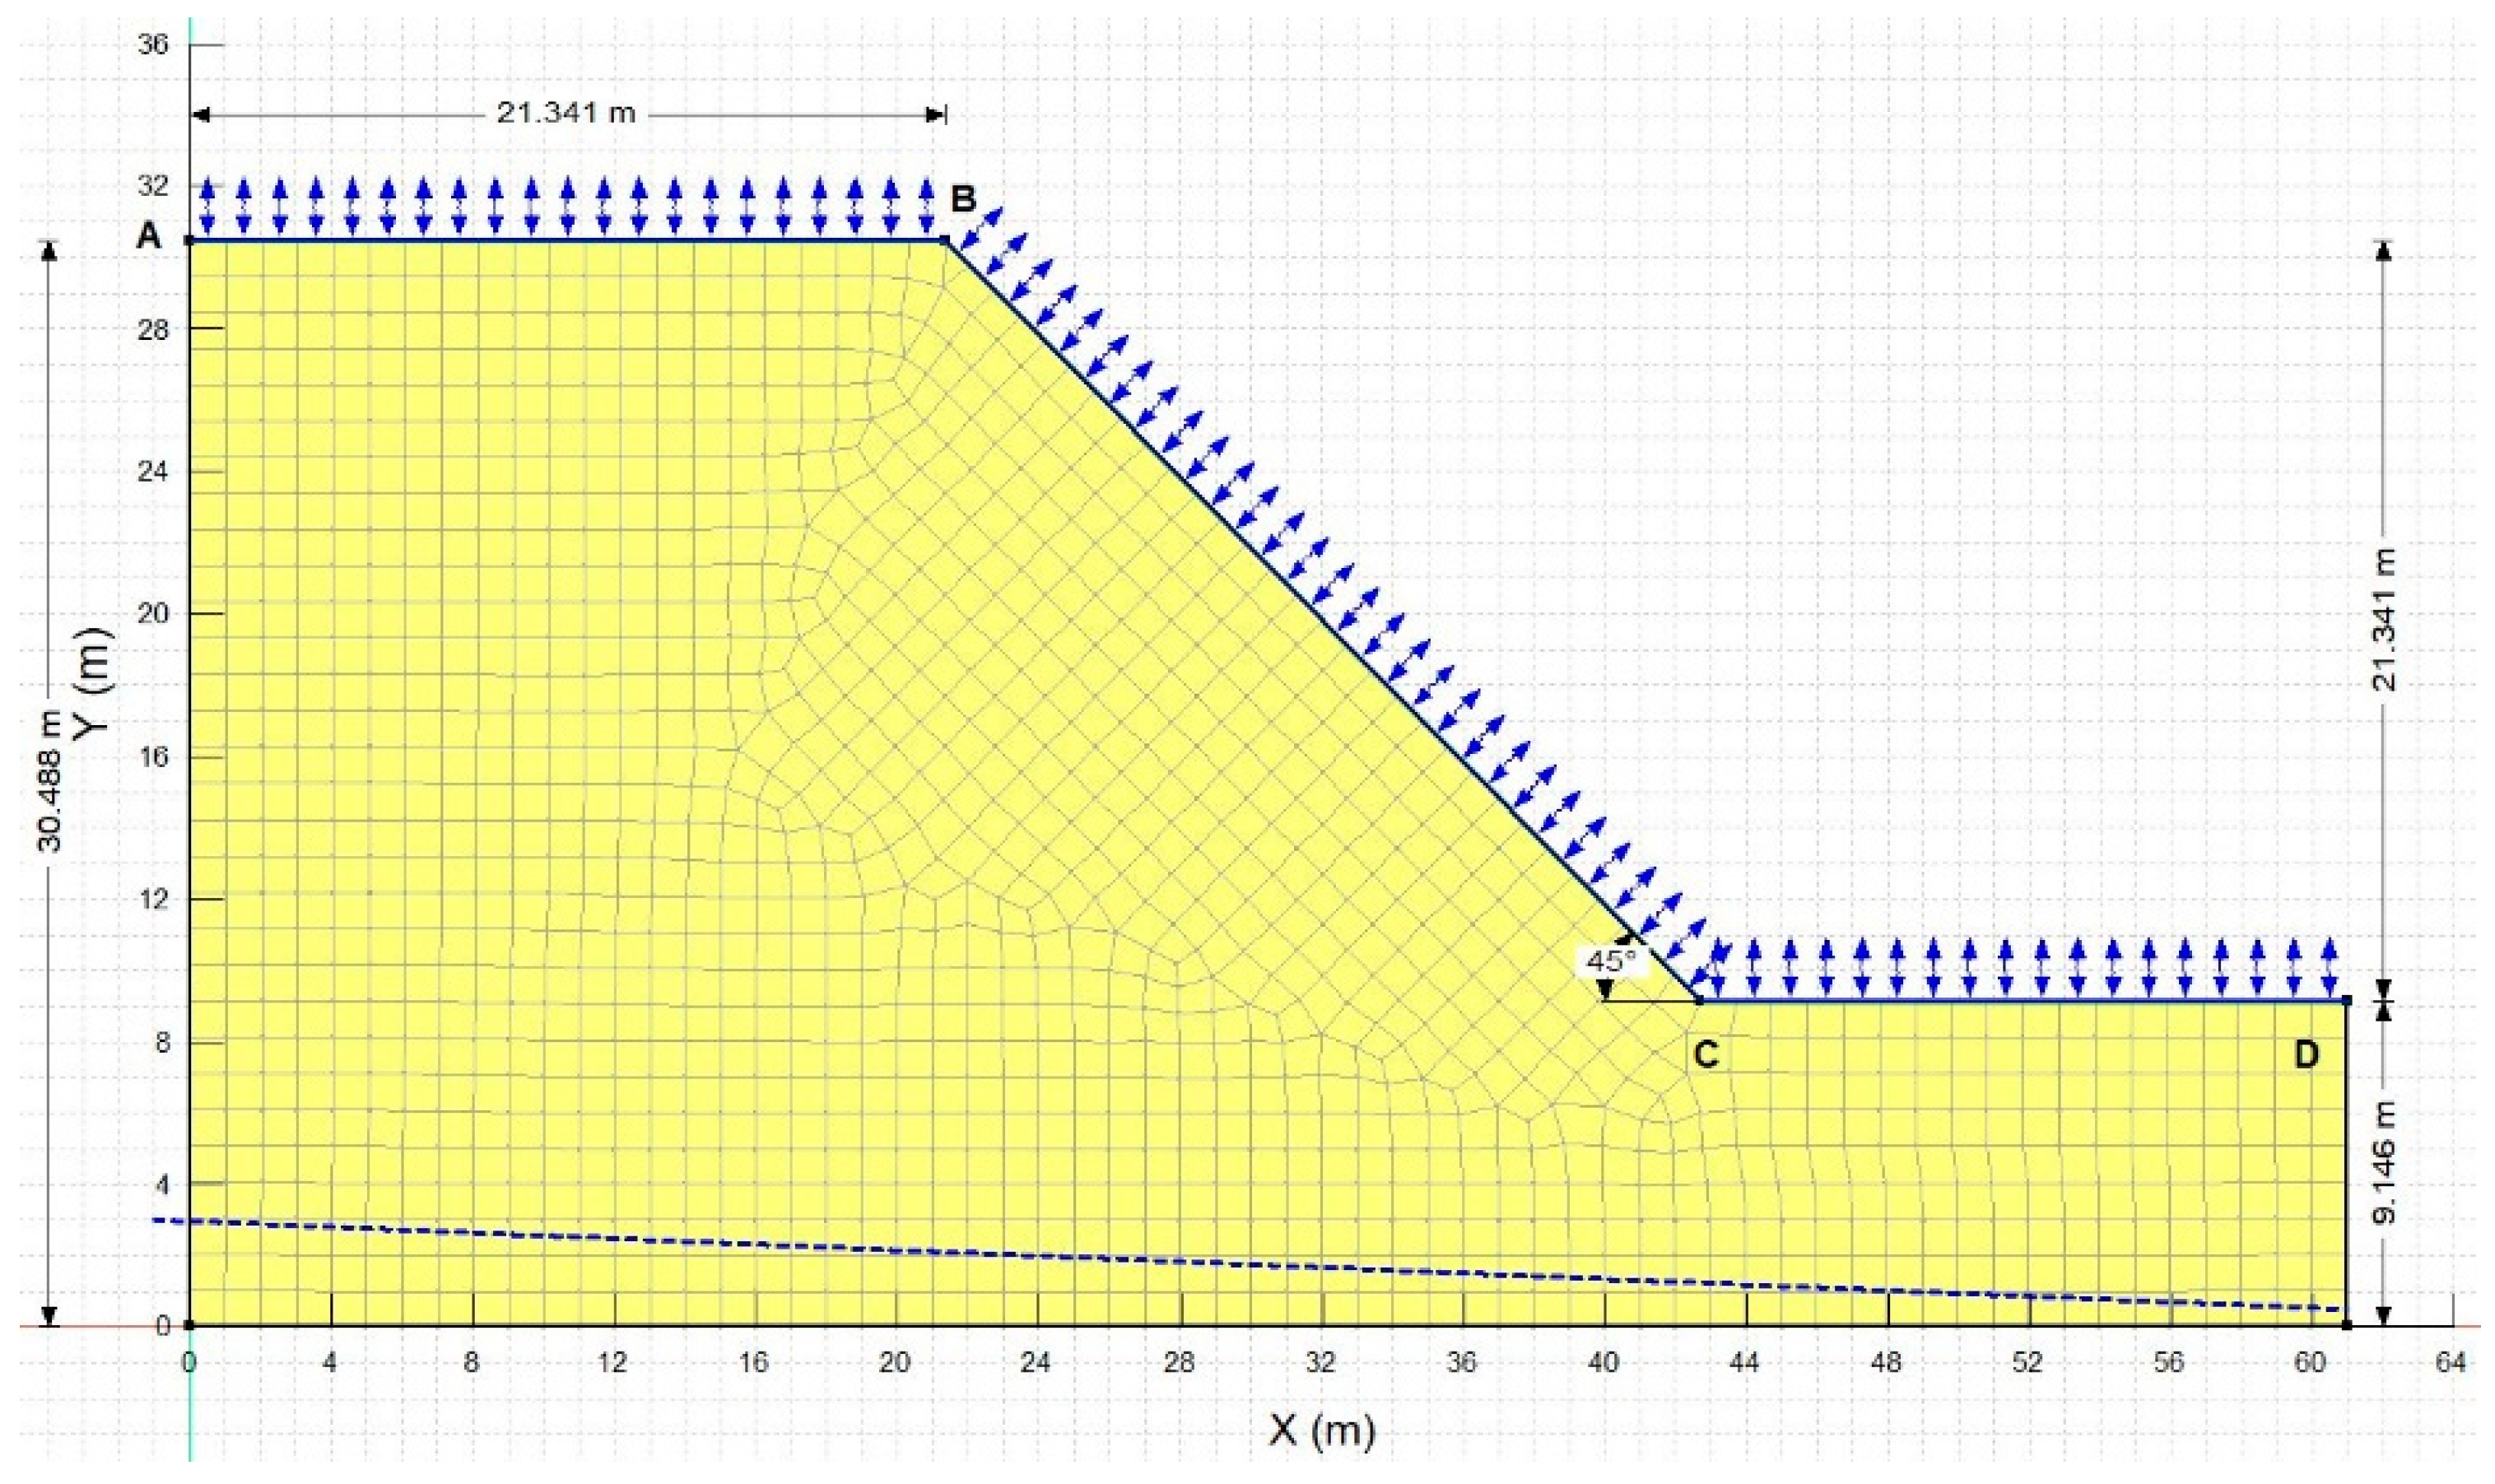
2.1. General Geology and Site Description of Idealized Hillslope

The site is in the Ija watershed in Guam, which is a western pacific Island and a territory of the USA. Field visits concluded that, in general, the topsoil layer supports the roots of grass or plantation and varies approximately 1–2 m in depth depending on the location. The study location had a relatively high conductivity (HC) soil and soil samples were collected and tested. The hillslope has been idealized as 21.3-m-high of 45° (1:1) inclination and is made of homogenous soil of relatively HC (Figure 2) and henceforth will be called HC soil.

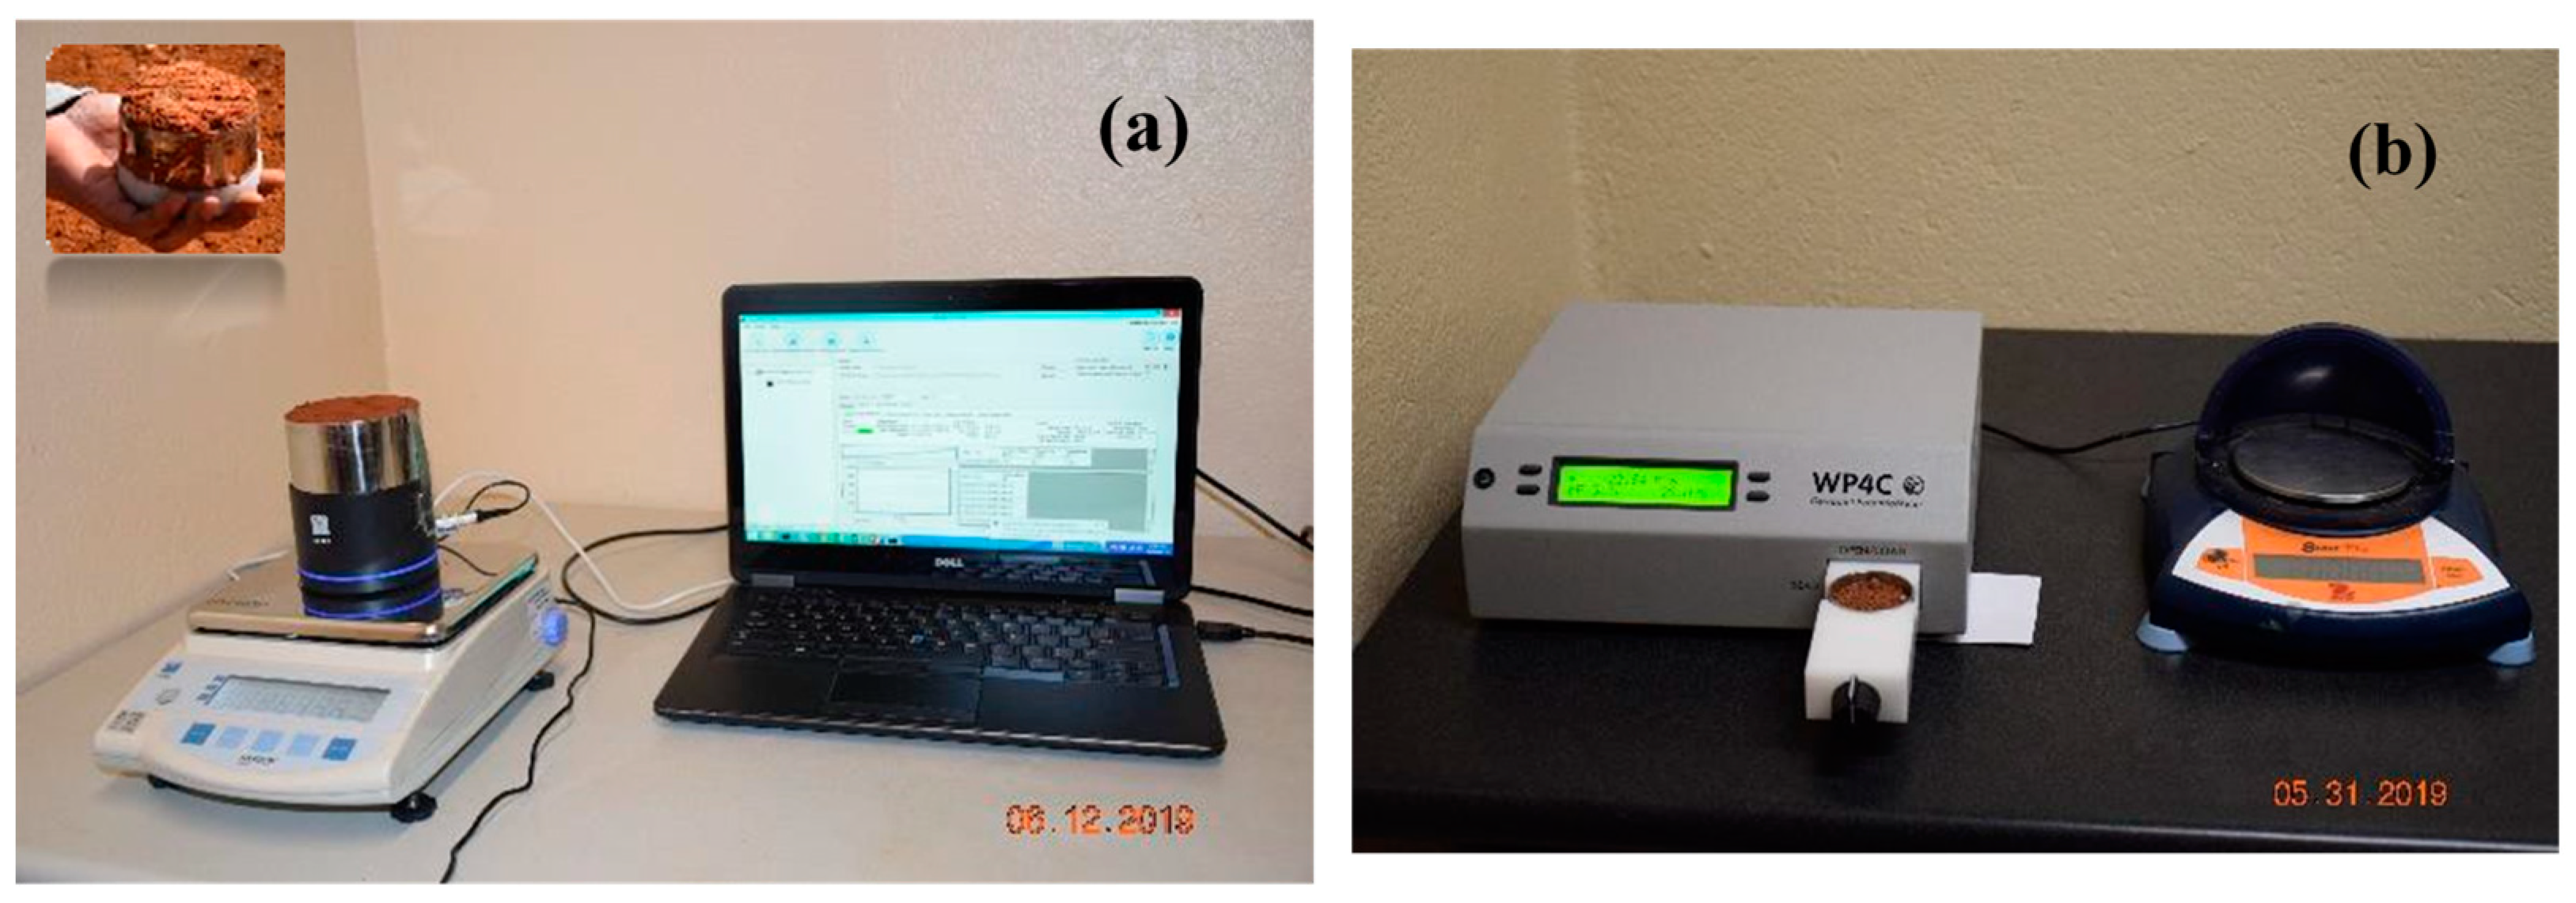
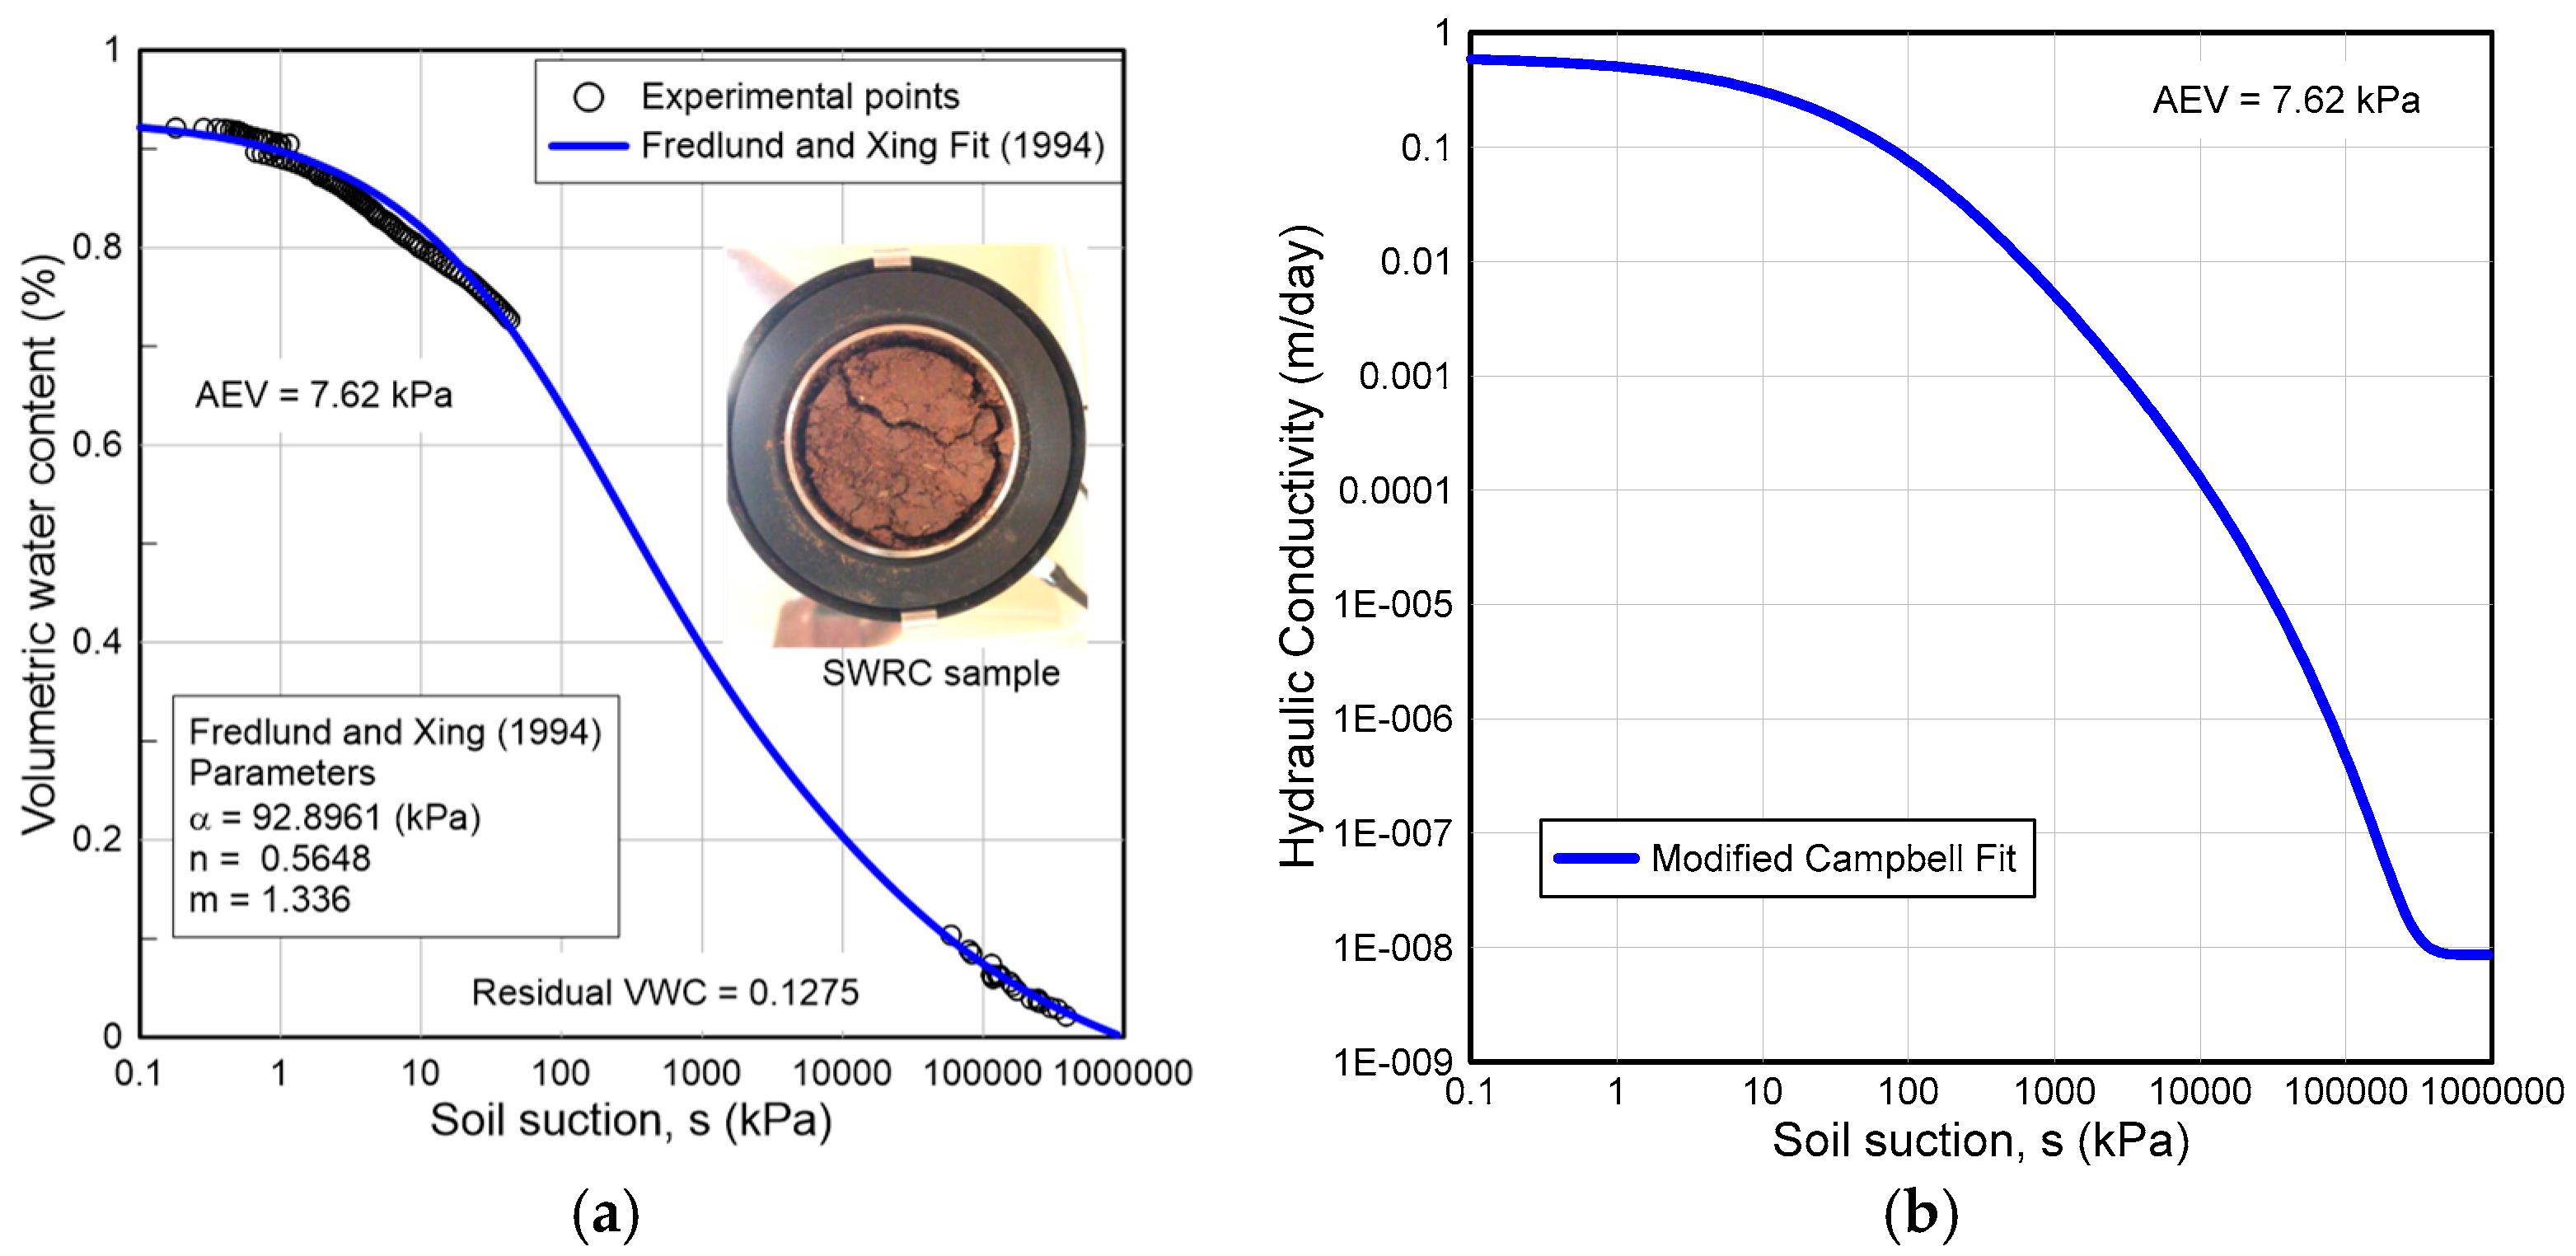
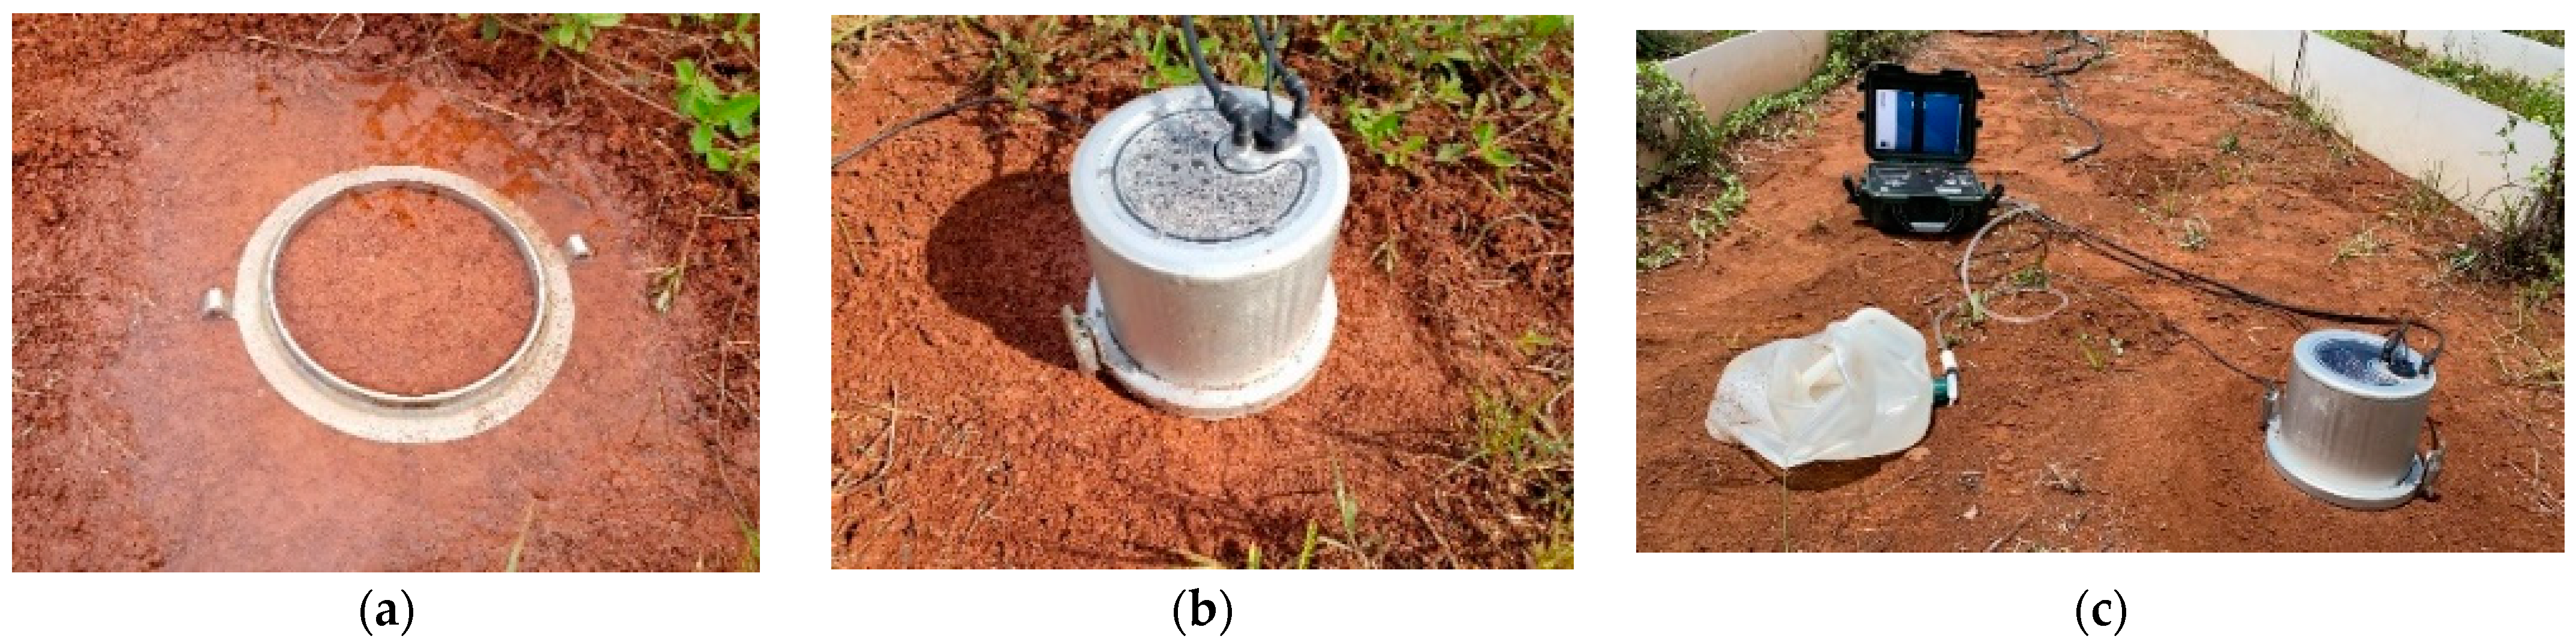
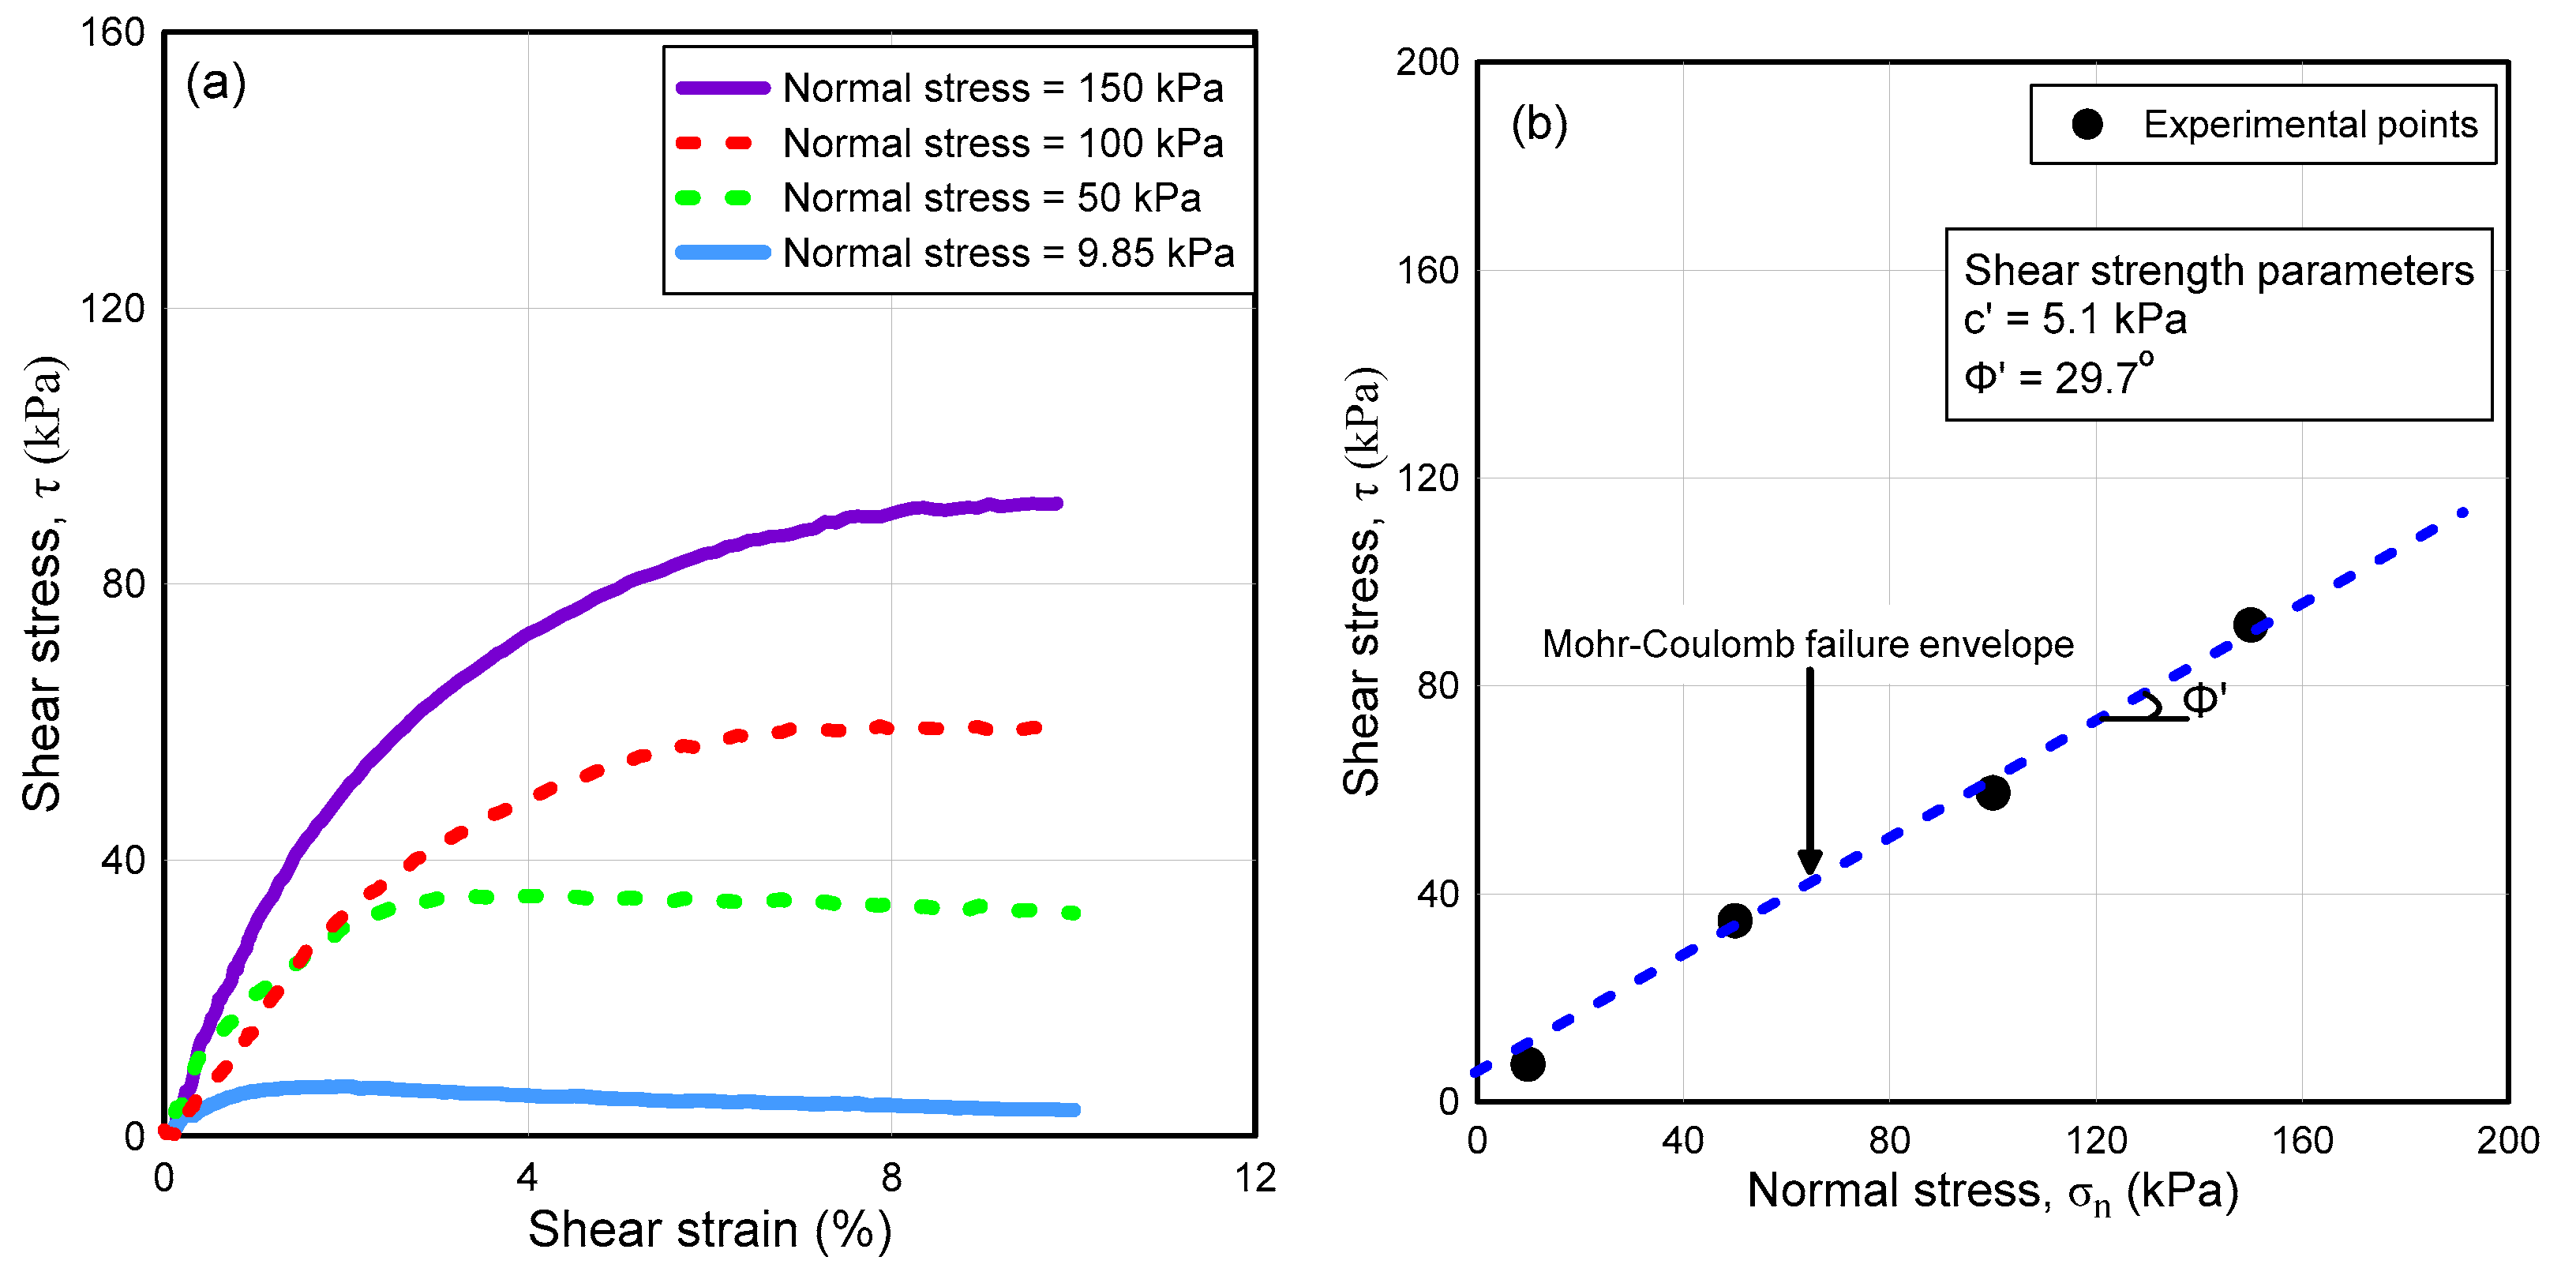
2.2. Materials and Test Methods

Soil samples were collected from the Ija site (13°16′04.0″ N 144°42′44.9″ E) and brought to the laboratory for testing. Average specific gravity (Gs) was experimentally determined using the pycnometer method as described in American Society for Testing and Materials (ASTM) standard, ASTM D 854-02 (2002) [19]. The mechanical sieve analysis test was performed on soils to determine the gradation of soil and ASTM D-6913-04 (2009) [20] procedure was followed. Hydrometer tests were conducted on fine grained material from collected soil samples to determine the amount of clay and silt fraction in soil. The ASTM 152-H type of hydrometer and ASTM D-422-63 (2007) [21] test procedure was followed. Results from the sieve analysis and hydrometer were then combined to produce the entire gradation curve. Finally, the amount of sand and silt clay was determined. After conducting Atterberg’s limit tests in accordance with the ASTM D4318-10 [22] procedure, the soil was further classified as per the Unified Soil Classification System (USCS).
Soil samples were collected for permeability and SWRC tests in special steel rings with 5 cm height, 2.8 cm in diameter, 50 cm2 cross-sectional area and measuring 250 mL volume (In sat Figure 3a). After complete saturation, saturated soil permeability (ksat) was determined via KSAT (saturated permeability) equipment (MeterGroup Inc., Pullman, USA) [23]. Soil water retention curves (SWRC) provide a continuous relationship between moisture (volumetric/gravimetric) or degree of saturation (S) and soil suction (ψm). SWRC provides us information about the capacity of soil to hold or retain water at different suction states. However, in terms of the geotechnical engineering perspective, it provides us with a way to indirectly estimate additional increases in the shear strength of partially saturated soil [7,8,9,10].
After each permeability test, saturated samples were carefully transferred to the hydraulic property analyzer (HYPROP) apparatus by MeterGroup Inc (Figure 3a) and soil water retention curves were obtained for the wet end of the curve using the evaporation method by Schindler [24,25]. A WP4C dewpoint potentiometer (MeterGroup Inc.) was used to obtain the high suction points (dry end) on the SWRC curve as shown in Figure 3b [26]. HYPROP is a computer-controlled equipment that has suction sensors to collect numerous high resolution continuous data points in the wet-end of the SWRC curve. Fredlund and Xing’s [27] three-parameter equation was used to fit the experimental data providing the SWRC curve over the entire range of suction.
θ w = θ s 1 ln 1 + ψ h r ln 1 + 10 6 h r 1 l n e 1 + ψ a f n f m f ,
where ψ = soil suction (kPa); θw = volumetric water content at soil suction, ψ; θs = saturated volumetric water content; af = material parameter related to the air-entry value (AEV) of soil (kPa); nf = material parameter, which is primarily a function of the rate of water extraction from the soil once the air-entry value has been exceeded; mf = material parameter which is a function of the residual water content; hr = suction at residual water content (kPa). In addition, the Modified Campbell [28] Equation was used for predicting unsaturated permeability as a function of suction.
k ψ = k s k m i n 1 ln 1 + ψ h r ln 1 + 10 6 h r 1 l n e 1 + ψ a f n f m f p + k m i n ,
where k = hydraulic conductivity of the water phase (m/day); ks = saturated hydraulic conductivity of the water phase (m/day); kmin = calculated minimum hydraulic conductivity (m/day); p = parameter used to control the modified Campbell [28] estimation of hydraulic conductivity; af, nf, mf and hr are Fredlund and Xing [27] SWRC fitting parameters as explained above. It should be noted that the saturated hydraulic conductivity and a fit of the soil-water characteristic curve by the Fredlund and Xing [27] equation is used as an input to get the predicted kunsat-ψ curve in this research. However, the experimental test results are used to predict the SWRC needed. Figure 4a shows the experimental soil water retention curve (SWRC) data obtained from HYPROP and WP4C equipment which is best fitted with Fredlund and Xing [27] model along with the predicted unsaturated permeability with respect to suction from modified Campbell [28] model as shown in Figure 4b. The best fit parameters, air entry value (AEV) and residual volumetric water content are also presented in each figure.
Saturated and residual volumetric water content (VWC) was estimated via graphical construction on a best fitted Fredlund and Xing [27] model.
In addition, field saturated hydraulic conductivity was obtained via tests using an equipment called SATURO Infiltrometer manufactured by Meter Group Inc. [29] as shown below (Figure 5). Field data were collected and logged in the datalogger of this equipment and later processed to determine the saturated field permeability.
Furthermore, three undisturbed direct shear test (DST) samples were retrieved by driving steel rings with 0.0635 m (~2.5 inch) diameter and 0.0254 m (~1 inch) in height from the same depth and nearby location of each layer from the site. The idea was to obtain samples that were almost identical in soil properties such as initial water content, dry unit weight and voids ratio. Each DST sample was first soaked, that is, fully saturated in the shear box. Each of the 3 samples was then consolidated under 50, 100 and 150 kPa normal stress, respectively. Finally, once the consolidation was completed (which took at least 24 h), each sample was then sheared at a very slow rate of 7.196 × 10⁻⁸ m/s (~0.00017 inch/min) ensuring that no excess pore water pressure (PWP) was developed throughout shearing maintaining fully drained conditions. The stress-strain results obtained from DST are shown in Figure 6a. The results at peak failure were plotted in a normal stress vs. shear stress plane to obtain material parameters, that is, effective cohesion (c’) and effective friction angle (ϕ’) interpreted from a Mohr-Coulomb failure envelope (Figure 6b). Thus, these DST tests can be classified as consolidated drained (CD) tests simulating the drained conditions at failure like an actual field situation.
All the geotechnical and hydrological soil properties were obtained on HC soil via laboratory testing and are listed in Table 1.

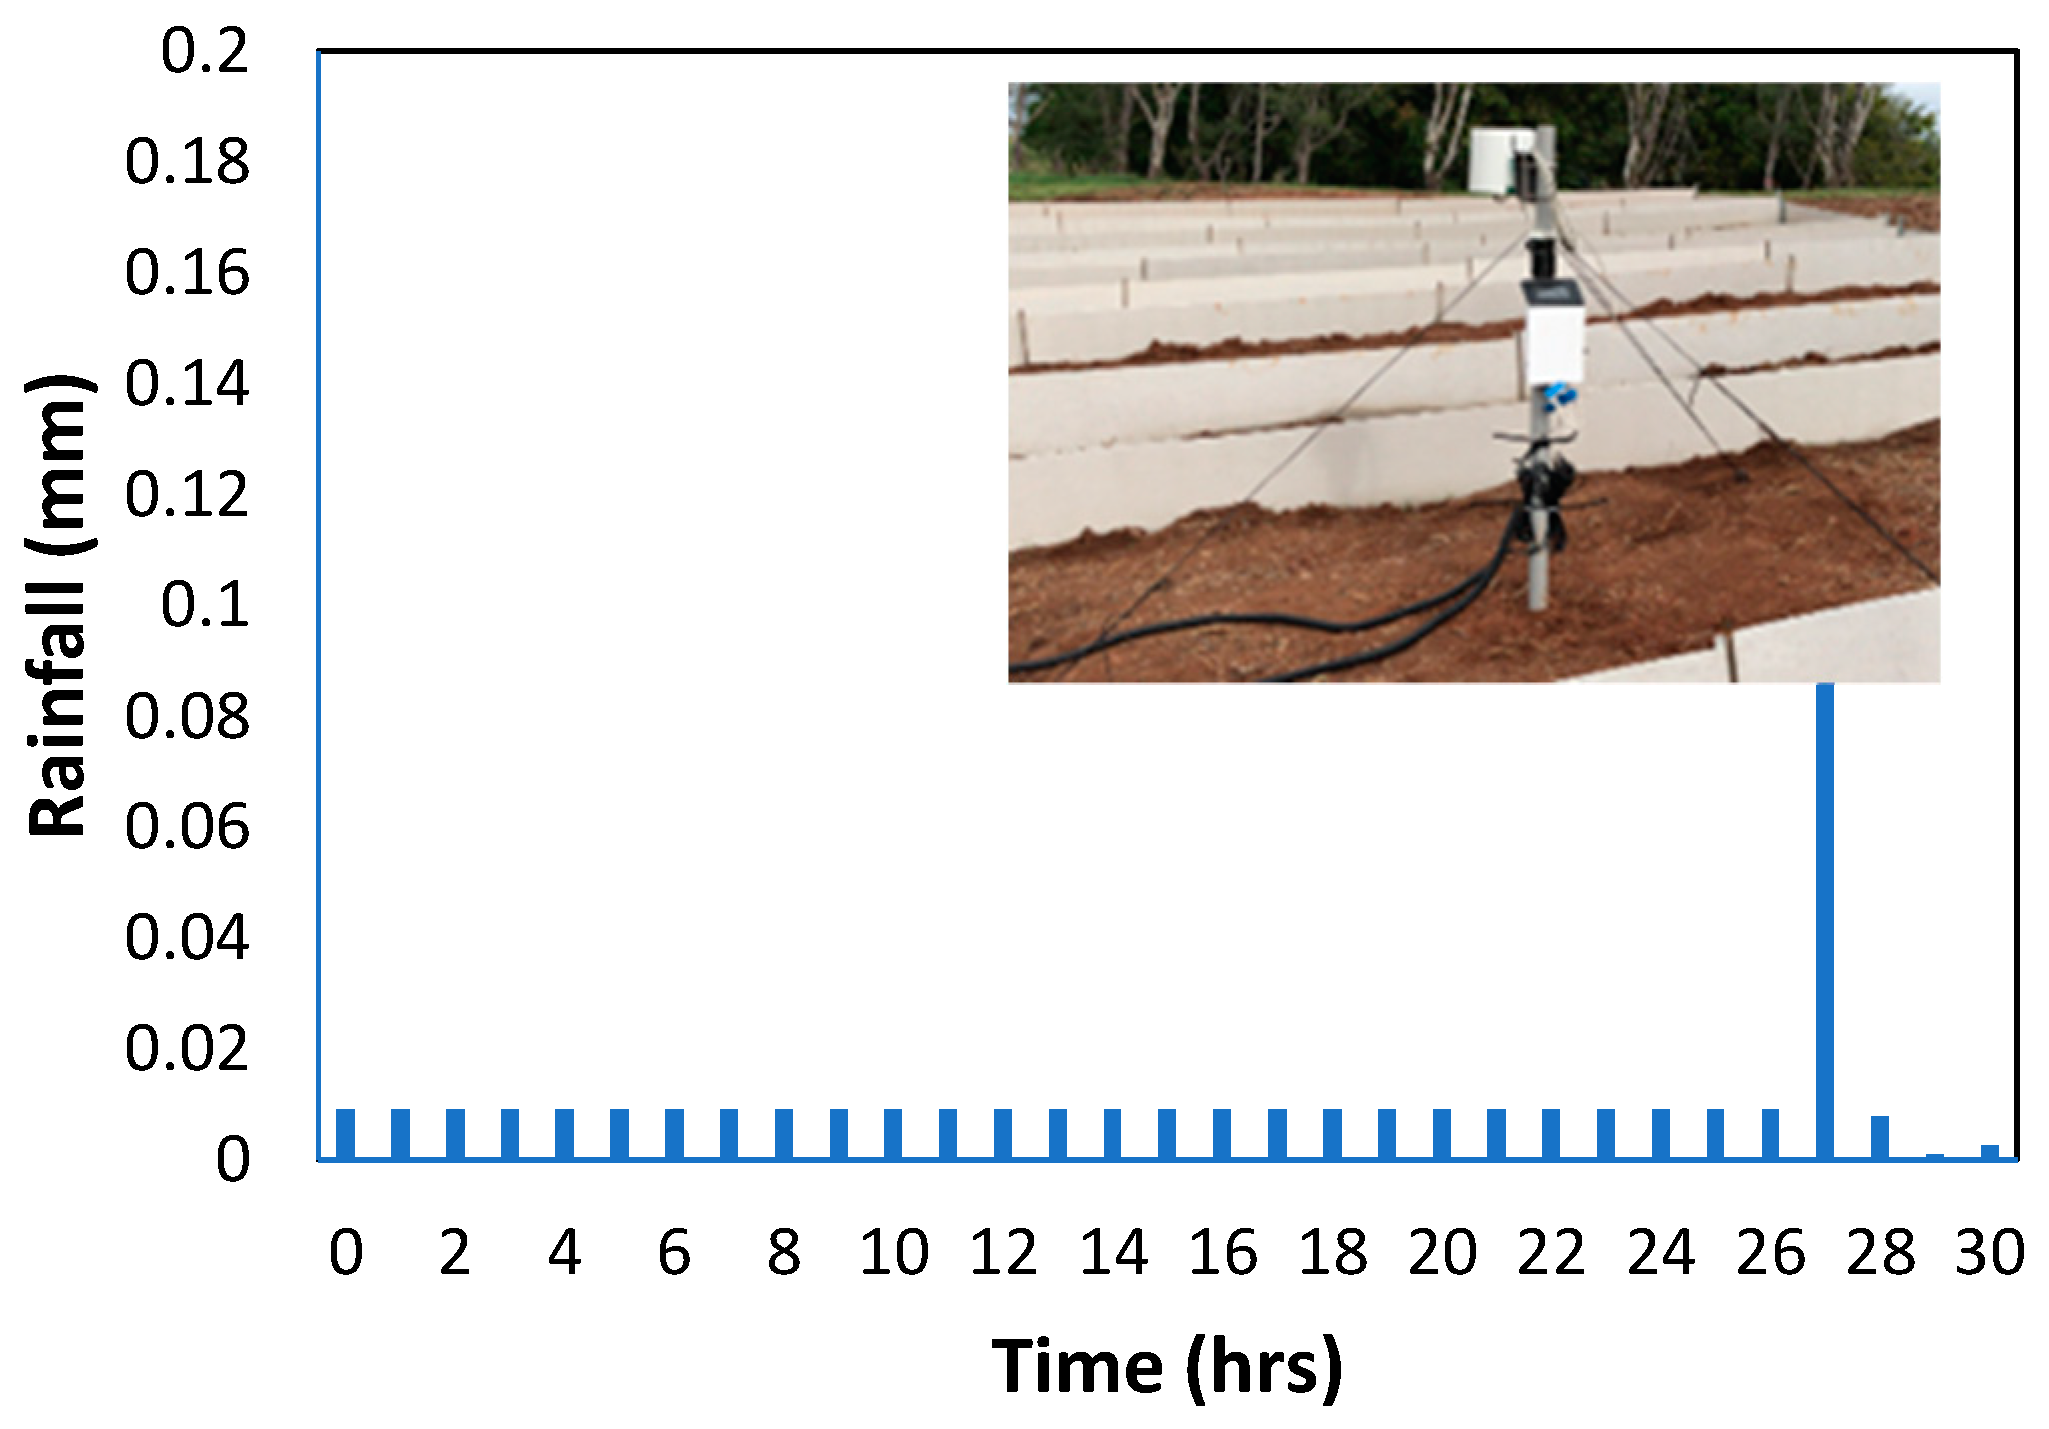
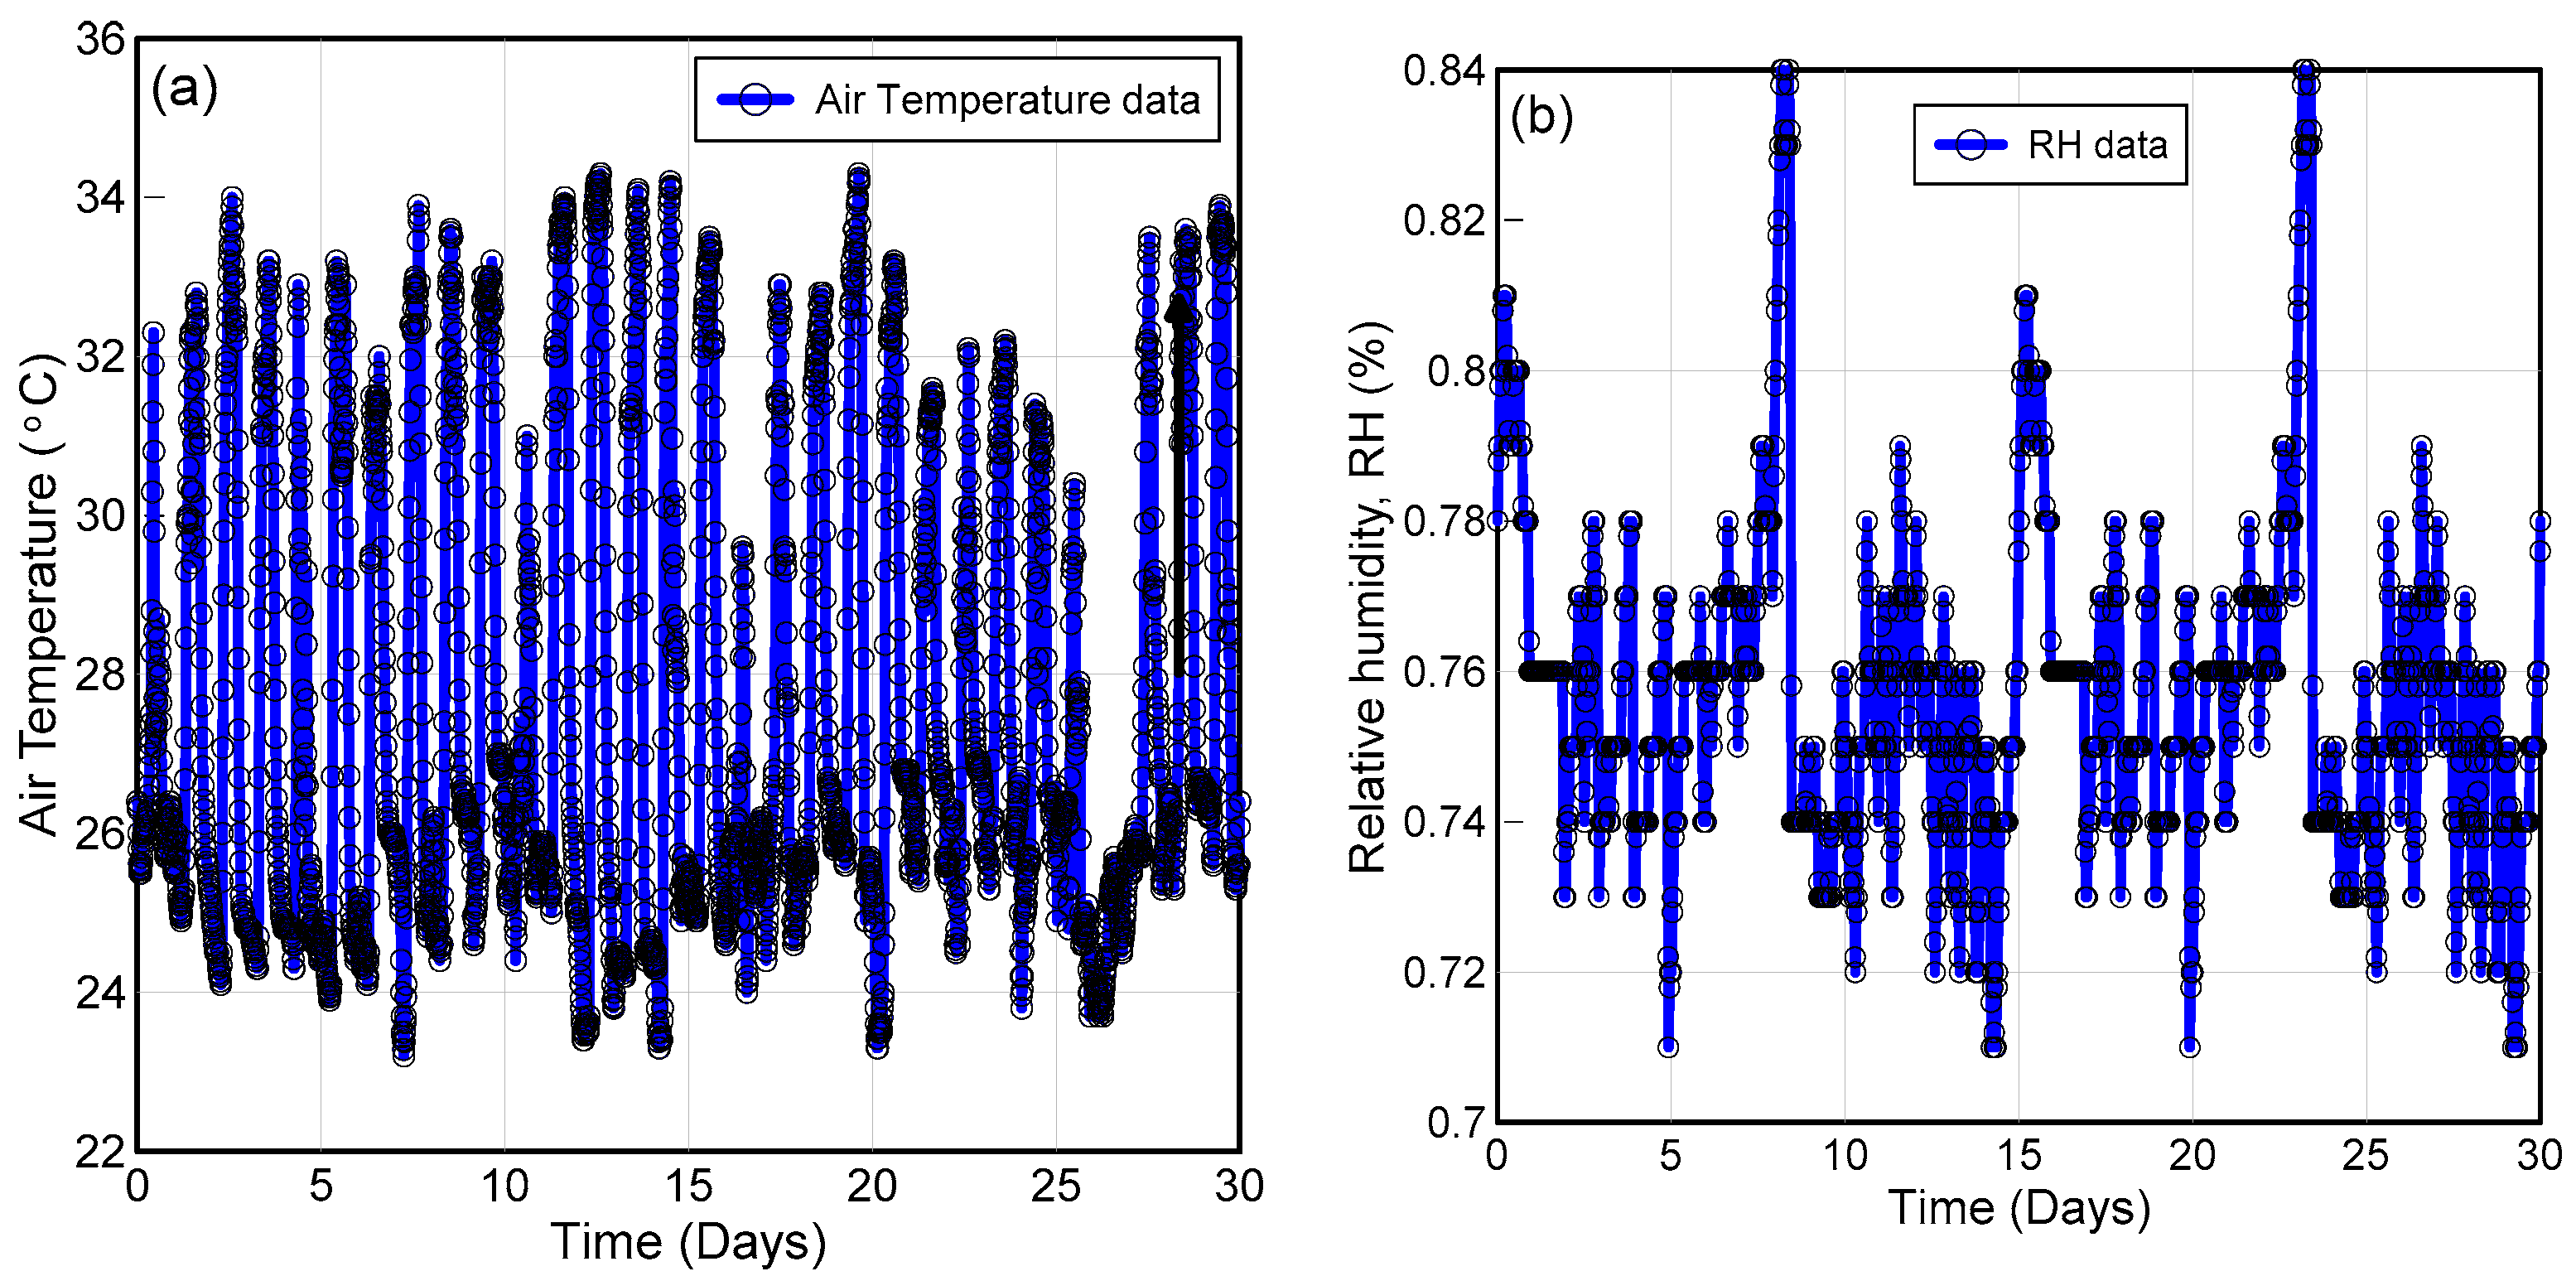
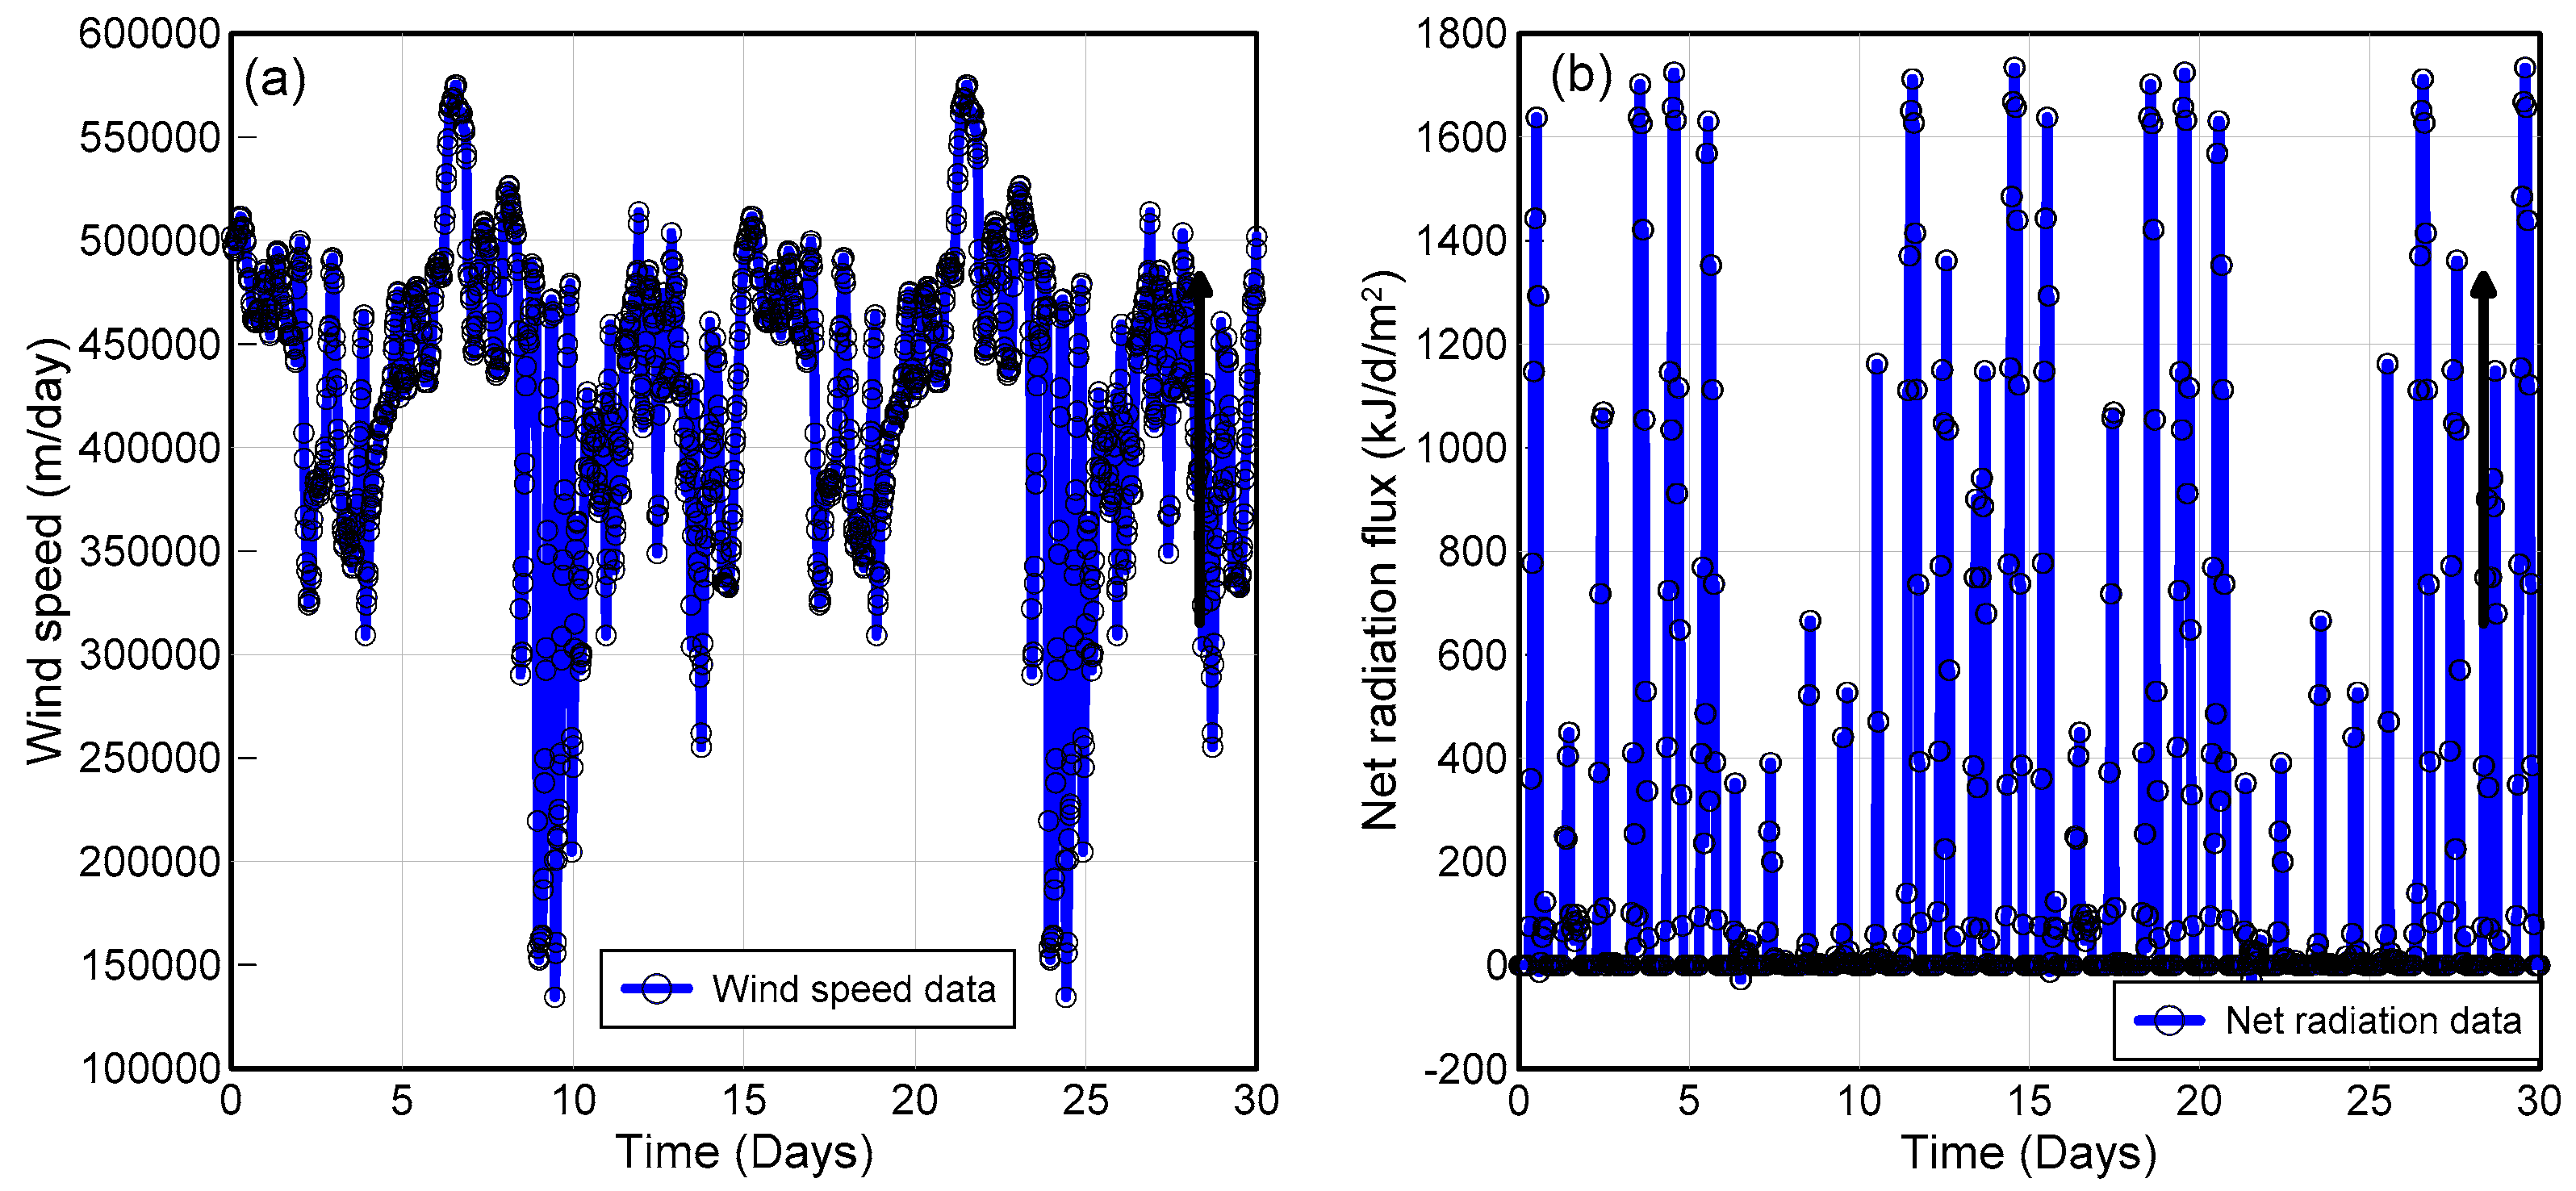
2.3. Land Climate Interaction Boundary Condition

Land-climate interaction (LCI) was applied at the top surface of the hill slope. Field observations indicated that the water table is deep enough and is unlikely to rise from a precipitation event into the hill slope affecting its stability. Hence, the water table was kept at 3 m elevation on the extreme left boundary and gently sloping to the right boundary with 0.5 m elevation at the extreme right. Climate Data, including precipitation data from the month of November 2019 (wettest month of 2019) at an interval of 30-min interval, was collected using a rain gauge station installed at the Ija site. A sim card with a data plan was installed within the ZL6 data logger to display the information over zentra cloud services managed by Meter Group Inc., so that the information can be live obtained and stored in Excel form. Storm Kammuri hit the island of Guam on 27 November 2019 and dumped about 7.22″ of rainfall in 24 h, which amounts to approximately 0.1834 m3/day/m2 of precipitation. The average rainfall per day for the first 26 days of this month was calculated to be 0.0092 m3/day/m2. On 27th day, the storm Kammuri event with a magnitude of 0.1834 m3/day/m2 was applied and the rest of the days were applied with the normal recorded rainfall (Figure 7).
Daily air temperature data for the period of one month (November 2019) were obtained from the ZL6 data logger installed at the Ija site. Similarly, the wind speed, relative humidity and net radiation data were obtained from a nearby weather station (Figure 8 and Figure 9).

3. Numerical Analysis, Results and Discussions

3.1. Case (a): LCI without Vegetation

In this part of the analysis, the effect of precipitation and evaporation was considered assuming no land cover, that is, vegetation. This was done to simulate the response of the hill slope to the applied climate boundary condition without any vegetation. Mainly, the changes in negative/positive pore water pressures (PWP), land evaporation, and factor of safety (FOS) in the absence of evapotranspiration via root water uptake and plant leaf were studied.

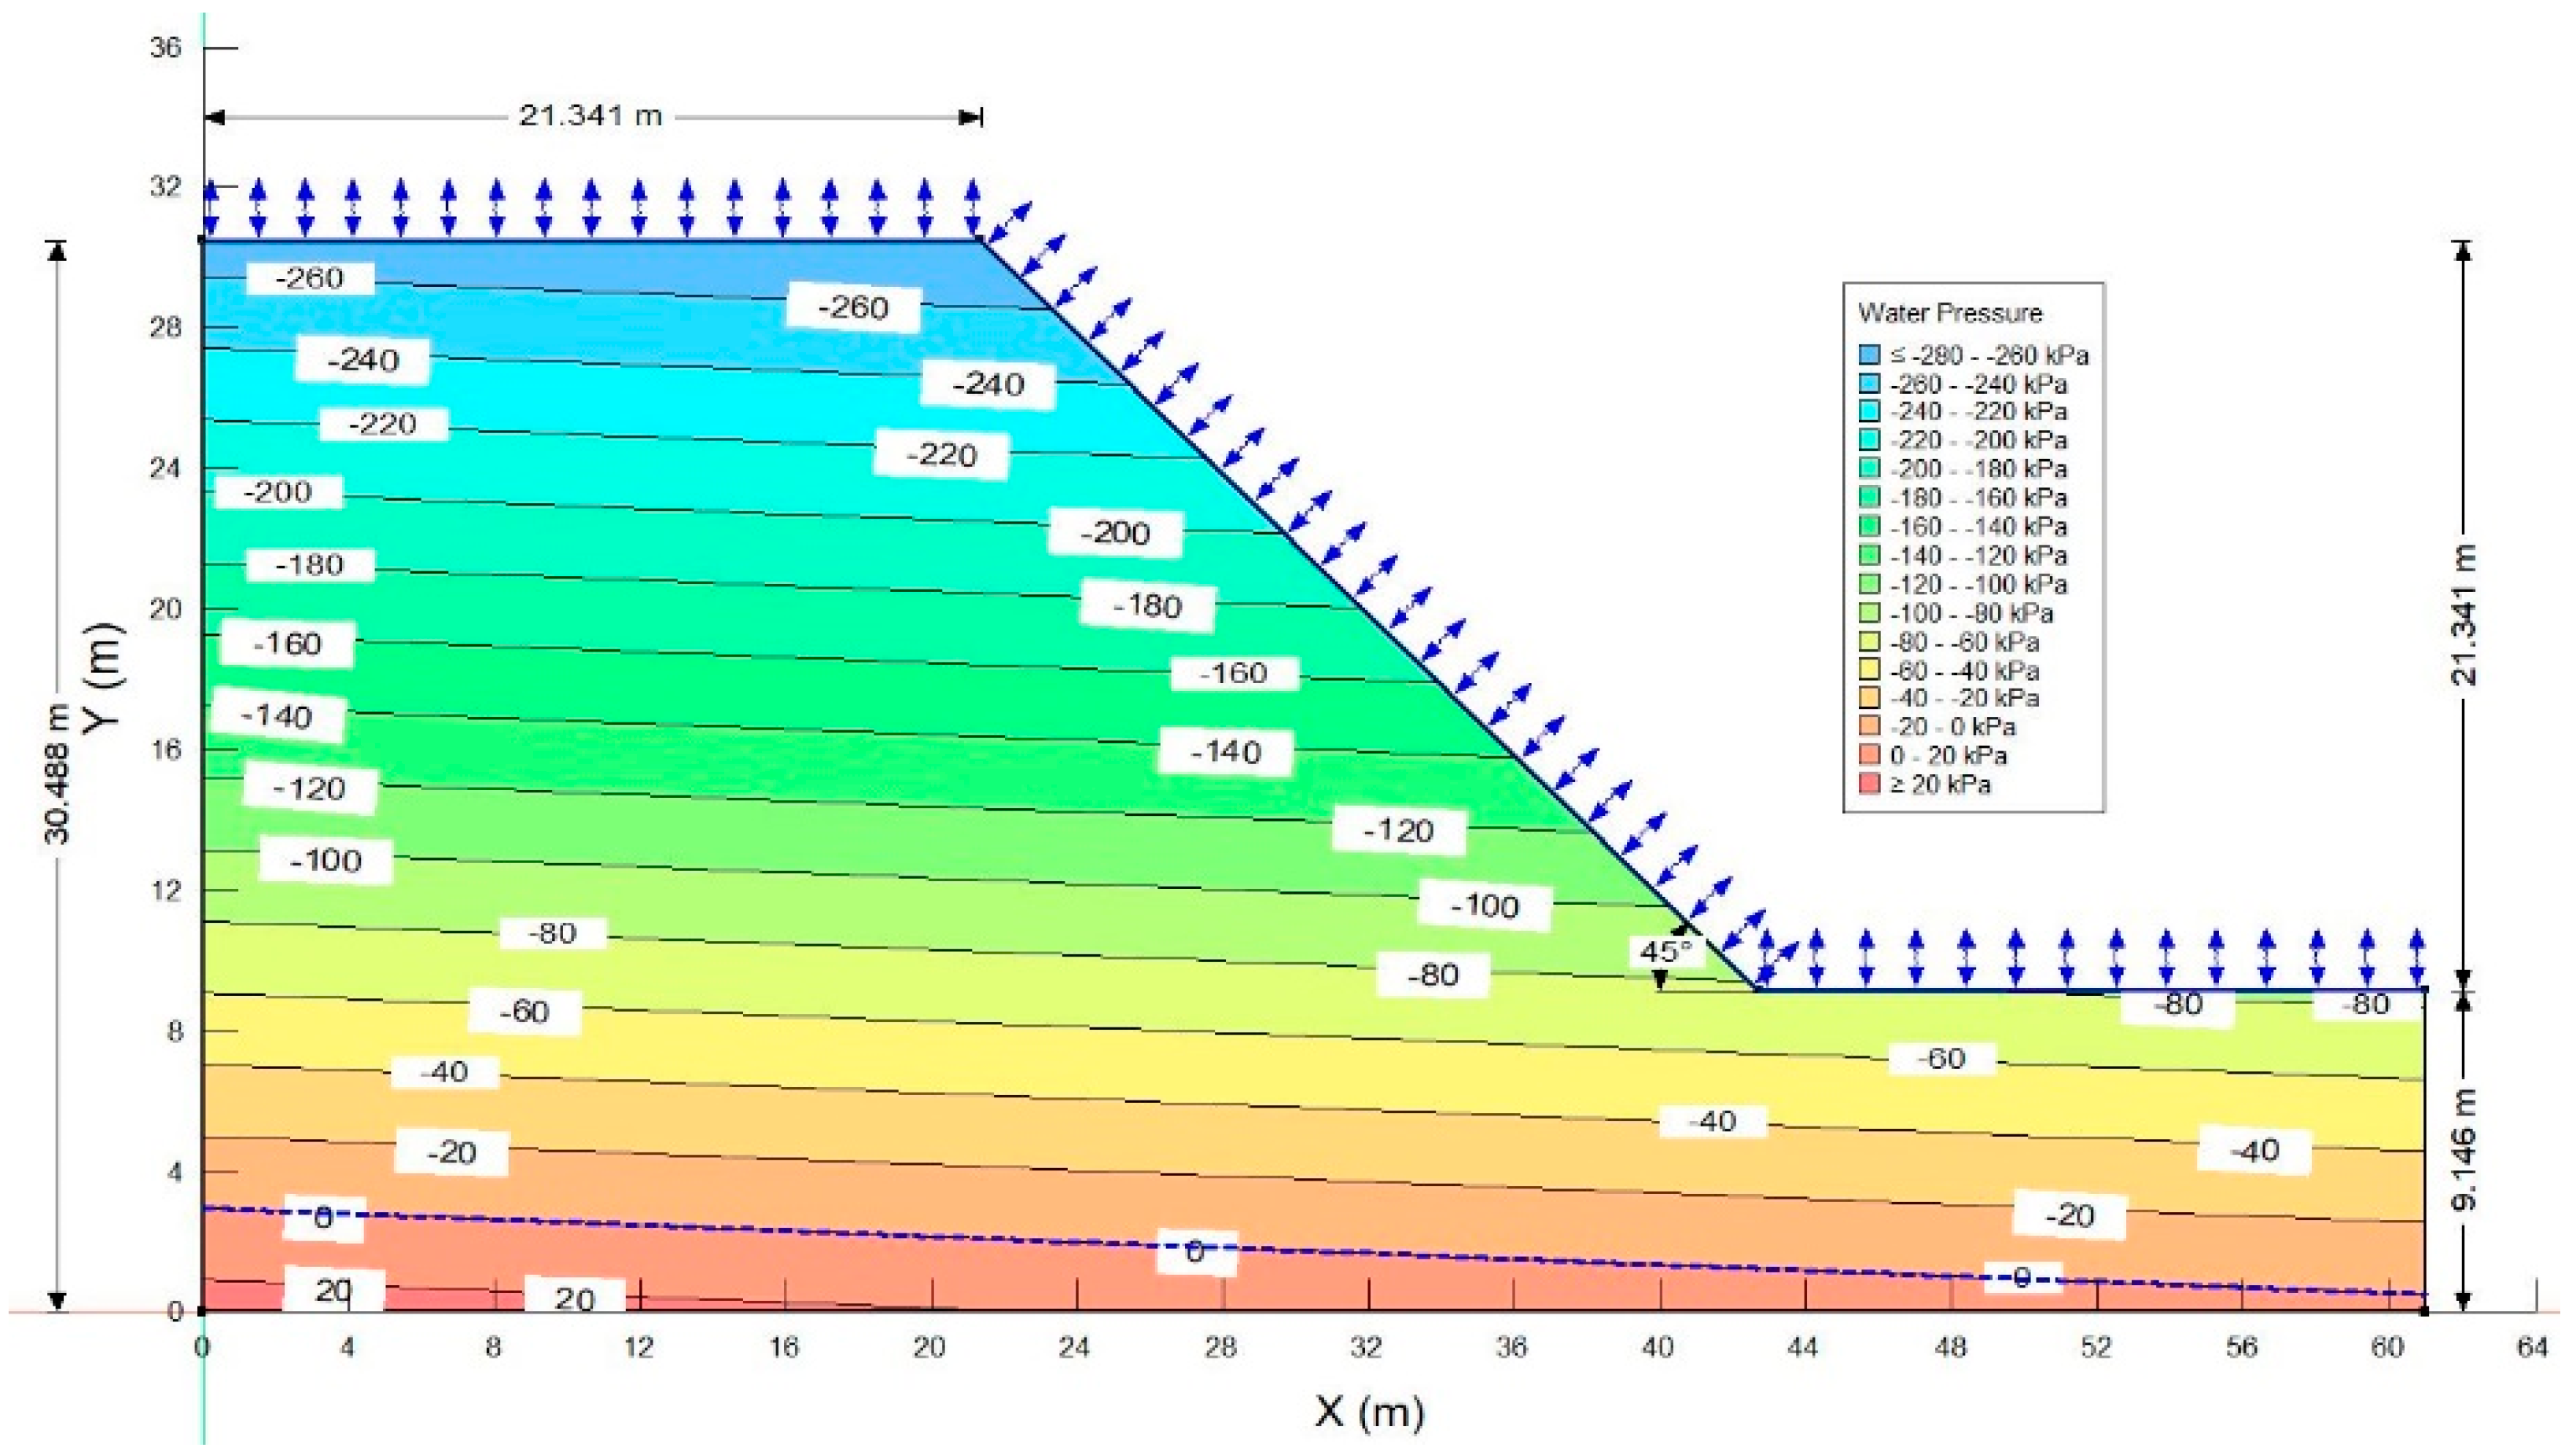
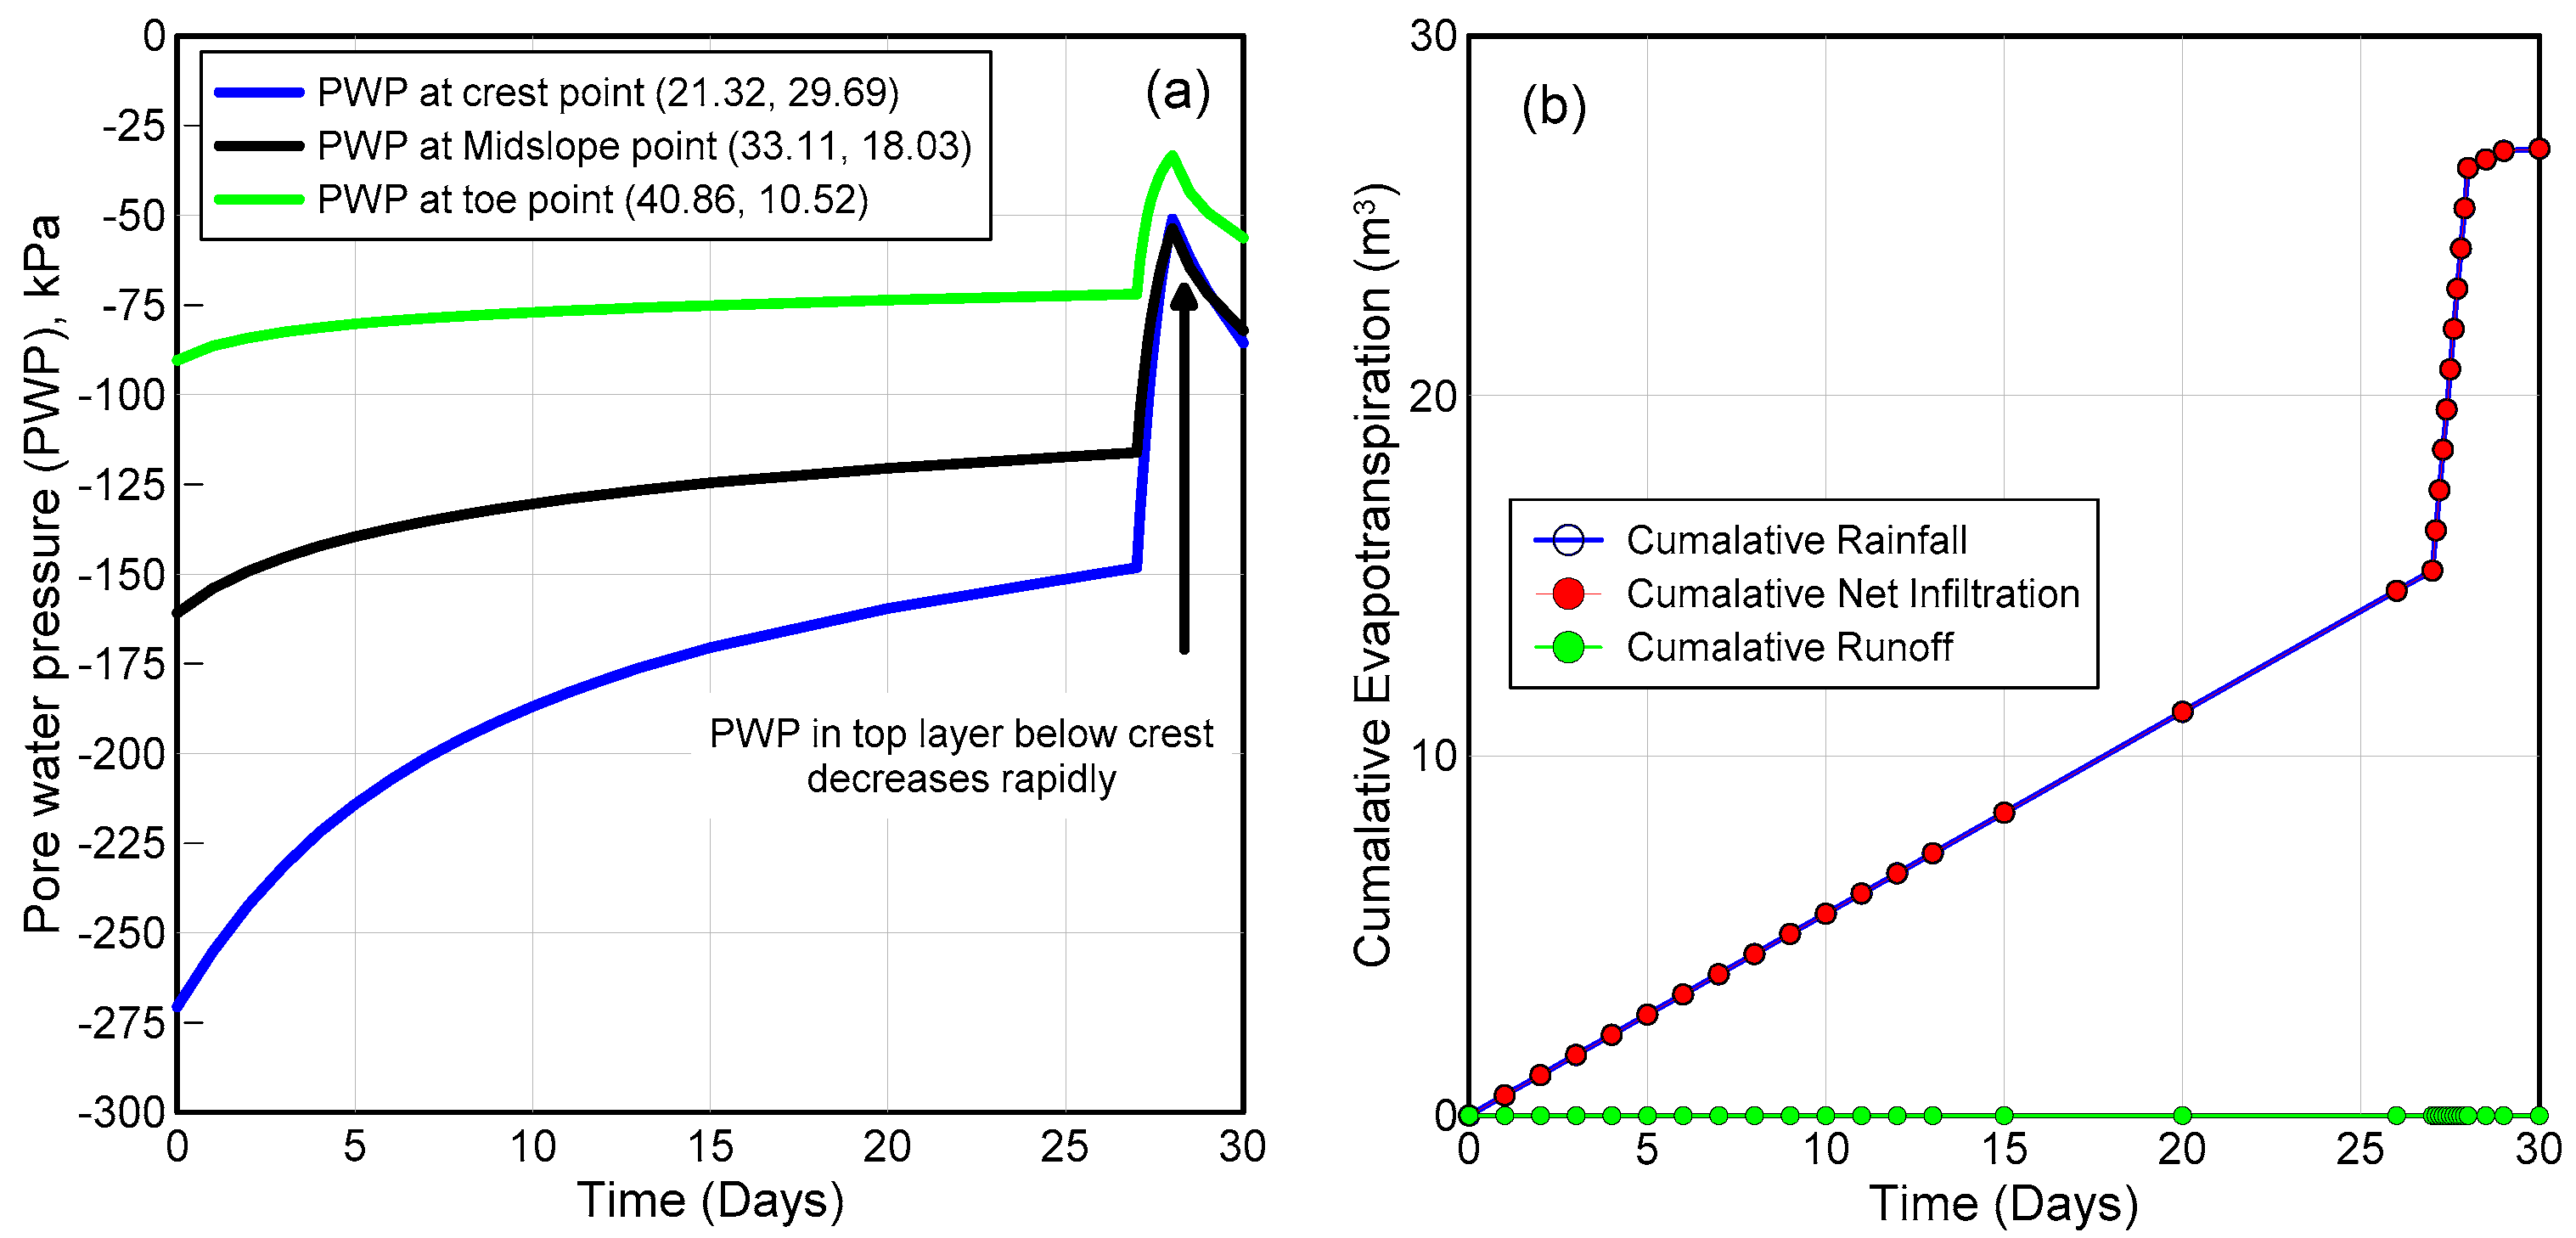
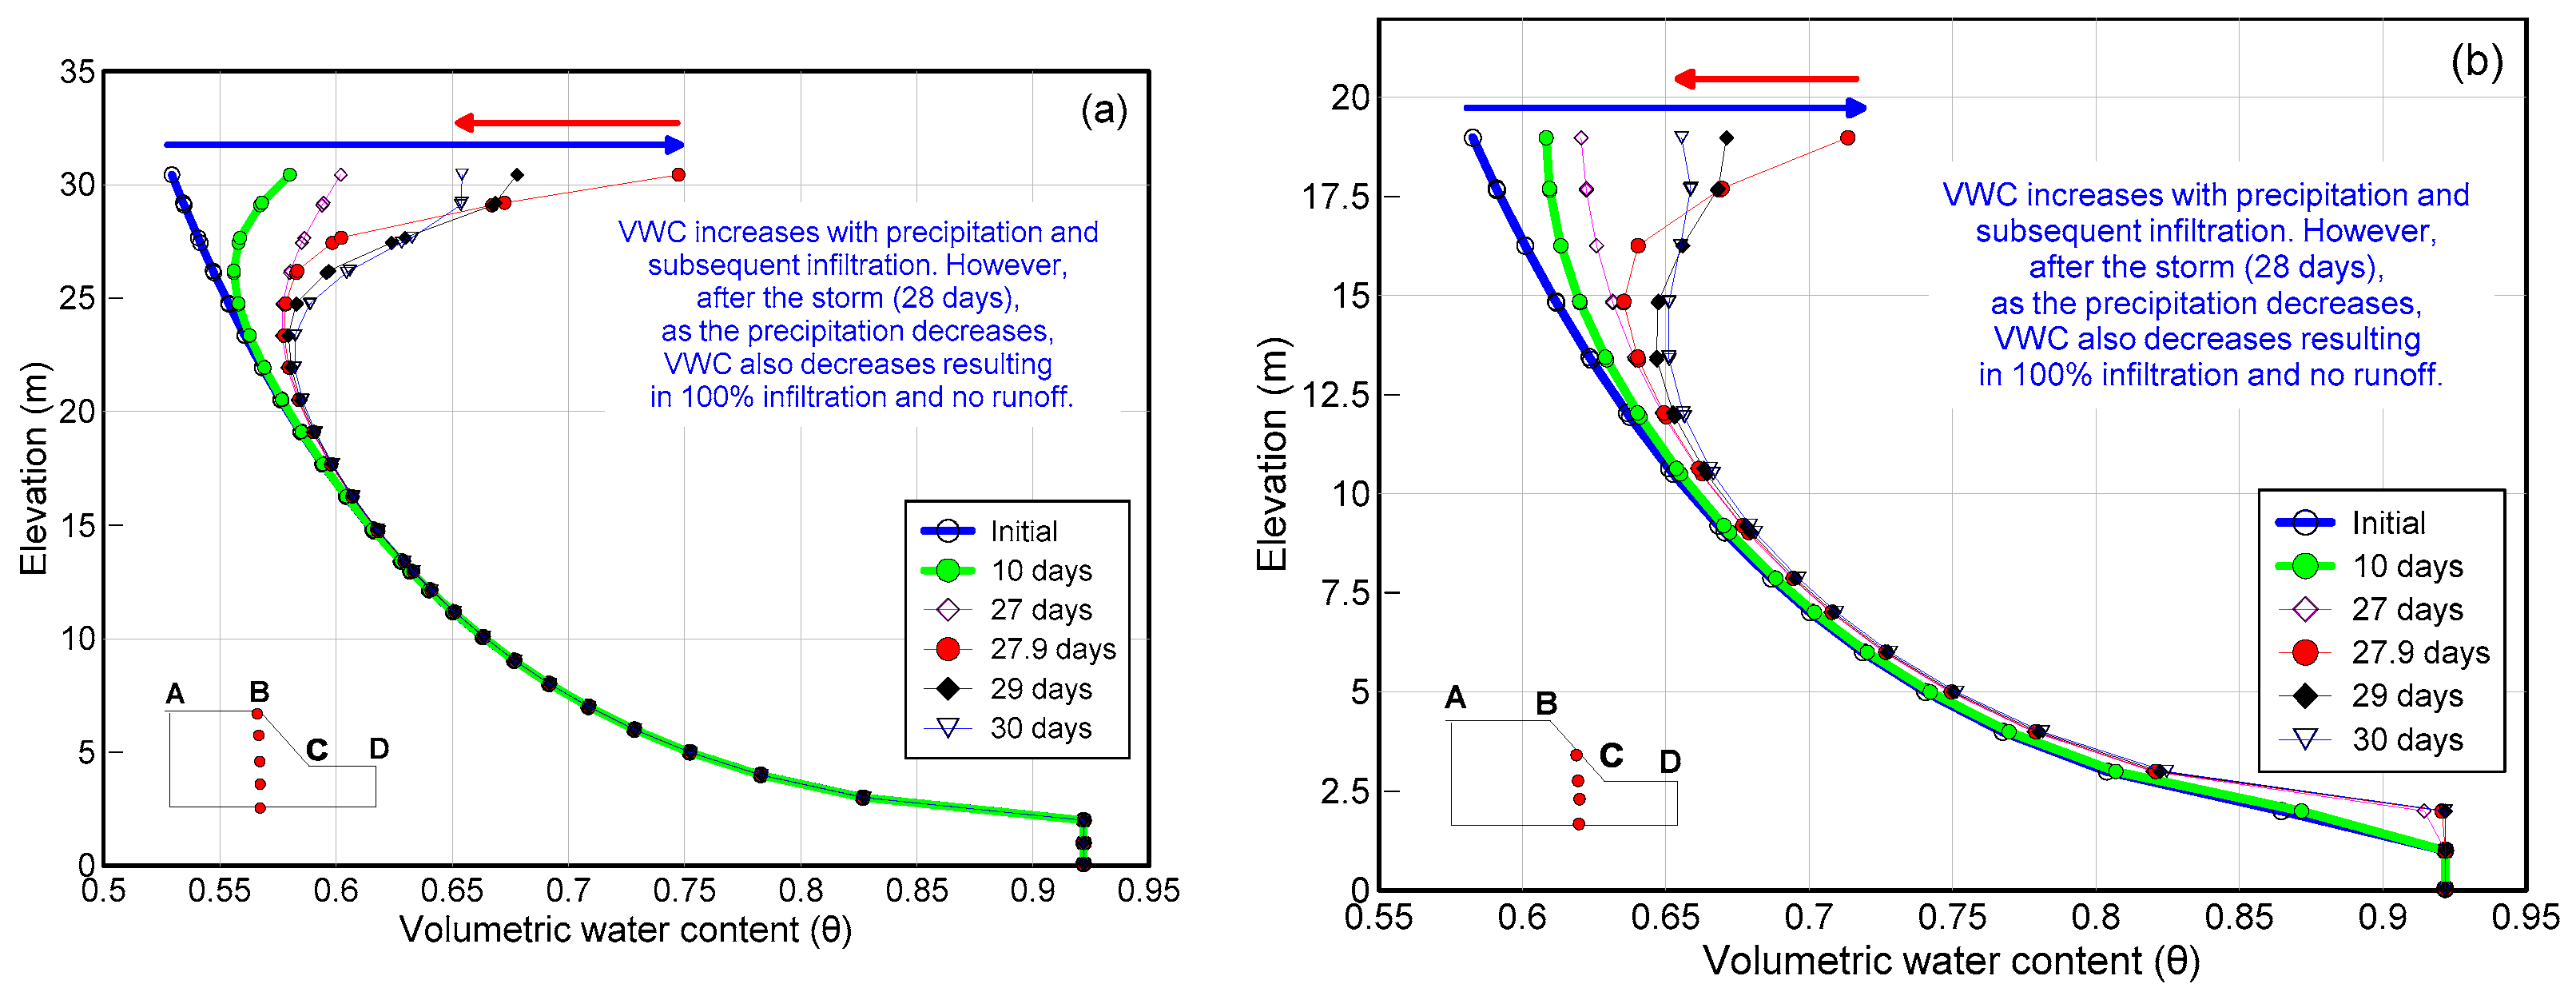
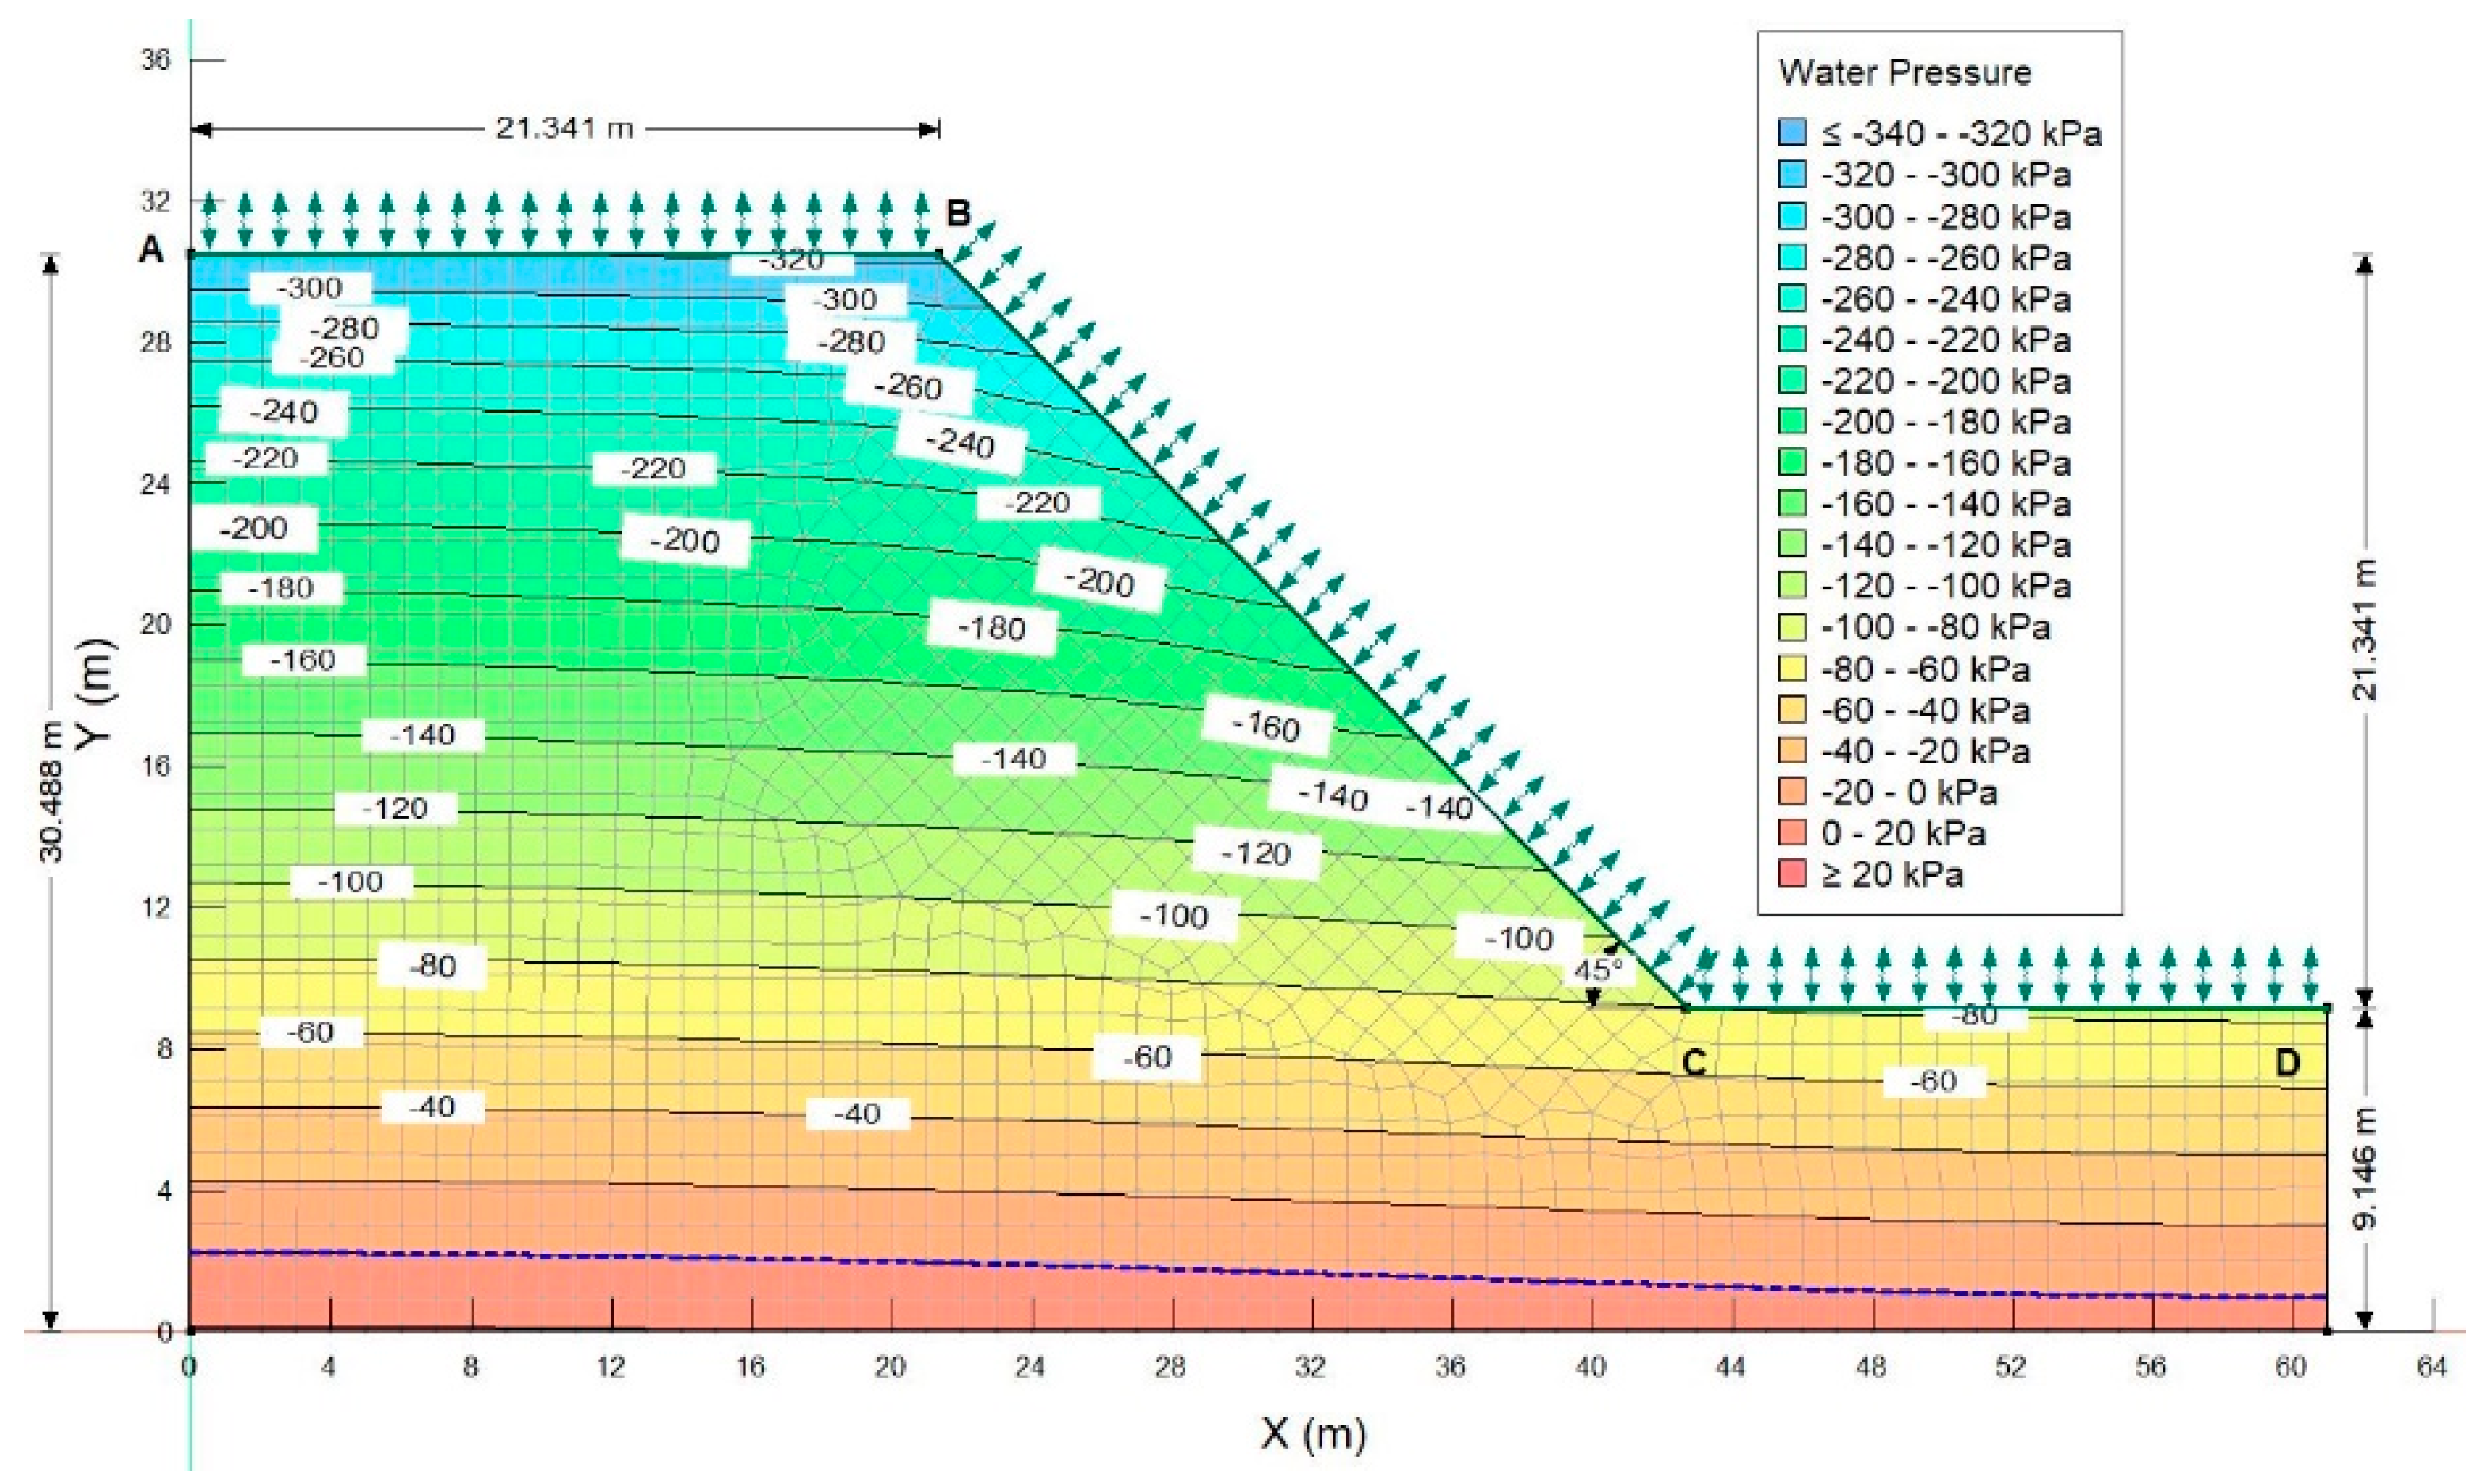
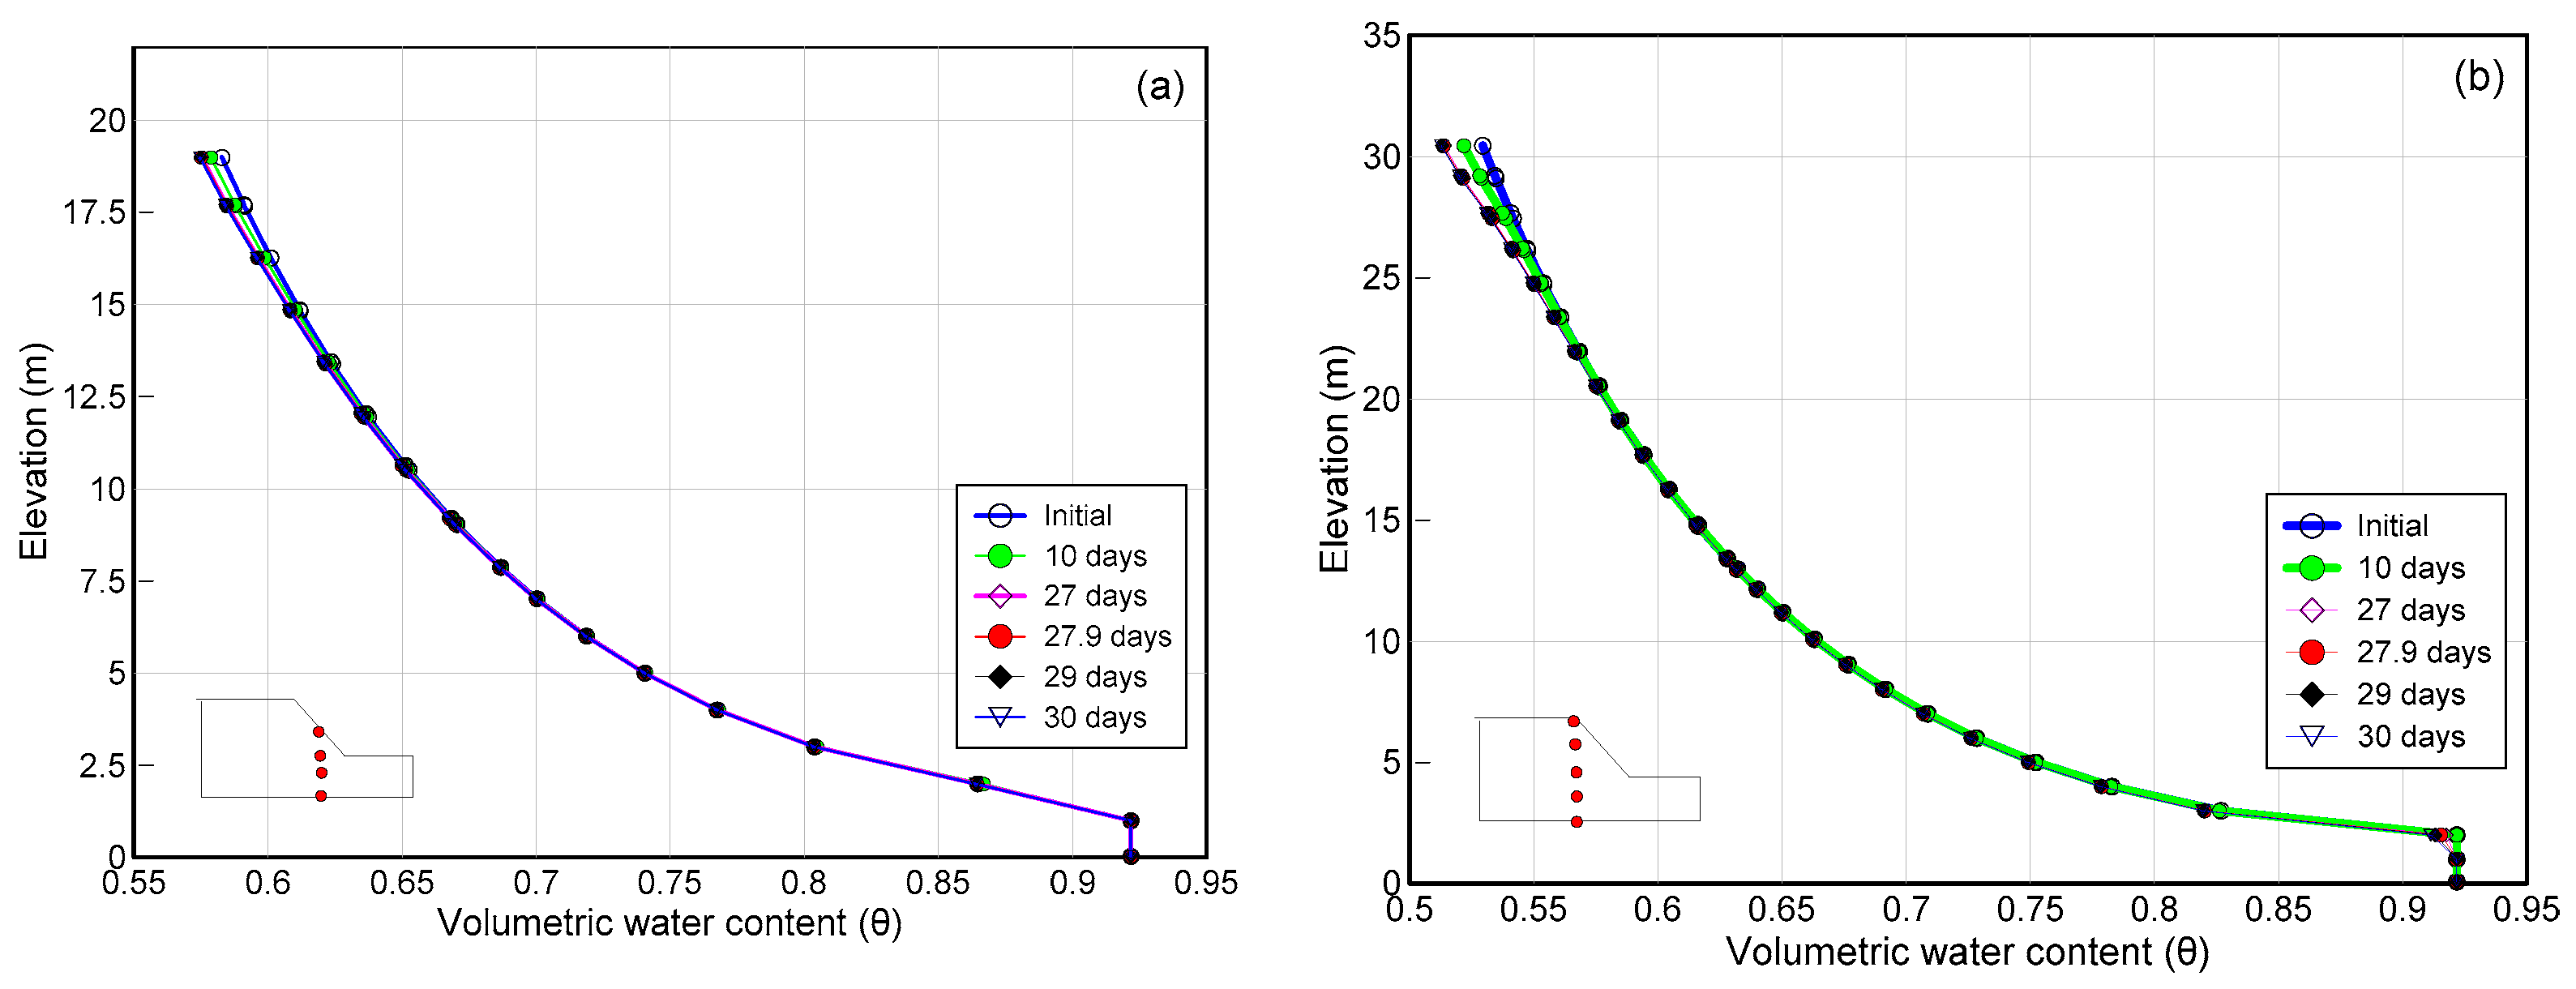
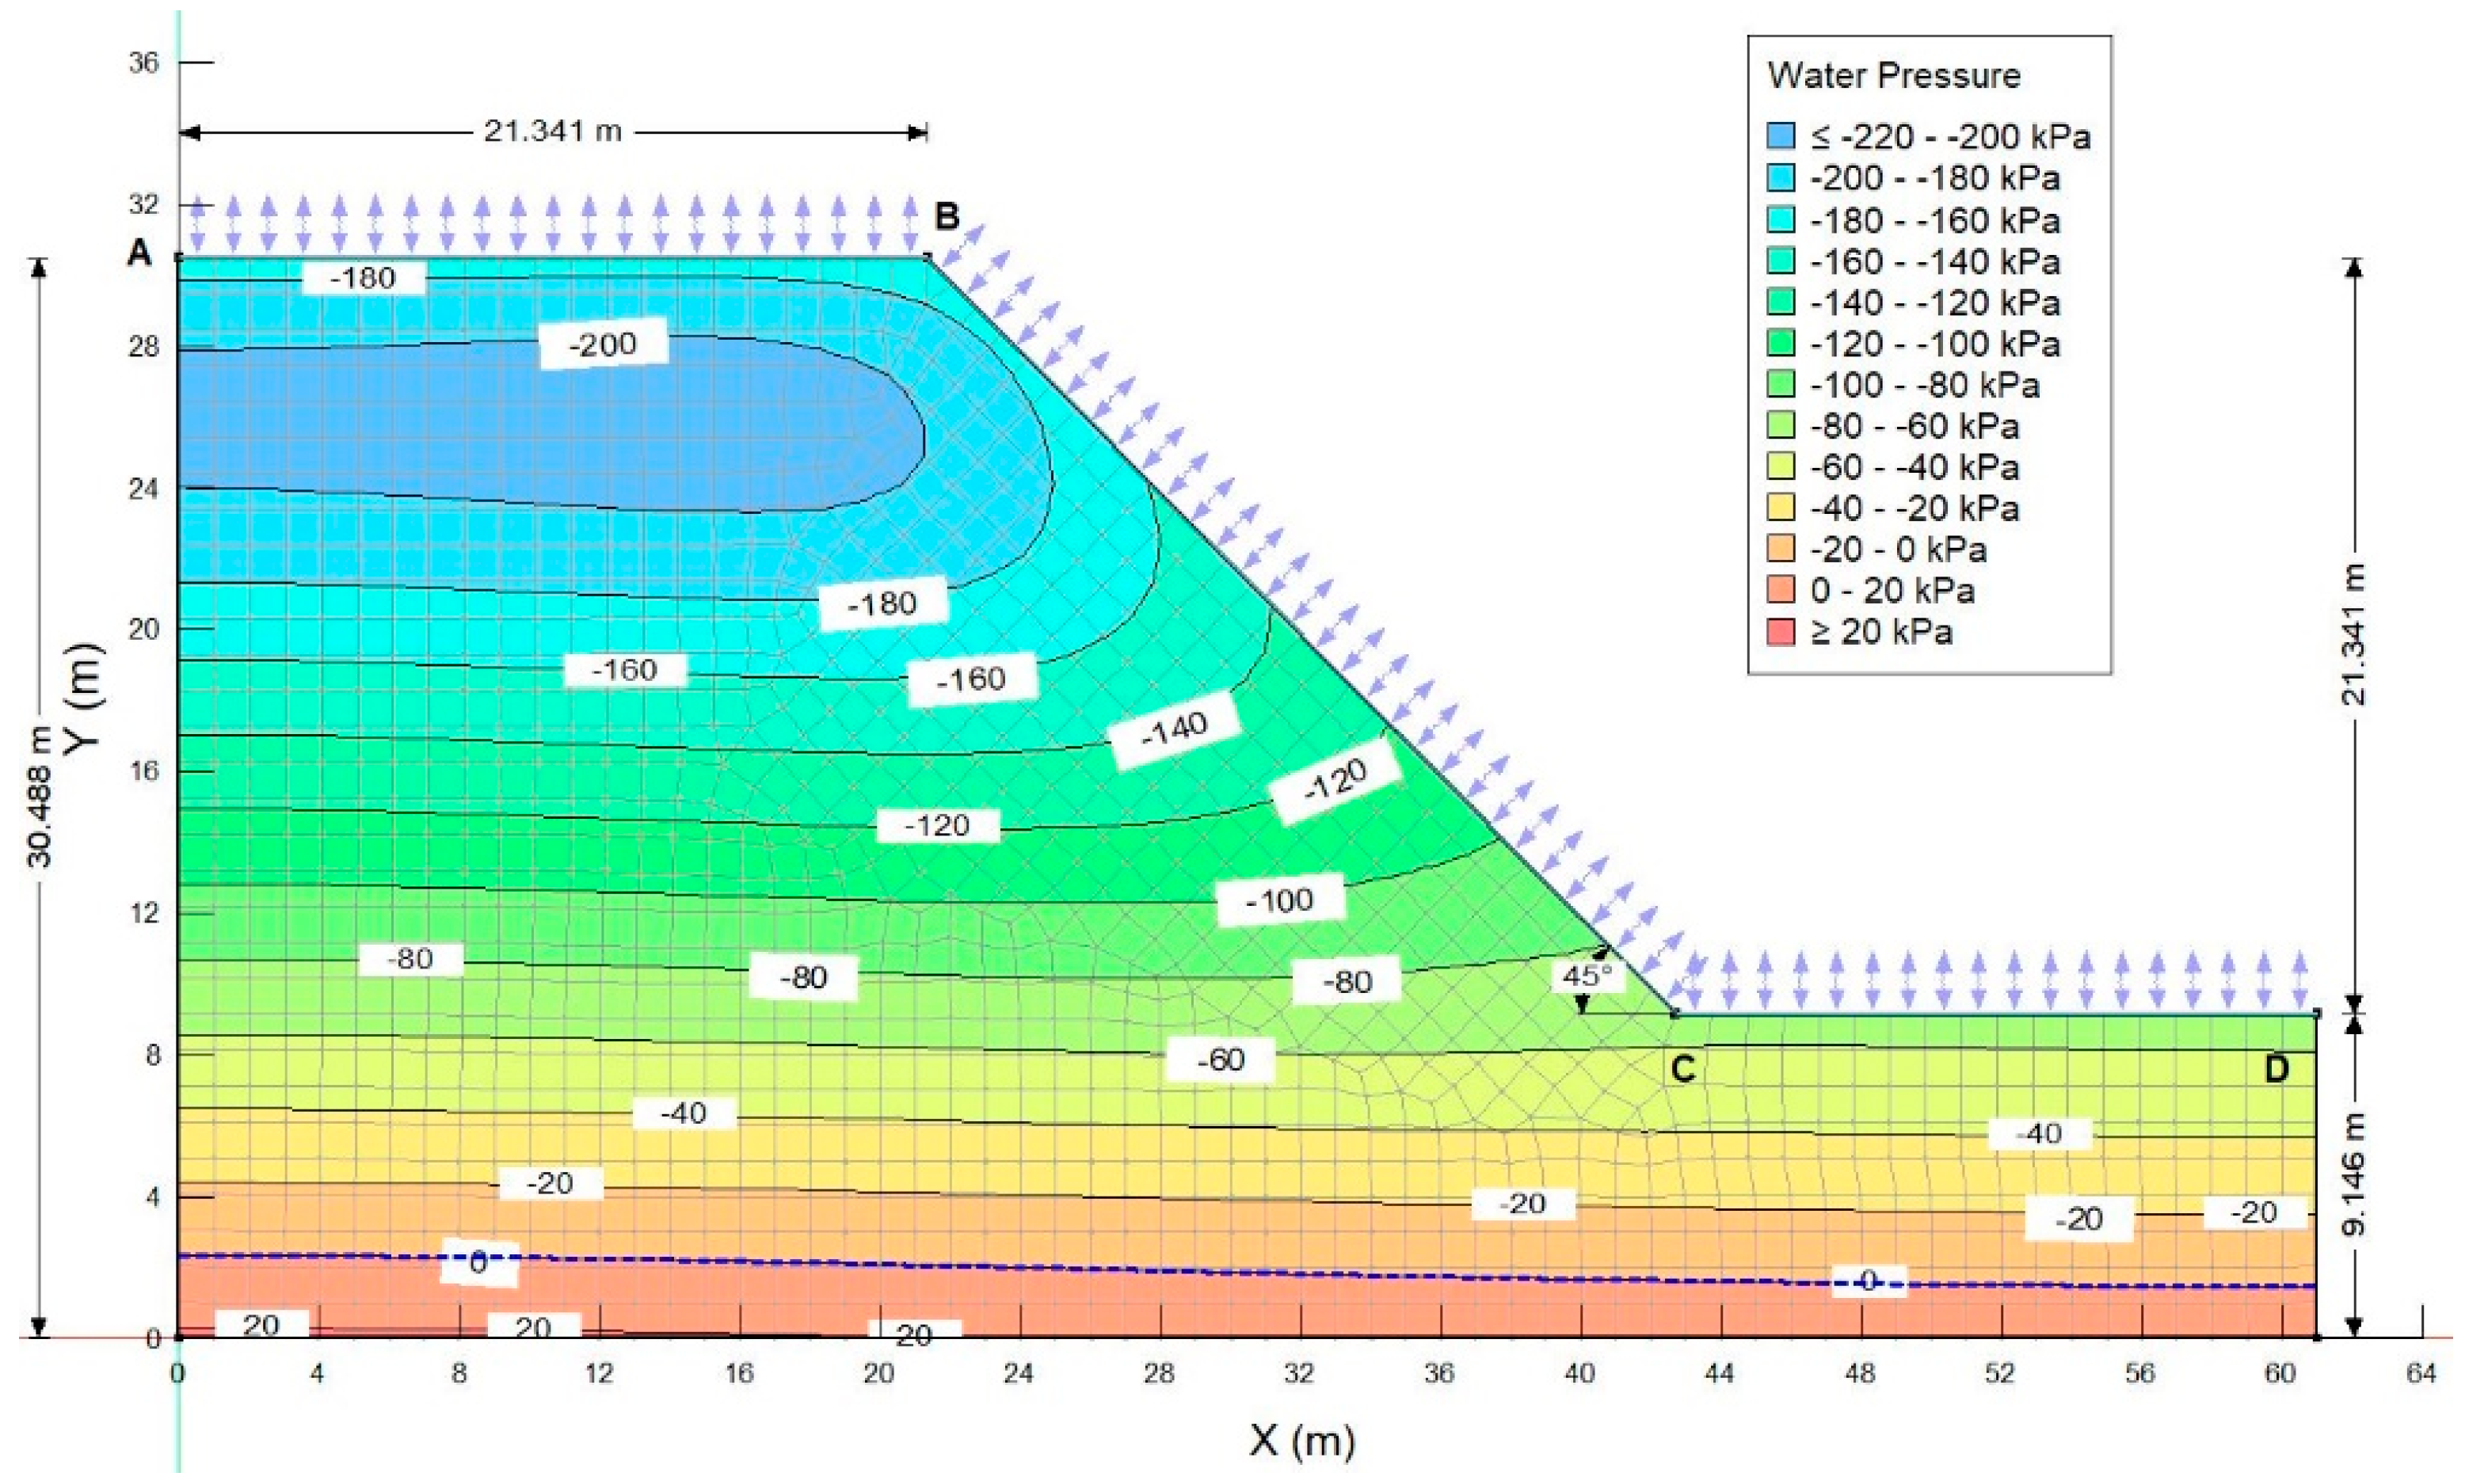
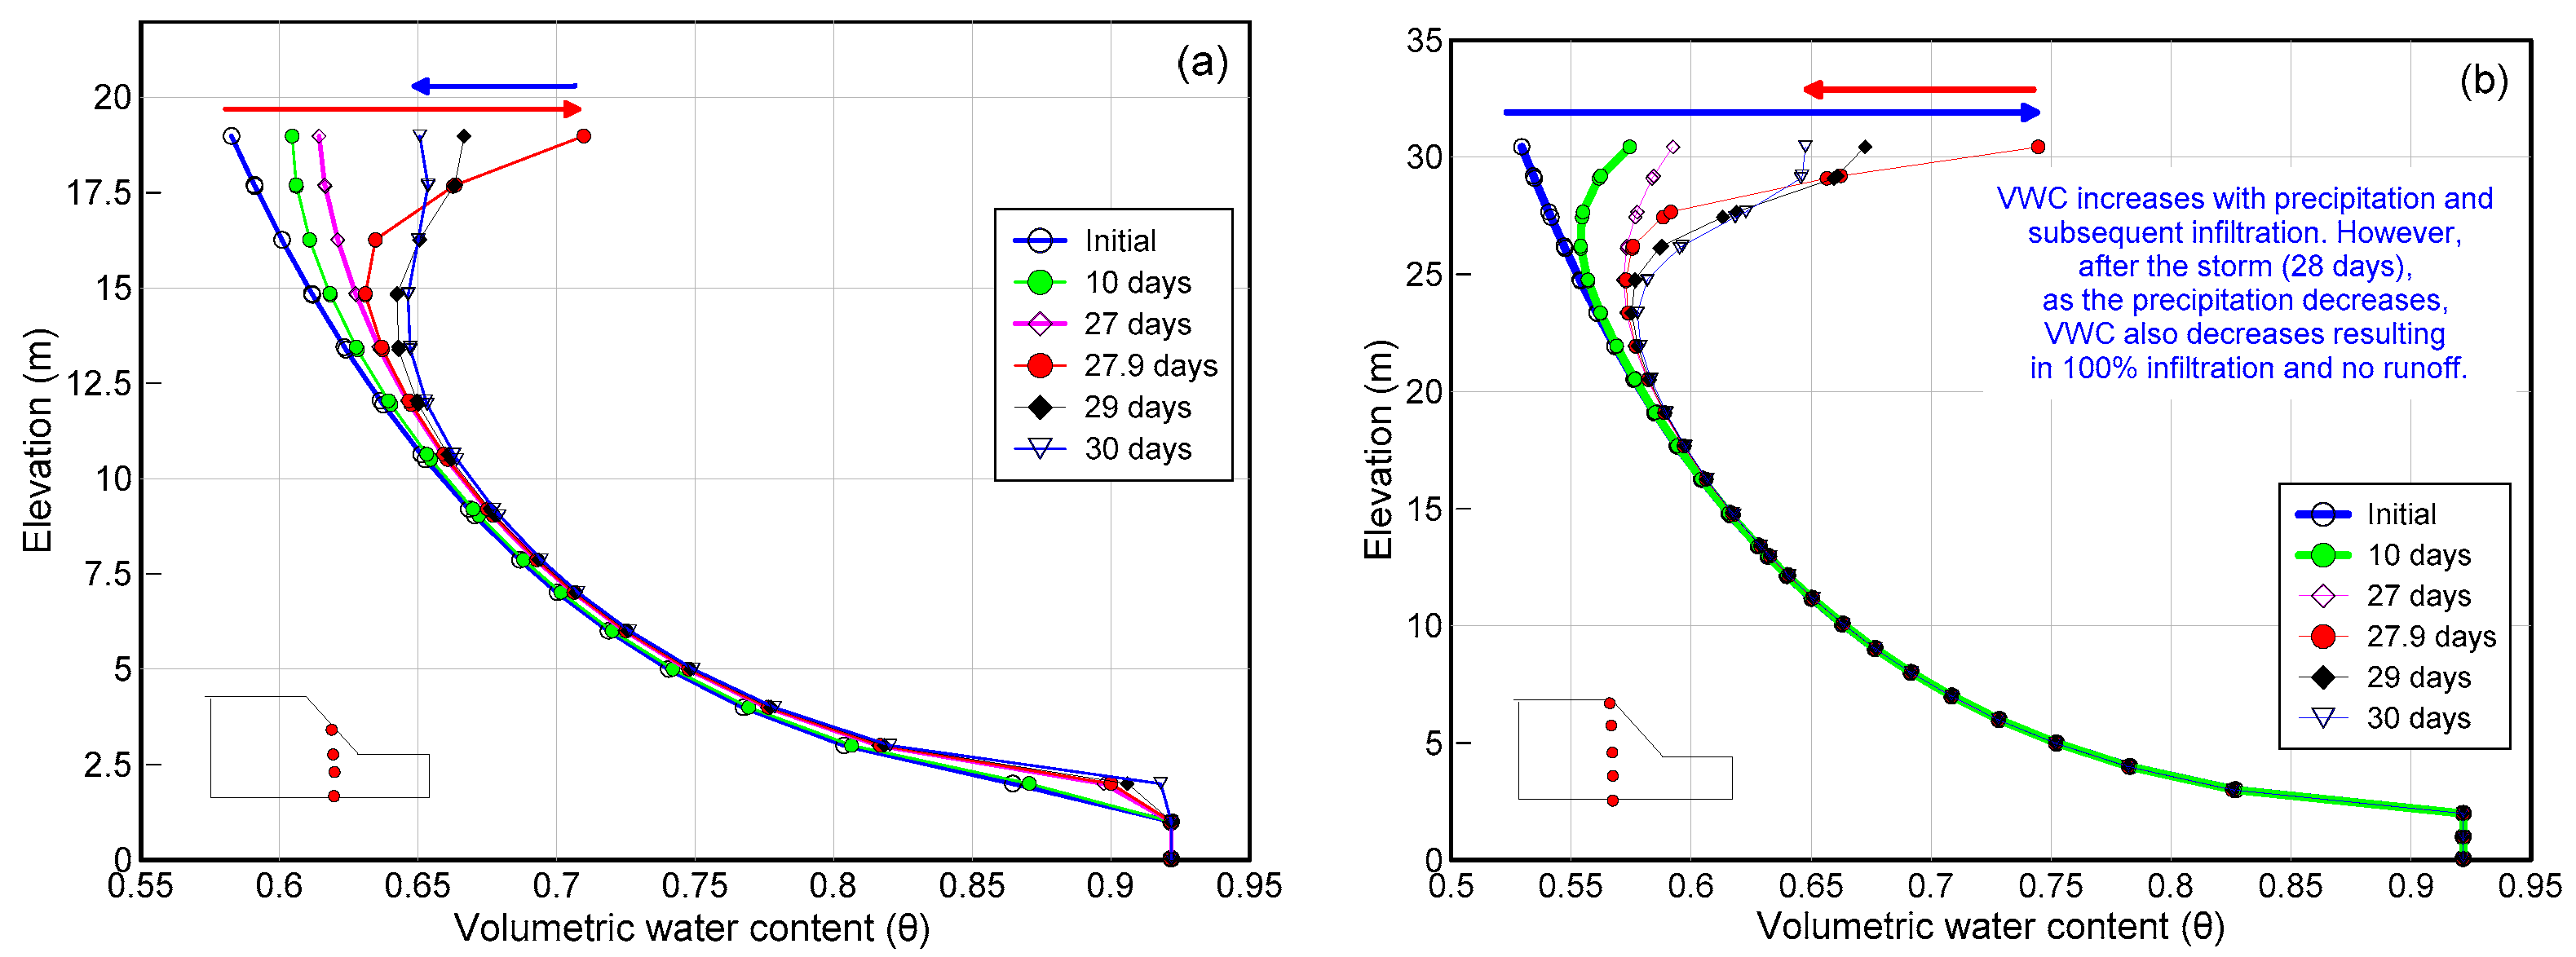
3.1.1. Rainfall-Induced Transient Seepage Analysis (Case (a))

Transient seepage analysis was performed for a 30-day period under the above explained rainfall simulation and PWP, net infiltration and surface runoff were monitored using finite element program, SEEP/W [30].
It can be seen through Figure 10 and Figure 11 that initially, on day 1, the PWP within the slope height is highly negative, that is, between −260 to −80 kPa, which essentially represents a dry climate period. The crest portion of the slope shows approximately −260 kPa of PWP. However, as the 26-day antecedent rainfall is applied, the PWP within the slope reduces gradually but at a slow rate resulting in the PWP between −60 to −160 kPa within the slope height. However, upon the application of a major storm at the beginning of the 27th day, the value of this PWP’s changes to between −40 close to the crest and slope to around −160 kPa at a shallow depth of about 2 m from the top horizontal and sloping climate boundary.
Figure 12a clearly shows that there is a drop in PWP, which may be the triggering cause of slope failure, which will be explained in the subsequent section. Nonetheless, this example simulates the mechanism of reduction in matric suction (negative PWP) resulting from rainfall-induced infiltration. The PWP, with respect to time at crest, mid slope and toe, as marked in Figure 12, are shown. This also indicates that it is more likely to have a slope failure where the top layer might slide over the bottom layer due to a sudden loss of matric suction in a short duration.
Cumulative infiltration, runoff and evaporation over the duration of a 30-day period were also plotted (Figure 8b). It can be seen from Figure 12b that the entire amount of precipitation that fell on the top climate boundary (ABCD) infiltrated into the slope and there is no runoff generated. To better understand the reason behind this, the VWC profile was plotted with respect to depth at all time steps (Figure 13).
The SWRC (Figure 4) illustrates that the saturated VWC (θs) of the slope soil is very high, that is, θs = 92.27%. This also means that the water retention capacity of the soil is very high. Based on the initial matric suction in soil, the in situ VWC (θ) is much less than θs. Hence, all the water from rainfall will infiltrate into the hillslope and there will be no runoff generated as seen from the plot of rainfall, infiltration and runoff shown in Figure 12b. However, the plotted profile, that is, θ versus depth (Figure 13) shows that the VWC of soil increased with the precipitation event, but it never exceeded the value of θs. This also suggests possibility that continuous precipitation for long period, that is, beyond 30 days, could eventually lead to complete saturation and hence, ultimately result in runoff.

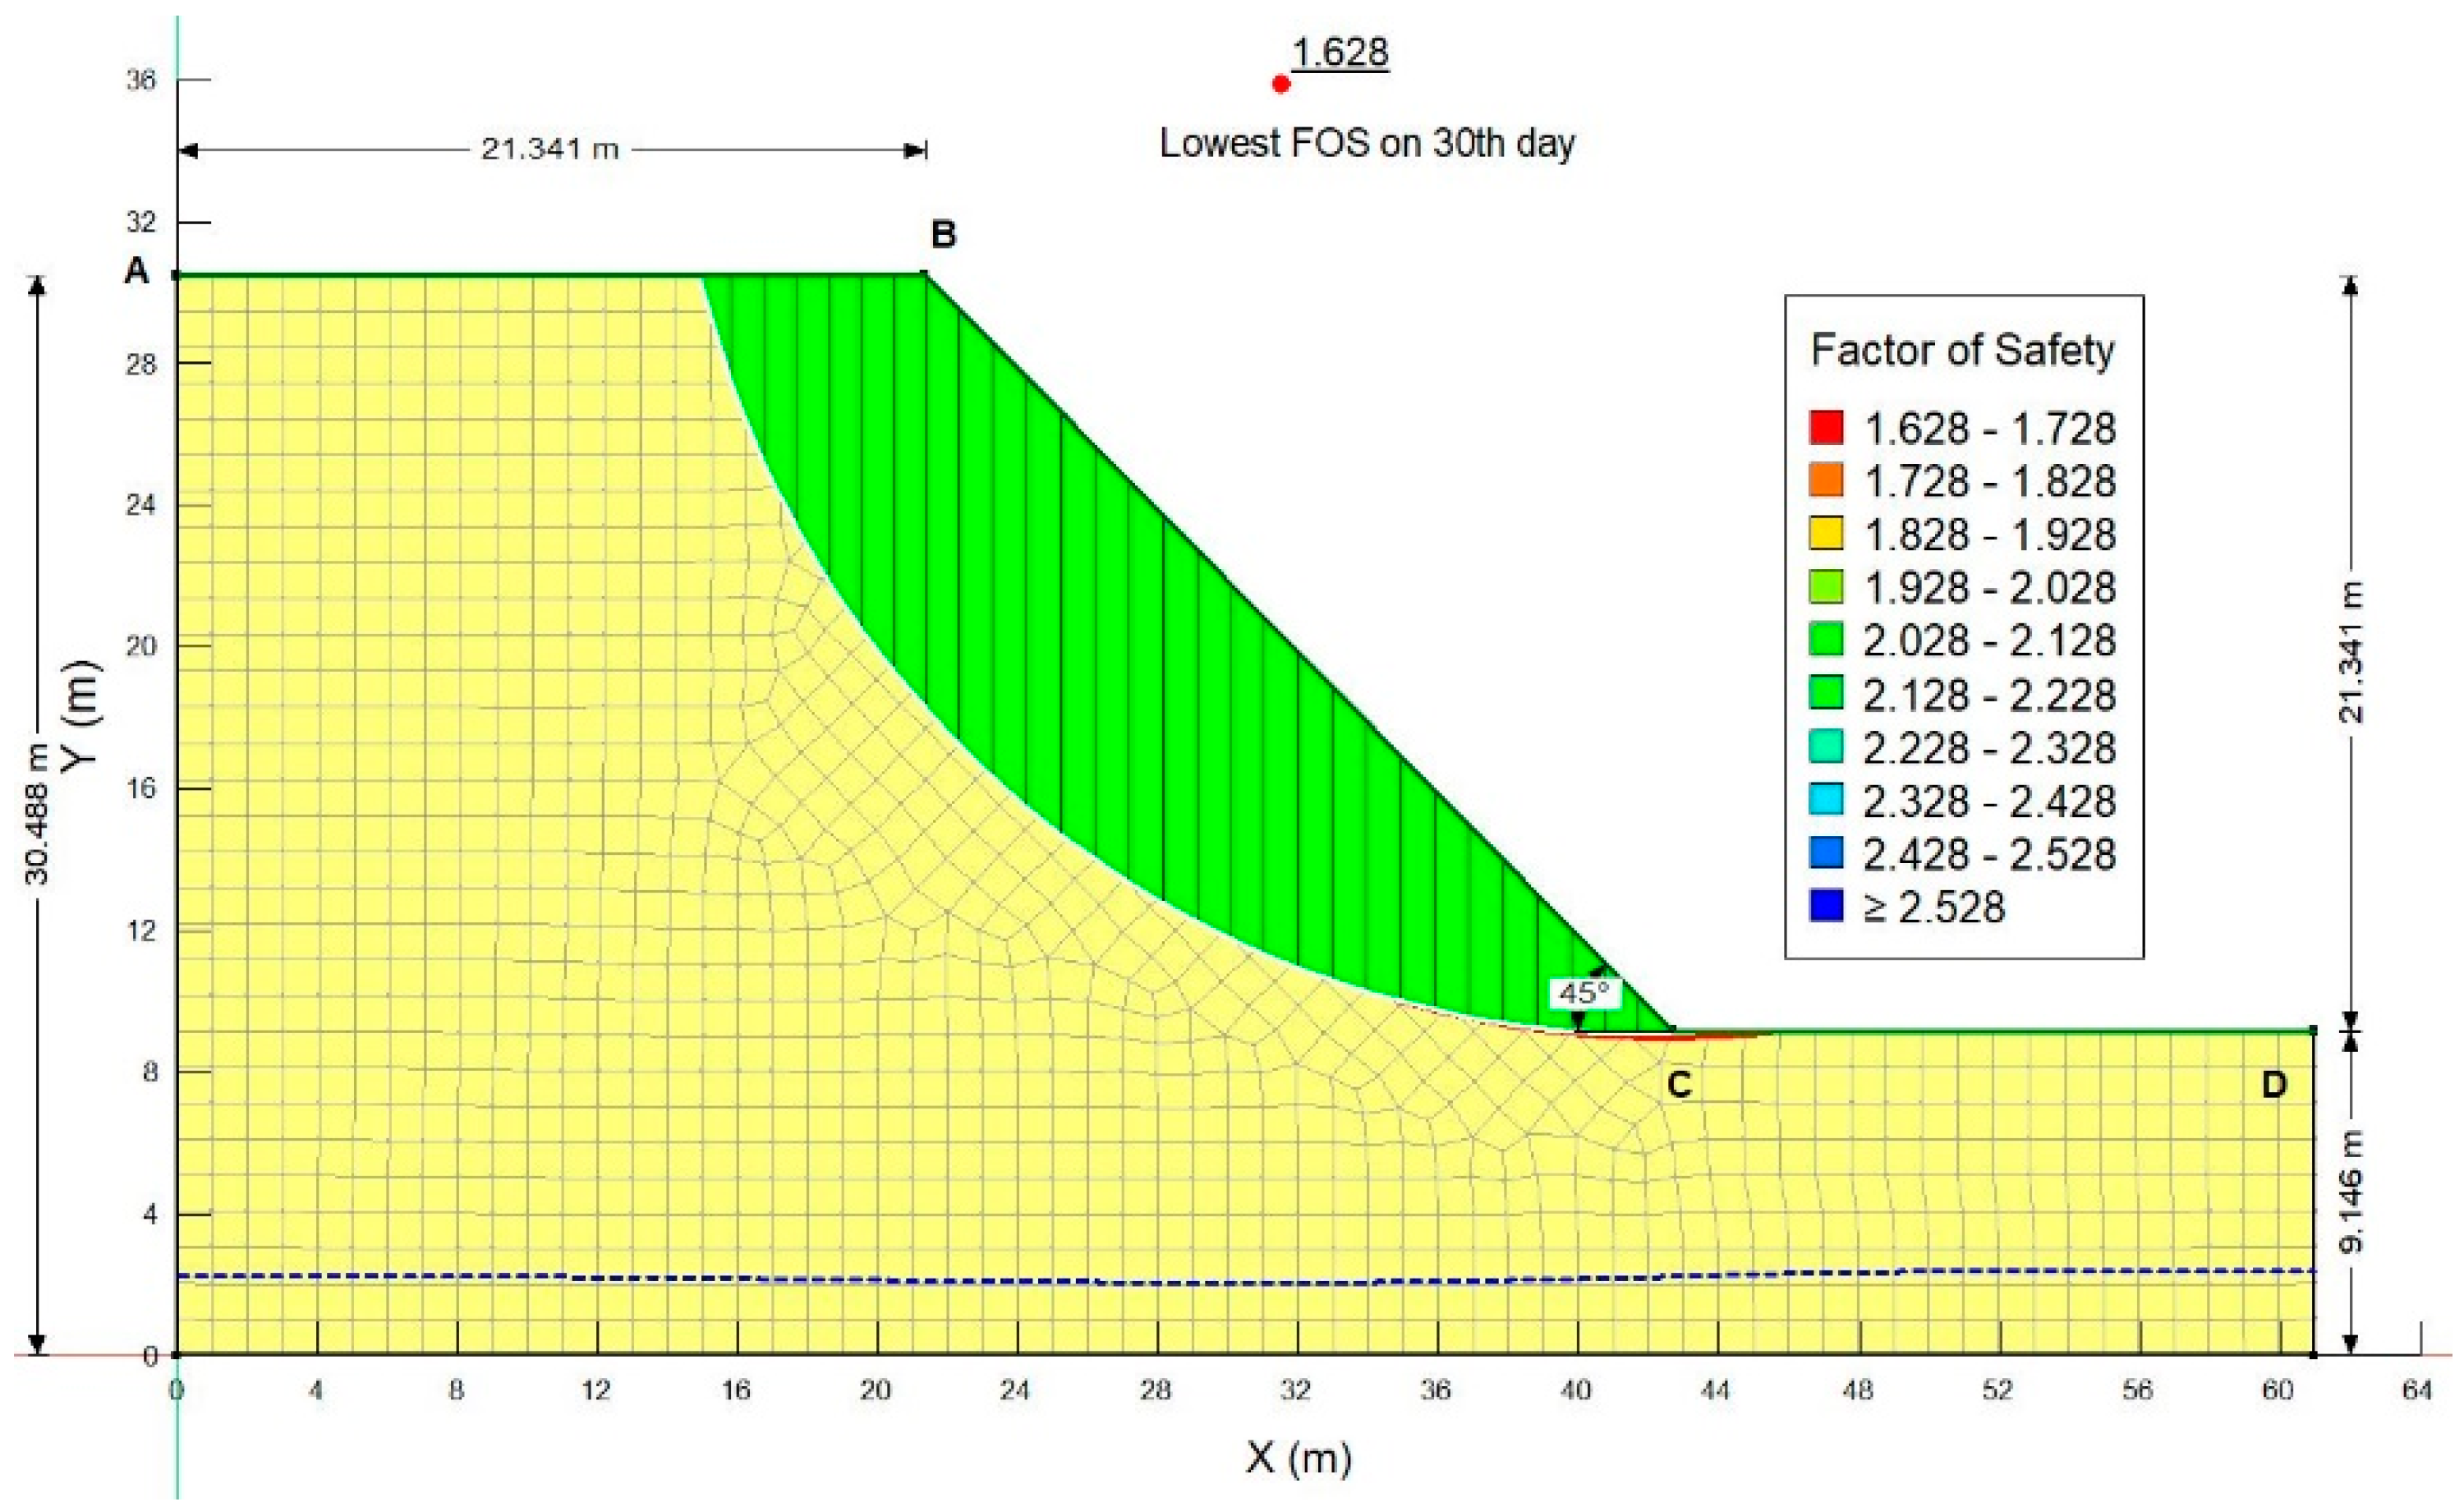
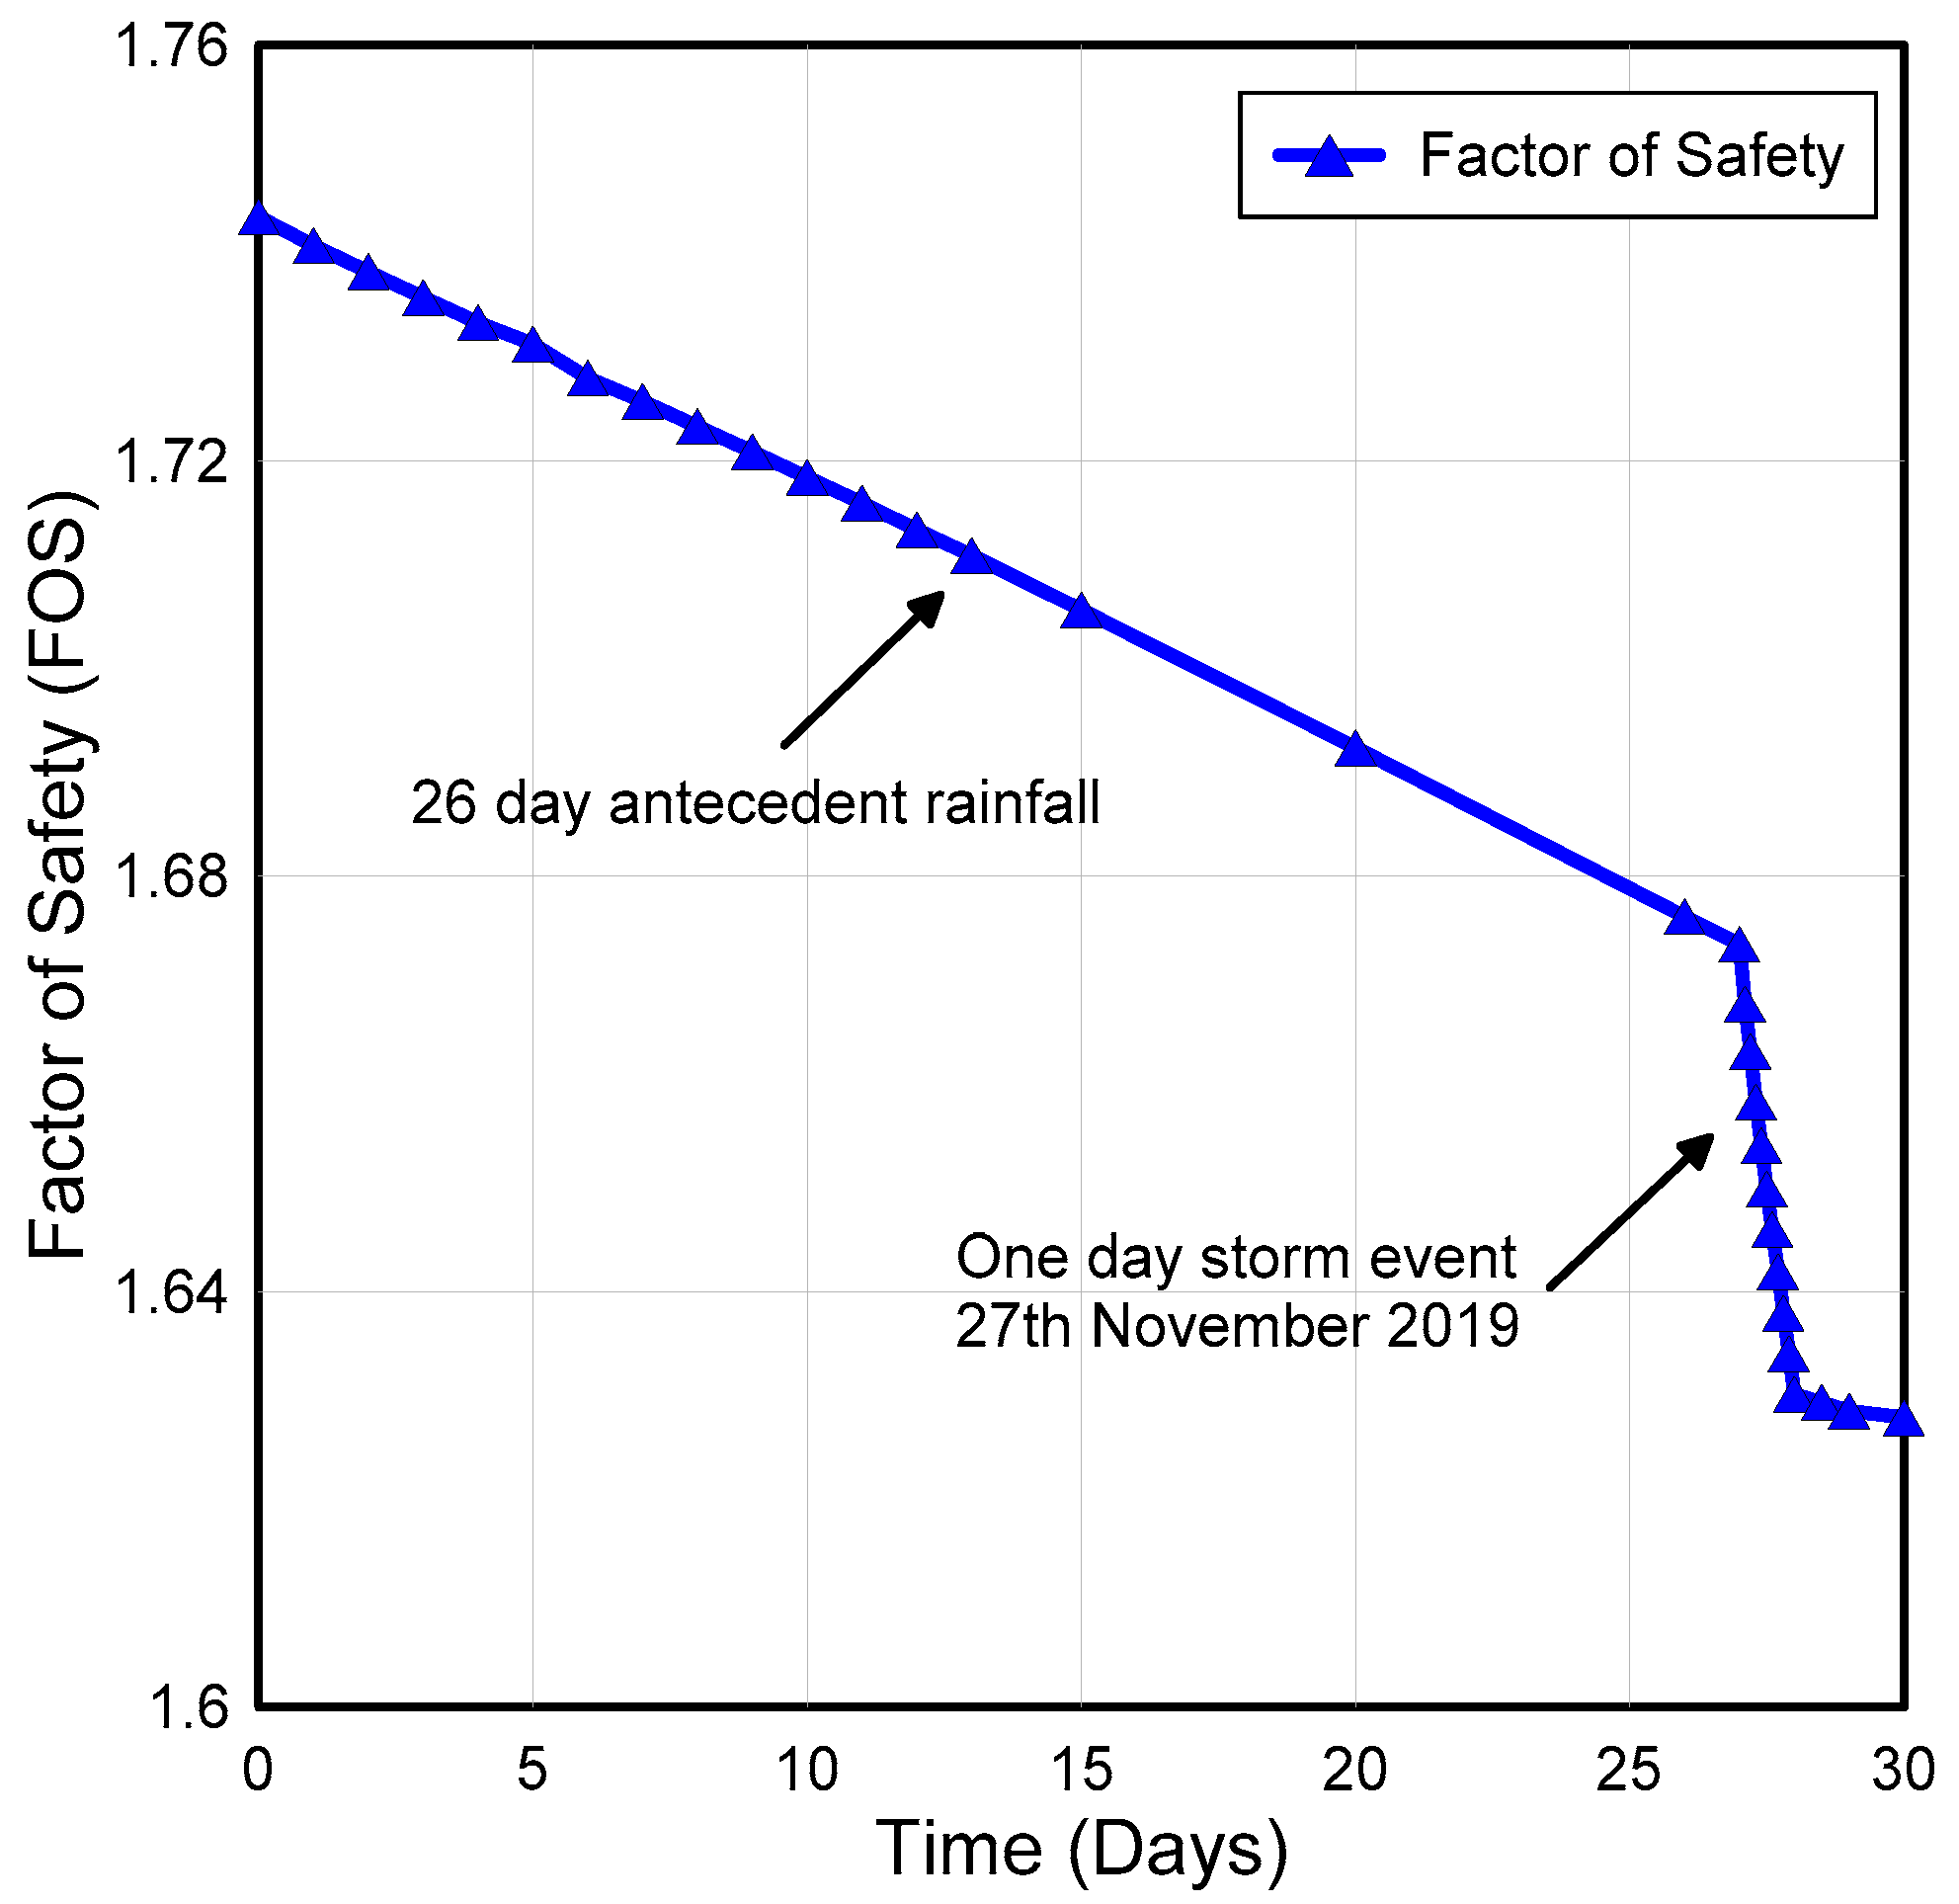
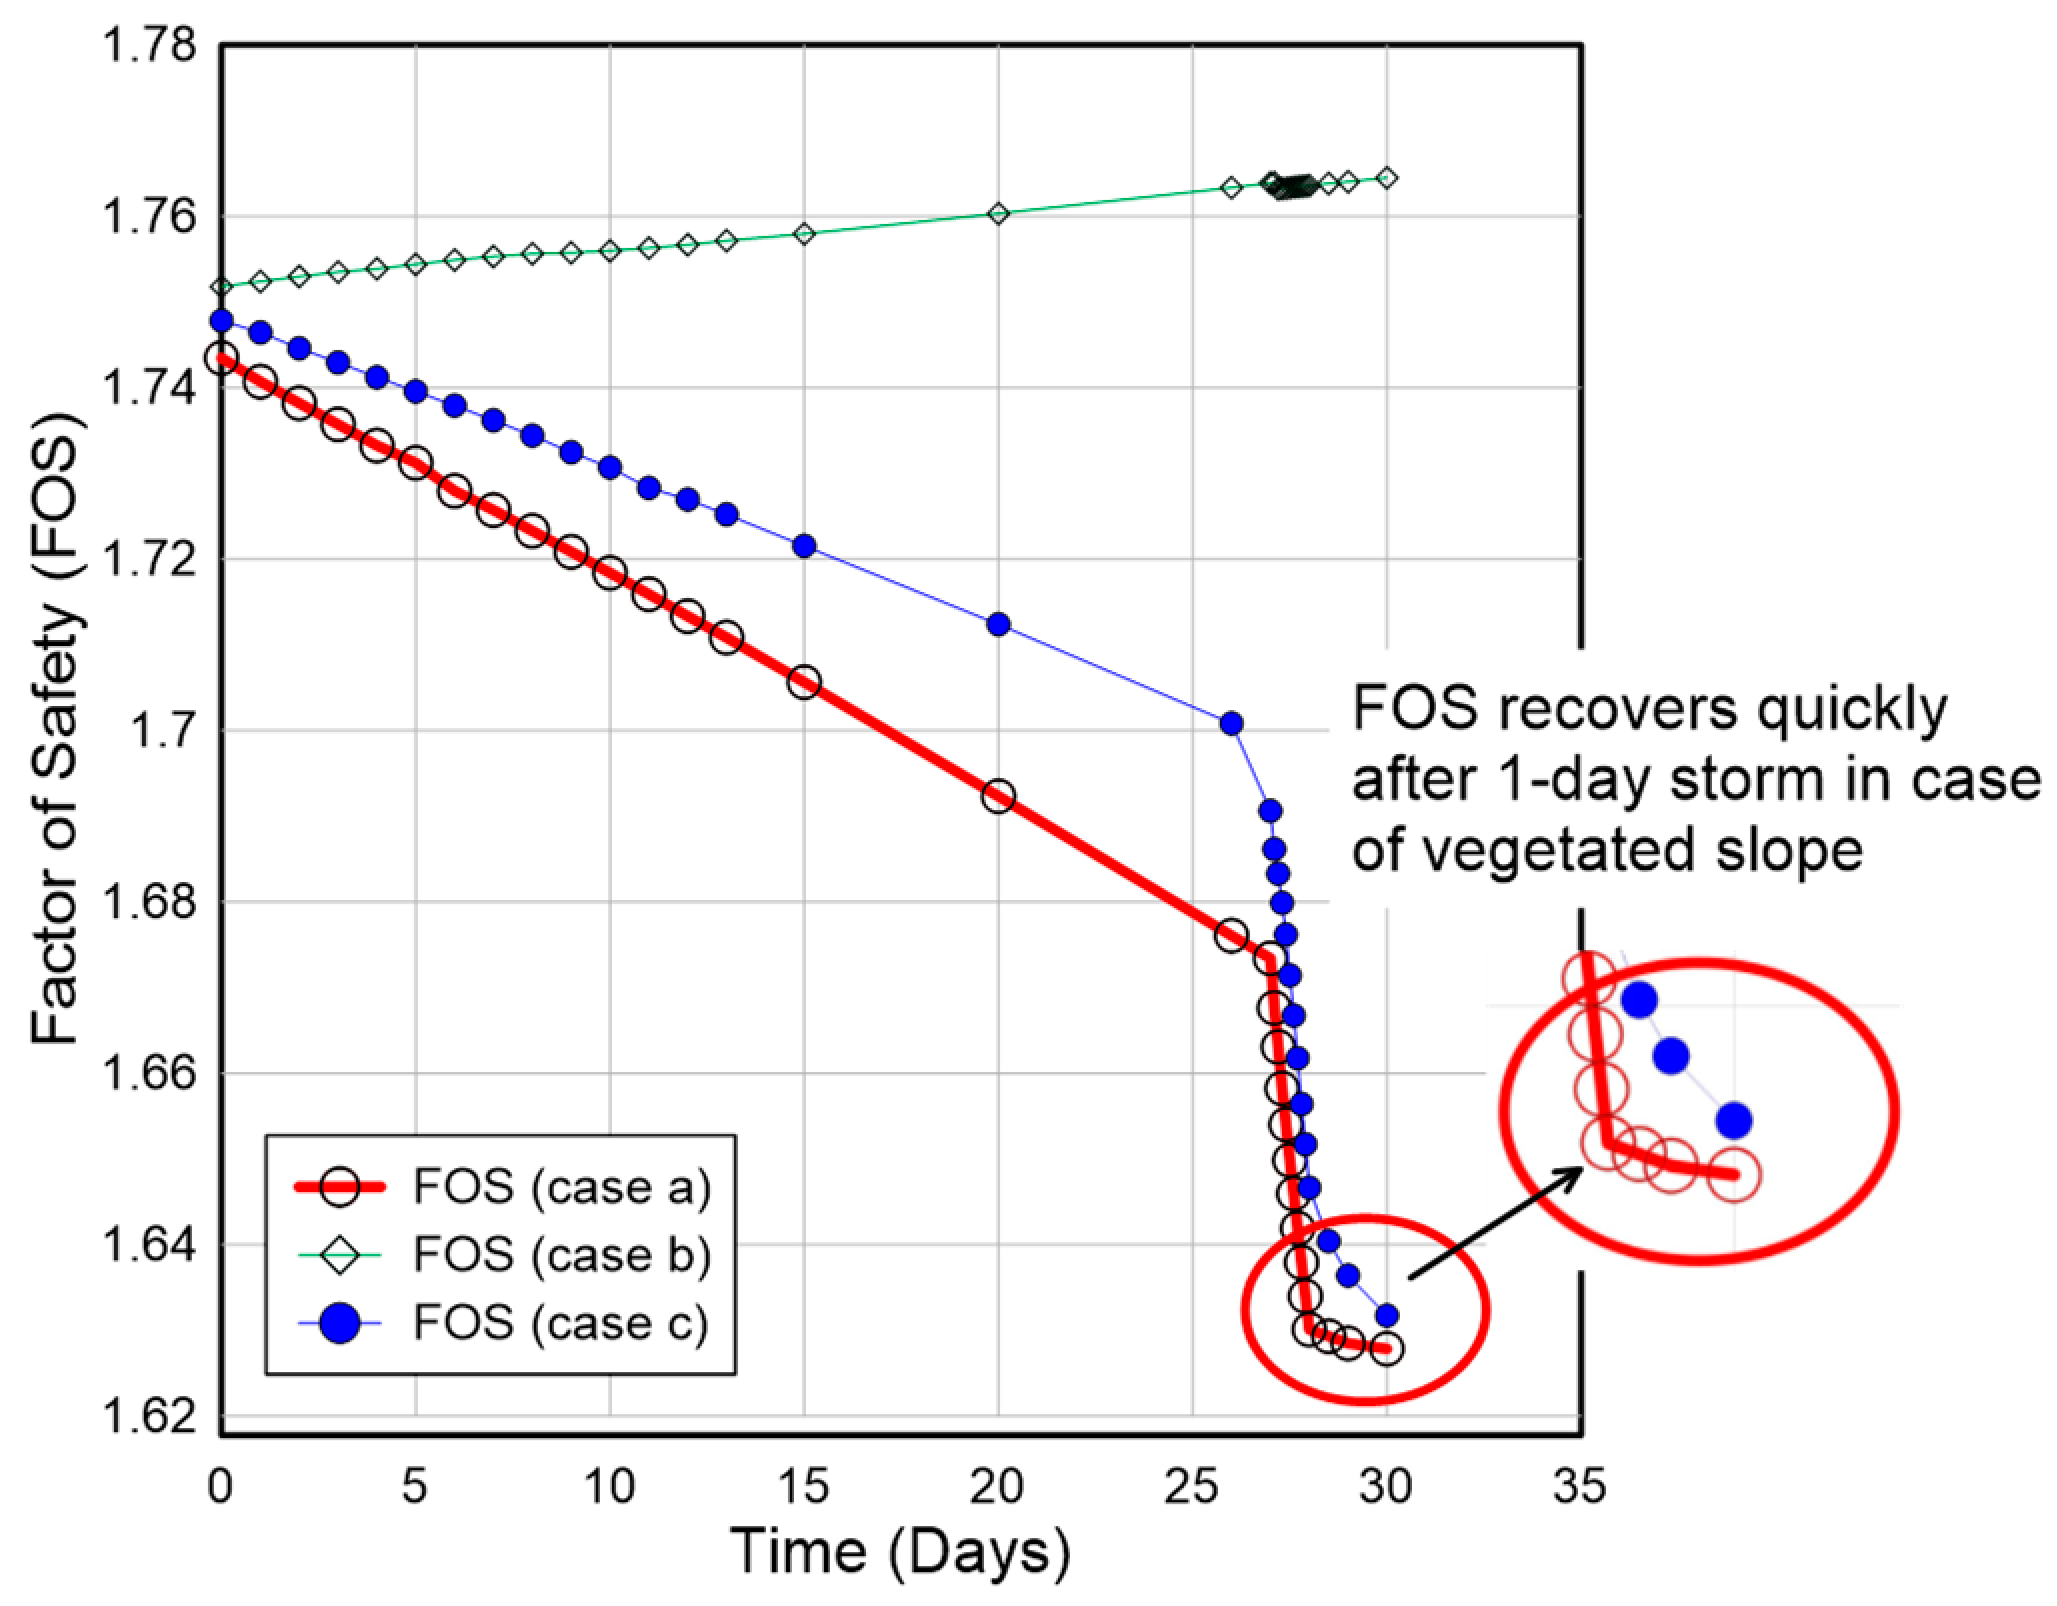
3.1.2. Hydro-Mechanically Coupled Slope Stability Analysis (Case (a))

The transient PWP profiles for all 30 days were imported into SLOPE/W [31] to perform the seepage coupled slope stability analyses. The classic limit equilibrium method of slices-based Morgenstern and Price [32] analysis with “entry and exit” search technique to identify critical failure surface with minimum FOS was used. The transient PWP profiles at an interval of 1-day up to the first 27 days and thereafter at 27.3, 27.6, 27.9, 28, 29 and 30 days were imported from previously mentioned transient seepage analyses. When soil is unsaturated, there exists a negative pore water pressure, uw, relative to the pore air pressure, ua, within the soil matrix. The numerical difference between pore air and pore water pressure, that is., (uauw), is also called matric suction. The overall effect of the presence of suction is manifested in the form of an increase in shear strength. There exists a highly non-linear relationship between this apparent increase in shear strength with respect to suction (Vanapalli et al. [6]; Lu and Likos [7]; Patil et al. [8,9]). In this study, the Vanapalli et al. [6] method is used to model the unsaturated shear strength as a function of soil suction based on VWC, residual water content and soil water characteristic curve properties for each layer as below.
s = c + σ n u a t a n + u a u w θ w θ r θ s θ r t a n     ,
wher, s = overall shear strength of soil; θw = volumetric water content; θs = saturated volumetric water content; θr = residual volumetric water content. If variation of volumetric water content, θw of soil with respect to suction, that is, SWRC, is available, then one can predict the unsaturated shear strength using the Vanapalli et al. [7] equation. However, this shear strength equation reduces to saturated shear strength as the matric suction and hence the last term in above equation drops to zero. Above equation has been implemented in SLOPE/W and was used in this study. The factor of safety was then determined using SLOPE/W software of GeoStudio by importing PWP profiles at each time step. The initial FOS using the Morgenstern and Price method is 1.743. Further analysis of results shows that FOS drops down after the application of 26-day antecedent rainfall at a very gradual rate to a minimum of 1.673 at the end of the 26th day. With the application of a major storm on the 27th day, the FOS decreases rather quickly to 1.628 by the end of the 30th day (Figure 14 and Figure 15).
A close examination of the compromised failure surface indicates that this lowest FOS has occurred on the 30th day, which is after the end of storm Kammuri. This increase of PWP due to rainfall-induced saturation, which indirectly results in reduction of matric suction, can be described as a drained phenomenon, that is, independent of the deformation of a slope during sliding. The reduction in suction and increase in the weight of soil due to saturation resulted in a decrease in effective strength leading to a decrease in the value of FOS. Clearly, the analyses illustrate the effect of rainfall in decreasing the stability of the hillslope.

3.2. Case (b): LCI without Rainfall

The effect of vegetation in improving the stability of slopes via root water uptake is studied through this case study. Precipitation data have been excluded from LCI data. Vegetation data, including climate data such as air temperature, relative humidity, wind speed and net radiation, was used. Vegetation data, including leaf area index, plant moisture limiting factor as a function of matric suction, monthly vegetation data such as root depth over time, normalized root density versus normalized root depth and relationship between soil cover fraction and leaf area index, that were used in this analysis are illustrated in Figure 16, Figure 17 and Figure 18.

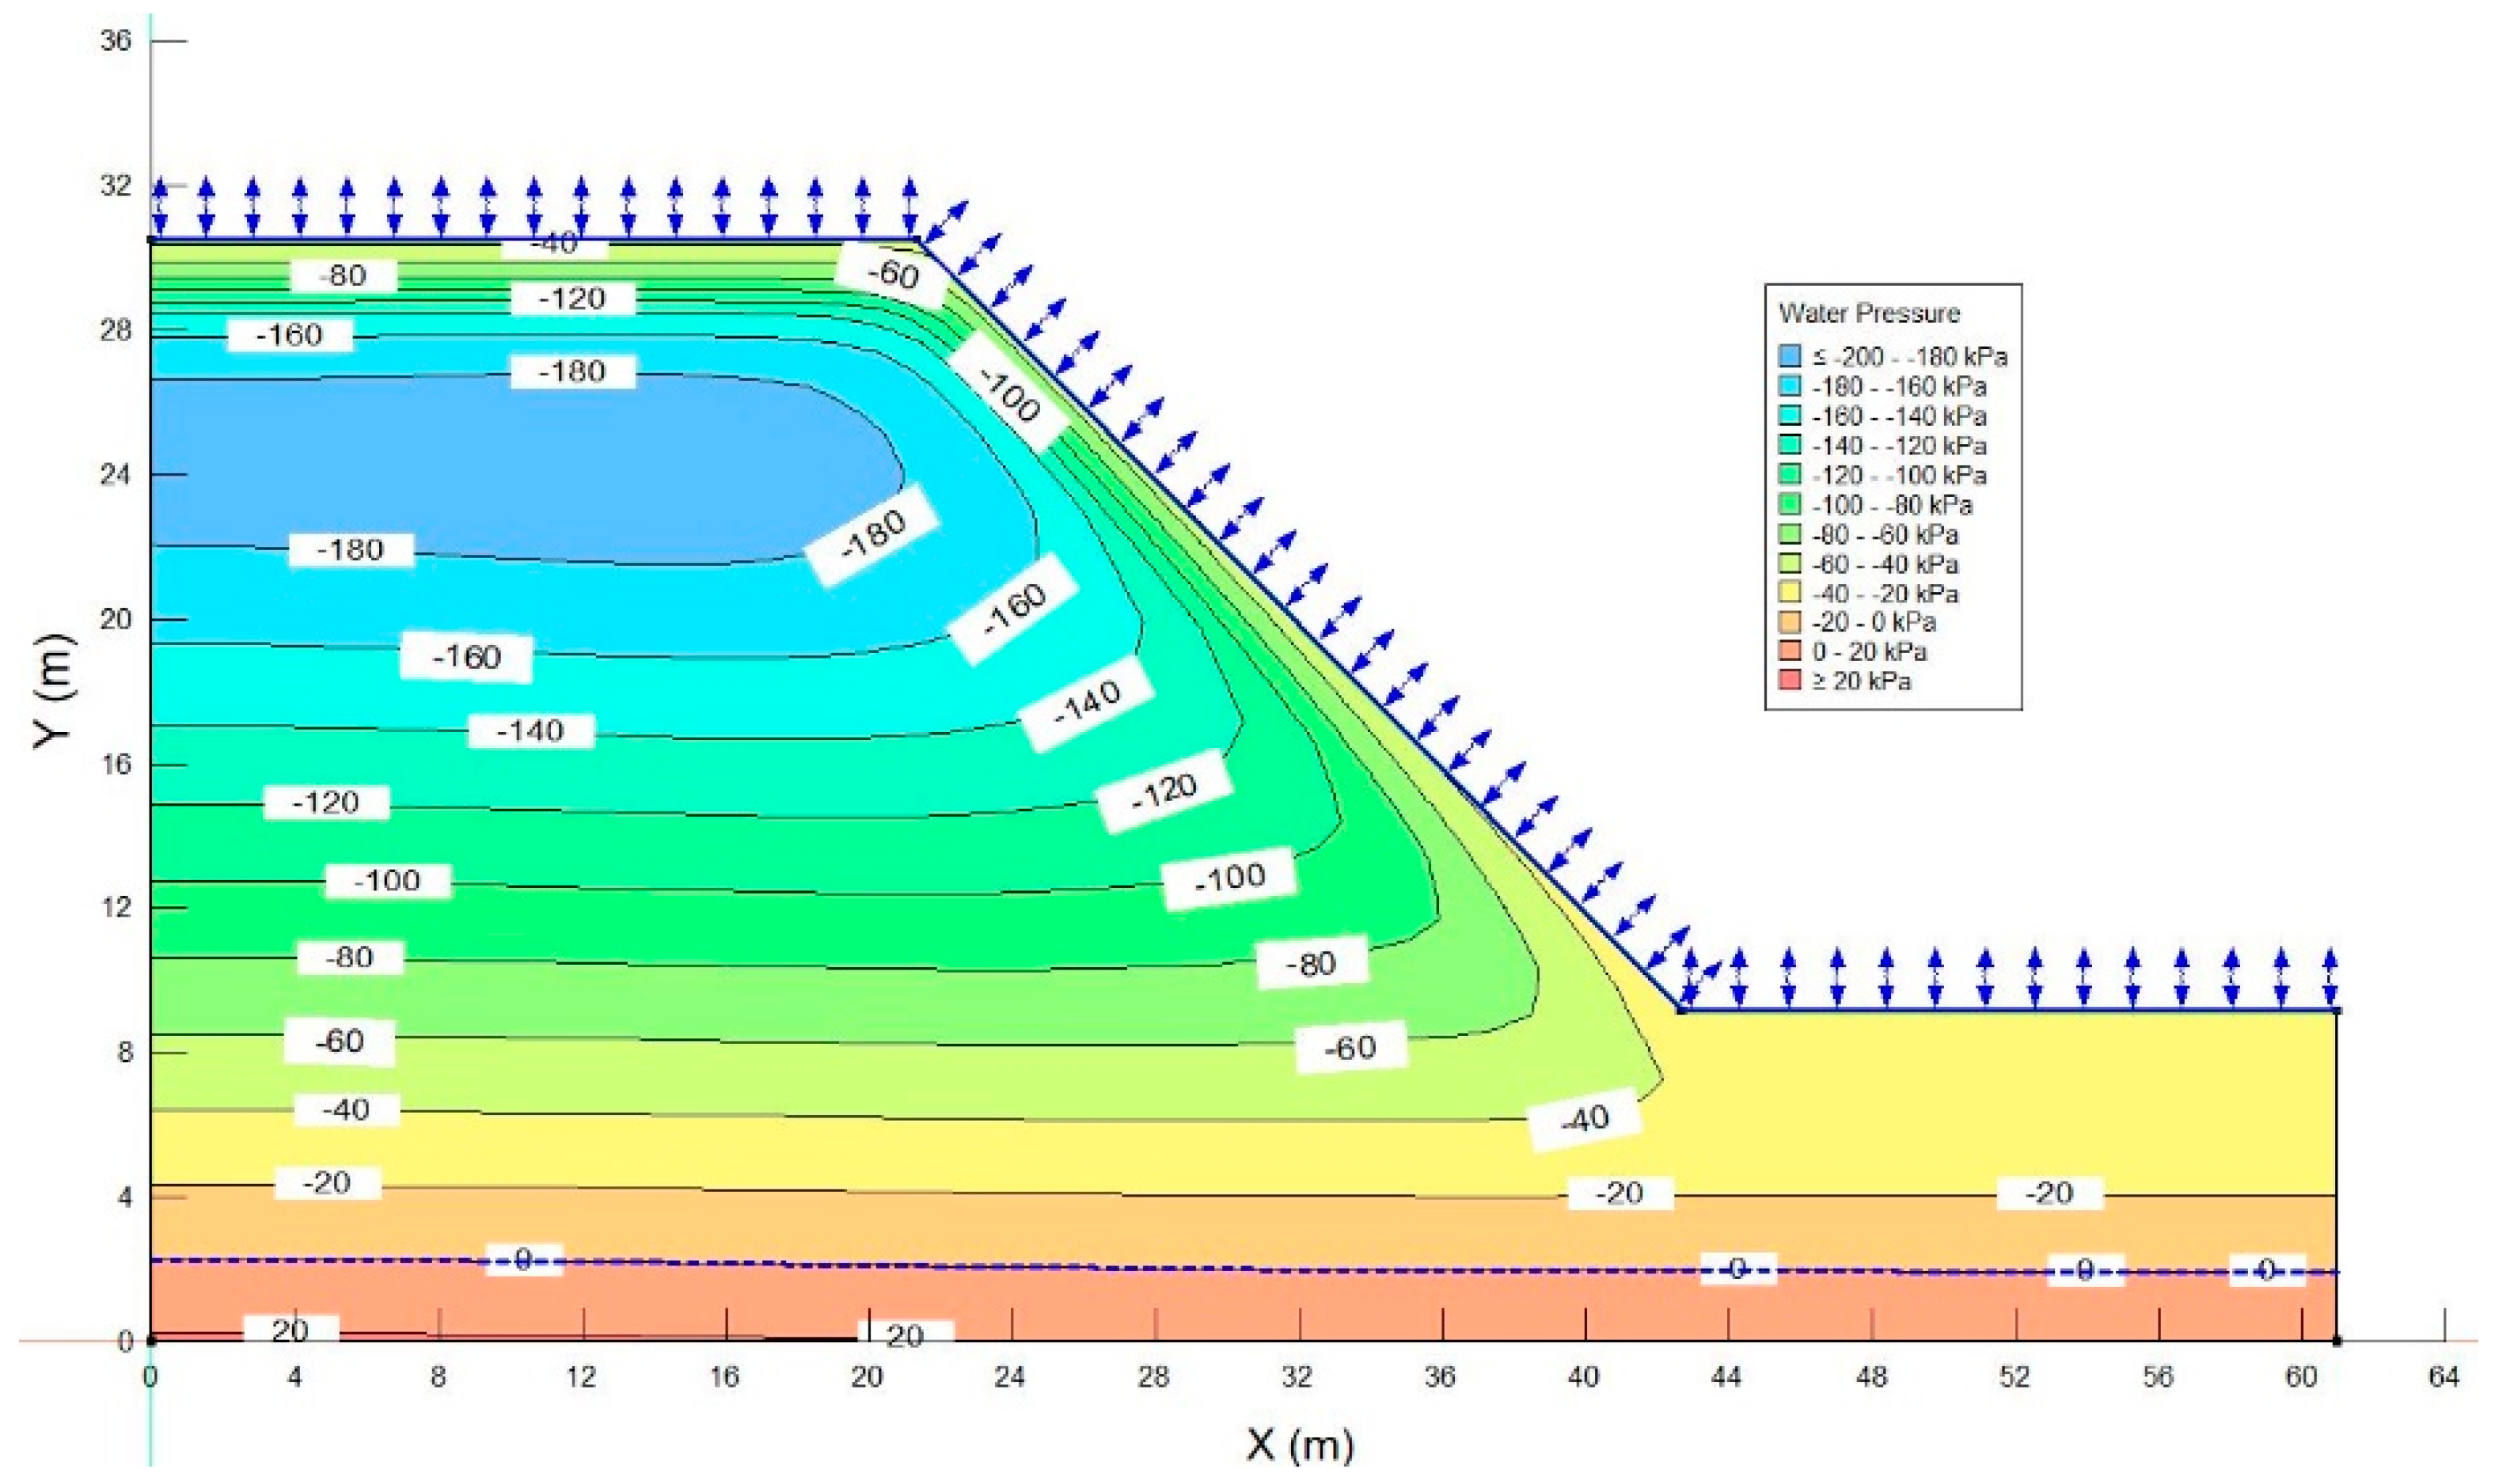
3.2.1. Rainfall-Induced Transient Seepage Analysis (Case (b))

Again, transient seepage analysis is performed for a 30-day period using finite element program SEEP/W [30], considering the vegetation effect without rainfall. Although, not shown here, the initial PWP profile remains the same as in case (a).
However, the presence of vegetation causes root water uptake (RWU) from the top layer of the soil within the root zone, which causes loss of moisture and an increase in matric suction. This can be readily seen from figures showing the PWP contours at the initial (0 day), and 30th days, that is, Figure 10 and Figure 19, respectively. Figure 20 illustrates the magnitude of cumulative potential evapo-transpiration (PET), transpiration (via RWU) and evaporation from the surface boundary of the slope in response to the vegetation–climate interaction with land in the absence of rainfall.
Clearly, the effect of reduction in VWC is relatively more at the crest than at the mid slope, which is as expected (Figure 20). Also, the PWP became more negative with time as the RWU increased in the absence of rainfall. In addition, the PWP was highly and relatively more negative at the crest than at the mid slope and toe portion at a shallow depth (Figure 21).
Figure 22a illustrates the magnitude of the cumulative potential evapo-transpiration (PET), transpiration (via root water uptake) and evaporation from the surface boundary of the slope in response to the vegetation–climate interaction with land. Clearly, the amount of transpiration (RWU) increases due to the presence of vegetation in the absence of rainfall. If vegetation is to be used as an option to protect slope failures and erosion, then such findings will assist local agencies in designing a proper interval of watering plants that will be grown over the slopes.

3.2.2. Hydro-Mechanically Coupled Slope Stability Analysis (Case (b))

Furthermore, transient seepage coupled slope stability analysis was conducted for case (b). Figure 22b illustrates that the FOS of the slope increases with respect to time pretty much at a constant rate. Since, no rainfall is considered, the vegetation uses available water within root depth to survive, which causes soil to remain unsaturated throughout the one-month analysis period. The FOS of the slope increases due to the additional apparent cohesion created due to increasing matric suction (negative PWP) resulting in improved FOS with time (Figure 22b). Only a 30-day analysis is done, and it would be interesting in future to perform analysis over a longer duration. It is worth mentioning that the maximum PWP is −320 kPa at crest on the 30th day, which is still much less than the wilting point of the plant and hence, it is likely that the plant will survive without watering. However, this finding needs more research to corroborate current findings. Only one set of climate–vegetation data was idealized and used in this analysis and hence more studies are recommended using data from different plant and seasons.

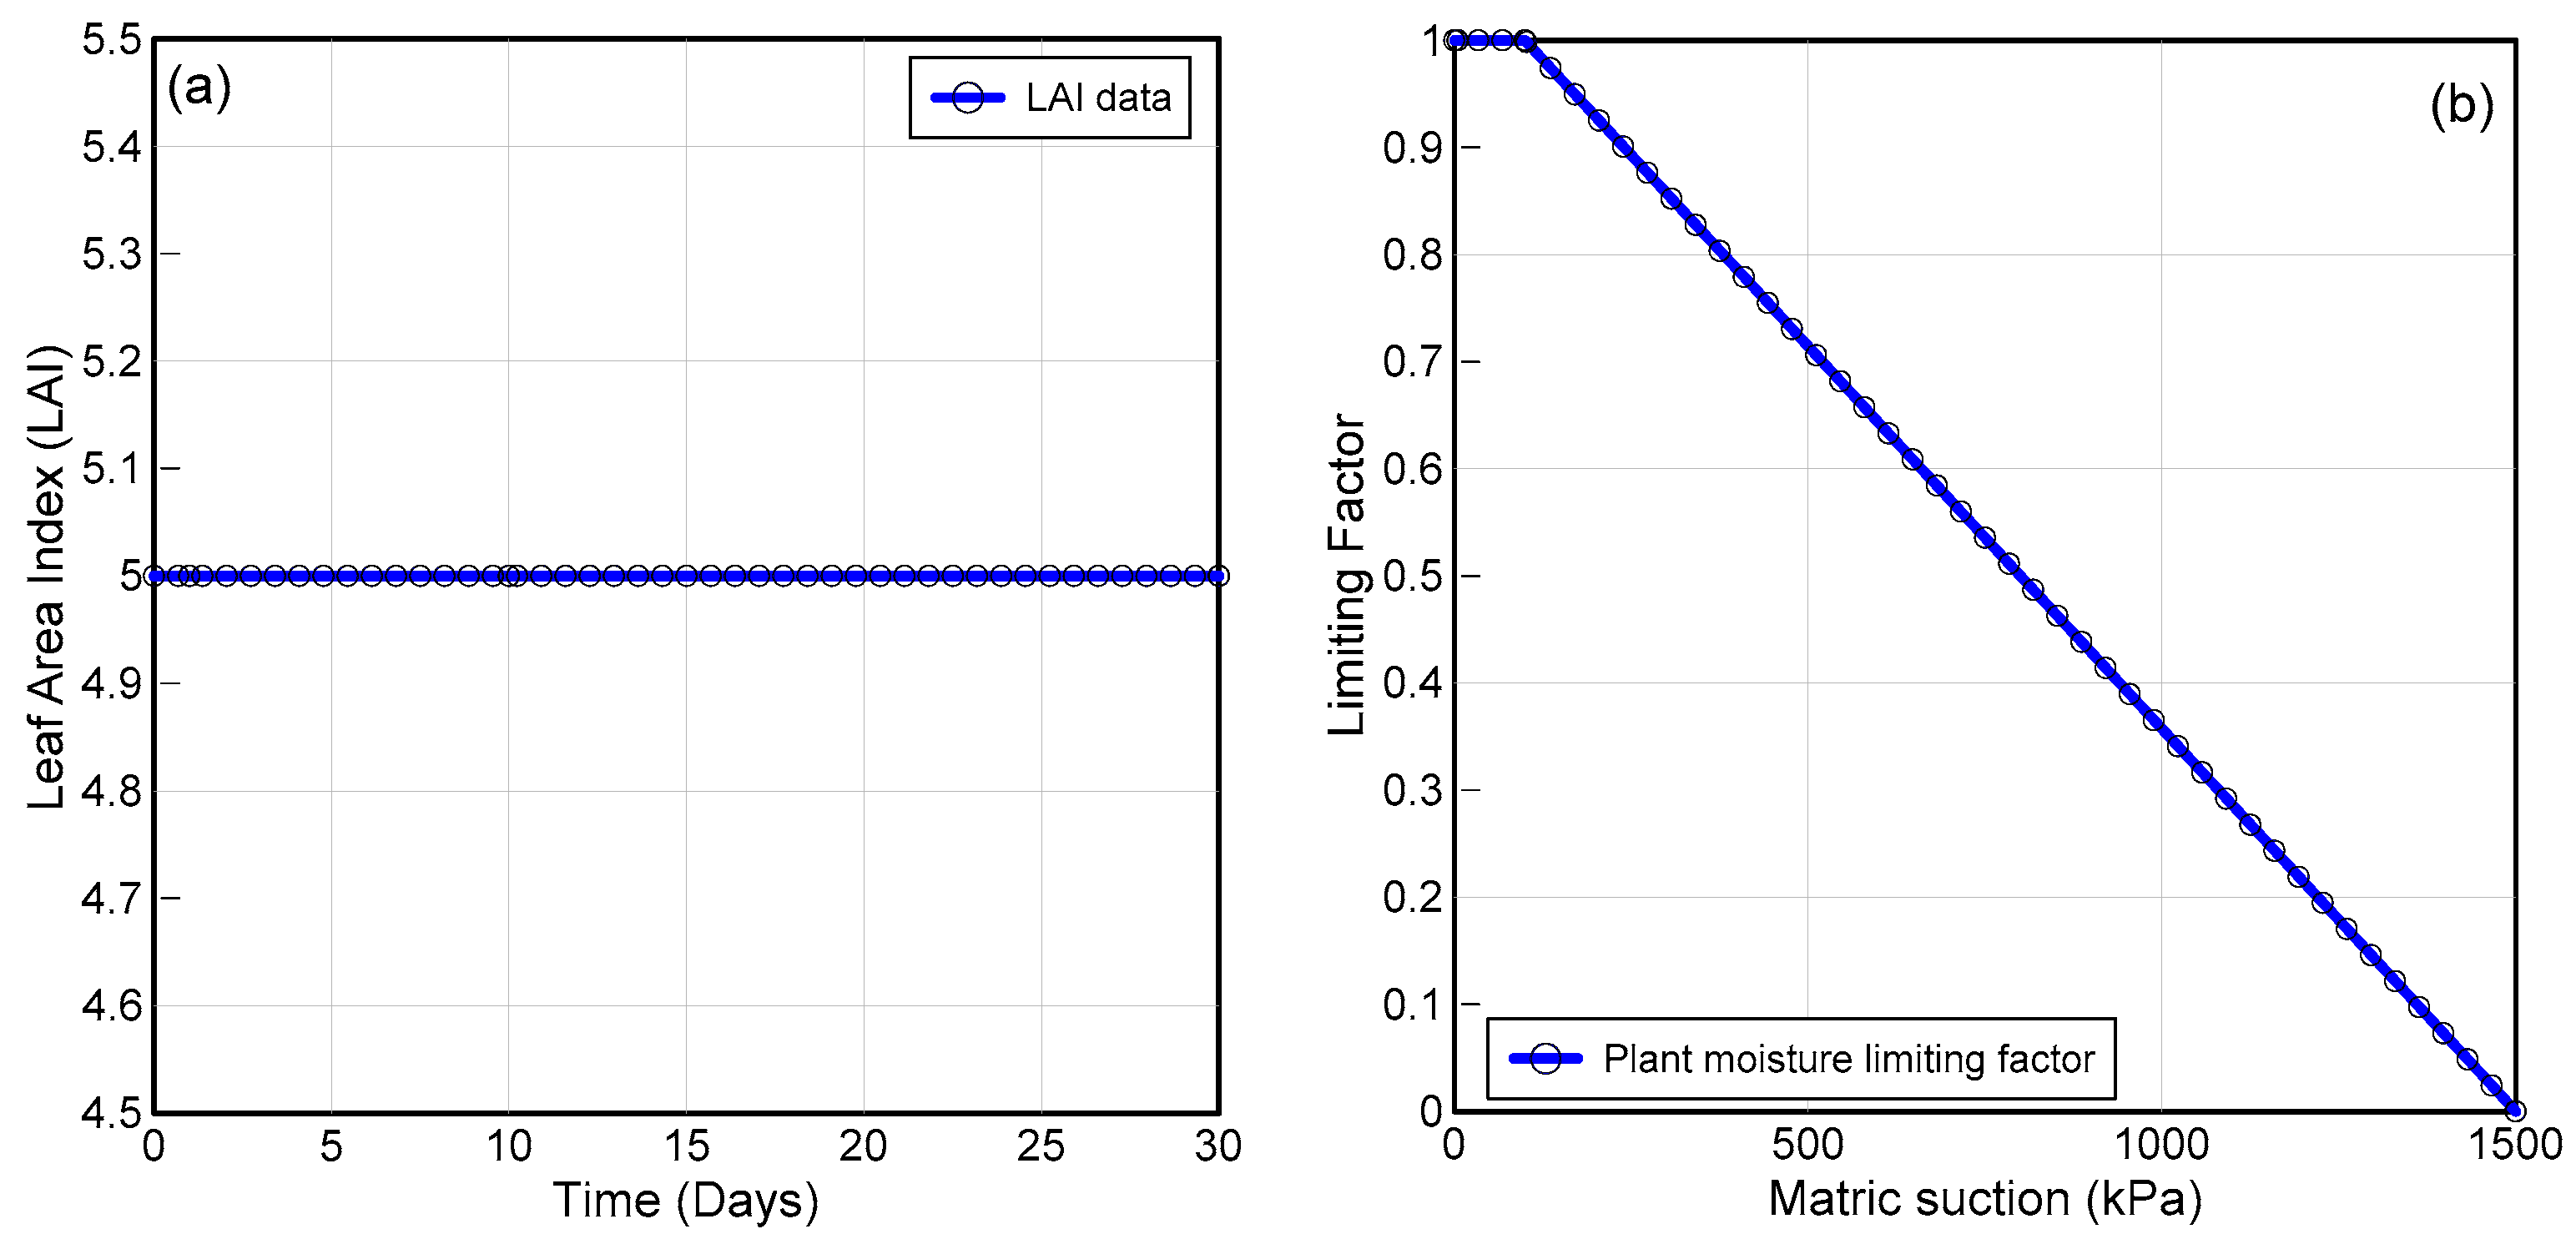
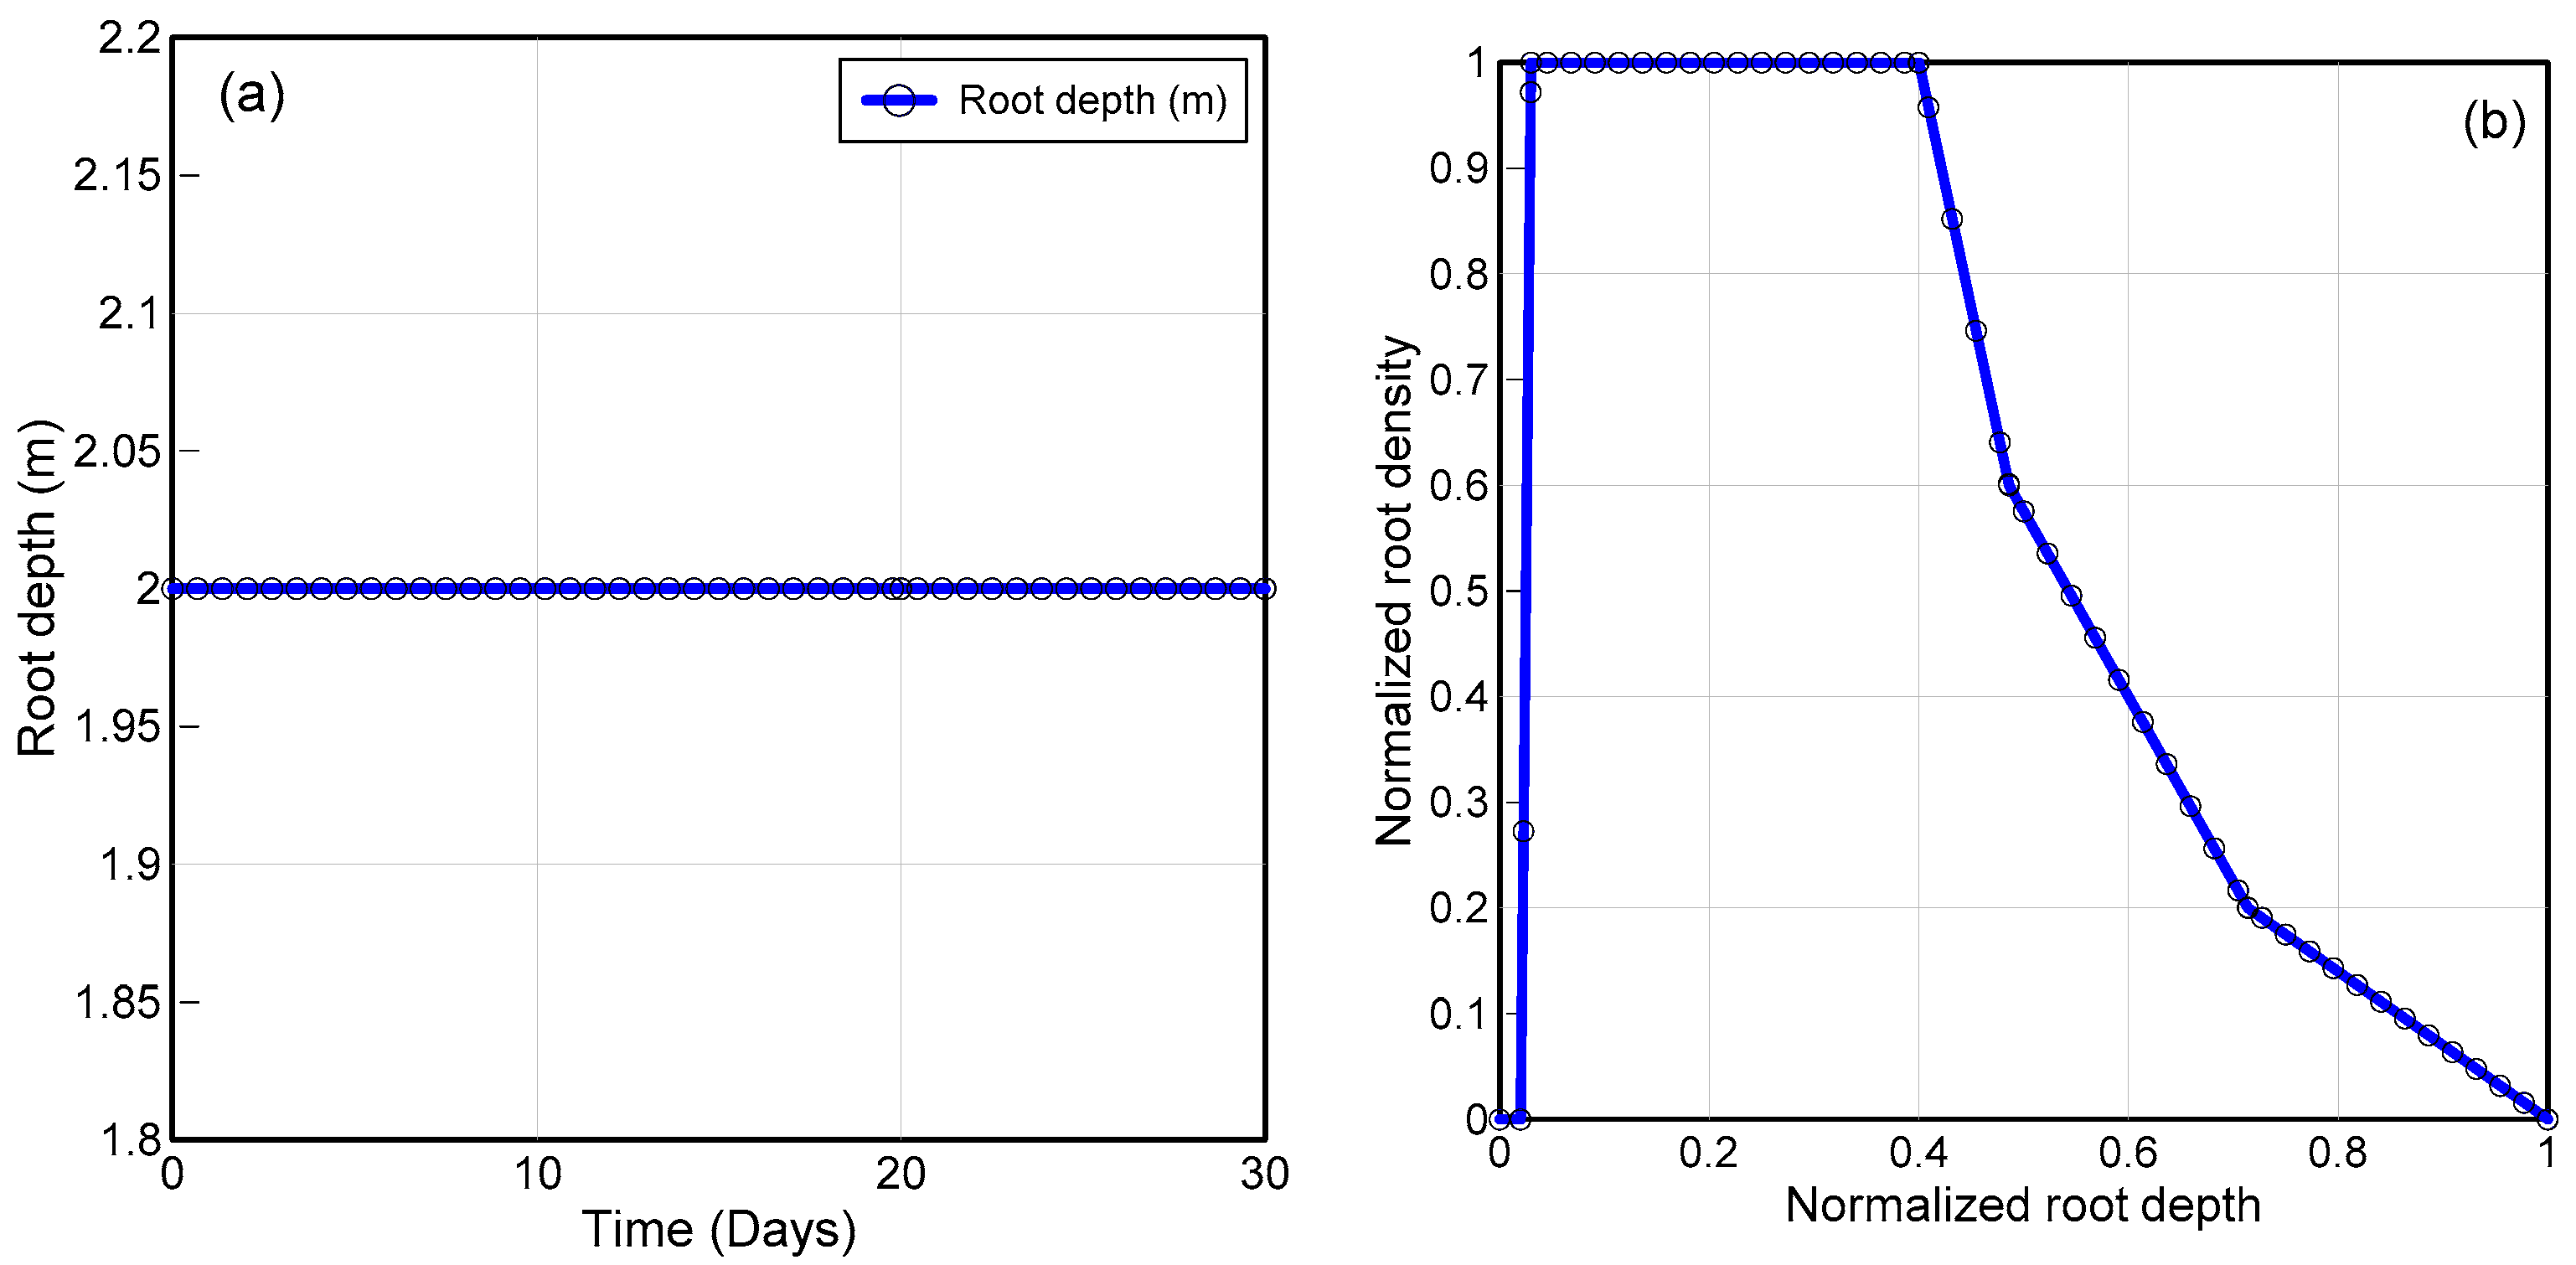
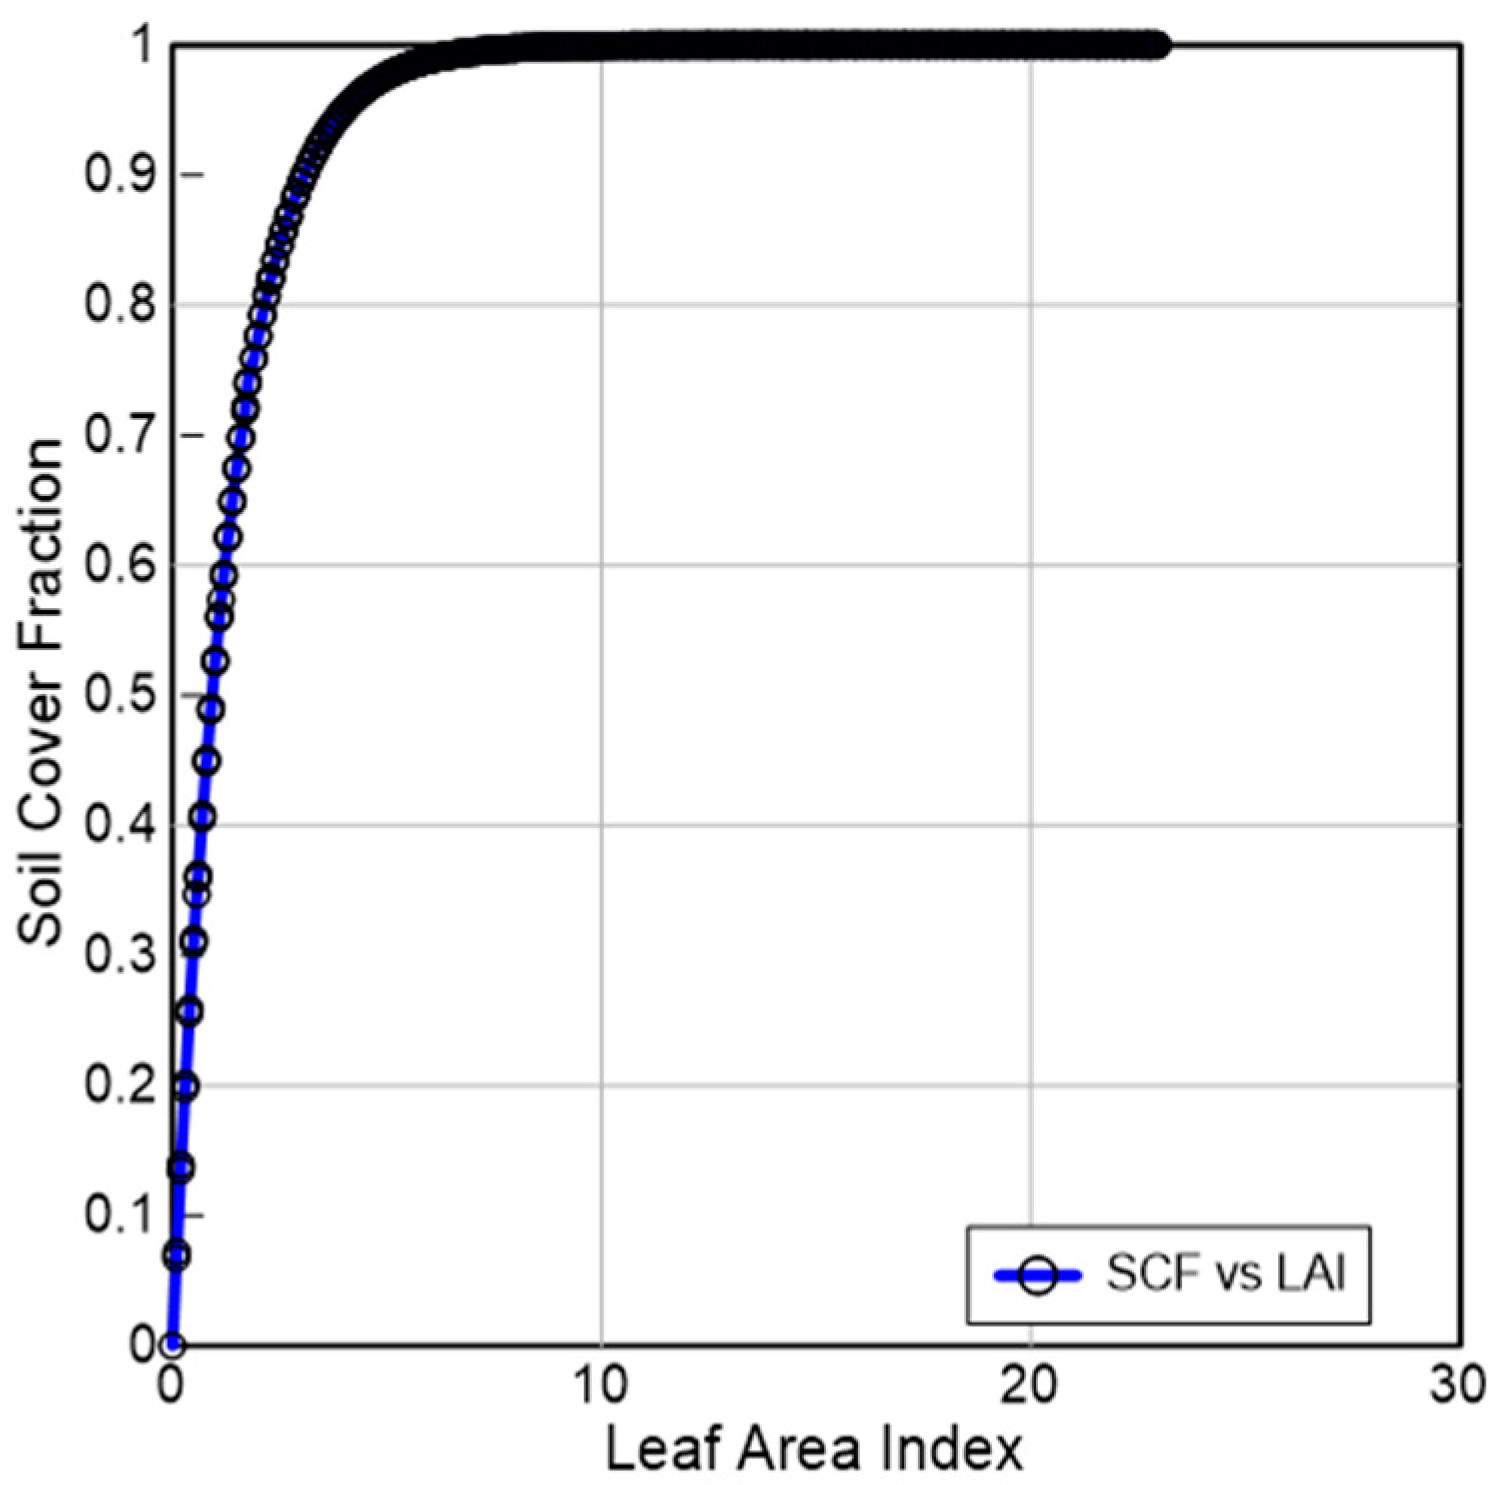
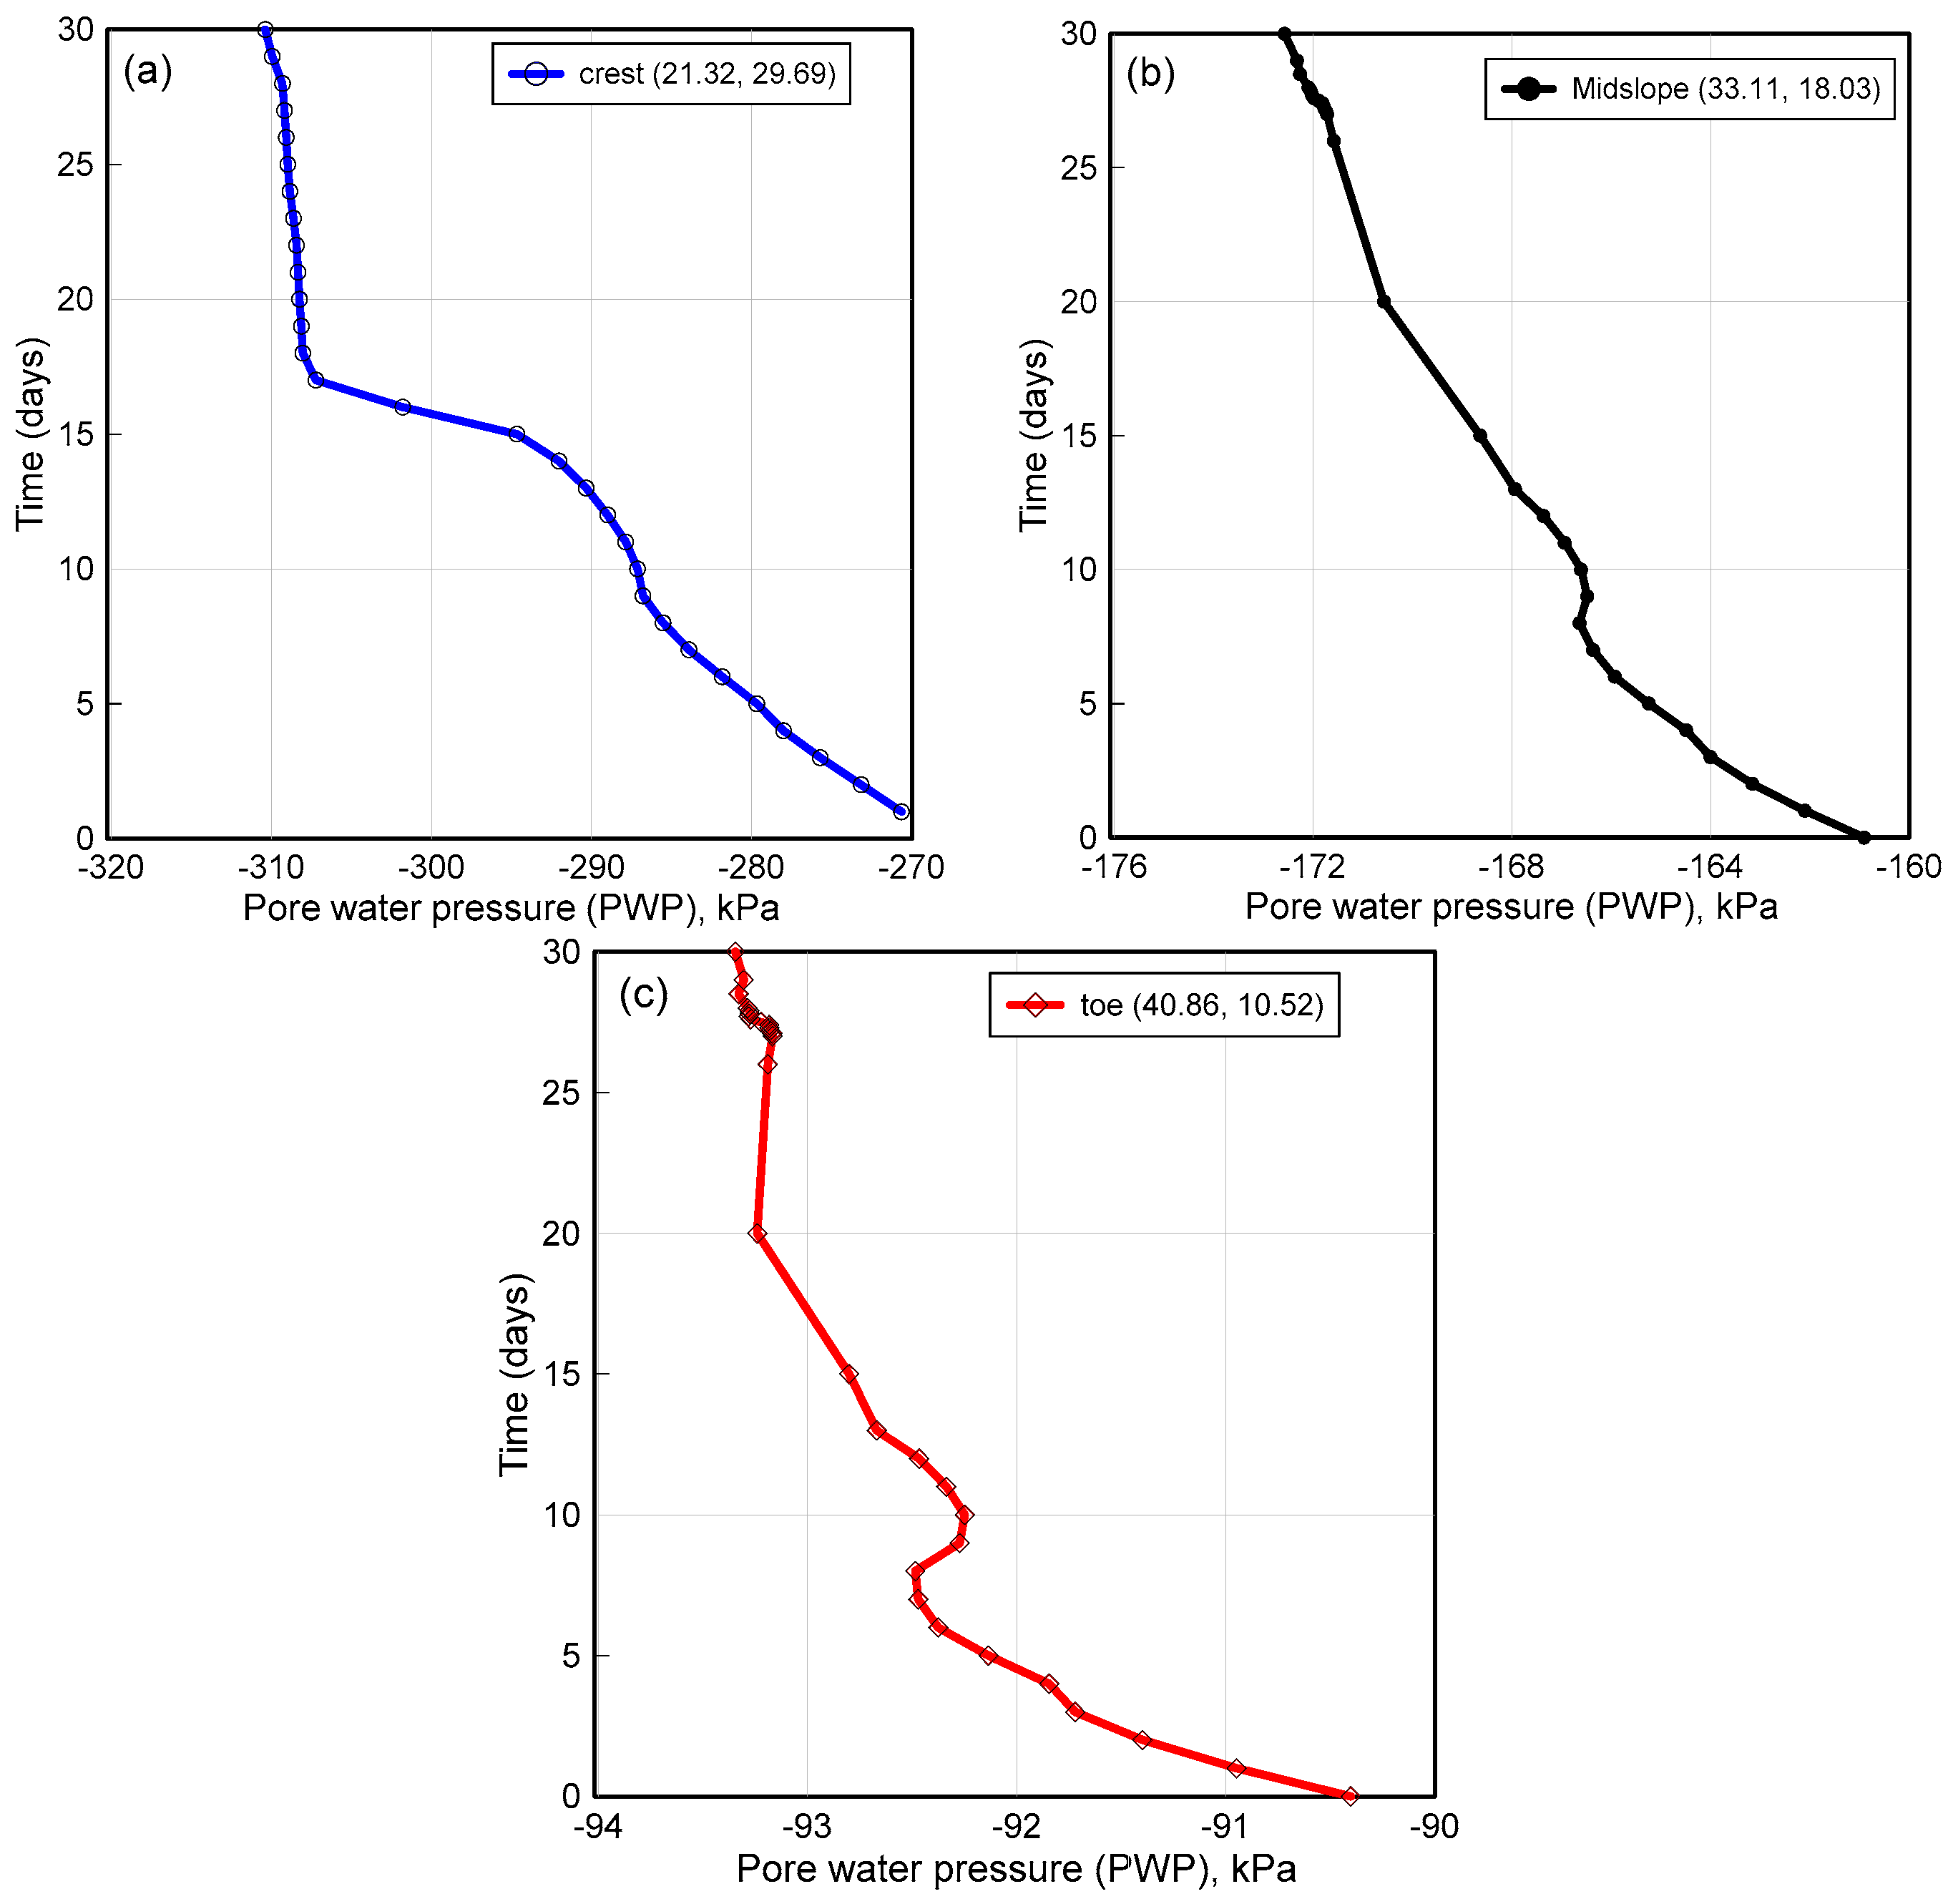
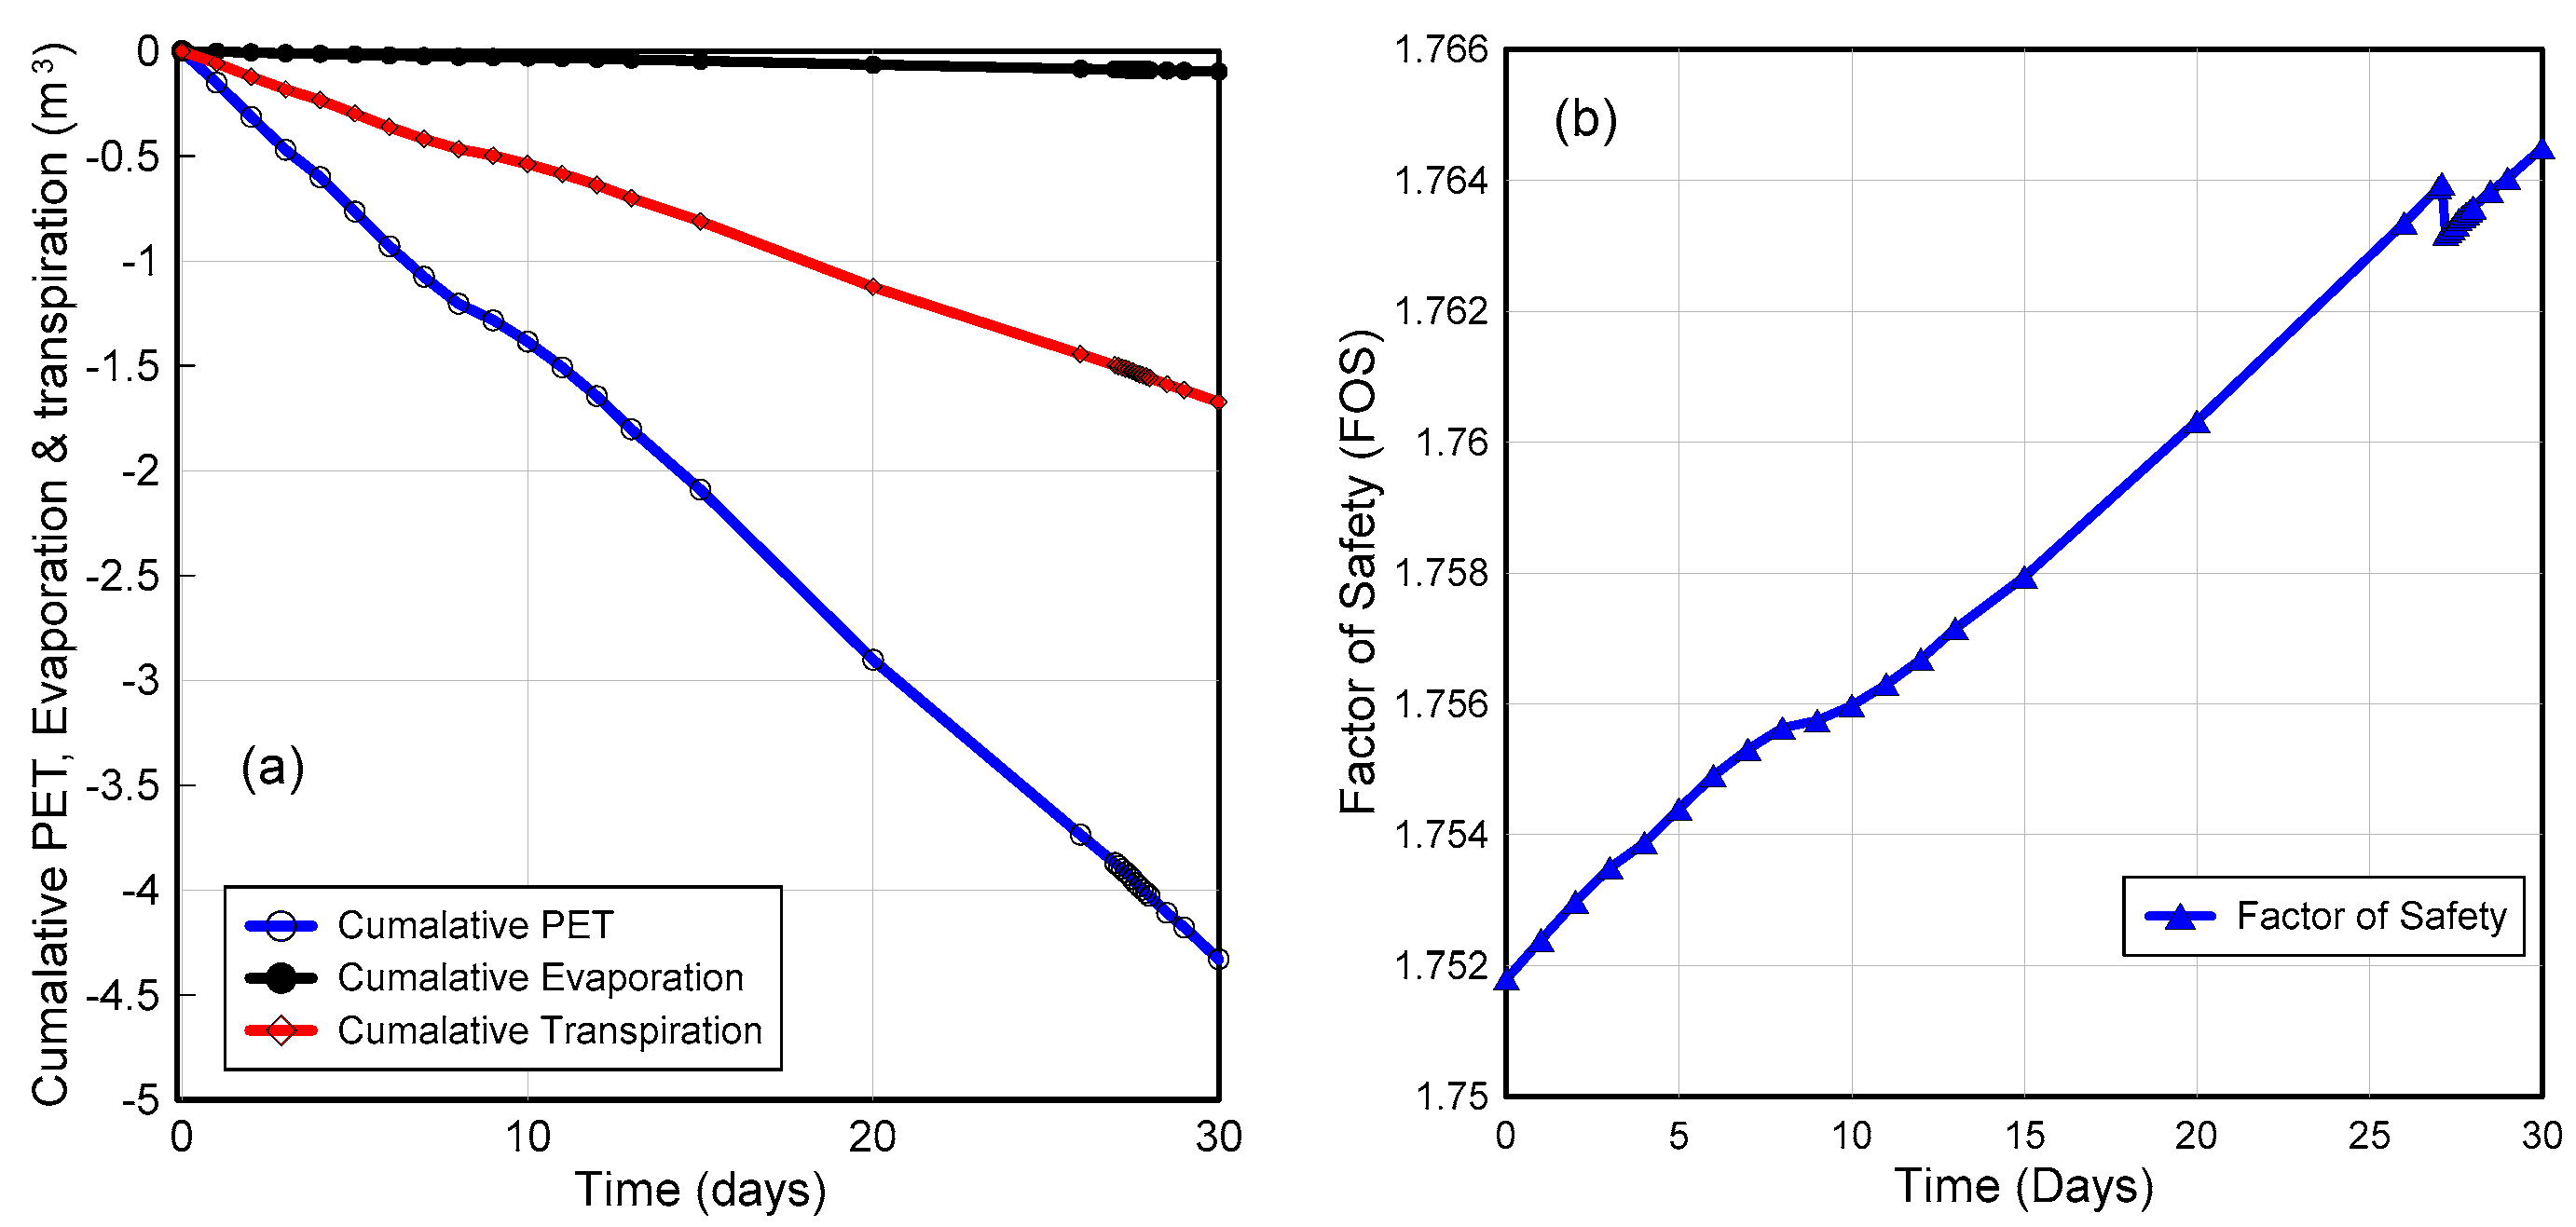
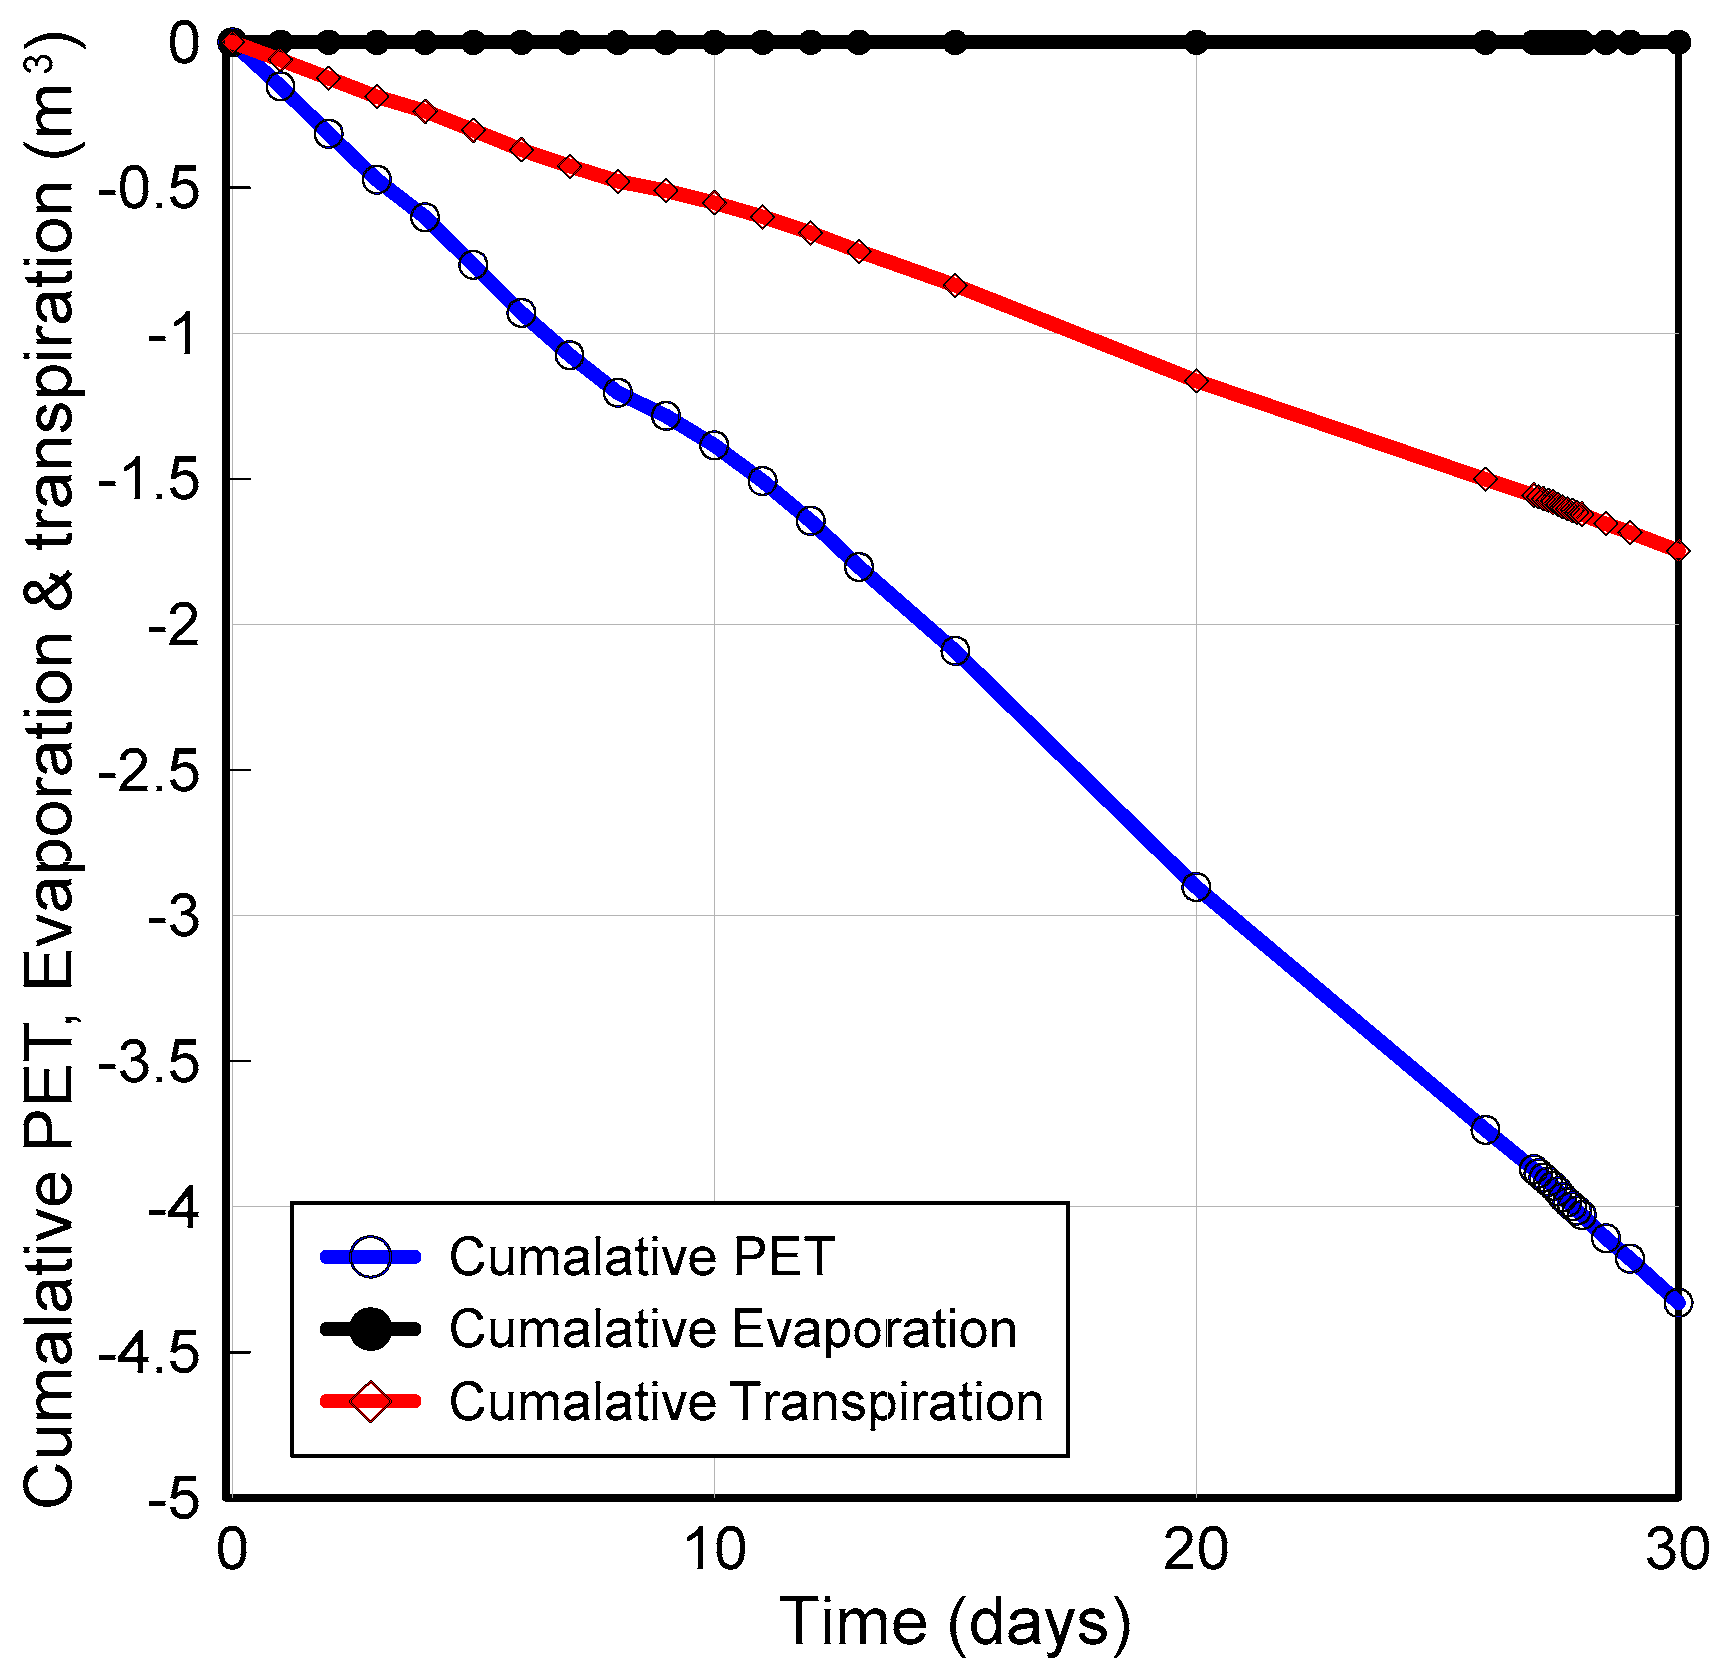
3.3. Case (c): LCI with Vegetation

The effect of precipitation and the presence of vegetation were considered in this analysis. Precipitation data are the same as in case (a) and the vegetation data are the same as in case (b).

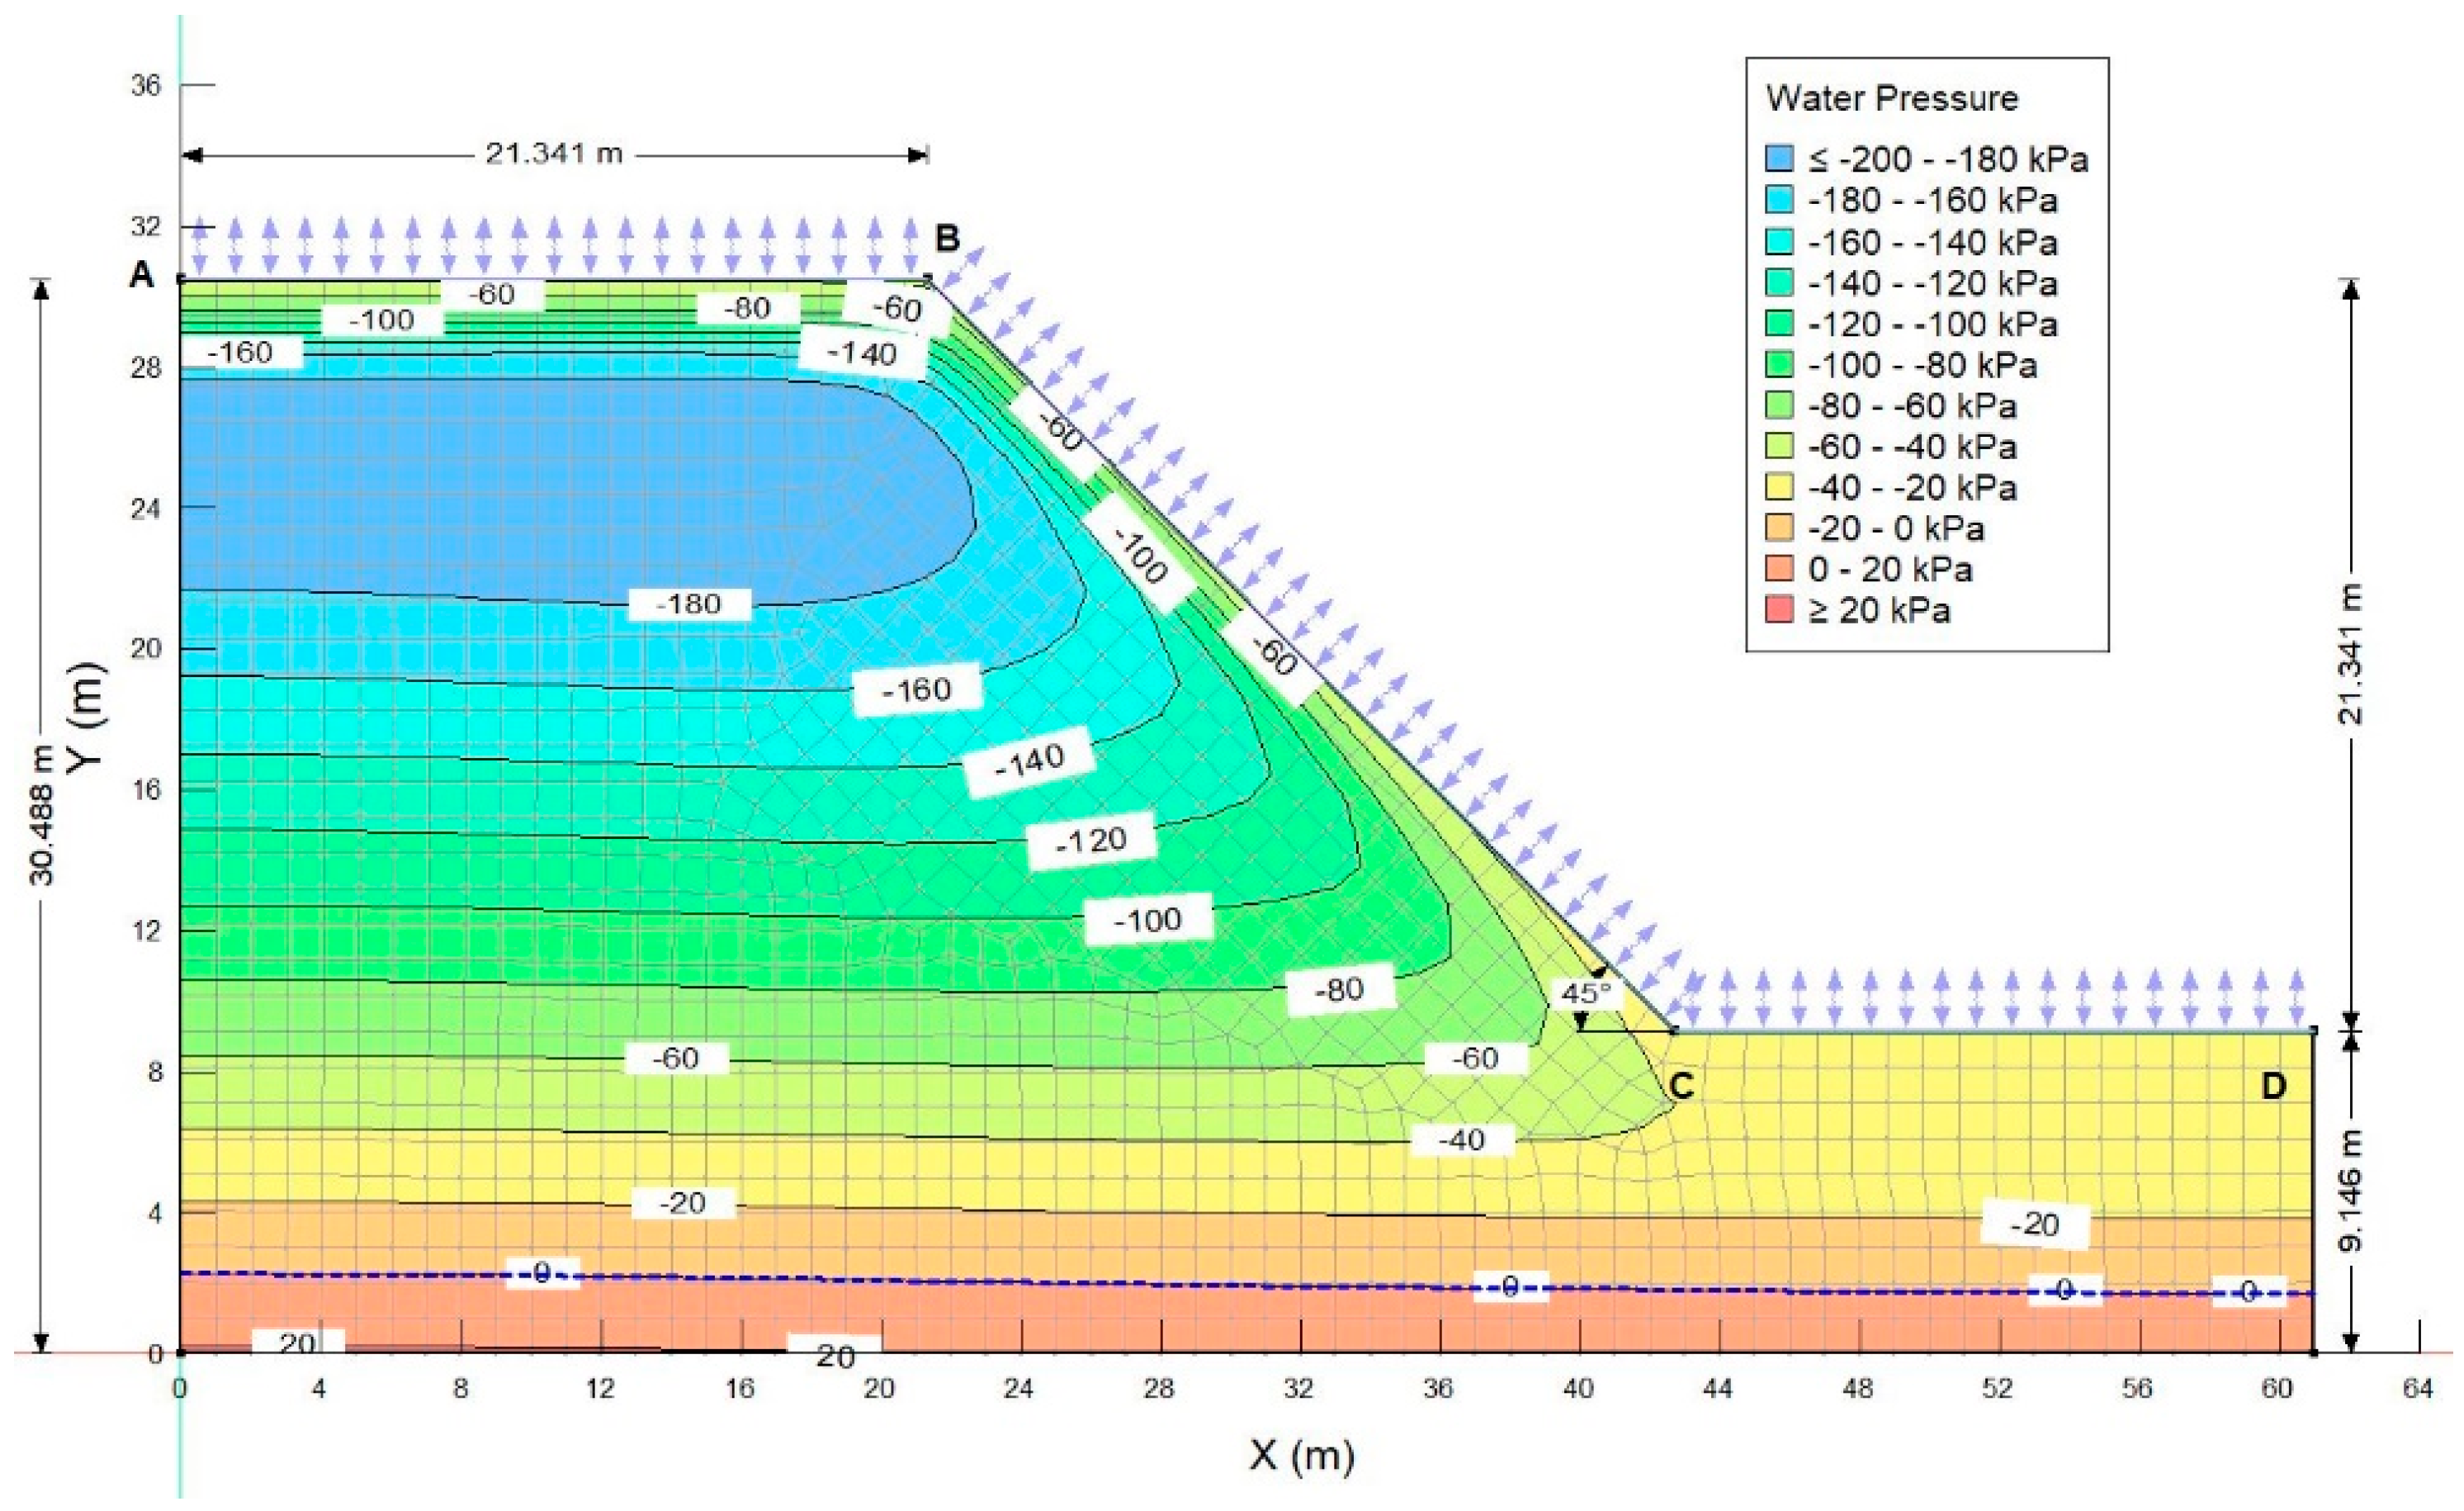
3.3.1. Rainfall-Induced Transient Seepage Analysis (Case (c))

The initial PWP are the same as that of cases (a) and (b). However, the PWP distribution changes with respect to time owing to the infiltration of water from applied precipitation and evapotranspiration due to climate and vegetation boundary conditions applied to the surface. Again, the PWP at the 0th day are the same as that shown in Figure 10. Figure 23 and Figure 24 illustrate the PWP changes on the 20th and the 27.9th day in response to the input of rainfall and climate data, which is the same as in cases (a) and (b) as mentioned above. Clearly, the PWP obtained from case (c) lies between case (a) and (b), that is, PWP case (a) > PWP case (c) > PWP case (b), which makes sense because RWU in case (b) will cause high negative PWP in the absence of rainfall (Figure 19).
Figure 25a–c indicate that the vegetation has a more positive effect on increasing the matric suction (negative PWP), which ultimately results in stabilizing the slope by improving FOS during small intensity long duration rainfall, which is later illustrated in Section 3.3.2.
However, the gap reduces during heavy storm events (storm Kammuri) like the one considered in this study (Figure 25a–c).
Figure 26 shows the variation of PET, transpiration and evaporation accumulated over time. Figure 27 illustrates that the effect of LCI is more visible at the crest section as compared to the mid slope point. Both the points under investigation are at a shallow depth from the top climate boundary.

3.3.2. Hydro-Mechanically Coupled Slope Stability Analysis (Case (c))

Transient pore water pressure profiles corresponding each day over a month period in response to the earlier presented climate data were imported and a coupled slope stability analysis was implemented using Geostudio software [31]. The transient-coupled-slope stability analysis indicate that FOS decreases with time as shown in Figure 28. The variation of FOS with time is linear during the antecedent rainfall up to 26 days. However, during a major storm event on the 27th day, FOS decreases rapidly and becomes highly nonlinear. For the sake of comparison, results from all 3 cases are shown on the same plot in Figure 28. The interval of analysis was reduced to 0.2 days for 27th day analysis to get an insight on how drastic a reduction in FOS (and hence increase in matric suction) occurs during storm day (27th day). The improvement in FOS due to vegetation is appreciable in case (a) as compared to case (c) up to 26 days of antecedent rainfall, which becomes minimal during the storm event (27th day), indicating that the vegetation effect is more influential in improving stability during long durations and small intensity rainfall (i.e., antecedent rainfall). Needless to say, the marginal improvement of FOS in case (c) as compared to case (a) could play a key role in preventing slope failure when the FOS of a bare slope (case(a)) becomes close to 1. Clearly, the FOS recovers rather quickly after a storm event in the case of a vegetated slope as against the non-vegetated slope. This is attributed to the increase in matric suction due to root water uptake by the plants in the case of vegetated slopes, which causes a reduction in water content in the topsoil layer thereby increasing the FOS. This demonstration again highlights the importance of the presence of vegetation over a slope.
Close examination of the slope of FOS with time immediately after the storm event shows that the recovery of FOS (and hence the matric suction) is relatively faster in the case of the vegetated slope which makes the slope safe quickly. It is worth mentioning here that during the dry season the engineered slopes can be more stable if there is no rainfall and the vegetation along the slopes is watered carefully to keep the infiltration as low as possible, that is, just enough to keep vegetation healthy. Thus, the presence of vegetation does increase the stability of a slope (Figure 18).

4. Conclusions

Analysis of numerical modeling results showed that vegetation improved the shear strength of soil within root zone depth due to the creation of matric suction via root water uptake, which ultimately resulted in an improved factor of safety of the test slope in a tropical setting. This stability improvement was more pronounced during the dry season (i.e., no rainfall) and long duration small intensity (antecedent) rainfall events that typically occur before a major storm event as compared to the one during extreme rainfall during a storm event. This is an important observation considering that Guam receives on an average 1–2 major storm events annually. Important shortcomings of this research being that only one soil type and climate-vegetation data were used in this analysis. Many houses on the island of Guam are built on sloping terrain and hence there is a growing need among residents from densely populated and remote villages to be educated on choosing appropriate vegetation and watering practices to maintain engineered slopes surrounding their houses and community during both wet and dry seasons. In this context, more detailed field studies to obtain an accurate vegetation data including leaf area index, plant moisture limiting factor as a function of matric suction, root depth over time, normalized root density versus normalized root depth and soil cover fraction versus leaf area index are recommended. In this study, the soil profile of an entire slope was made from only one homogenous soil which typically represents an engineered slope. However, natural slopes are most likely made from multi soil layers sitting on shallow or deep bedrock which needs to be investigated in the future, taking current findings as the first indication.
As discussed earlier, the occurrence of landslides depends upon the soil type (geologic setting), geometry of slopes and other factors such as rainfall duration and intensity, climate and vegetation properties (environmental setting). Although the environmental setting of South and North Guam may have some similarity, their geology is very different and so are the properties of soils formed along their hillslopes. Soils in North Guam rest on an uplifted plateau of limestone bedrock while those in South Gaum rest on volcanic bedrock. As such, it is worth mentioning that it would not be logical to apply findings from this research from Southern Guam to slopes from Northern Guam or even the neighboring Islands, simply because their geology and environmental setting may be different. Hence, site specific investigations that follow field, laboratory and numerical studies as explained in this paper are recommended for regions with different geology and environmental settings. To the best knowledge of the authors, this is the first geotechnical engineering study documenting the role of vegetation in improving the factor of safety of hillslopes in Southern Guam and will provide baseline data for further studies. Finally, the quantification of the mechanical effect of roots (i.e., root-reinforcement) in indirectly improving the slope stability (which is not studied in this research) is recommended for future studies.

Author Contributions

Conceptualization, U.D.P., methodology, U.D.P.; software, U.D.P.; validation, U.D.P.; formal analysis, U.D.P.; investigation, U.D.P., and E.A.; resources, A.J.S.III; data curation, U.D.P., A.J.S.III, and E.A.; writing—original draft preparation, U.D.P.; writing—review and editing, U.D.P., and A.J.S.III; visualization, U.D.P.; supervision, U.D.P.; project administration, U.D.P.; funding acquisition, U.D.P. All authors have read and agreed to the published version of the manuscript.

Funding

This material is supported by the National Sea Grant College Program of the United States Department of Commerce, National Oceanic and Atmospheric Administration Award No. NA18OAR-4170077 (Project No. R/UOGSG19-2). This material is also supported by the National Science Foundation under Grant Number OIA-1457769-GEC seed funding Y4 and Y5. The views expressed herein do not necessarily reflect the views of any of these organizations.

Data Availability Statement

The data used is primarily reflected in the article. Other relevant data is available from the authors upon request.

Acknowledgments

The authors thank Terry Donaldson (PI-UOG EPSCOR) for providing this funding opportunity to conduct research on effect of climate and vegetation on landslides/slope failures in Guam. Thanks to the staff at UOG Sea Grant, UOG EPSCOR, and RCUOG for their support in procurement of equipment and accessories and all the project relevant office support. Also, thanks to the research assistants Giordan Kho, Victoria Lopez and Maegan Catahay who are students from School of engineering for their valuable support in conducting laboratory experiments related with this research.

Conflicts of Interest

The authors declare that there is no conflict of interests regarding the publication of this paper.

References

  1. Shelton, A.J.; Richmond, R.H. Watershed restoration as a tool for improving coral reef resilience against climate change and other human impacts. Estuar. Coast. Shelf Sci. 2016, 183, 430–437. [Google Scholar] [CrossRef]
  2. Richmond, R.H.; Golbuu, Y.; Shelton, A.J. Successful management of coral reef-watershed networks. In Future Coasts and Estuaries; Wolanski, E., Ed.; Elsevier: Amsterdam, The Netherlands, 2019. [Google Scholar]
  3. Lander, M.A.; Guard, C.P. Creation of a 50-Year Rainfall Database, Annual Rainfall Climatology, and Annual Rainfall Distribution Map for Guam; Water and Environmental Research Institute of the Western Pacific, University of Guam: Mangilao, GU, USA, 2003. [Google Scholar]
  4. Zhu, H.; Zhang, L.M. Evaluating suction profile in a vegetated slope considering uncertainty in transpiration. Comput. Geotech. 2015, 63, 112–120. [Google Scholar] [CrossRef]
  5. Kim, J.; Kim, Y.; Jeong, S.; Hong, M. Rainfall-induced landslides by deficit field matric suction in unsaturated soil slopes. Environ. Earth Sci. 2017, 76, 808. [Google Scholar] [CrossRef]
  6. Hungr, O.; Evans, G.S.; Bovis, J.M.; Hutchinson, N.J. A review of the classification of landslides of the flow type. Environ. Eng. Geosci. 2001, 7, 221–238. [Google Scholar] [CrossRef]
  7. Vanapalli, S.K.; Fredlund, D.G.; Pufahl, D.E. The relationship between the soil-water characteristic curve and the unsaturated shear strength of a compacted glacial till. Geotech. Test. J. 1996, 19, 259–268. [Google Scholar]
  8. Lu, N.; Likos, J.W. Unsaturated Soil Mechanics; Wiley: Hoboken, NJ, USA, 2004. [Google Scholar]
  9. Patil, U.D.; Hoyos, L.R.; Puppala, A.J. Characterization of compacted silty sand using a double-walled triaxial cell with fully automated relative-humidity control. Geotech. Test. J. 2016, 39, 742–756. [Google Scholar] [CrossRef]
  10. Patil, U.D.; Puppala, J.A.; Hoyos, R.L.; Pedarla, A. Modeling critical-state shear strength behavior of compacted silty sand via suction-controlled triaxial testing. Eng. Geol. 2017, 231, 21–33. [Google Scholar] [CrossRef]
  11. Waldron, L.J. The shear resistance of root-permeated homogeneous and stratified soil. Soil Sci. Soc. Am. J. 1977, 41, 843–849. [Google Scholar] [CrossRef]
  12. Wu, T.H.; McKinnell, W.P., III; Swanston, D.N. Strength of tree roots and landslides on Prince of Wales Island, Alaska. Can. Geotech. J. 1979, 16, 19–33. [Google Scholar] [CrossRef]
  13. Stokes, A.; Atger, C.; Bengough, A.G.; Fourcaud, T.; Sidle, R.C. Desirable plant root traits for protecting natural and engineered slopes against landslides. Plant Soil 2009, 324, 1–30. [Google Scholar] [CrossRef]
  14. Ni, J.J.; Leung, K.A.; Ng, W.C.W.; Shao, W. Modelling hydro-mechanical reinforcements of plants to slope stability. Comput. Geotech. 2018, 95, 99–109. [Google Scholar] [CrossRef]
  15. Leung, T.F.; Yan, M.W.; Hau, C.B.; Tham, G.L. Root systems of native shrubs and trees in Hong Kong and their effects on enhancing slope stability. Catena 2015, 125, 102–110. [Google Scholar] [CrossRef]
  16. Pollen-Bankhead, N.; Simon, A. Hydrologic and hydraulic effects of riparian root networks on streambank stability: Is mechanical root-reinforcement the whole story? Geomorphology 2010, 116, 353–362. [Google Scholar] [CrossRef]
  17. Rahardjo, H.; Satyanaga, A.; Leong, C.E.; Santoso, A.V.; Ng, S.Y. Performance of an instrumented slope covered with shrubs and deep-rooted grass. Soils Found. 2014, 54, 417–425. [Google Scholar] [CrossRef] [Green Version]
  18. Dias, A.S.R.A. The Effect of Vegetation on Slope Stability of Shallow Pyroclastic Soil Covers. Ph.D. Thesis, The University of Naples Federico II, Naples, Italy, January 2019. [Google Scholar]
  19. ASTM. ASTM D 854-02. In Standard Test Method for Specific Gravity of Soil Solids by Water Pycnometer; American Society for Testing and Materials: West Conshohocken, PA, USA, 2002. [Google Scholar]
  20. ASTM. ASTM D6913-04. In Standard Test Methods for Particle Size Distribution of Soils; American Society for Testing of Materials: West Conshohocken, PA, USA.
  21. ASTM. ASTM D422-63. In Standard Test Methods for Hydro Meter Analysis of Soils; American Society for Testing of Materials: West Conshohocken, PA, USA.
  22. ASTM. ASTM D4318-10. In Standard Test Methods for Liquid Limit, Plastic Limit, and Plasticity Index of Soils; American Society for Testing of Materials: West Conshohocken, PA, USA.
  23. METER Group. Operation Manual KSAT. Available online: http://library.metergroup.com/Manuals/UMS/KSAT_Manual.pdf (accessed on 5 June 2020).
  24. METER Group. Operation Manual HYPROP. Available online: http://library.metergroup.com/Manuals/UMS/ Hyprop_Manual.pdf (accessed on 10 August 2020).
  25. Schindler, U.; Durner, W.; Von Unold, G.; Mueller, L.; Wieland, R. The evaporation method: Extending the measurement range of soil hydraulic properties using the air-entry pressure of the ceramic cup. J. Plant Nutr. Soil Sci. 2010, 173, 563–572. [Google Scholar] [CrossRef]
  26. METER Group. WP4C Dew Point Potentio Meter Operator’s Manual. Available online: http://library. metergroup.com/Manuals/20588_WP4C_Manual_Web.pdf (accessed on 10 August 2020).
  27. Fredlund, D.G.; Xing, A. Equations for the soil-water characteristic curve. Can. Geotech. J. 1994, 31, 521–532. [Google Scholar] [CrossRef]
  28. Campbell, G.S. A simple method for determining unsaturated conductivity from moisture retention data. Soil Sci. 1974, 117, 311–314. [Google Scholar] [CrossRef]
  29. METER Group. Operation Manual SATURO. Available online: http://library.metergroup.com/Manuals/20496_SATURO_Manual.pdf (accessed on 5 June 2020).
  30. GeoStudio. Seepage Modeling with SEEP/W an Engineering Methodology; GEOSLOPE International Ltd.: Calgary, AB, Canada, 2012. [Google Scholar]
  31. GeoStudio. Stability Modeling with Geostudio; GEOSLOPE International Ltd.: Calgary, AB, Canada, 2018; Available online: www.geoslope.com (accessed on 15 May 2020).
  32. Morgenstern, N.U.; Price, V.E. The analysis of the stability of general slip surfaces. Geotechnique 1965, 15, 79–93. [Google Scholar] [CrossRef]
Figure 1. (a) and (b) Aerial view of eroded and vegetated slopes in Ija watershed, Guam.
Land 10 00299 g001
Figure 2. Idealized 2-D hillslope at Ija site in Guam.
Land 10 00299 g002
Figure 3. Actual photograph of (a) soil water retention curve (SWRC) equipment hydraulic property analyzer (HYPROP) and (b) WP4C dewpoint potentiometer for creating experimental SWRCs.
Land 10 00299 g003
Figure 4. (a) Experimental points and predicted SWRC for hillslope soil; (b) Unsaturated hydraulic conductivity as a function of suction.
Land 10 00299 g004
Figure 5. (ac) Actual photographs of automatically controlled field permeability test equipment SATURO ring infiltrometer.
Land 10 00299 g005
Figure 6. (a) Stress strain curves from DST; (b) DST results at peak failure plotted in shear stress vs. normal stress plane.
Land 10 00299 g006
Figure 7. Rainfall data applied over a 30-day period with rain gauge and ZL6 data logger installed at Ija site (inserted picture).
Land 10 00299 g007
Figure 8. Monthly climate data (a) air temperature; and (b) relative humidity.
Land 10 00299 g008
Figure 9. Monthly climate data (a) wind speed; and (b) net radiation data.
Land 10 00299 g009
Figure 10. High negative PWP distribution on 0th day.
Land 10 00299 g010
Figure 11. PWP after major storm on 27.9th day.
Land 10 00299 g011
Figure 12. (a) Variation of PWP within shallow depth at crest; mid slope and near toe portion of hillslope; (b) Cumulative rainfall, net infiltration and runoff over one-month period.
Land 10 00299 g012
Figure 13. (a) Variation of PWP within shallow depth at crest; mid slope and near toe portion of hillslope; (b) Cumulative rainfall, net infiltration and runoff over one-month period.
Land 10 00299 g013
Figure 14. Critical slip surface from Morgenstern and Price method on 30th day.
Land 10 00299 g014
Figure 15. Effect of antecedent rainfall followed by storm kammuri on factor of safety (FOS) with respect to time from Morgenstern and Price method.
Land 10 00299 g015
Figure 16. Monthly vegetation data (a) Leaf area index and (b) plant moisture limiting factor as a function of matric suction.
Land 10 00299 g016
Figure 17. Monthly vegetation data (a) root depth over time and (b) normalized root density versus normalized root depth.
Land 10 00299 g017
Figure 18. Monthly vegetation data showing relationship between soil cover fraction and leaf area index.
Land 10 00299 g018
Figure 19. PWP on 30th day (case (b)).
Land 10 00299 g019
Figure 20. (a) Variation of volumetric water content (VWC) with elevation at (a) mid slope; and (b) crest during different time steps.
Land 10 00299 g020
Figure 21. Variation of PWP within shallow depth at (a) crest; (b) mid slope and (c) near toe portion of hillslope over a one-month period.
Land 10 00299 g021
Figure 22. (a) Variation of evapotranspiration, evaporation, and cumulative transpiration over a one-month period; (b) Effect of vegetation and climate without rainfall on FOS with respect to time from the Morgenstern and Price method.
Land 10 00299 g022
Figure 23. PWP distribution on 20th day.
Land 10 00299 g023
Figure 24. PWP distribution on 27.9th day.
Land 10 00299 g024
Figure 25. Variation of PWP from all 3 cases within shallow depth at (a) crest; (b) mid slope and (c) near toe portion of hillslope over a one-month period.
Land 10 00299 g025
Figure 26. Variation of evaporation, transpiration and evapotranspiration over a one-month period.
Land 10 00299 g026
Figure 27. Variation of volumetric water content (VWC) with elevation at (a) mid slope; and (b) crest during different time steps.
Land 10 00299 g027
Figure 28. Influence of climate and vegetation on FOS with respect to time from Morgenstern and Price method.
Land 10 00299 g028
Table 1. Geotechnical Properties of Hillslope Soil.
Soil PropertiesExperimental Value
classification (USCS)clayey sand (SC)
unit weight (kN/m3)20
specific gravity2.6
porosity0.69
saturated permeability, ksat, (m/day)0.62
saturated VWC (%)92.17
cohesion (kPa)5.1
Friction angle (°)29.7
Publisher’s Note: MDPI stays neutral with regard to jurisdictional claims in published maps and institutional affiliations.

