
Key Disaster-Causing Factors Chains on Urban Flood Risk Based on Bayesian Network


Abstract
1. Introduction
2. Methodology
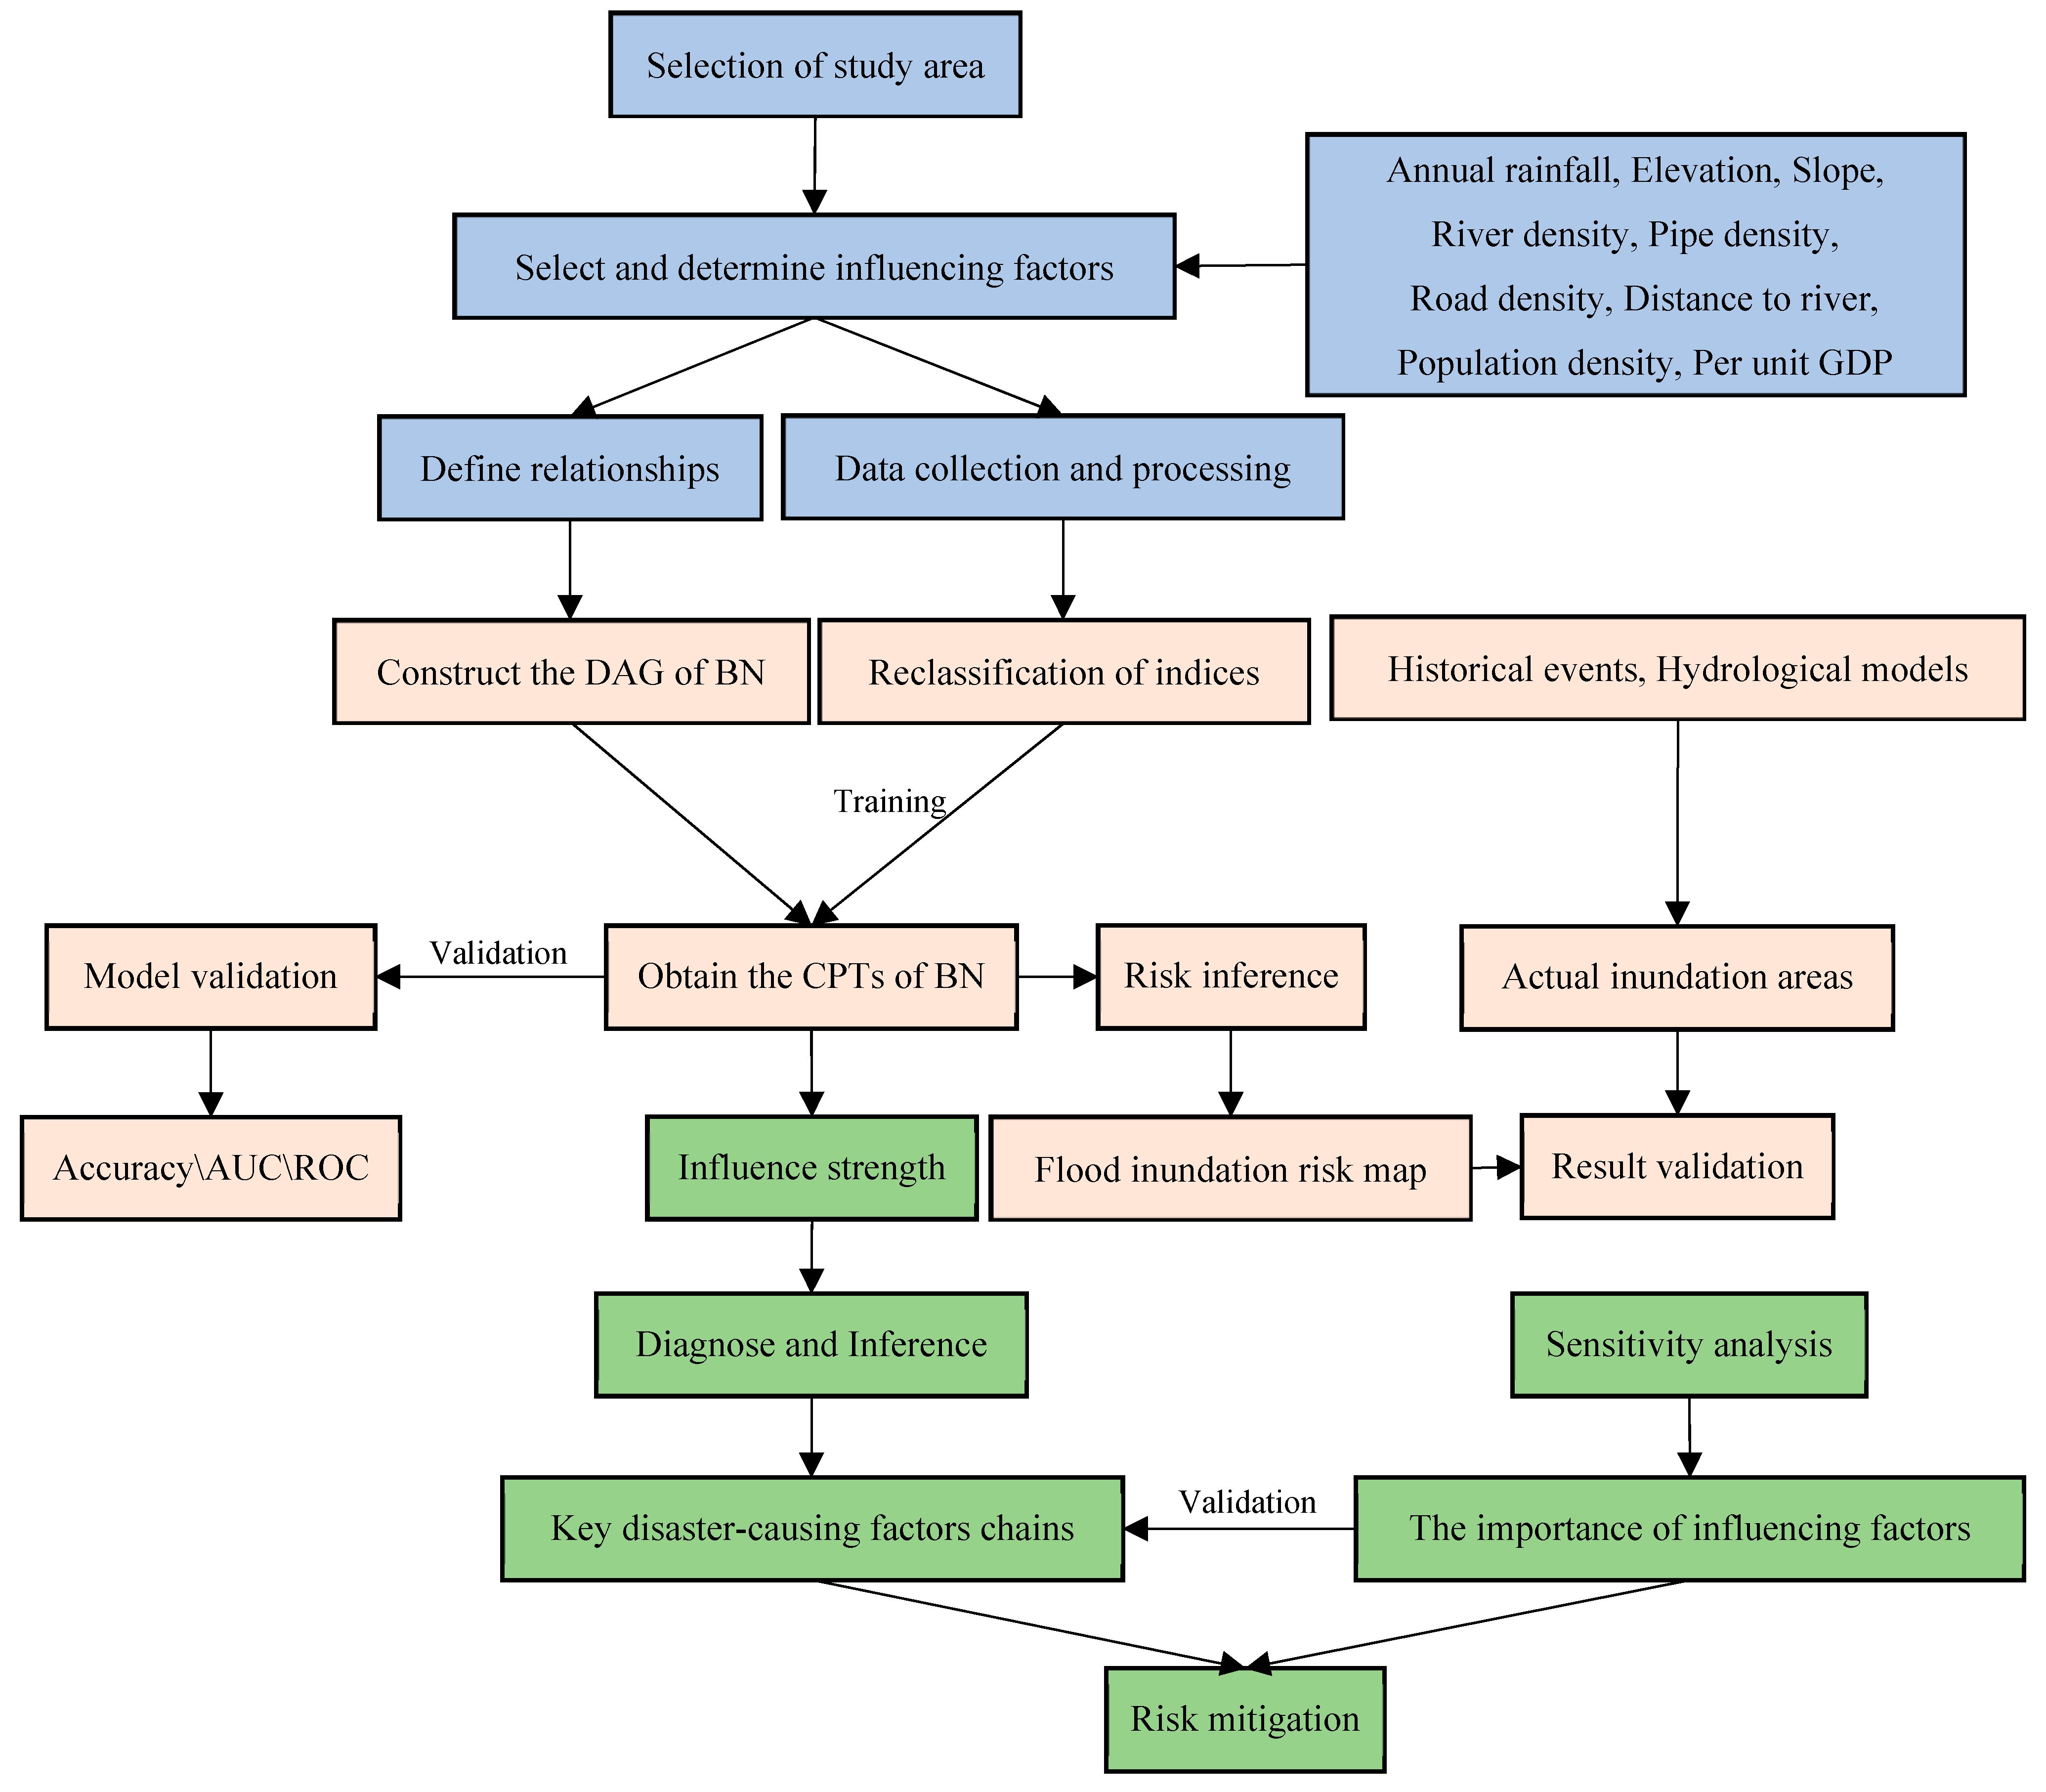
2.1. Framework of Research Methods
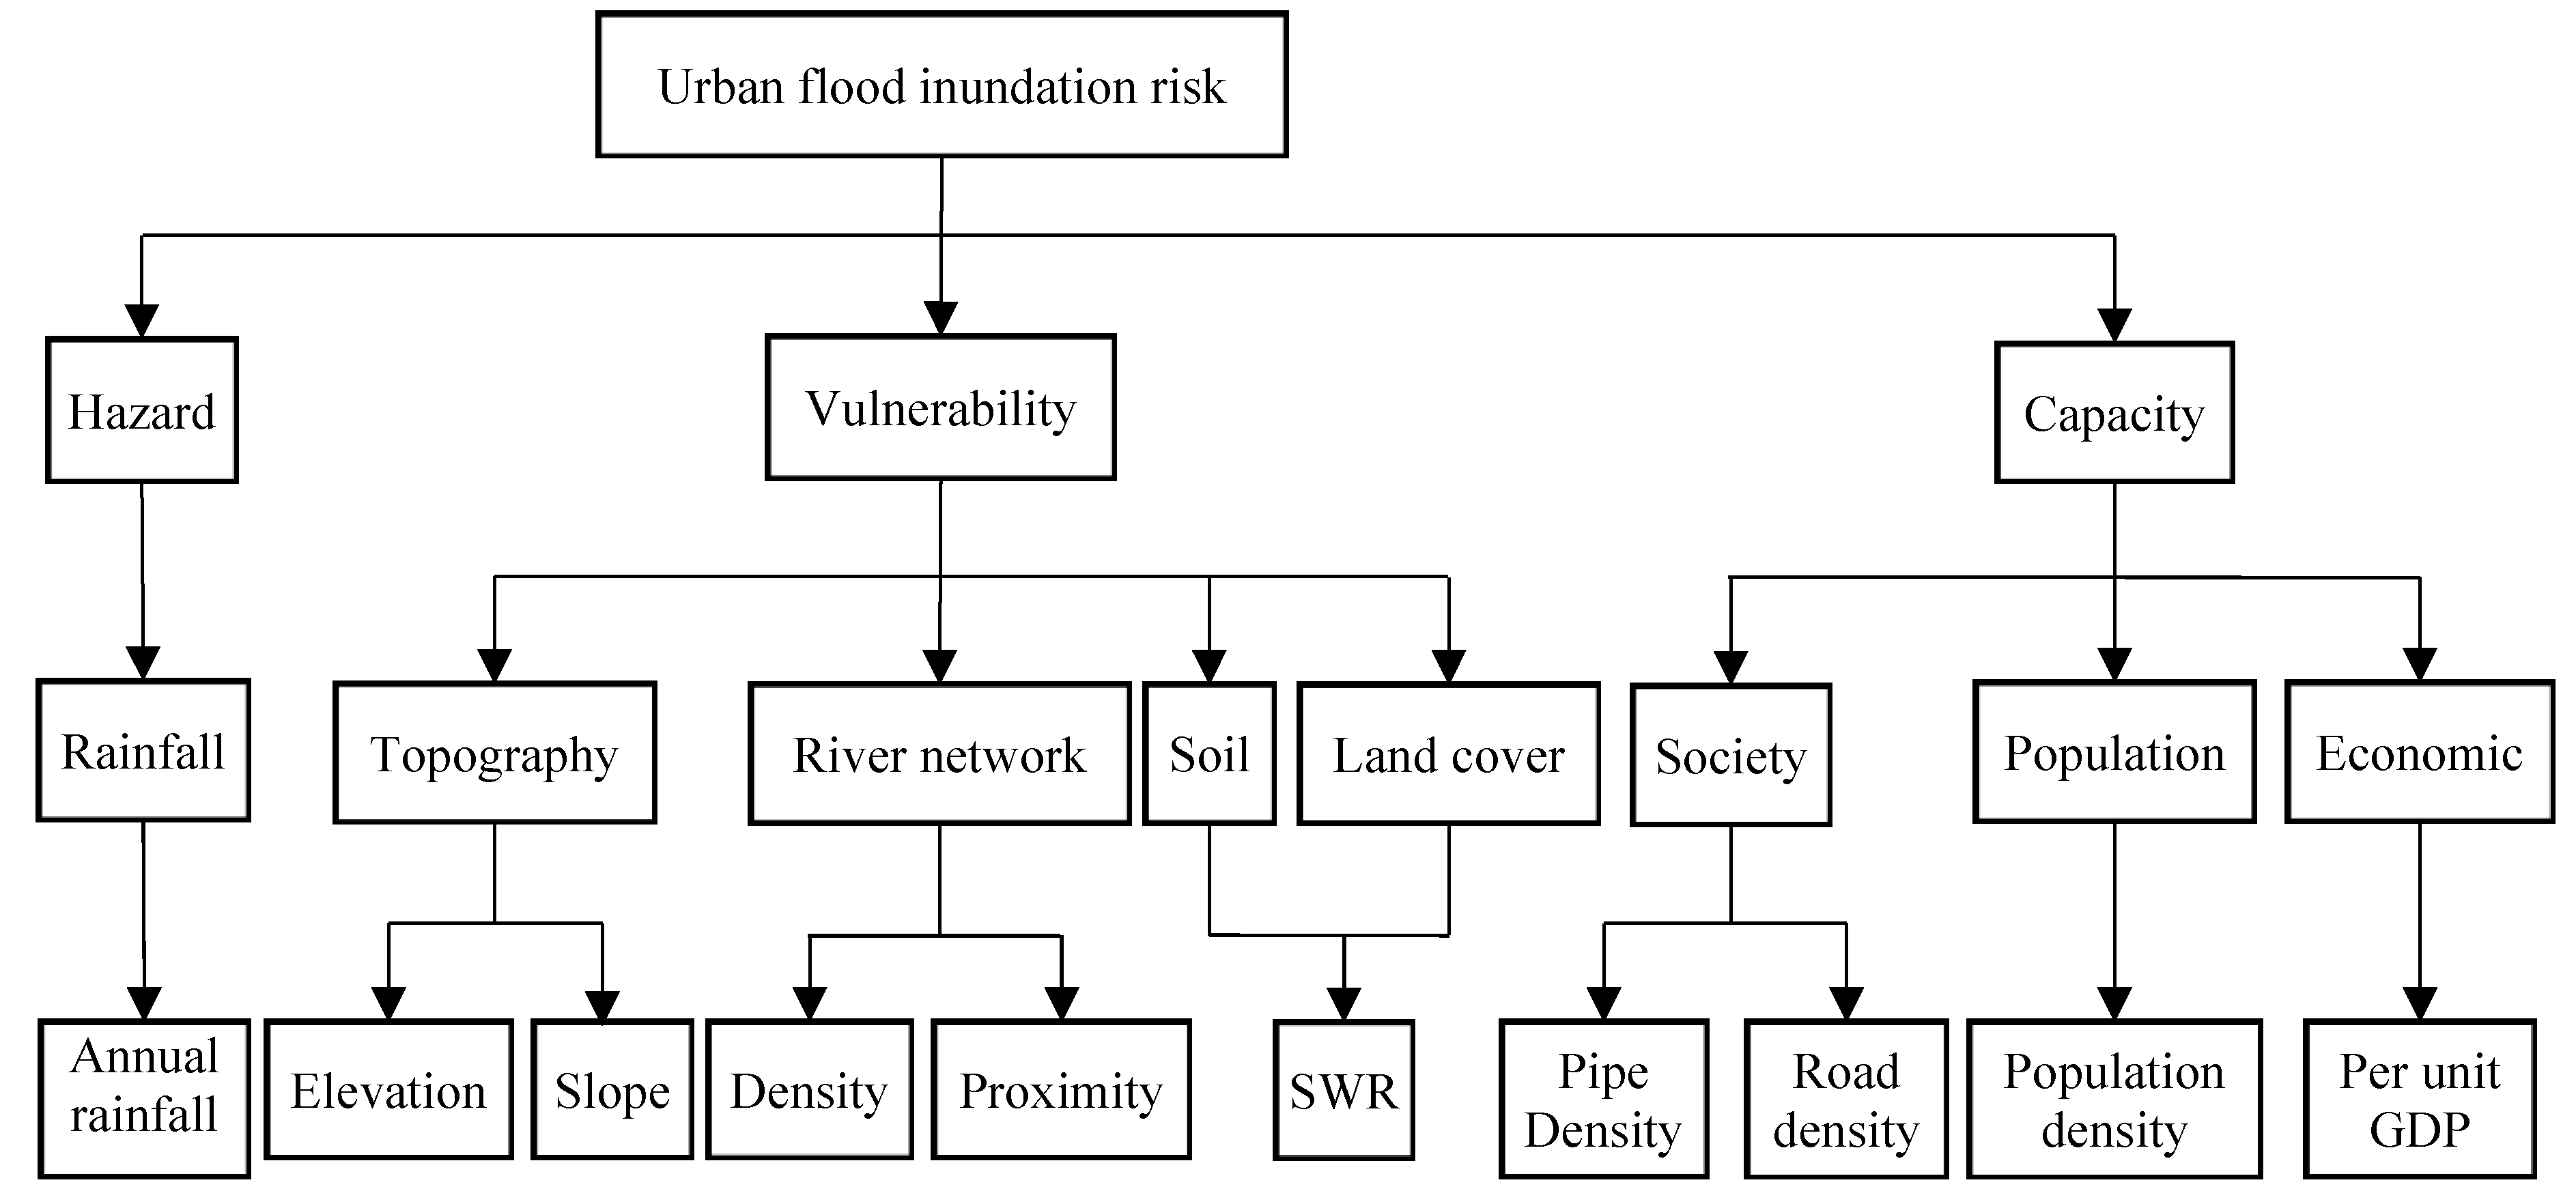
2.2. Selection of Criteria and Risk Factors
2.3. Bayesian Network
2.4. Sensitivity and Influence Strength Analysis Method
3. Study Area and Data
3.1. Study Area
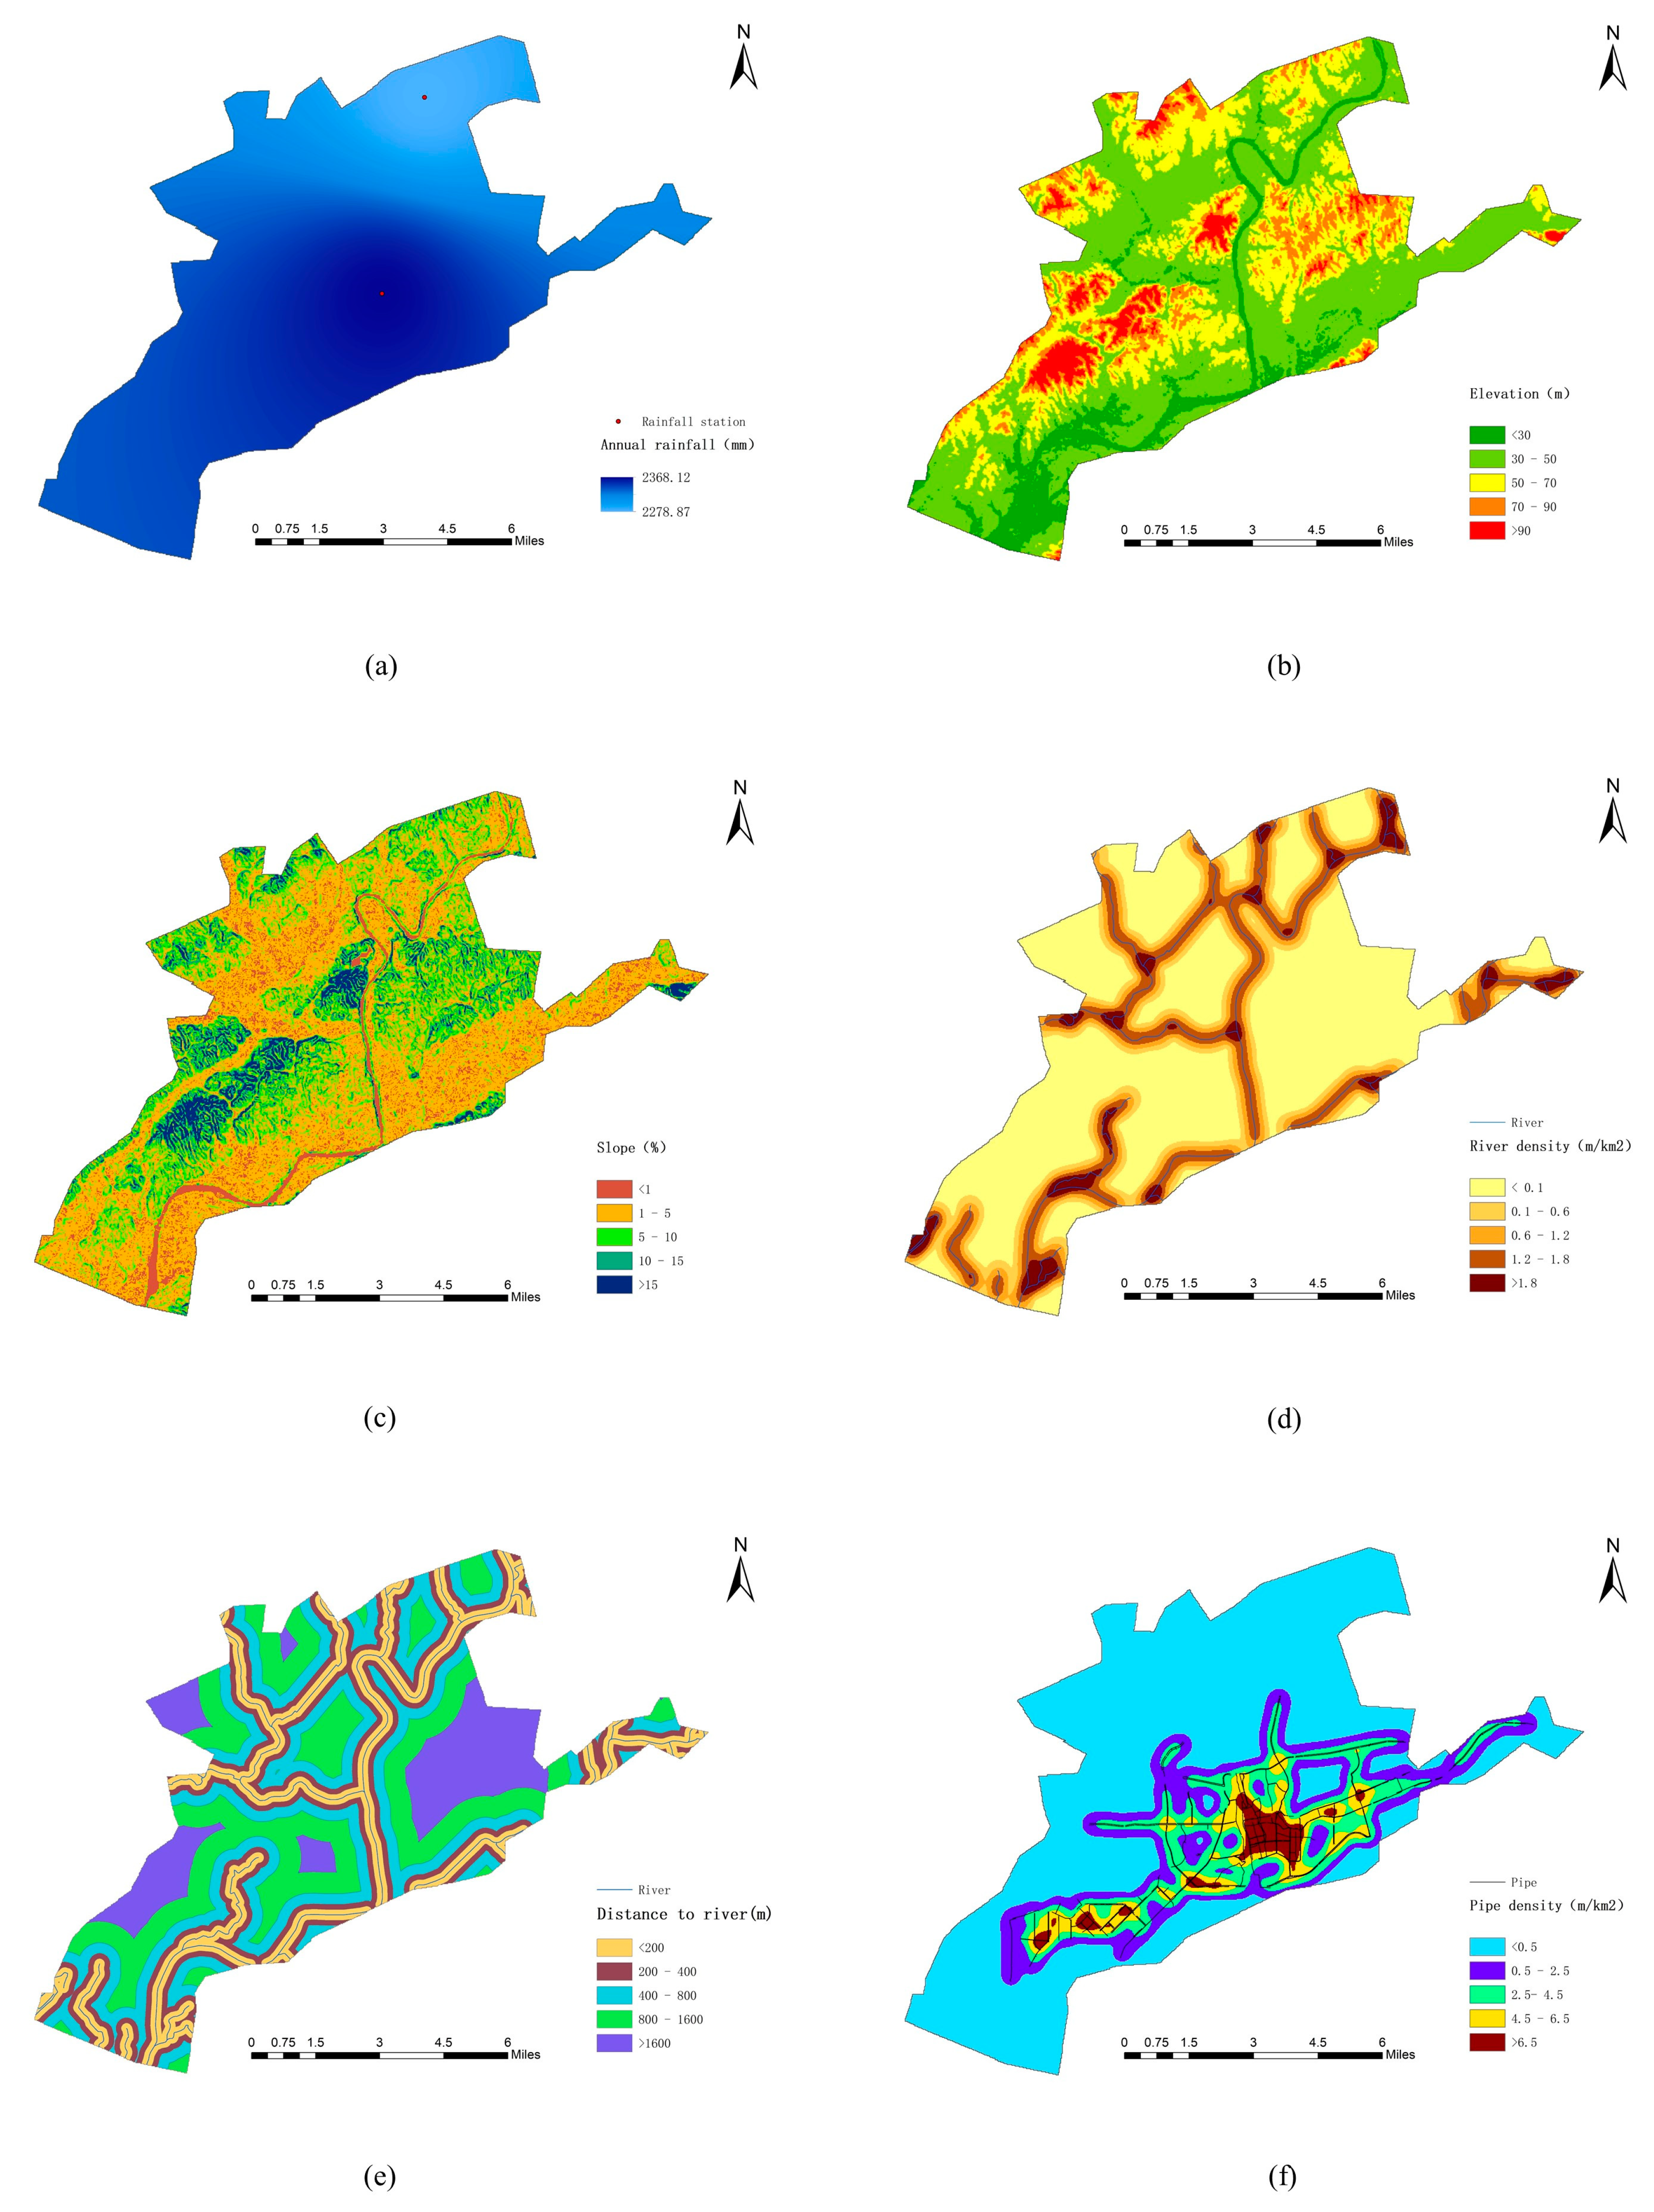
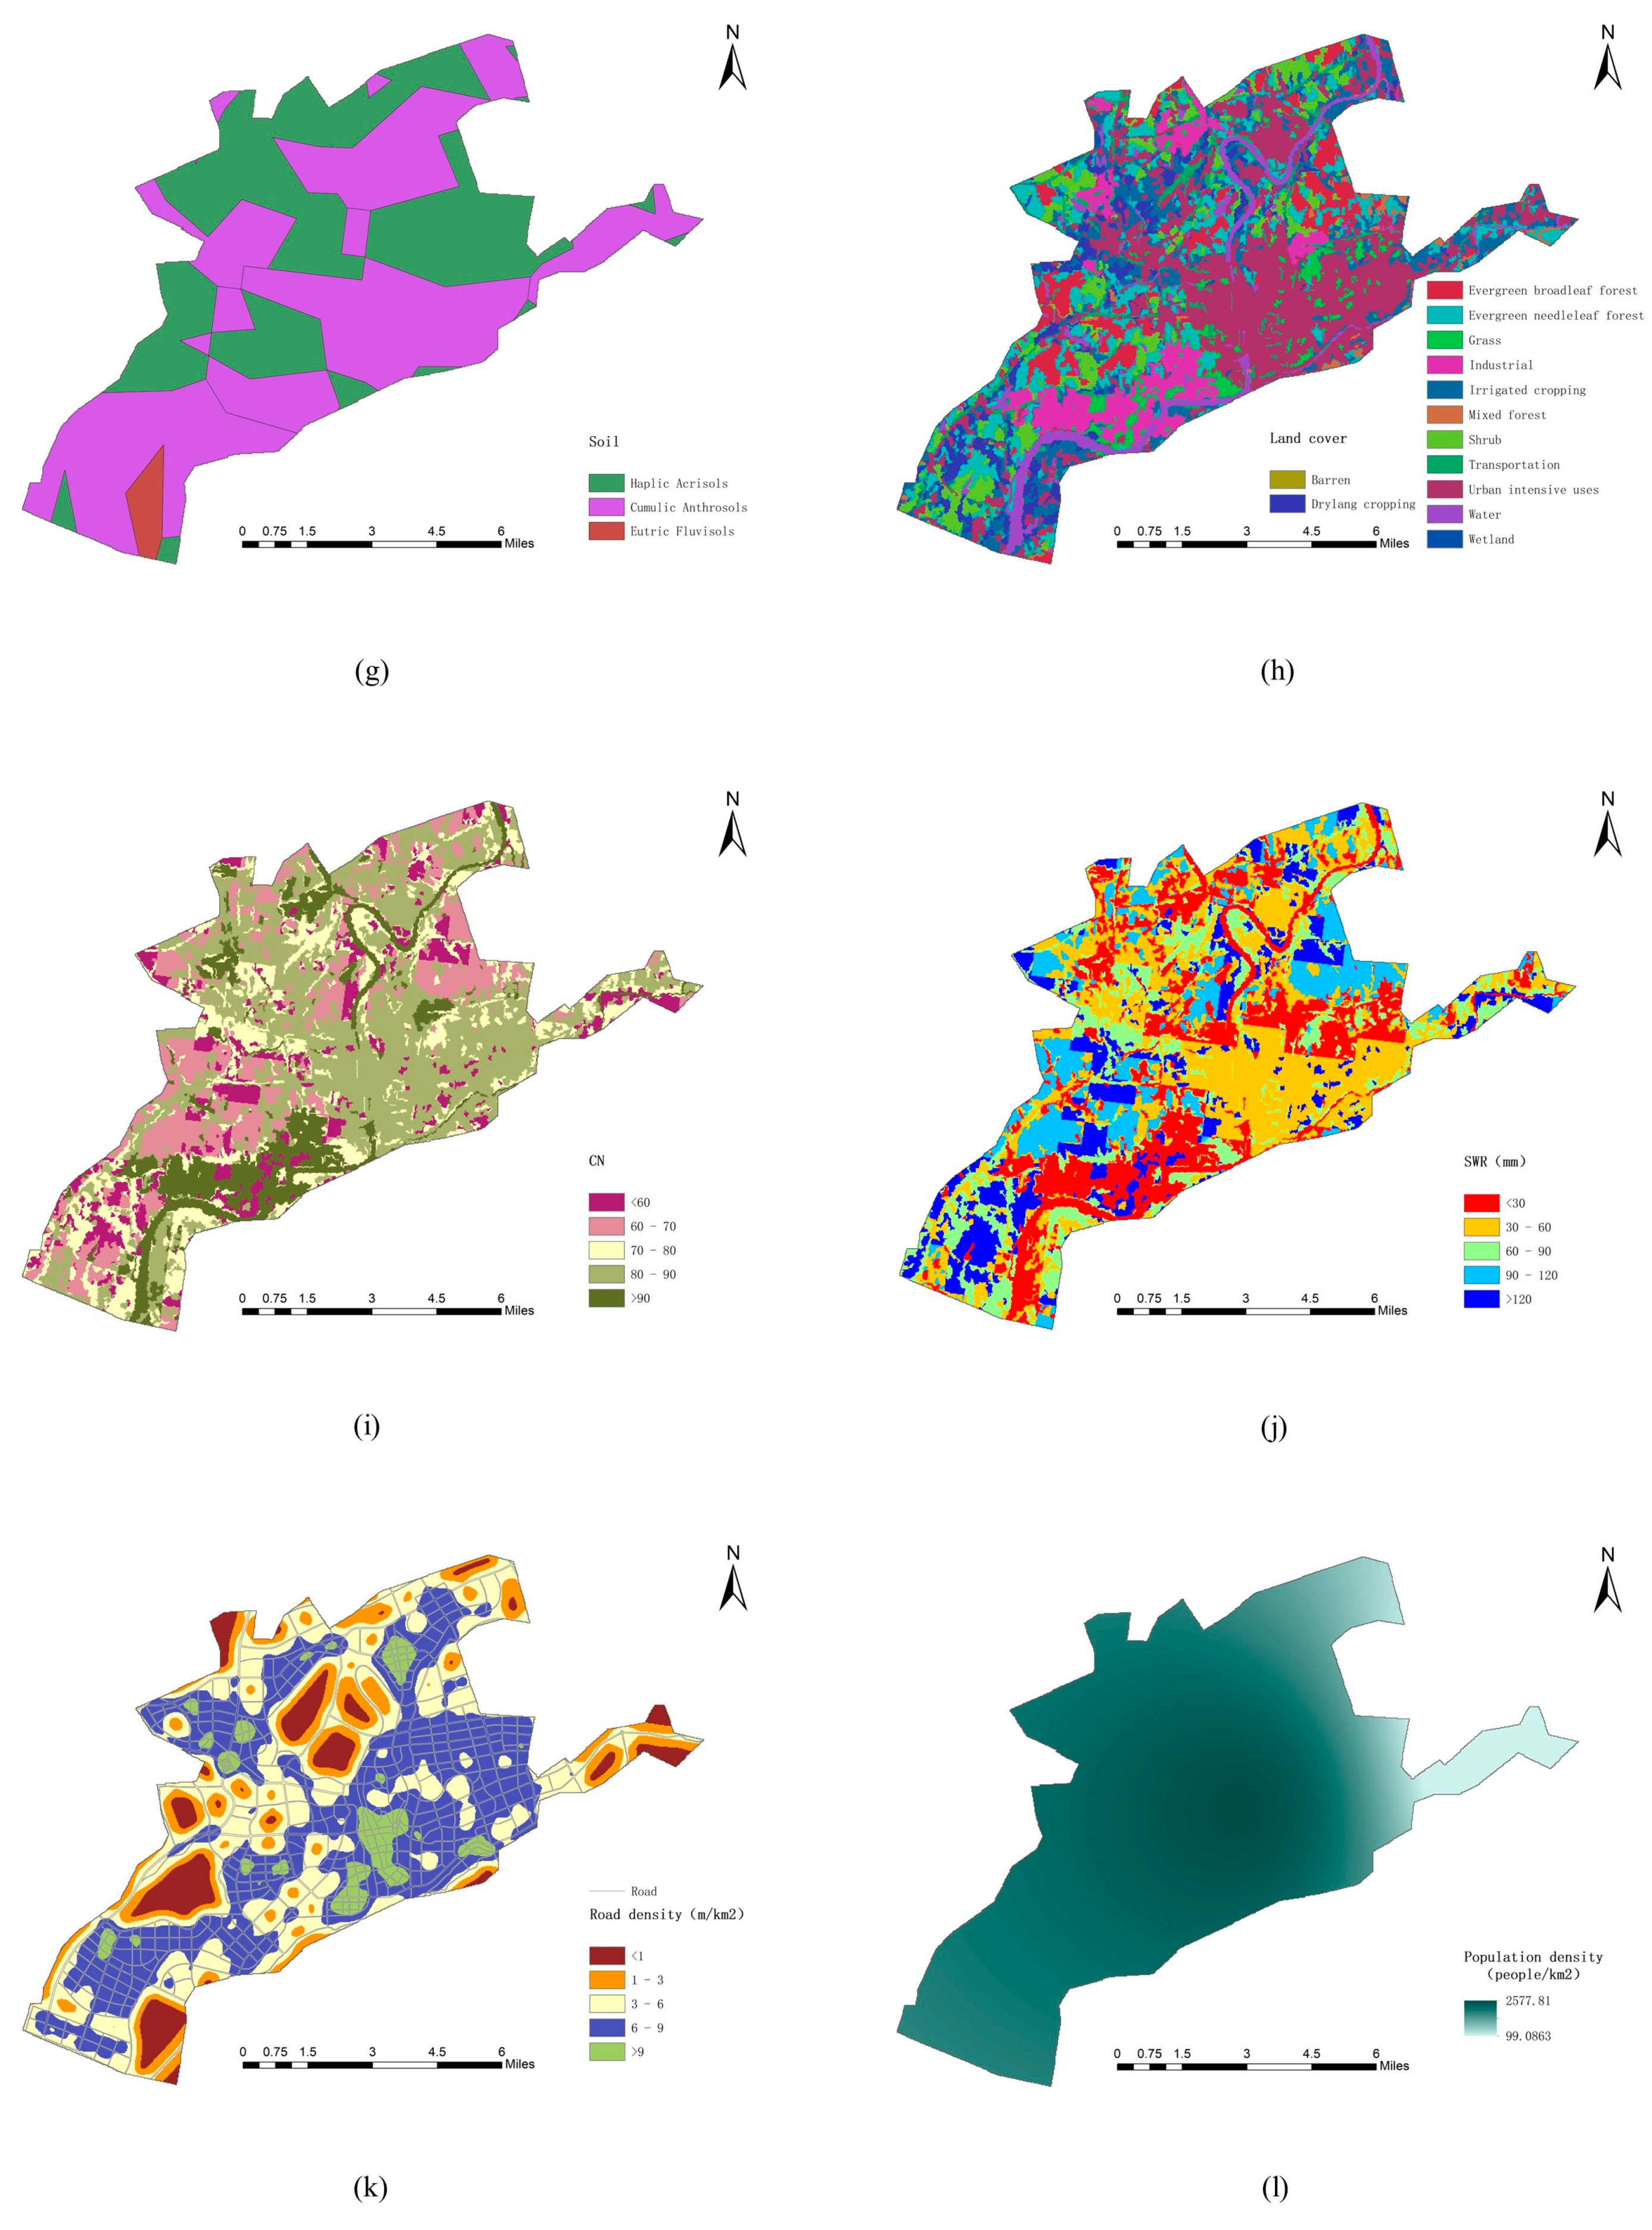
3.2. Data Collection and Preparation
3.3. Classification of Indices
4. Results
4.1. Prior Probability of Risk Factors
4.2. Flood Inundation Risk Map
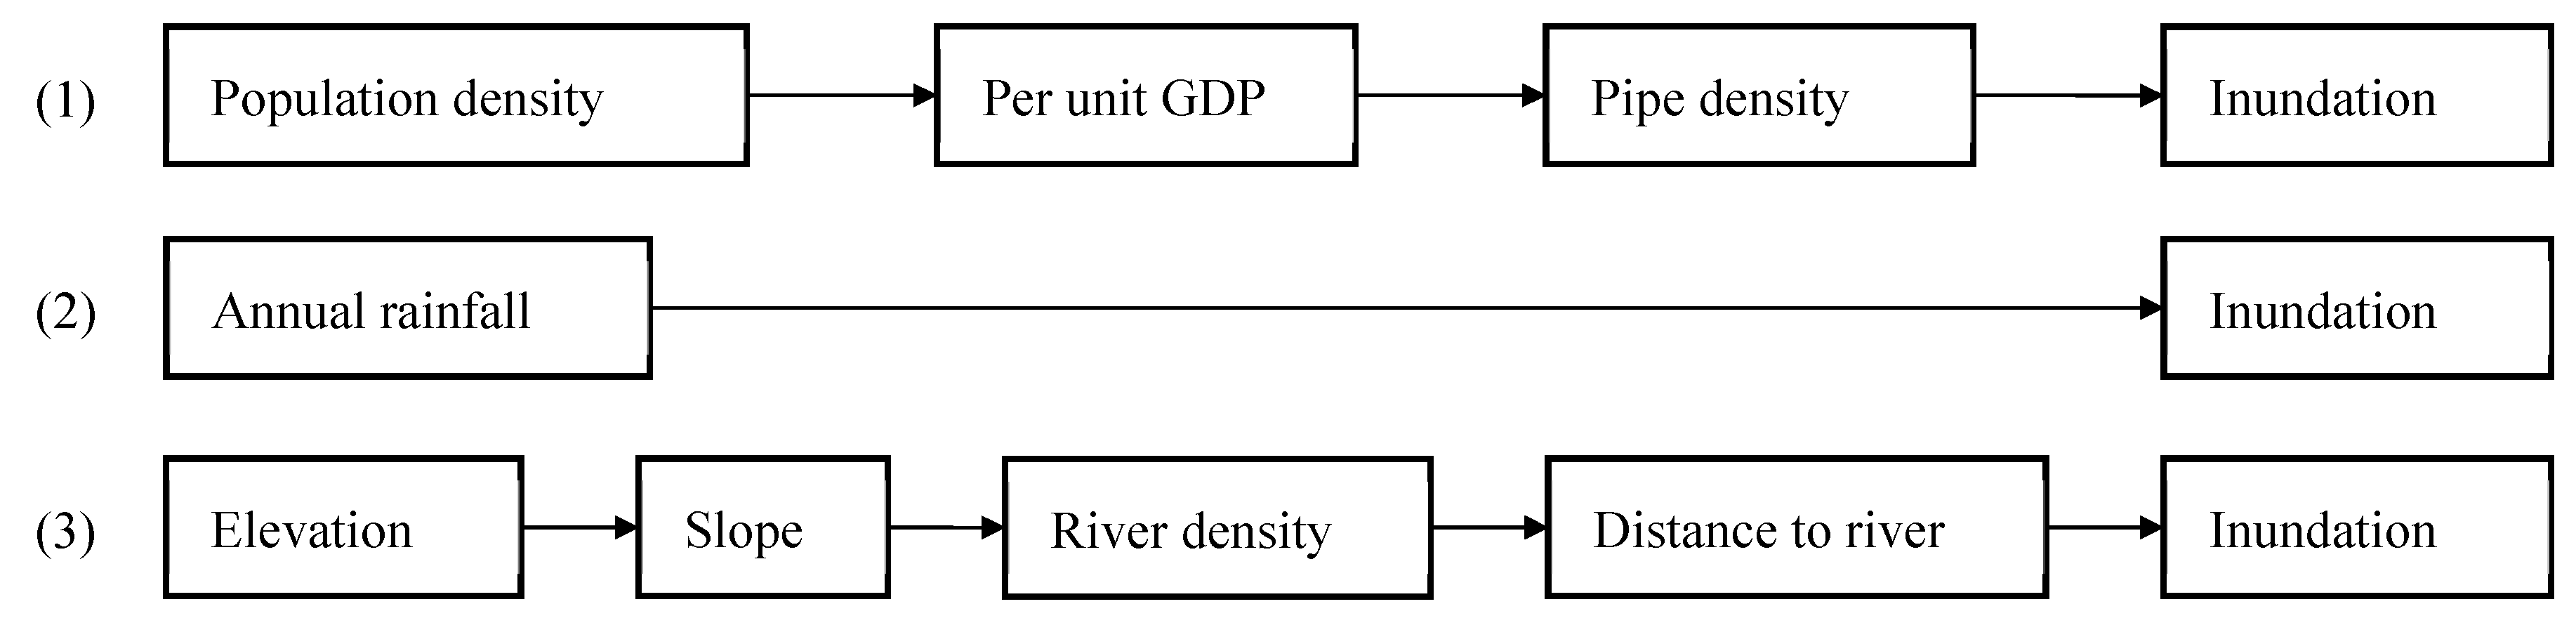
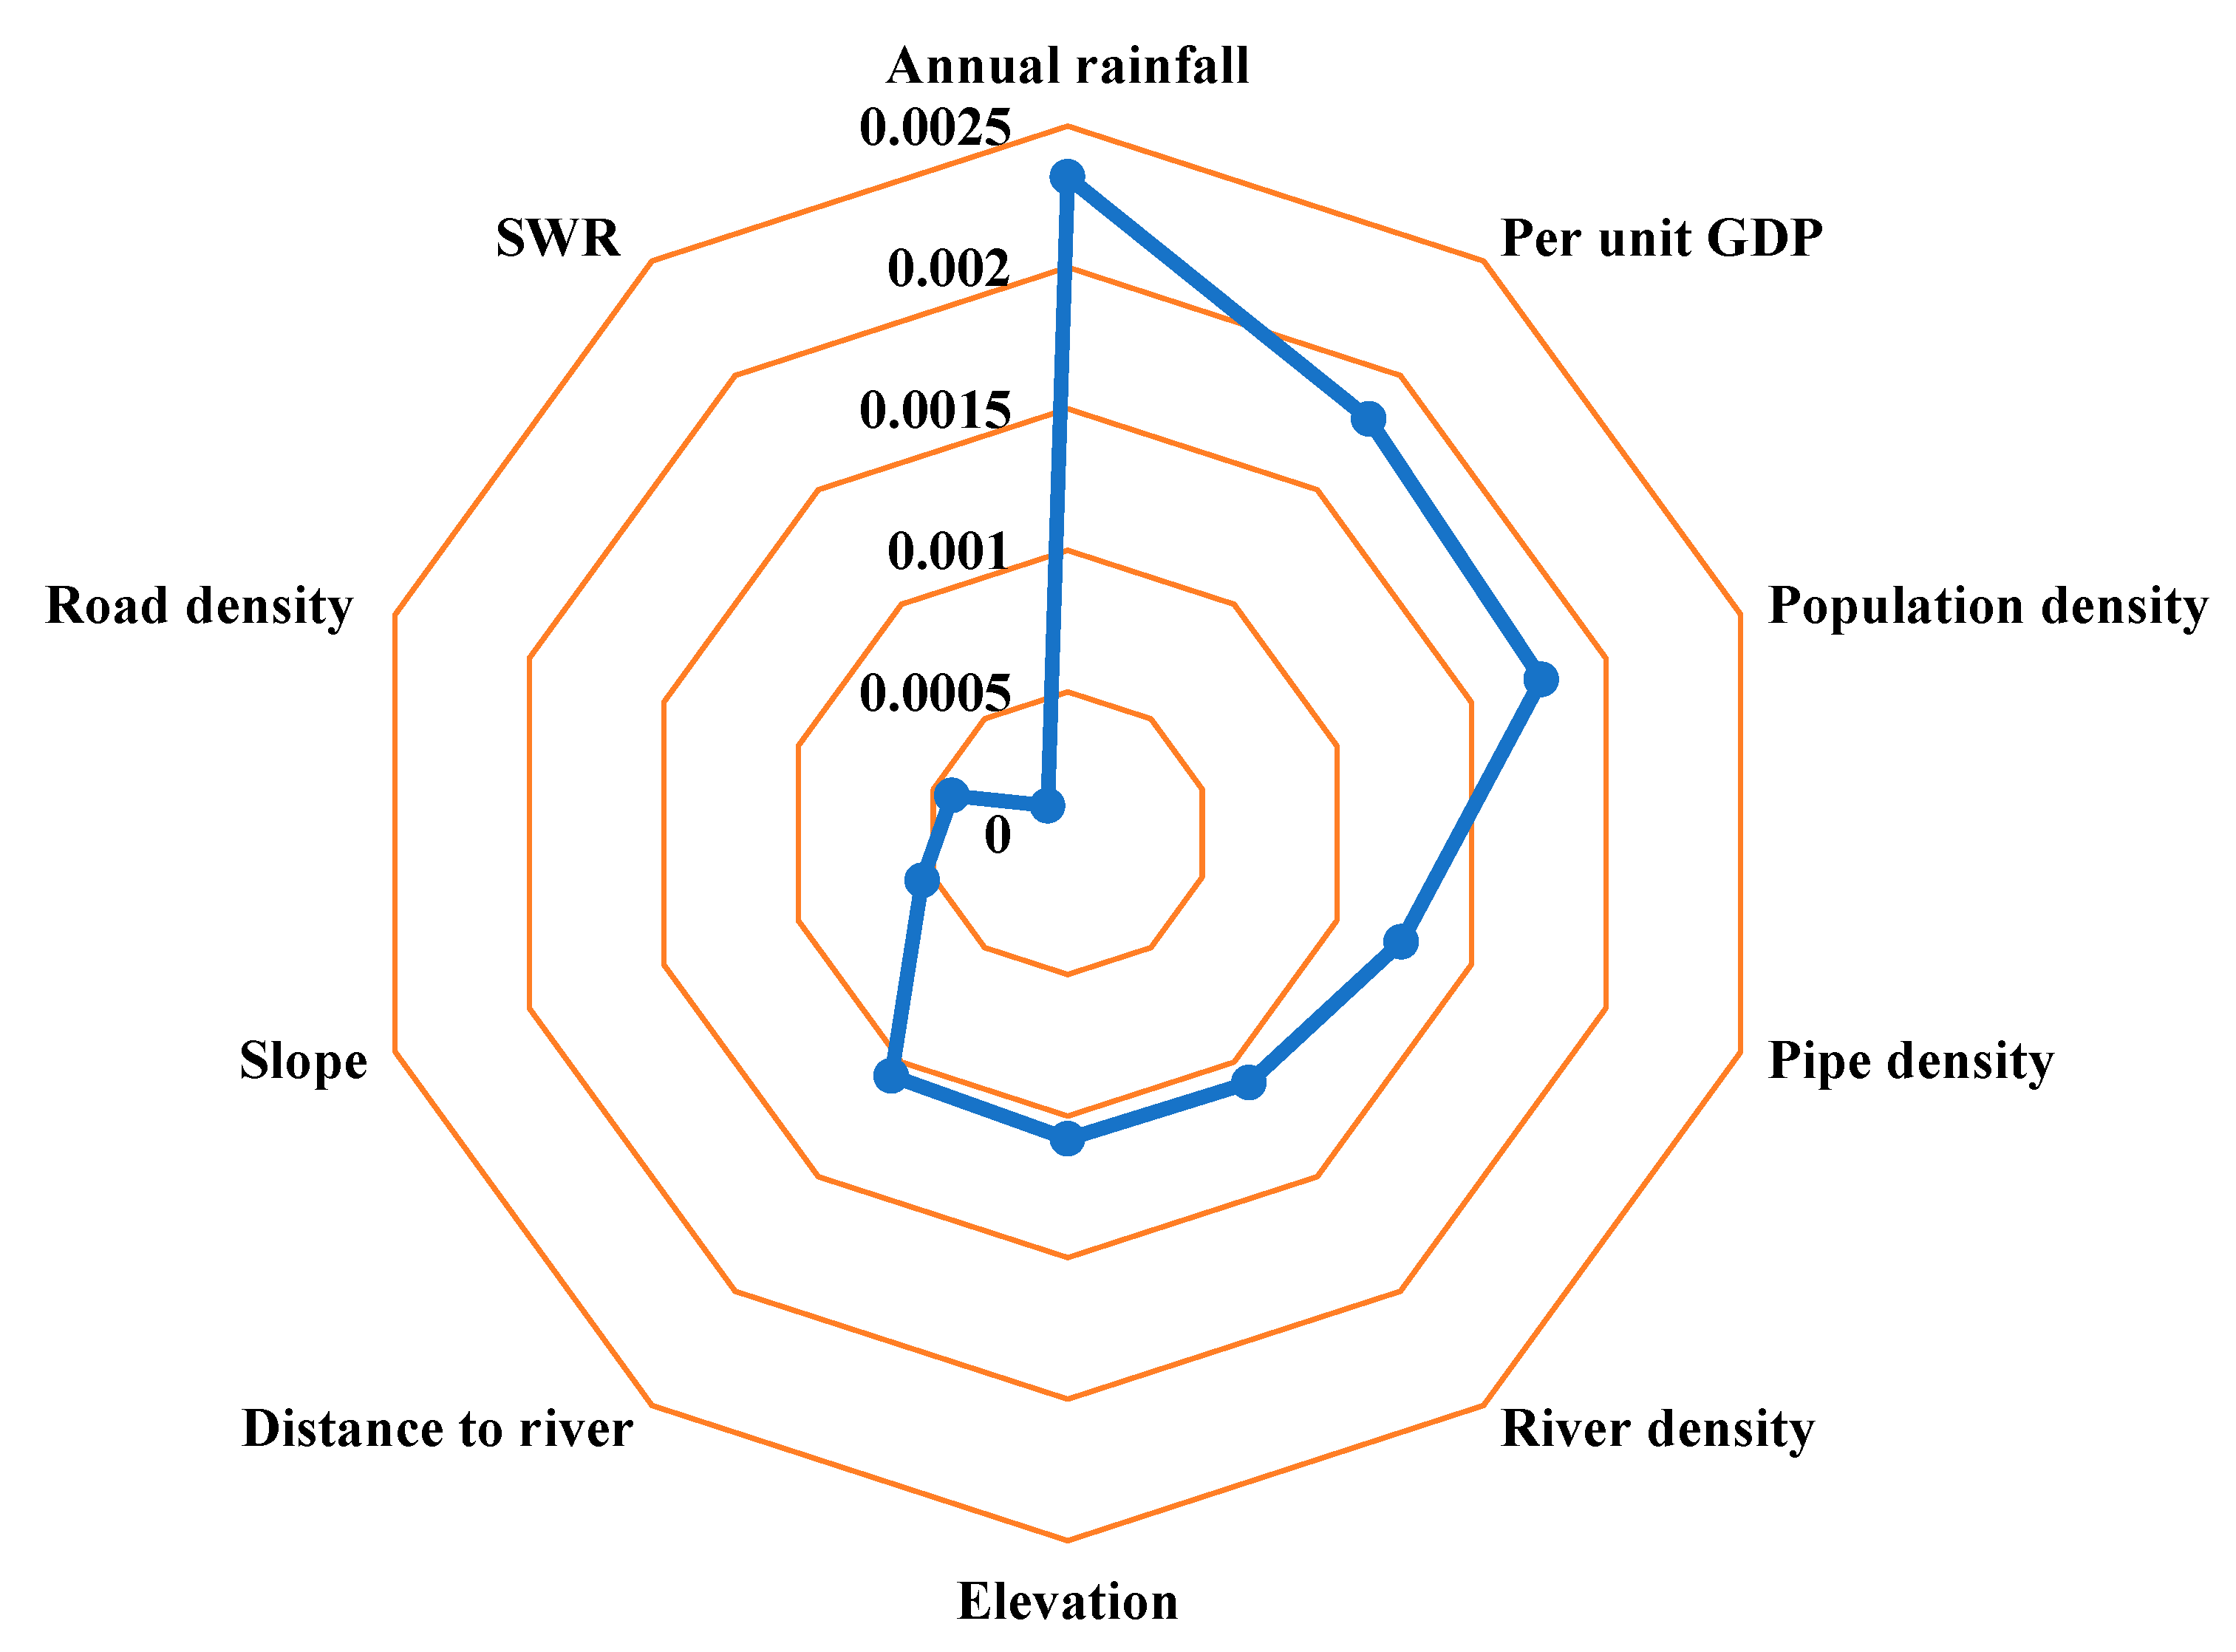
4.3. Key Disaster-Causing Factors Chains
5. Discussion
6. Conclusions
Author Contributions
Funding
Data Availability Statement
Acknowledgments
Conflicts of Interest
References
- Jamali, B.; Löwe, R.; Bach, P.M.; Urich, C.; Arnbjerg-Nielsen, K.; Deletic, A. A rapid urban flood inundation and damage assessment model. J. Hydrol. 2018, 564, 1085–1098. [Google Scholar] [CrossRef]
- Darabi, H.; Choubin, B.; Rahmati, O.; Torabi Haghighi, A.; Pradhan, B.; Kløve, B. Urban flood risk mapping using the GARP and QUEST models: A comparative study of machine learning techniques. J. Hydrol. 2019, 569, 142–154. [Google Scholar] [CrossRef]
- D’Addabbo, A.; Refice, A.; Pasquariello, G.; Lovergine, F.P.; Capolongo, D.; Manfreda, S. A Bayesian Network for Flood Detection Combining SAR Imagery and Ancillary Data. IEEE Trans. Geosci. Remote Sens. 2016, 54, 3612–3625. [Google Scholar] [CrossRef]
- UNDRR. Understanding Risk. 2015. Available online: https://www.undrr.org/building-risk-knowledge/understanding-risk (accessed on 8 February 2021).
- Li, J.; Chen, H.; Liu, Z.; Zou, C. Integrated GIS/AHP-based flood disaster risk assessment and zonation: A case study of Henan Province, China. Proc. SPIE 2010. [Google Scholar] [CrossRef]
- Danumah, J.H.; Odai, S.N.; Saley, B.M.; Szarzynski, J.; Thiel, M.; Kwaku, A.; Kouame, F.K.; Akpa, L.Y. Flood risk assessment and mapping in Abidjan district using multi-criteria analysis (AHP) model and geoinformation techniques, (cote d’ivoire). Geoenviron. Disasters 2016, 3, 10. [Google Scholar] [CrossRef]
- Abhishek, G.; Kumar, K.S. Application of analytical hierarchy process (AHP) for flood risk assessment: A case study in Malda district of West Bengal, India. Nat. Hazard. 2018, 94, 349–368. [Google Scholar] [CrossRef]
- Zou, Q.; Zhou, J.; Zhou, C.; Song, L.; Guo, J. Comprehensive flood risk assessment based on set pair analysis-variable fuzzy sets model and fuzzy AHP. Stochastic Environ. Res. Risk Assess. 2013, 27, 525–546. [Google Scholar] [CrossRef]
- Lyu, H.; Sun, W.; Shen, S.; Arulrajah, A. Flood risk assessment in metro systems of mega-cities using a GIS-based modeling approach. Sci. Total Environ. 2018, 626, 1012–1025. [Google Scholar] [CrossRef]
- Lin, L.; Hu, C.; Wu, Z. Assessment of Flood Hazard Based on Underlying Surface Change by Using GIS and Analytic Hierarchy Process. Geo-Spatial Knowl. Intell. 2017, 698, 589–599. [Google Scholar] [CrossRef]
- Joo, H.; Choi, C.; Kim, J.; Kim, D.; Kim, S.; Kim, H.S. A Bayesian Network-Based Integrated for Flood Risk Assessment (InFRA). Sustainability 2019, 11, 3733. [Google Scholar] [CrossRef]
- Xu, H.; Ma, C.; Lian, J.; Xu, K.; Chaima, E. Urban flooding risk assessment based on an integrated k-means cluster algorithm and improved entropy weight method in the region of Haikou, China. J. Hydrol. 2018, 563, 975–986. [Google Scholar] [CrossRef]
- Jato-Espino, D.; Lobo, A.; Ascorbe-Salcedo, A. Urban flood risk mapping using an optimised additive weighting methodology based on open data. J. Flood Risk Manag. 2019, 12, e12533. [Google Scholar] [CrossRef]
- Mahmoud, S.H.; Gan, T.Y. Multi-criteria approach to develop flood susceptibility maps in arid regions of Middle East. J. Clean. Prod. 2018, 196, 216–229. [Google Scholar] [CrossRef]
- Shadmehri Toosi, A.; Calbimonte, G.H.; Nouri, H.; Alaghmand, S. River basin-scale flood hazard assessment using a modified multi-criteria decision analysis approach: A case study. J. Hydrol. 2019, 574, 660–671. [Google Scholar] [CrossRef]
- Zhao, G.; Pang, B.; Xu, Z.; Peng, D.; Xu, L. Assessment of urban flood susceptibility using semi-supervised machine learning model. Sci. Total Environ. 2018, 659, 940–949. [Google Scholar] [CrossRef] [PubMed]
- Chen, A.S.; Evans, B.; Djordjevi, S.; Savi, D.A. Multi-layered coarse grid modelling in 2D urban flood simulations. J. Hydrol. 2012, 470–471, 1–11. [Google Scholar] [CrossRef]
- Zhang, S.; Pan, B. An urban storm-inundation simulation method based on GIS. J. Hydrol. 2014, 517, 260–268. [Google Scholar] [CrossRef]
- Lhomme, J.; Sayers, P.; Gouldby, B.; Samuels, P.G.; Wills, M. Recent development and application of a rapid flood spreading method. In Floodrisk-Flood Risk Management; Research & Practice: Oxford, UK, 2008. [Google Scholar]
- Wang, Z.; Lai, C.; Chen, X.; Yang, B.; Zhao, S.; Bai, X. Flood hazard risk assessment model based on random forest. J. Hydrol. 2015, 527, 1130–1141. [Google Scholar] [CrossRef]
- Wu, Z.; Zhou, Y.; Wang, H.; Jiang, Z. Depth prediction of urban flood under different rainfall return periods based on deep learning and data warehouse. Sci. Total Environ. 2020, 716, 137077. [Google Scholar] [CrossRef] [PubMed]
- Pourghasemi, H.R.; Razavi-Termeh, S.V.; Kariminejad, N.; Hong, H.; Chen, W. An assessment of metaheuristic approaches for flood assessment. J. Hydrol. 2020, 582, 124536. [Google Scholar] [CrossRef]
- Goodarzi, L.; Banihabib, M.E.; Roozbahani, A. A decision-making model for flood warning system based on ensemble forecasts. J. Hydrol. 2019, 573, 207–219. [Google Scholar] [CrossRef]
- Chen, W.; Li, Y.; Xue, W.; Shahabi, H.; Li, S.; Hong, H.; Wang, X.; Bian, H.; Zhang, S.; Pradhan, B.; et al. Modeling flood susceptibility using data-driven approaches of naive Bayes tree, alternating decision tree, and random forest methods. Sci. Total Environ. 2020, 701, 134979. [Google Scholar] [CrossRef] [PubMed]
- Tang, X.; Shu, Y.; Lian, Y.; Zhao, Y.; Fu, Y. A spatial assessment of urban waterlogging risk based on a Weighted Naive Bayes classifier. Sci. Total Environ. 2018, 630, 264–274. [Google Scholar] [CrossRef] [PubMed]
- Liu, R.; Chen, Y.; Wu, J.; Gao, L.; Barrett, D.; Xu, T.; Li, L.; Huang, C.; Yu, J. Assessing spatial likelihood of flooding hazard using naïve Bayes and GIS: A case study in Bowen Basin, Australia. Stochastic Environ. Res. Risk Assess. 2015, 30, 1575–1590. [Google Scholar] [CrossRef]
- Liu, R.; Chen, Y.; Wu, J.; Gao, L.; Barrett, D.; Xu, T.; Li, X.; Li, L.; Huang, C.; Yu, J. Integrating Entropy-Based Naive Bayes and GIS for Spatial Evaluation of Flood Hazard. Risk Anal. 2017, 37, 756–773. [Google Scholar] [CrossRef] [PubMed]
- Li, L.; Wang, J.; Leung, H. Using spatial analysis and Bayesian network to model the vulnerability and make insurance pricing of catastrophic risk. Int. J. Geog. Inf. Sci. 2010, 24, 1759–1784. [Google Scholar] [CrossRef]
- Wu, Z.; Shen, Y.; Wang, H.; Wu, M. Urban flood disaster risk evaluation based on ontology and Bayesian Network. J. Hydrol. 2020, 583, 124596. [Google Scholar] [CrossRef]
- Aguilera, P.A.; Fernández, A.; Ropero, R.F.; Molina, L. Groundwater quality assessment using data clustering based on hybrid Bayesian networks. Stochastic Environ. Res. Risk Assess. 2013, 27, 435–447. [Google Scholar] [CrossRef]
- Hosseini, F.S.; Choubin, B.; Mosavi, A.; Nabipour, N.; Shamshirband, S.; Darabi, H.; Haghighi, A.T. Flash-flood hazard assessment using ensembles and Bayesian-based machine learning models: Application of the simulated annealing feature selection method. Sci. Total Environ. 2020, 711, 135161. [Google Scholar] [CrossRef]
- Rana, I.A.; Routray, J.K. Integrated methodology for flood risk assessment and application in urban communities of Pakistan. Nat. Hazard. 2017, 91, 239–266. [Google Scholar] [CrossRef]
- Abebe, Y.; Kabir, G.; Tesfamariam, S. Assessing urban areas vulnerability to pluvial flooding using GIS applications and Bayesian Belief Network model. J. Clean. Prod. 2018, 174, 1629–1641. [Google Scholar] [CrossRef]
- Wu, Z.; Shen, Y.; Wang, H.; Wu, M. Assessing urban flood disaster risk using Bayesian network model and GIS applications. Geomat. Nat. Hazard. Risk 2019, 10, 2163–2184. [Google Scholar] [CrossRef]
- Julia Flores, M.; Ropero, R.F.; Rumi, R. Assessment of flood risk in Mediterranean catchments: An approach based on Bayesian networks. Stochastic Environ. Res. Risk Assess 2019, 33, 1991–2005. [Google Scholar] [CrossRef]
- Sanuy, M.; Jiménez, J.A.; Plant, N. A Bayesian Network methodology for coastal hazard assessments on a regional scale: The BN-CRAF. Coast. Eng. 2020, 157. [Google Scholar] [CrossRef]
- Balbi, S.; Villa, F.; Mojtahed, V.; Hegetschweiler, K.T.; Giupponi, C. A spatial Bayesian network model to assess the benefits of early warning for urban flood risk to people. Nat. Hazards Earth Syst. Sci. 2016, 16, 1323–1337. [Google Scholar] [CrossRef]
- Ma, Z.; Xie, Z. Evolution Mechanism of Earthquake-induced Urban Disasters Based on Bayesian Networks. J. Catastrophology 2012, 27, 1–5. (In Chinese) [Google Scholar] [CrossRef]
- Si, H.; Zhang, J.; Guo, E.; Rina, W.U.; Qiyun, M.A.; Wang, Y. Study on inference model of the grassland drought and snow disaster chain based on Bayesian networks. J. Nat. Disasters 2016, 25, 20–29. (In Chinese) [Google Scholar] [CrossRef]
- Xu, H.; Zhang, Y.; Li, H.; Skitmore, M.; Yang, J.; Yu, F. Safety risks in rail stations: An interactive approach. J. Rail Transp. Plann. Manag. 2019, 11, 100148. [Google Scholar] [CrossRef]
- Wu, Z.; Shen, Y.; Wang, H.; Wu, M. An ontology-based framework for heterogeneous data management and its application for urban flood disasters. Earth Sci. Inf. 2020, 13, 377–390. [Google Scholar] [CrossRef]
- Vogel, K.; Riggelsen, C.; Korup, O.; Scherbaum, F. Bayesian network learning for natural hazard analyses. Nat. Hazard. Earth Syst. Sci. 2014, 14, 2605–2626. [Google Scholar] [CrossRef]
- UNDRR. The Sendai Framework for Disaster Risk Reduction 2015–2030. 2015. Available online: https://www.preventionweb.net/files/resolutions/N1516715.pdf (accessed on 8 February 2021).
- Chen, Y.; Liu, R.; Barrett, D.; Gao, L.; Zhou, M.; Renzullo, L.; Emelyanova, I. A spatial assessment framework for evaluating flood risk under extreme climates. Sci. Total Environ. 2015, 538, 512–523. [Google Scholar] [CrossRef]
- Pearl, J. Probabilistic Reasoning in Intelligent Systems: Networks of Plausible Inference; Morgan Kaufmann: San Francisco, CA, USA, 1988. [Google Scholar]
- Chen, S.H.; Pollino, C.A. Good practice in Bayesian network modelling. Environ. Modell. Softw. 2012, 37, 134–145. [Google Scholar] [CrossRef]
- Laskey, K.B. Sensitivity analysis for probability assessments in Bayesian networks. IEEE Trans. Syst. Man Cybern. Syst. 1993, 25, 901–909. [Google Scholar] [CrossRef]
- Zhang, S.; Guo, H.; Zhu, K.; Yu, S.; Li, J. Multistage assignment optimization for emergency rescue teams in the disaster chain. Knowl. Syst. 2017, 137, 123–137. [Google Scholar] [CrossRef]
- Han, S.; Coulibaly, P. Bayesian flood forecasting methods: A review. J. Hydrol. 2017, 551, 340–351. [Google Scholar] [CrossRef]
- Theijssen, D.; ten Bosch, L.; Boves, L.; Cranen, B.; van Halteren, H. Choosing alternatives: Using Bayesian Networks and memory-based learning to study the dative alternation. Corpus Ling. Ling. Theory 2013, 9, 227–262. [Google Scholar] [CrossRef]
- BayesFusion. GeNIe. 2019. Available online: https://www.bayesfusion.com/ (accessed on 15 April 2020).
- Shadeed, S.; Almasri, M. Application of GIS-based SCS-CN method in West Bank catchments, Palestine. Water Sci. Eng. 2010, 3, 1–13. [Google Scholar] [CrossRef]
- Chen, W.; Xie, X.; Peng, J.; Shahabi, H.; Hong, H.; Bui, D.T.; Duan, Z.; Li, S.; Zhu, A.X. GIS-based landslide susceptibility evaluation using a novel hybrid integration approach of bivariate statistical based random forest method. CATENA 2018, 164, 135–149. [Google Scholar] [CrossRef]
- Chapi, K.; Singh, V.P.; Shirzadi, A.; Shahabi, H.; Bui, D.T.; Pham, B.T.; Khosravi, K. A novel hybrid artificial intelligence approach for flood susceptibility assessment. Environ. Modell. Softw. 2017, 95, 229–245. [Google Scholar] [CrossRef]
- Jiménez-Valverde, A. Insights into the area under the receiver operating characteristic curve (AUC) as a discrimination measure in species distribution modelling. Global Ecol. Biogeogr. 2012, 21, 498–507. [Google Scholar] [CrossRef]
- Wu, Z.; Shen, Y.; Wang, H. Assessing Urban Areas’ Vulnerability to Flood Disaster Based on Text Data: A Case Study in Zhengzhou City. Sustainability 2019, 11, 4548. [Google Scholar] [CrossRef]
- Sun, D.; Wang, H.; Huang, J.; Liu, G. Analysis of Urban Flood Disaster Risk in the Poyang Lake Basin and Land Type Adjustment Strategy Study —A Case Study of Jingdezhen City. Resour. Emviron. Yangtze Basin 2018, 27, 2856–2866. (In Chinese) [Google Scholar] [CrossRef]
- Hong, H.; Tsangaratos, P.; Ilia, I.; Liu, J.; Zhu, A.-X.; Chen, W. Application of fuzzy weight of evidence and data mining techniques in construction of flood susceptibility map of Poyang County, China. Sci Total Environ. 2018, 625, 575–588. [Google Scholar] [CrossRef] [PubMed]
- Maria, P.; Han, D.; Anna, L.J.; Risi, R.D.; Agarwal, J.; Huang, J. Resilient infrastructures for reducing urban flooding risks. In Water-Wise Cities and Sustainable Water Systems: Concepts, Technologies, and Applications; Wang, X.C., Fu, G., Eds.; IWA Publishing: London, UK, 2020; pp. 181–200. [Google Scholar]
- Granados-Bolaños, S.; Quesada-Román, A.; Alvarado, G.E. Low-cost UAV applications in dynamic tropical volcanic landforms. J. Volcanol. Geotherm. Res. 2020, 107143. [Google Scholar] [CrossRef]


| Class | Indices | |||||||||
|---|---|---|---|---|---|---|---|---|---|---|
| Annual Rainfall (mm) | Elevation (m) | Slope (%) | River Density (m/km2) | Distance to River (m) | SWR (mm) | Pipe Density (m/km2) | Road Density (m/km2) | Population Density (people/km2) | Per Unit GDP (Ten Thousand RMB/km2) | |
| Very_low | <2297.07 | >90 | >15 | <0.1 | >1600 | >120 | >6.5 | >9 | <740.64 | >17,182.36 |
| Low | 2297.07–2317.37 | 70–90 | 10–15 | 0.1–0.6 | 800–1600 | 90–120 | 4.5–6.5 | 6–9 | 740.64–1489.11 | 13,189.3–17,182.36 |
| Moderate | 2317.37–2334.87 | 50–70 | 5–10 | 0.6–1.2 | 400–800 | 60–90 | 2.5–4.5 | 3–6 | 1489.11–1926.54 | 9196.24–13,189.3 |
| High | 2334.87–2351.32 | 30–50 | 1–5 | 1.2–1.8 | 200–400 | 30–60 | 0.5–2.5 | 1–3 | 1926.54–2266.75 | 4863.34–9196.24 |
| Very_high | >2351.32 | <30 | <1 | >1.8 | <200 | <30 | <0.5 | <1 | >2266.75 | <4863.34 |
| Class | Very Low | Low | Moderate | High | Very High |
|---|---|---|---|---|---|
| Risk | 0.00059–0.10597 | 0.10597–0.29722 | 0.29722–0.54702 | 0.54702–0.80462 | 0.80462–0.995868 |
| Number | 145,165 | 25,990 | 12,305 | 11,269 | 19,149 |
| Proportion | 67.87% | 12.15% | 5.75% | 5.27% | 8.95% |
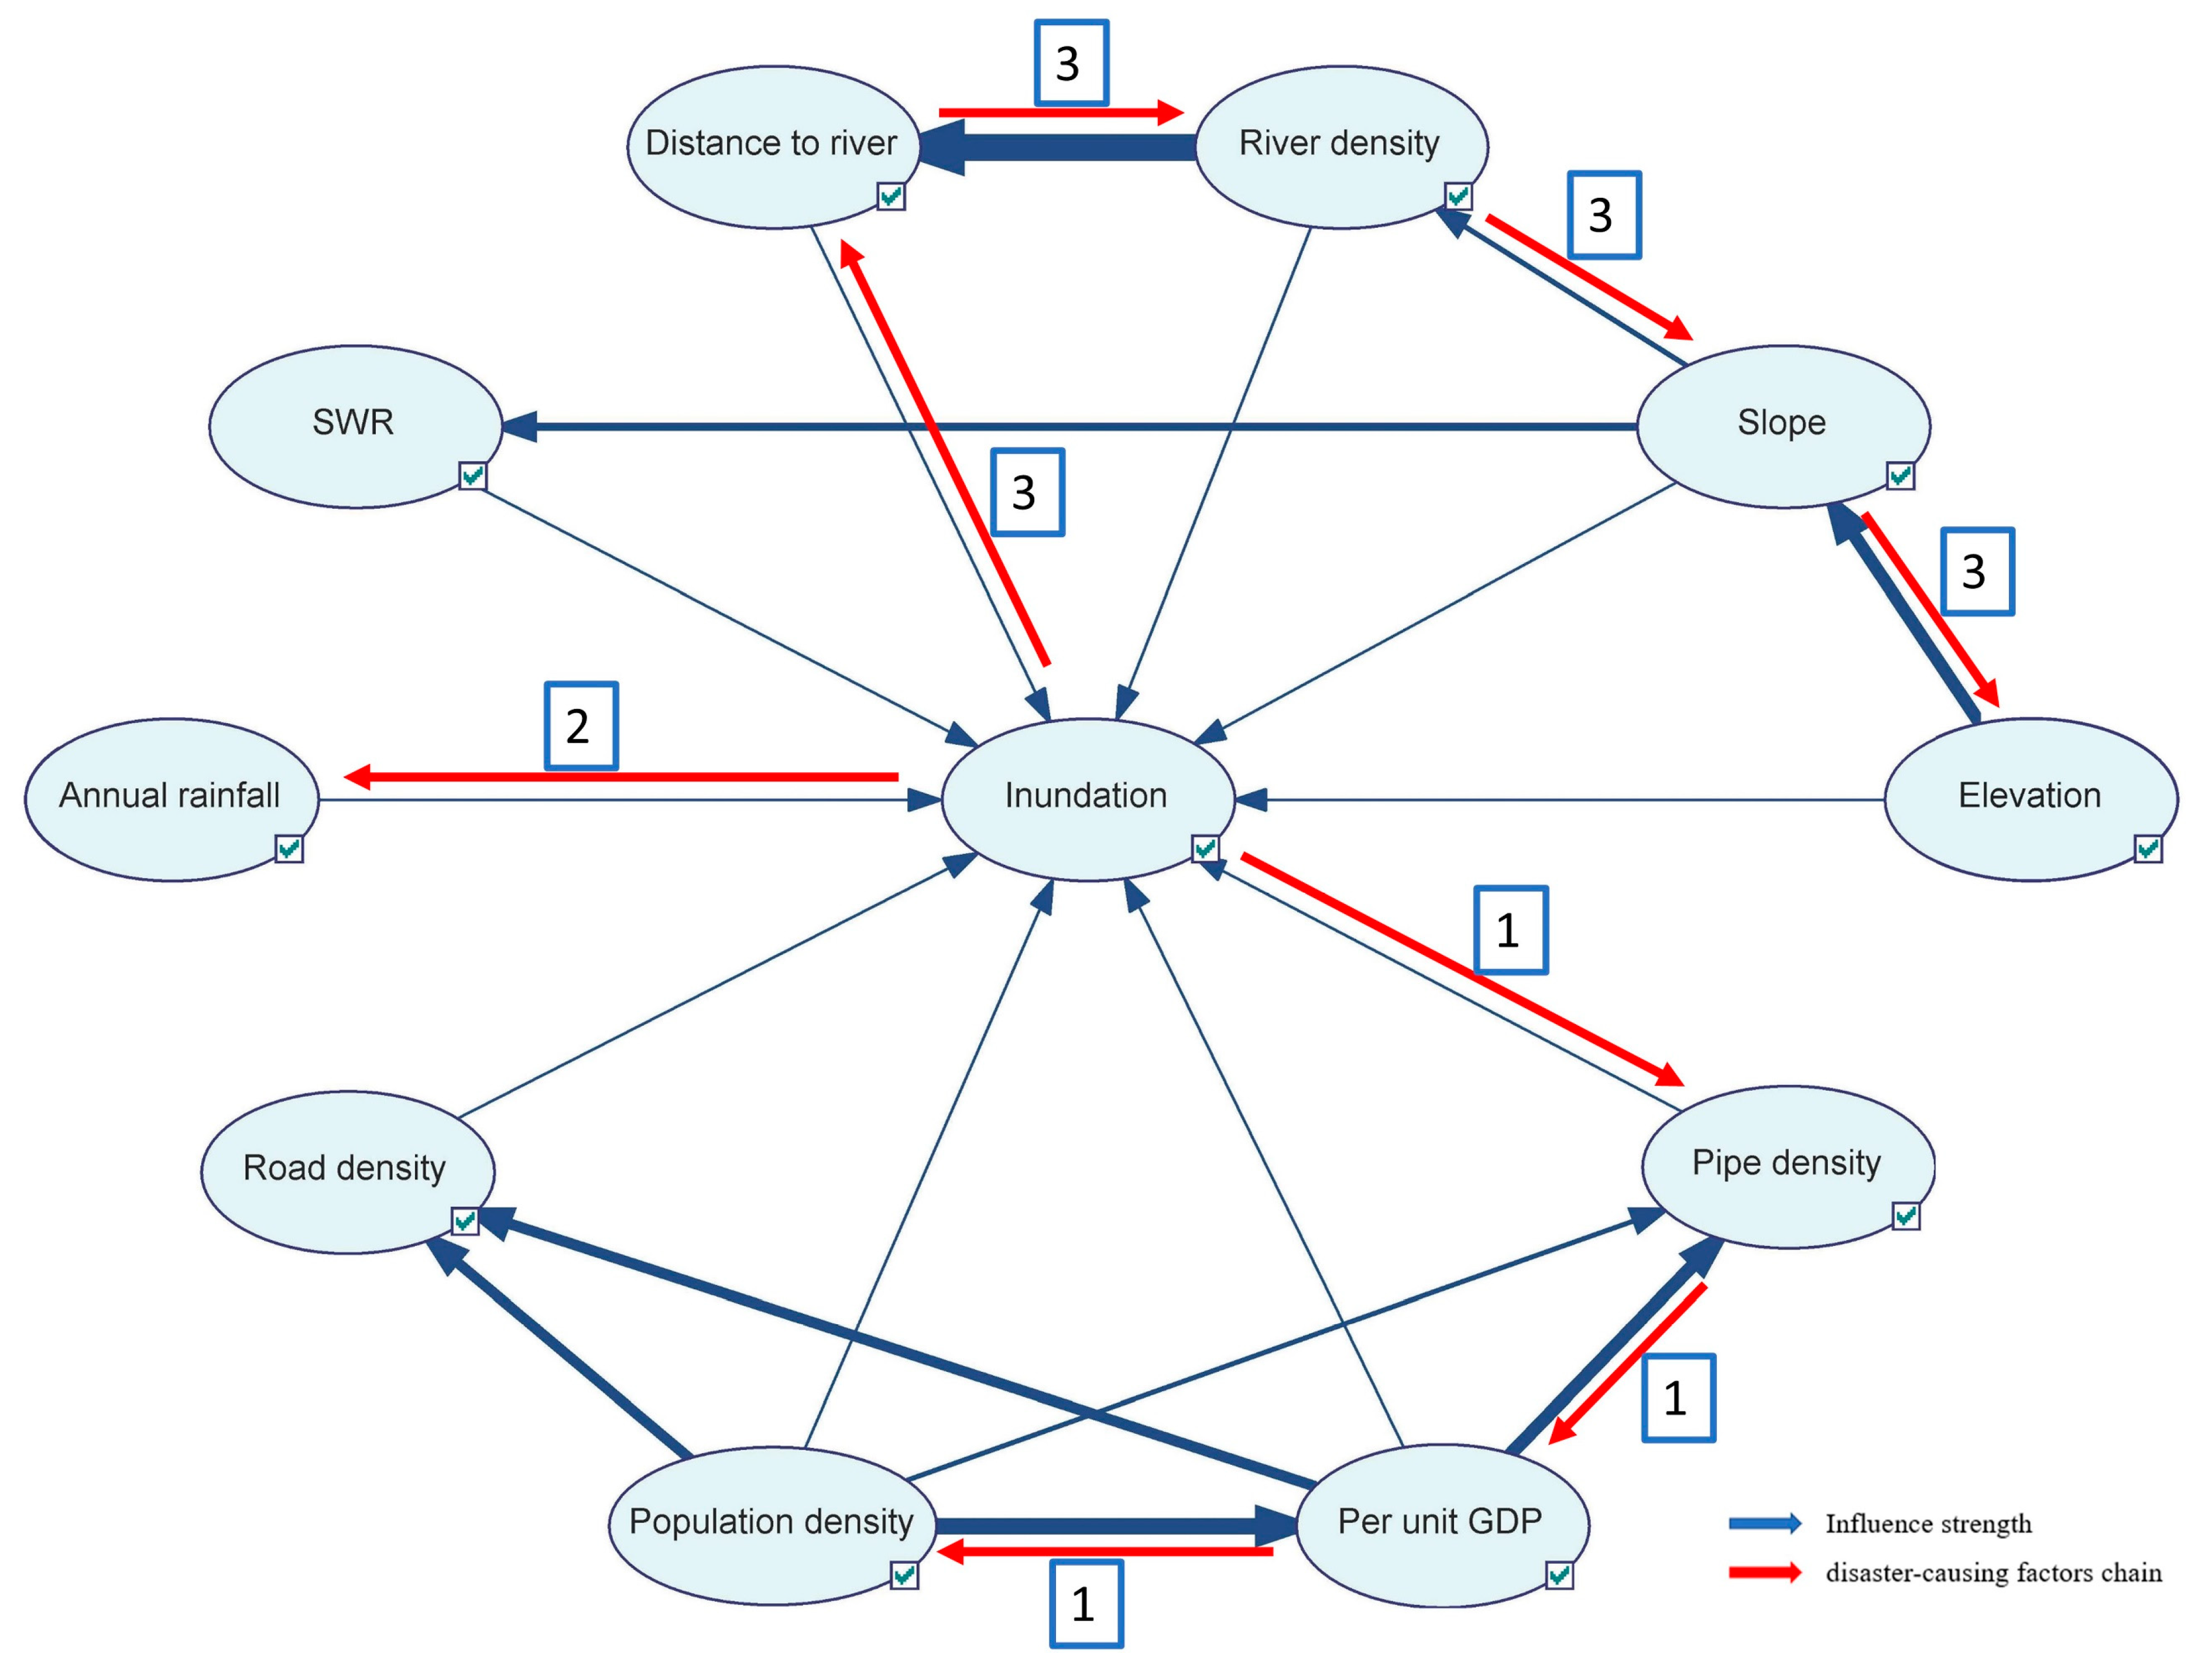
| Parent | Child | Influence Strength |
|---|---|---|
| River density | Distance to river | 0.657111 |
| Population density | Per unit GDP | 0.410361 |
| Elevation | Slope | 0.378111 |
| Per unit GDP | Pipe density | 0.366511 |
| Per unit GDP | Road density | 0.28702 |
| Population density | Road density | 0.27328 |
| Slope | SWR | 0.199311 |
| Population density | Pipe density | 0.190069 |
| Slope | River density | 0.171692 |
| Per unit GDP | Inundation | 0.00135476 |
| Annual rainfall | Inundation | 0.00134933 |
| Distance to river | Inundation | 0.00129787 |
| River density | Inundation | 0.00126138 |
| Pipe density | Inundation | 0.00125465 |
| Population density | Inundation | 0.00122743 |
| Elevation | Inundation | 0.00109918 |
| Road density | Inundation | 0.00109518 |
| Slope | Inundation | 0.000786543 |
| SWR | Inundation | 0.000772038 |
Publisher’s Note: MDPI stays neutral with regard to jurisdictional claims in published maps and institutional affiliations. |
© 2021 by the authors. Licensee MDPI, Basel, Switzerland. This article is an open access article distributed under the terms and conditions of the Creative Commons Attribution (CC BY) license (http://creativecommons.org/licenses/by/4.0/).
Share and Cite
Huang, S.; Wang, H.; Xu, Y.; She, J.; Huang, J. Key Disaster-Causing Factors Chains on Urban Flood Risk Based on Bayesian Network. Land 2021, 10, 210. https://doi.org/10.3390/land10020210
Huang S, Wang H, Xu Y, She J, Huang J. Key Disaster-Causing Factors Chains on Urban Flood Risk Based on Bayesian Network. Land. 2021; 10(2):210. https://doi.org/10.3390/land10020210
Chicago/Turabian StyleHuang, Shanqing, Huimin Wang, Yejun Xu, Jingwen She, and Jing Huang. 2021. "Key Disaster-Causing Factors Chains on Urban Flood Risk Based on Bayesian Network" Land 10, no. 2: 210. https://doi.org/10.3390/land10020210
APA StyleHuang, S., Wang, H., Xu, Y., She, J., & Huang, J. (2021). Key Disaster-Causing Factors Chains on Urban Flood Risk Based on Bayesian Network. Land, 10(2), 210. https://doi.org/10.3390/land10020210