1. Introduction
In Europe, COVID-19 infections rapidly increased in a short period of time [
1], thus presenting a concerning scenario for citizens who faced the impact of the virus. In order to maintain safety among citizens, various measures were proposed by the World Health Organization (WHO) [
2]. One of the most restrictive measures implemented with the emergence of COVID-19 was mobility restriction, which is directly linked to the individual’s activity as there was domiciliary confinement [
3], and this direct link provided a sharp reduction in daily-based traffic. Therefore, as a consequence of this act, the air quality improved gradually as the presence of air pollutants was reduced during the lockdown period [
4].
Regarding the values of PM
10 and NO
2, these two pollutants have some features in common, but the most important one is their toxicity as they present serious harm to health when inhaled [
5]. On the one hand, PM
10 refers to the physical or liquid particles of dust, ash, metallic materials, cement, etc. dispersed in the atmosphere and whose diameter is between 2.5 and 10 µm [
6]. Those can be really detrimental for most living beings, especially for people who live in large and polluted cities. The lower values of these pollutants in areas such as parks or green landscapes is remarkable, as the air quality remains with a lower pollution concentration in them. This characteristic is responsible for the citizens increasing the usage of green areas, which can easily be found in developed areas [
7] or public places designed by the public infrastructure system of some countries [
8]. Therefore, these places were used highly once the restrictions were being lifted during different stages [
9].
However, on the other hand, NO
2 refers to nitrogen dioxide, which is a composition that is formed during some combustion processes in motorized vehicles or industrial plants [
10]. This is also a very toxic component that can induce serious breathing diseases in long exposure times and high concentrations in the atmosphere [
5]. Due to the negative impact of these particles on health, some regulations were established in the different regions and countries around the world [
11].
Regarding the disease of COVID-19, Italy was the first European country with a high number of cases, which increased exponentially to a total amount of 314,861 cases (recorded on 1 October 2020) [
12]. In order to control the abnormalities, measures such as confinement and closure of nonessential activities were imposed by the Italian government [
13] where the main point was to decrease the mobility among citizens. These mobility restrictions are indirectly associated with air quality and pollution [
14]. Therefore, this article tackles the pollution in European cities such as: Madrid, Milan, London, Paris, and Prague. What can be clearly seen is the pre-COVID-19 situation regarding pollution and after public concern over this disease along with the mobility restrictions in different countries [
15].
The security measures regarding the health of citizens are linked in turn to the public awareness of SARS-CoV-2 (COVID-19). Italy was one of the first countries in Europe to declare a state of alarm, and this action was then followed by Spain on 14 March. In several countries, these actions took place in different periods of time; first, it was the region of Lombardy (Italy), then Spain followed its neighbor country by restraining nonessential mobility [
16]. During the state of alarm, international flights were canceled in several countries in order to reduce the spread of the virus [
17].
Most European countries faced the COVID-19 impact in early March, although some countries differed from each other, mainly due to the number of COVID-19 cases increasing in different periods of time. These periods of time are represented as different stages, in which each stage indicates an alteration of the measures applied in each country in order to control the spread of the infections. Depending on factors such as total population, number of cases, and specific measures, these stages have been prolonged or shortened. In
Table 1, the exact dates on which the state of alarm was declared in different cities can be observed.
Thus, this paper seeks to demonstrate the impact of pollution on citizens and political interests, intended to create awareness among citizens and authorities. The analyzed pollution is mainly due to road traffic in the cities. This source of pollution can be minimized by taking restrictive measures that can significantly reduce the pollutants present in the air. Through studied data, it can be pointed out that by implementing restrictions related to mobility, it can improve the air quality within cities, which consequently positively affect public awareness on how important the influence of pollution is on daily life, and measures to improve it are needed.
2. Materials and Methods
In this section, the different sources from which the data have been collected are summarized in order to understand and analyze the impact of the emergence of COVID-19 on the air quality and pollution levels over various cities.
In order to study and analyze the different air pollutants, special tools are used such as atmospheric pollutant measurement stations, which are located in various parts of different cities and areas. These stations measure the main pollutants present in urban environments such as sulfur (SO
2), nitrogen oxides (NO, NO
2, NO
x), carbon monoxide (CO), ozone (O
3), the suspended particles with fractions less than 10 microns (PM
10) and less than 2.5 microns (PM
2.5), and organic compounds (VOCs, benzene, toluene, xylene). Nitrogen oxides (NO
2) and PM
10 require special attention [
18]. In the case of this current study, the analysis of different air pollutants has been carried out through instruments such as GAIA air monitoring, which is described below and available online in data sources such as AQICN [
18] where the different pollutants such as NO
2 or PM
10 can be studied with data available regarding different years. Therefore, a comparison between 2020 and 2019 was done in this paper.
What is remarkable is the origin of gases such as NO, NO
2, NO
x, and PM
10 where the first gases originated by the combination of nitrogen and oxygen present in the air as a consequence of combustion processes, including road traffic [
10]. Meanwhile, the PM
10 has its origin in combustion processes but also has a natural origin due to the wind [
19].
In this paper, the European Space Agency, also known as ESA, and the NASA pollution monitoring satellites have also been used [
20,
21]. Through these tools, the side effect of the pandemic and its effect on air pollution in different regions can be clearly seen. In this case, information about atmospheric quality is provided by images taken from satellites where, along with atmospheric quality, solar radiation and stratospheric ozone are also studied. The satellite to collect data is Sentinel-5P, being the first Copernicus mission satellite for studying the atmosphere. These satellites are specialized in collecting data about various particle matters and trace gases such as nitrogen dioxide, ozone, formaldehyde, sulfur dioxide, methane, carbon monoxide, and aerosols, all harmful to humans and planetary health if they are presented in high values.
The GAIA A13 tool has also been used, in order to detect PM values. This tool is equipped with three sensors. Through these sensors, the particle matter (PM) is studied in order to have official AQI (Air quality historical data platform) readings and data for further studies. Apart from particle matter, the sensors also study elements such as temperature, pressure sensing, and relative humidity. Therefore, Gaia A13 is equipped with three PM sensors, a meteorological sensor, and has dimensions of 130 × 80 × 70 mm with a weight of 380 g.
Another tool used in this paper has been Apple’s mobility trend, which is a dataset containing COVID‑19 mobility trends in countries/regions and cities worldwide. The aim of this data collection is especially to provide insights into health authorities looking for ways to slow the spread of COVID-19. With data collected from this tool, the up and down in mobility of both vehicles and humans is clear.
With the different tools described, the study has been conducted in different regions in order to better understand the trend of studied elements before and after the lockdown was declared due to the pandemic.
3. Study Area
Different cities were studied in order to collect data for a better understanding of the impact of COVID-19 on pollution. The effect of pollution on human health, as well as on planetary health, is well known. In this paper, the mobility trend is studied in order to understand the alteration in pollution levels; therefore, different cities have been analyzed such as Milan, Prague, Madrid, Paris, and London. These cities have been chosen due to their large number of road traffic on a daily basis, which indirectly affect the air quality over these cities.
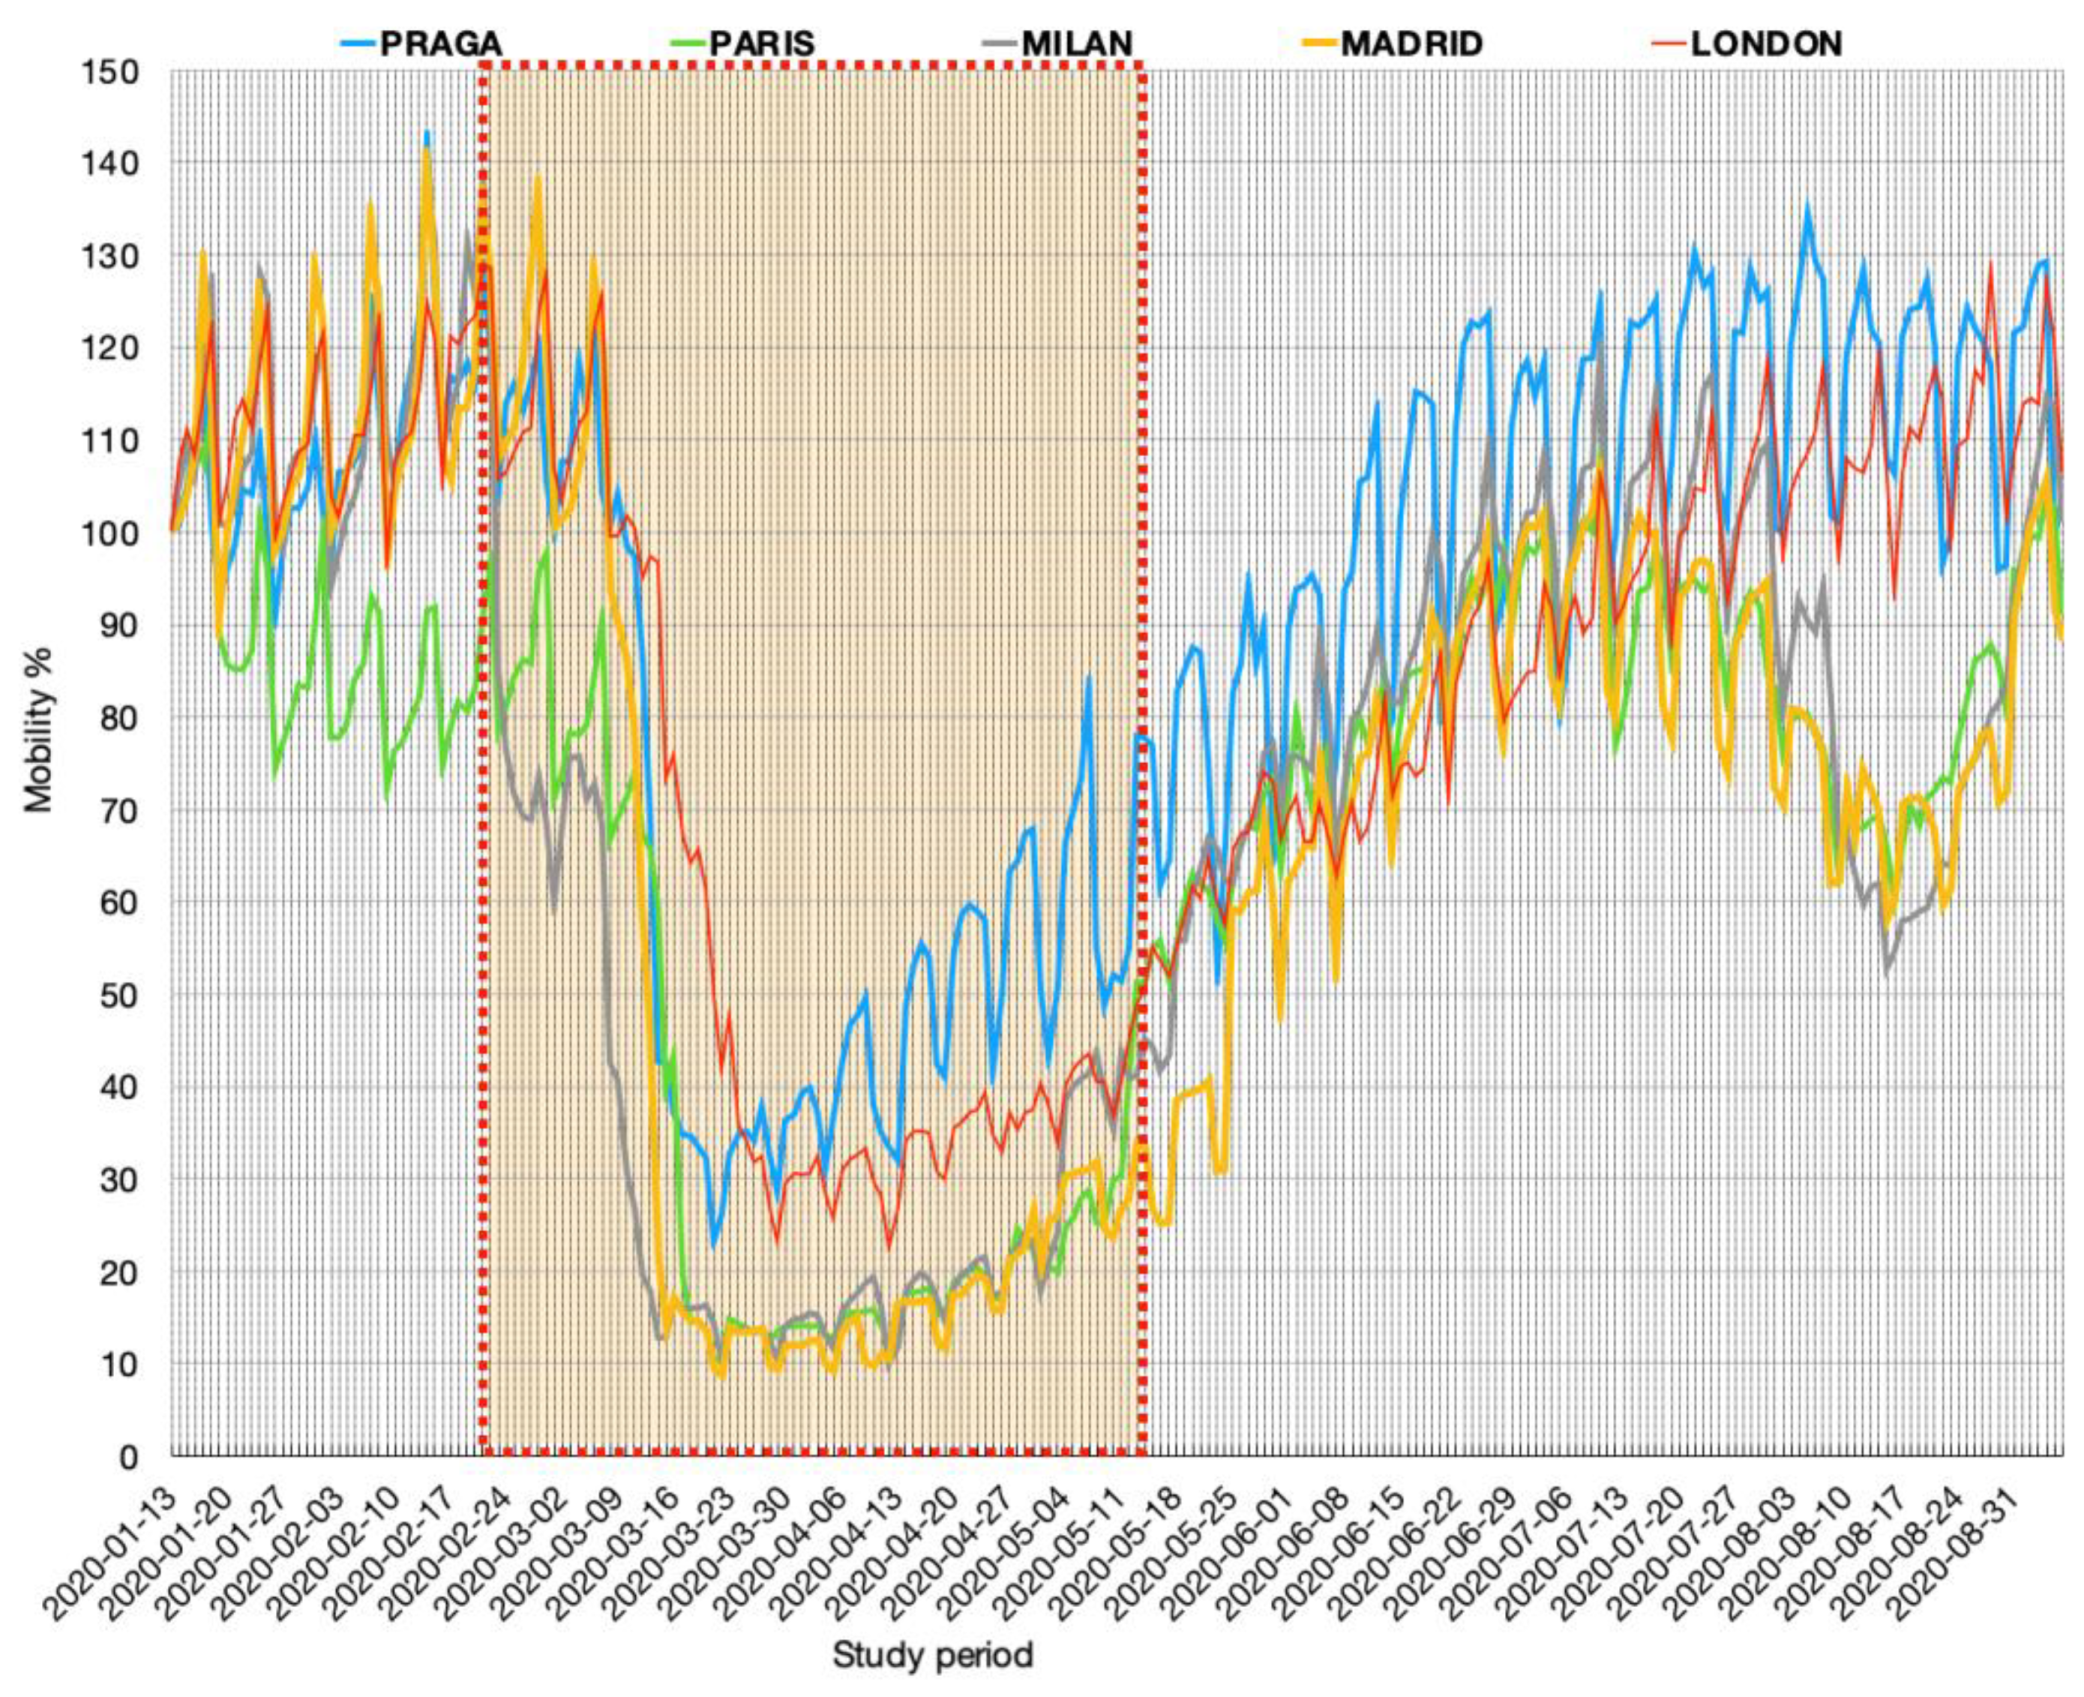
Through studied data,
Figure 1 has been prepared with mobility data from each city. The study period of this data is from January until late August of 2020, and its comparison with 2019. The period in which the reduction in transit remained at lower values is also emphasized, as can be seen in
Figure 1, elaborated with Apple’s mobility trend [
22].
In
Figure 1, a significant reduction in mobility over five analyzed cities can be observed. The reduction starts around the period where strict measures were implemented by the authorities and the health organizations. The duration of lockdown in each city is also noticeable as it depends on the COVID-19 cases, the infections, and the deceases. By observing
Figure 1, the repetition of the pattern can be deduced, as cities started to ease lockdown measures after two months in which the mobility was reduced to its minimum values.
4. Results
The study topic of this paper has been focused on active factors such as the mobility trends in European cities and the evolution of airborne pollutants such as PM
10 and NO
2. Therefore, the results from the mobility evolution before, during, and after lockdown is shown in the following sections; after that, the results from the pollution study is shown in
Section 4.1,
Section 4.2,
Section 4.3,
Section 4.4 and
Section 4.5 4.1. Analysis of Air Quality and Pollution Trends in Milan
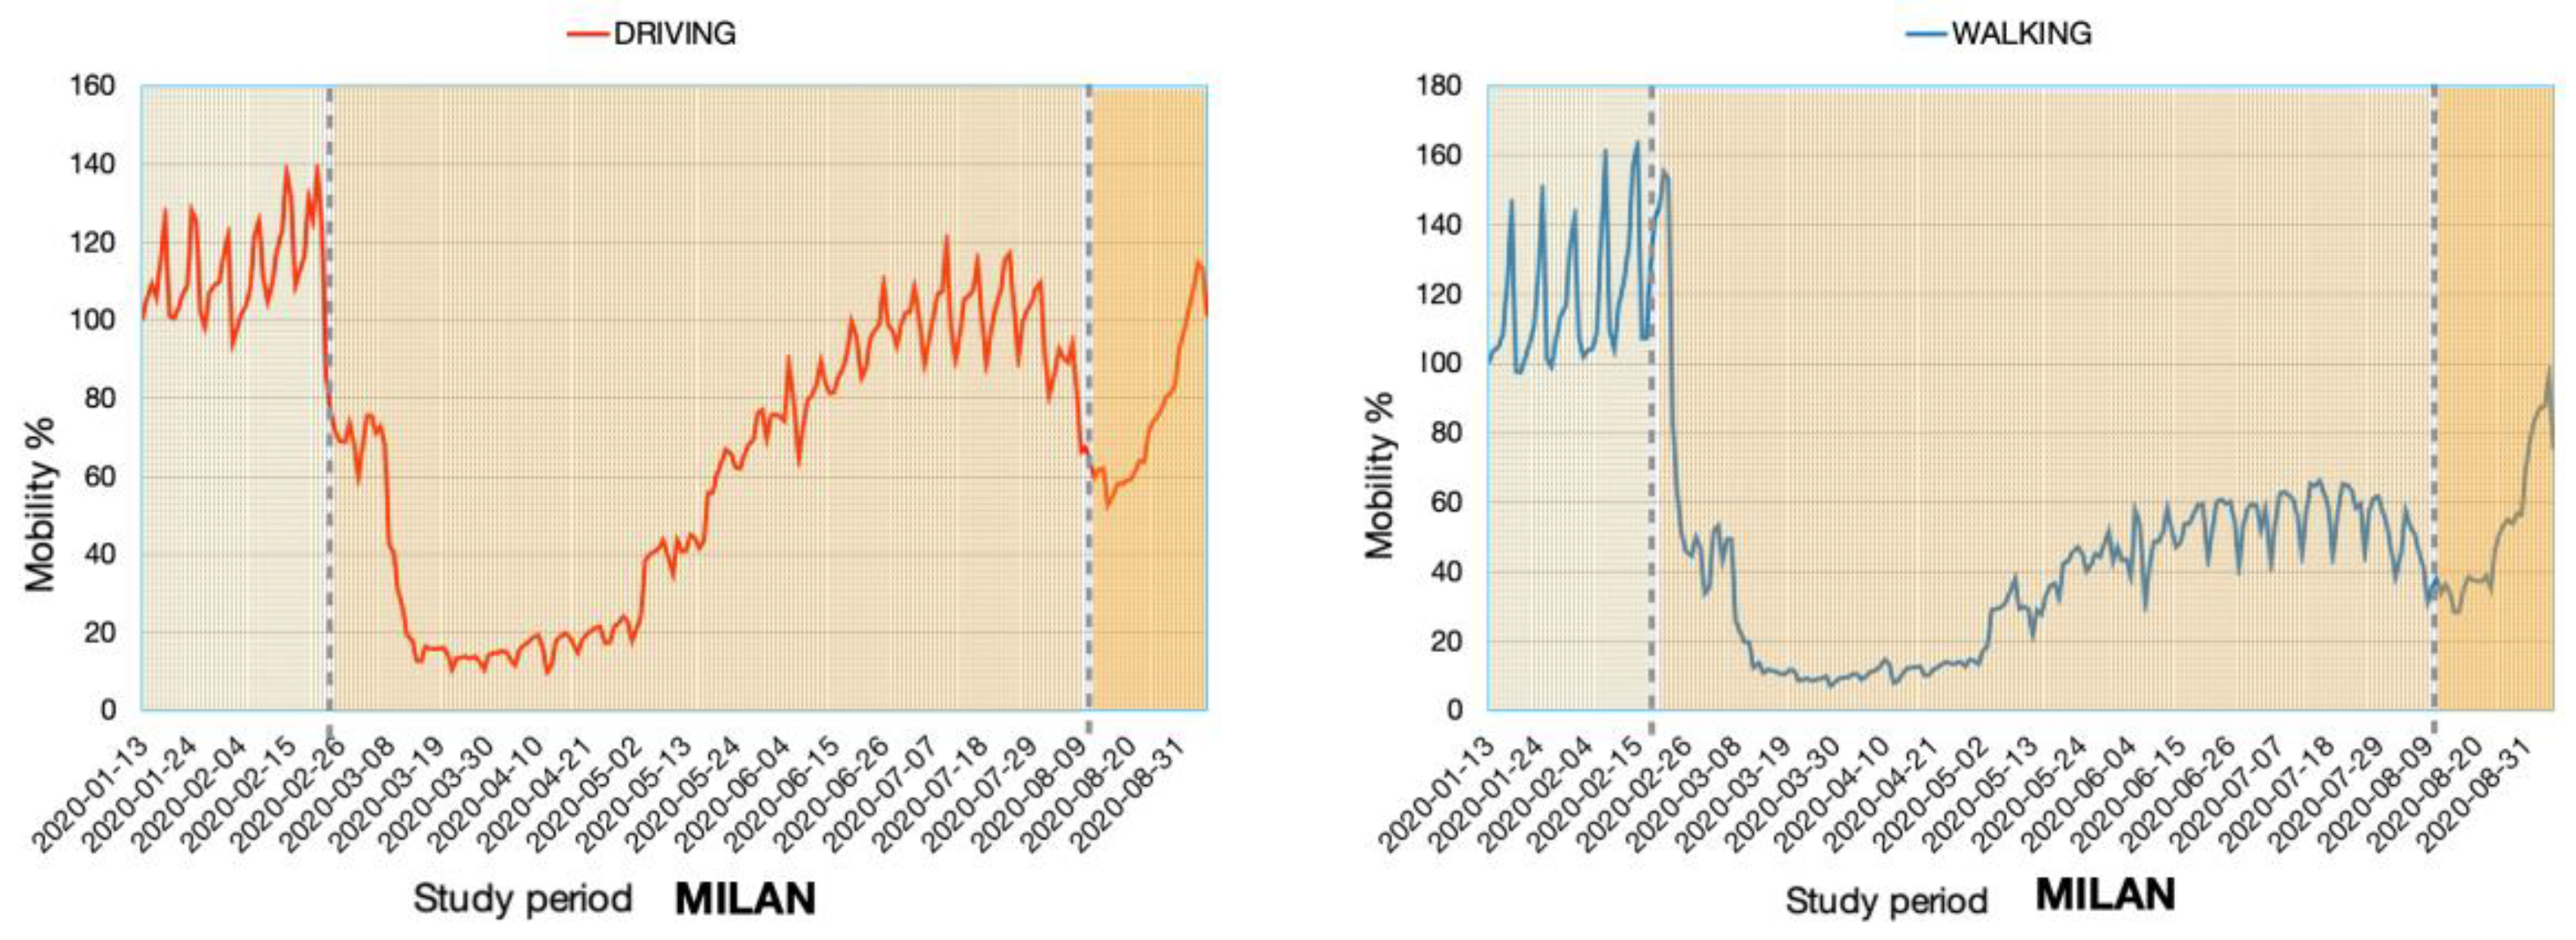
Italy was one of the first European countries hard-hit by the SARS-CoV-2 (COVID-19). The northern area of Italy was the most affected zone of the country, especially the region of Lombardy with a large city such as Milan, where the virus spread at high speed due to the unforeseen situation that the Italian government and health care system faced in a short period. This led to a rapid increase in COVID-19 cases and deaths, reaching up to 26,407 infected cases by the 1 of September 2020 in the region of Lombardy. Due to the large numbers of infected citizens, the country took action on 8 of March by implementing measures such as confinement and limited capacity in various places such as supermarkets and pharmacies. The public transportation service was largely reduced in order to control the movements along with the pandemic. The transit on Italian roads was drastically reduced, as shown in
Figure 2, elaborated with data collected from the Apple mobility trend website [
22], where the fall in vehicle use can be seen, especially in March when the state of alarm was declared in most of the European cities.
This tendency also indicates a downturn in PM
10 and NO
2 emissions. These particles are highly located in areas where a large number of motor vehicles are functioning.
Figure 2 indicates the rapid transformation of the air quality around the lockdown date and its comparison with the previous year. In
Figure 3, the reduction of 45% from the baseline from the year 2015 to 2019 can also be seen.
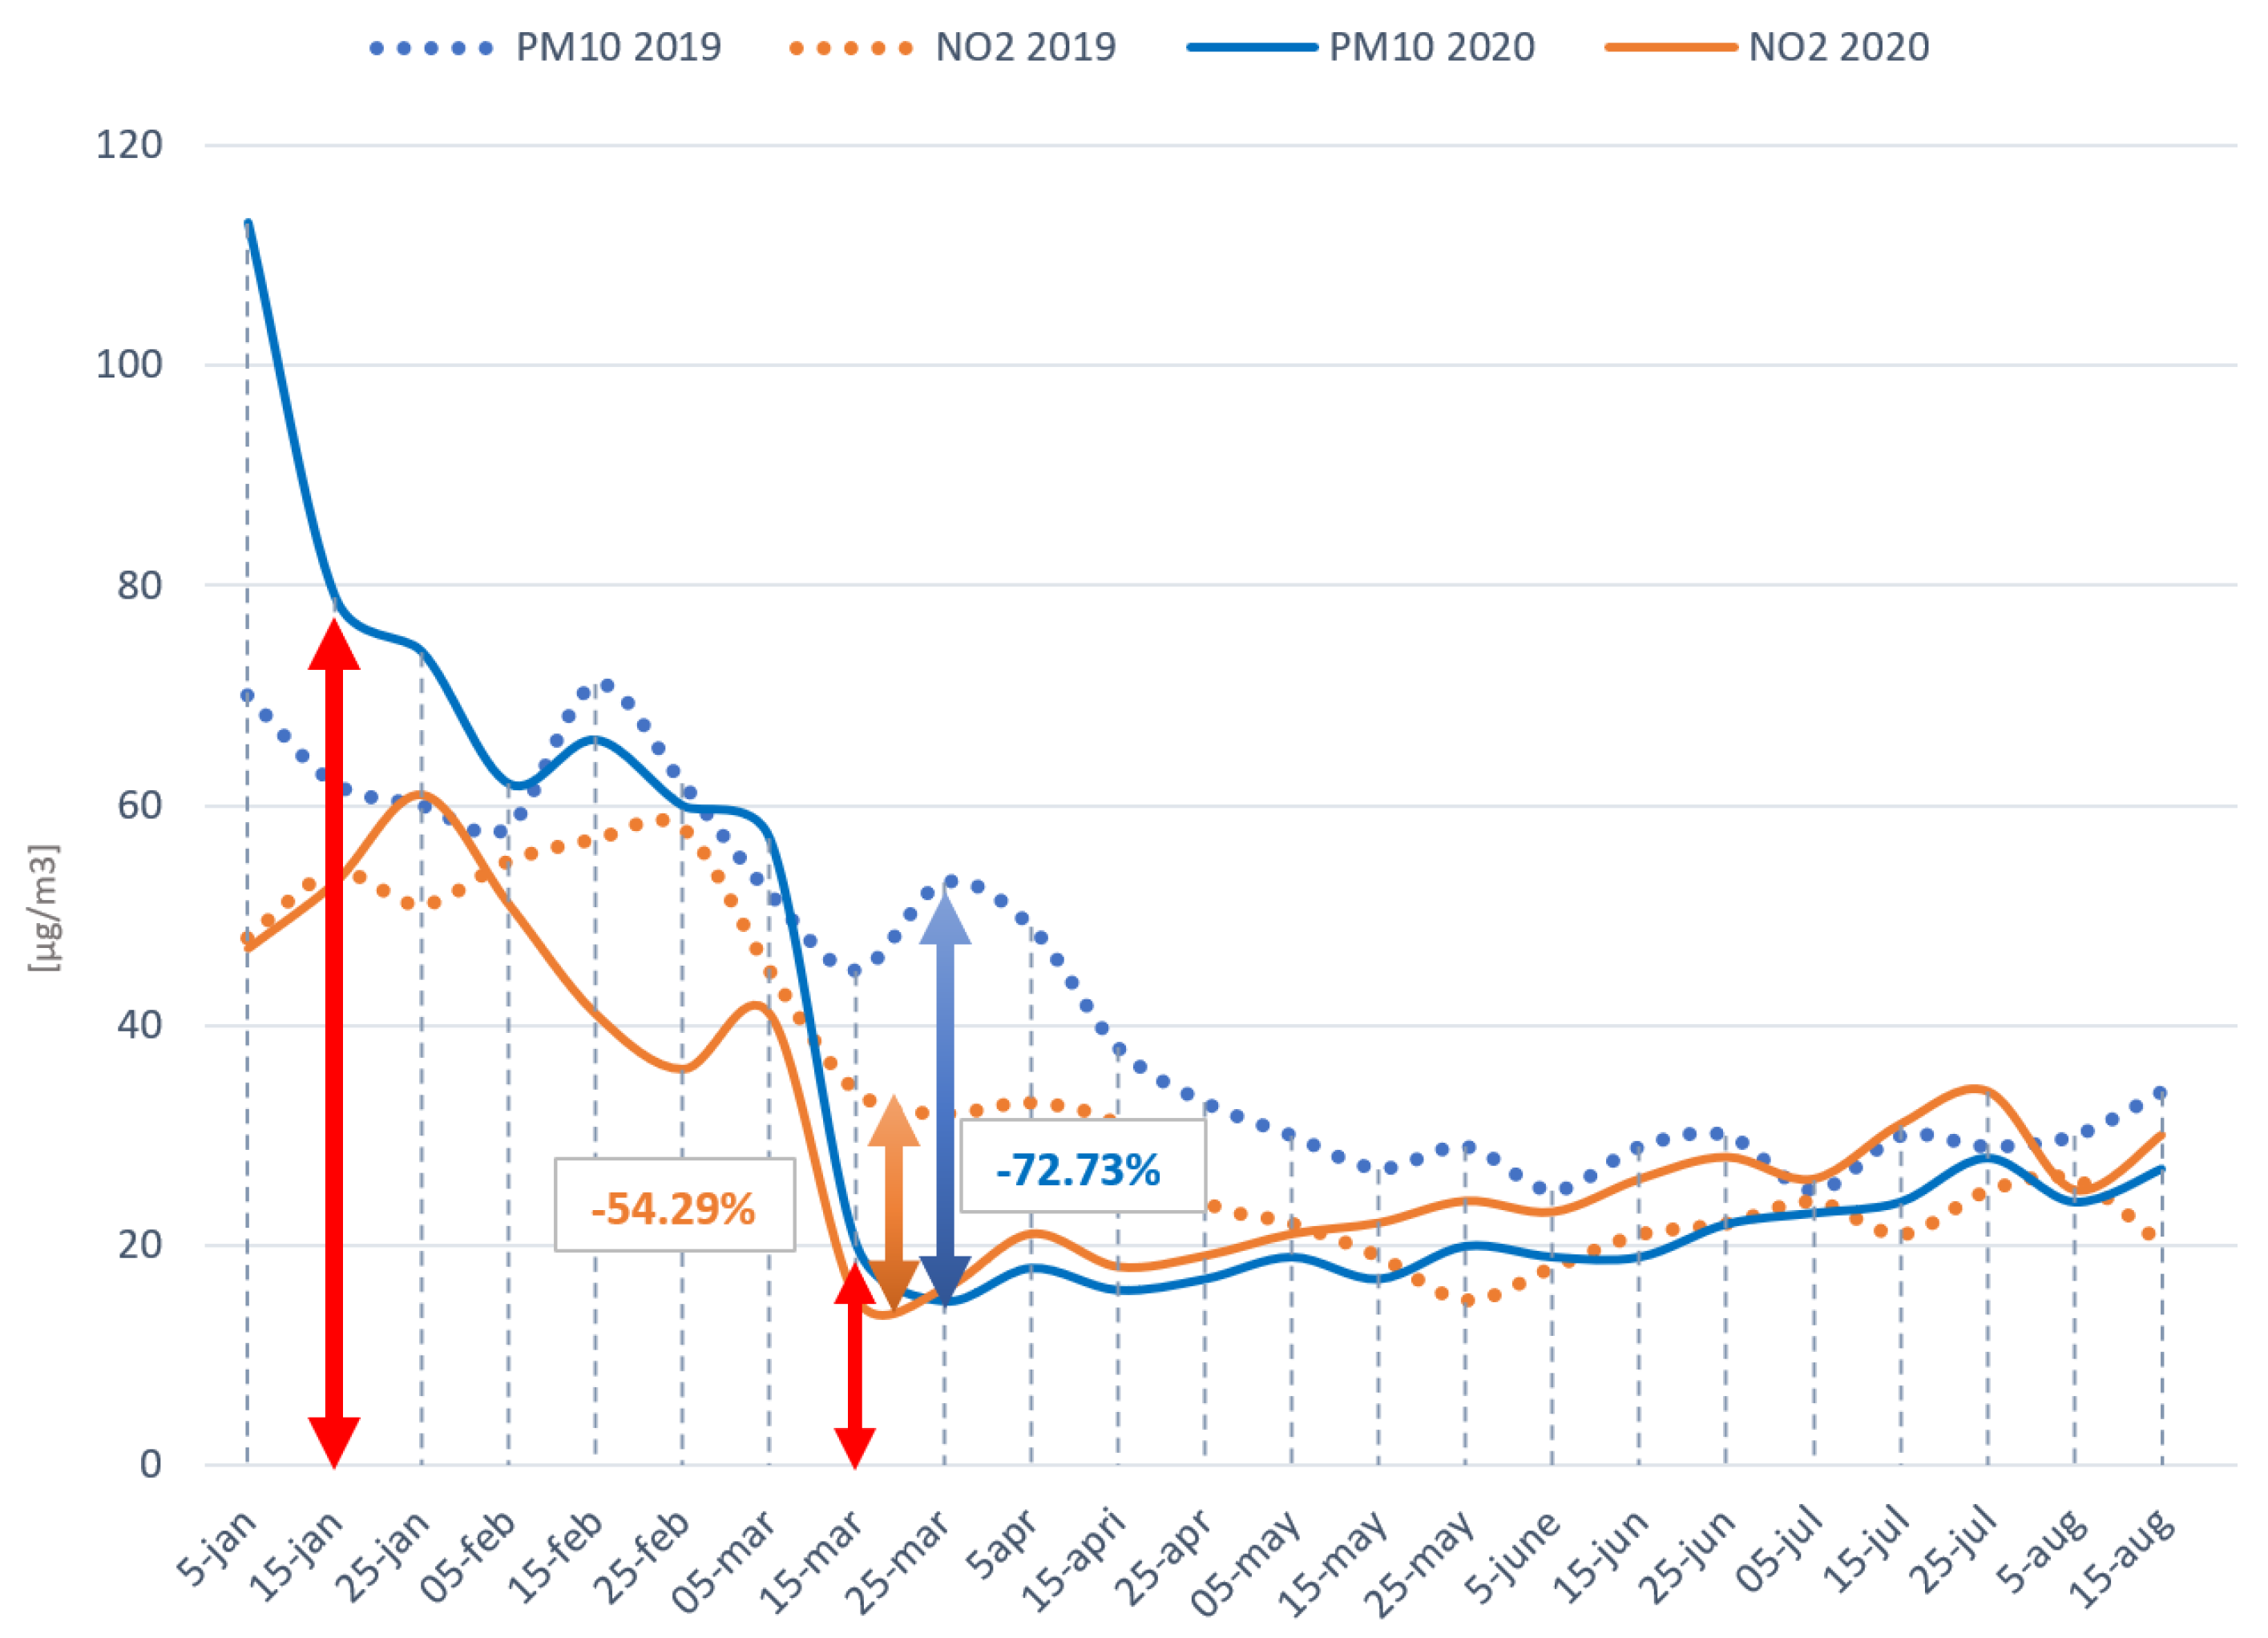
Regarding the pollution levels,
Figure 4 shows how PM
10 and NO
2 particles were recorded from the beginning of the year until the late summer in the city of Milan. The figure has been elaborated with the air quality historical data collected from the website of AQICN [
18].
As can be seen in
Figure 4, levels of PM
10 and NO
2 were very unstable during the beginning of the year, especially in the case of PM
10 levels, which were above 100 µg/m
3 However, when the month of March started, levels both of NO
2 and PM
10 decreased uniformly to levels lower than 20 µg/m
3. It is relevant to keep in mind that even if the values during the beginning of March were lower in 2020 than in 2019, during the following months, even with those low amounts, the levels of PM
10 and NO
2 were comparable to those during the same period during the previous year, probably due to a reduction in emissions during the summer season. This is probably caused because of a decrease in mobility in that area during holidays that took place in summer. Therefore, a reduction in these pollutants was recorded in more than 50% in each case compared to the previous year.
4.2. Analysis of Air Quality and Pollution Trends in Prague
Prague was one of the first European countries along with Italy to declare a state of alarm on the 11 of March; however, the first cases of COVID-19 were confirmed on 1 of March. The total population of Prague is 1,305,737 (2020). After the first cases were confirmed, the country took several procedures in order to control the spread of COVID-19 between citizens. The measures taken by the Czech Republic differed from the rest of the countries that faced the same problem. Restrictions and capacity limitations took place; however, these restrictions were never ruled by strict restrictions by the authorities. Despite the different measures, Prague successfully decreased the Covid-19 cases drastically by the end of August 2020.
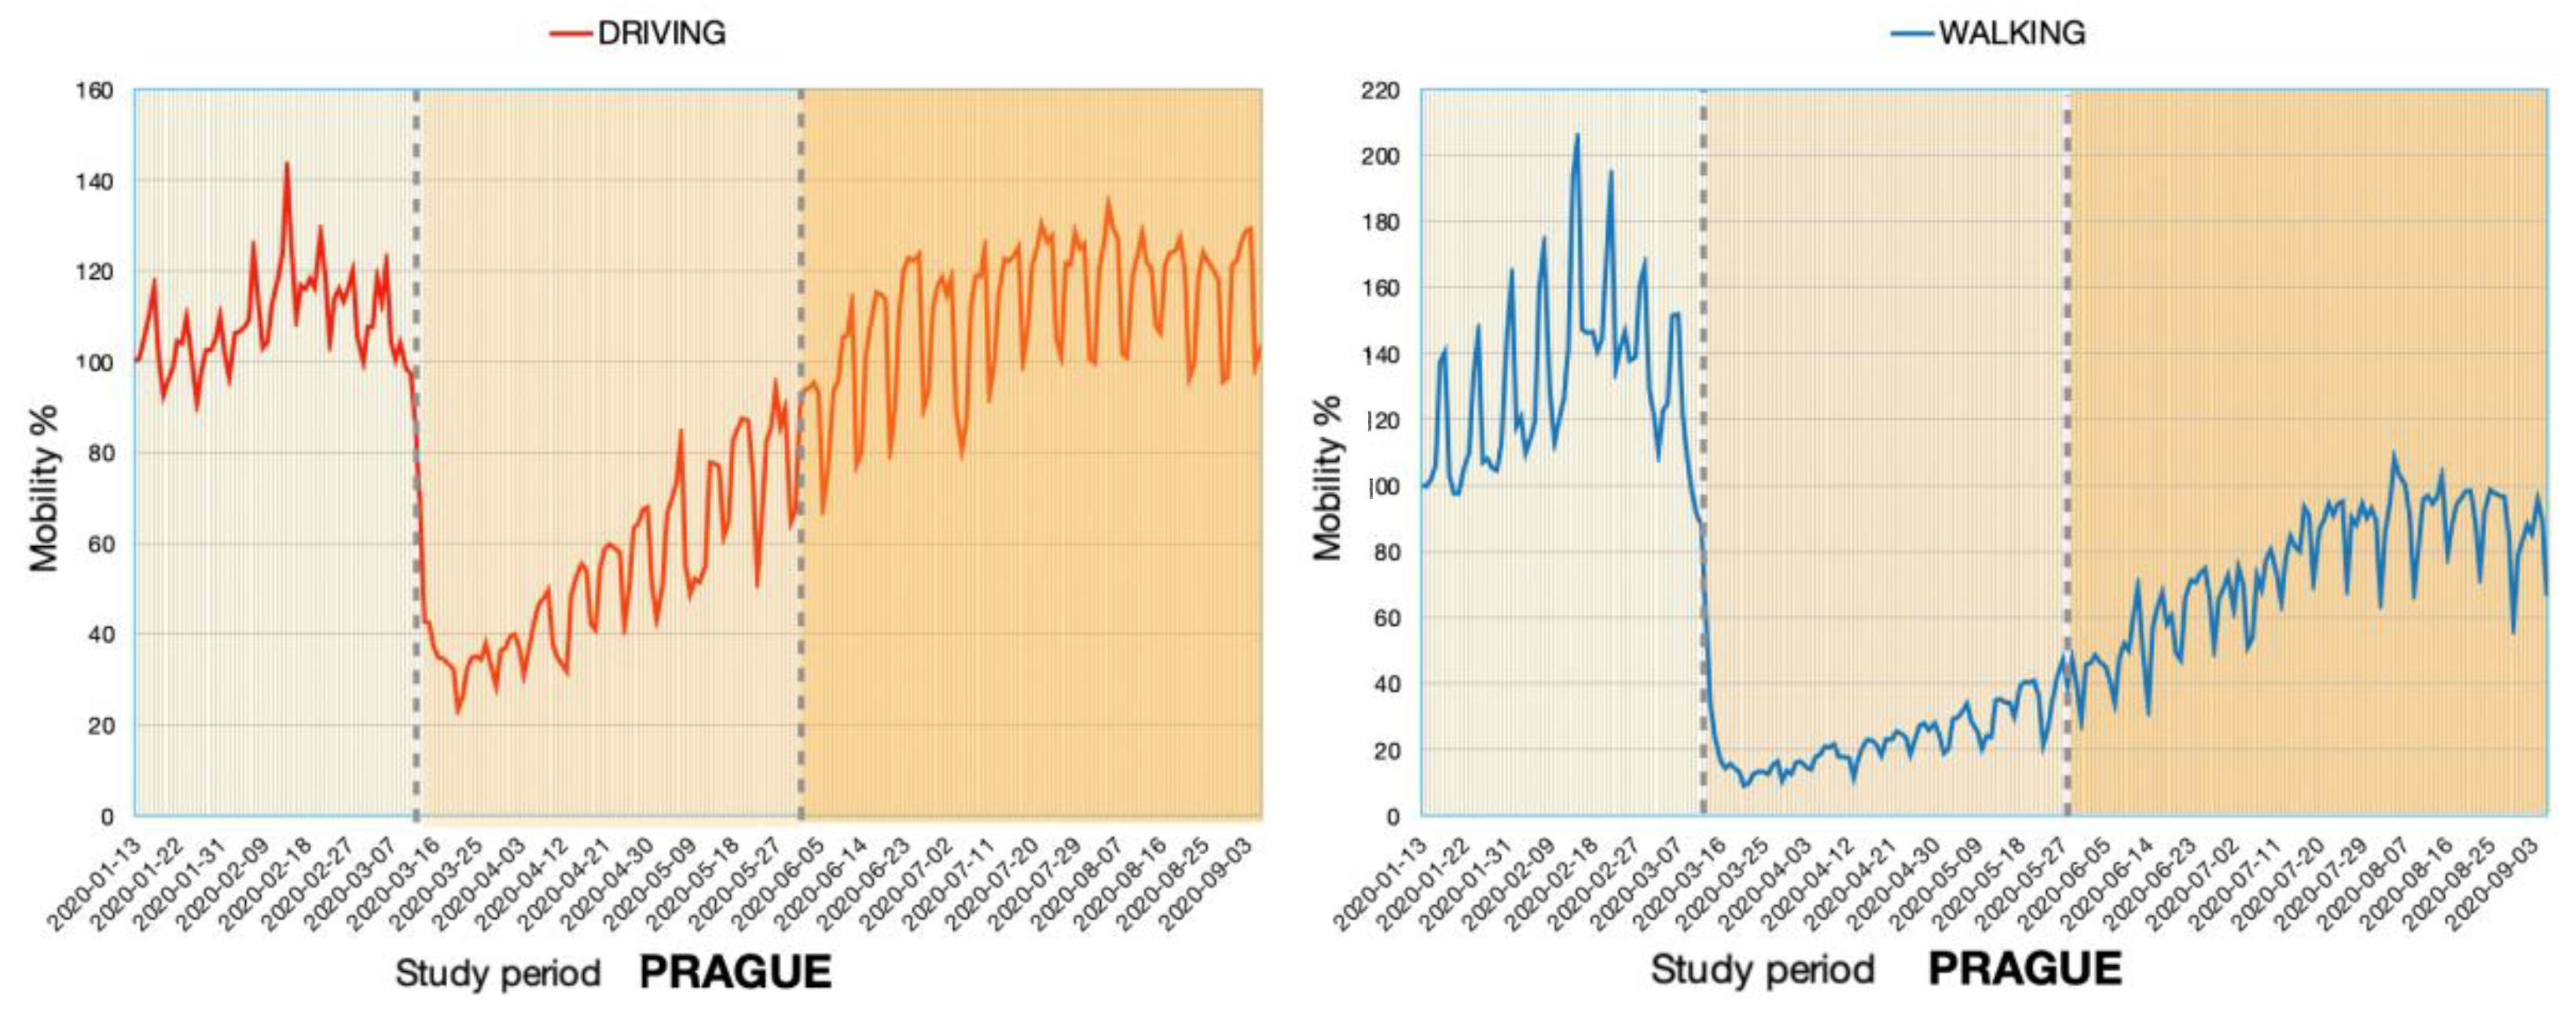
In the case of transport, Prague faced a lowering in public and private transport as the citizens were informed of mobility restrictions in order to avoid major infection of SARS-CoV-2 (COVID-19). This reduction can be observed in
Figure 5, which shows the evolution of transport in the country. The driving and walking trend along with the pre-lockdown, during the lockdown, and after a lockdown period is detailed and marked in different tones of orange.
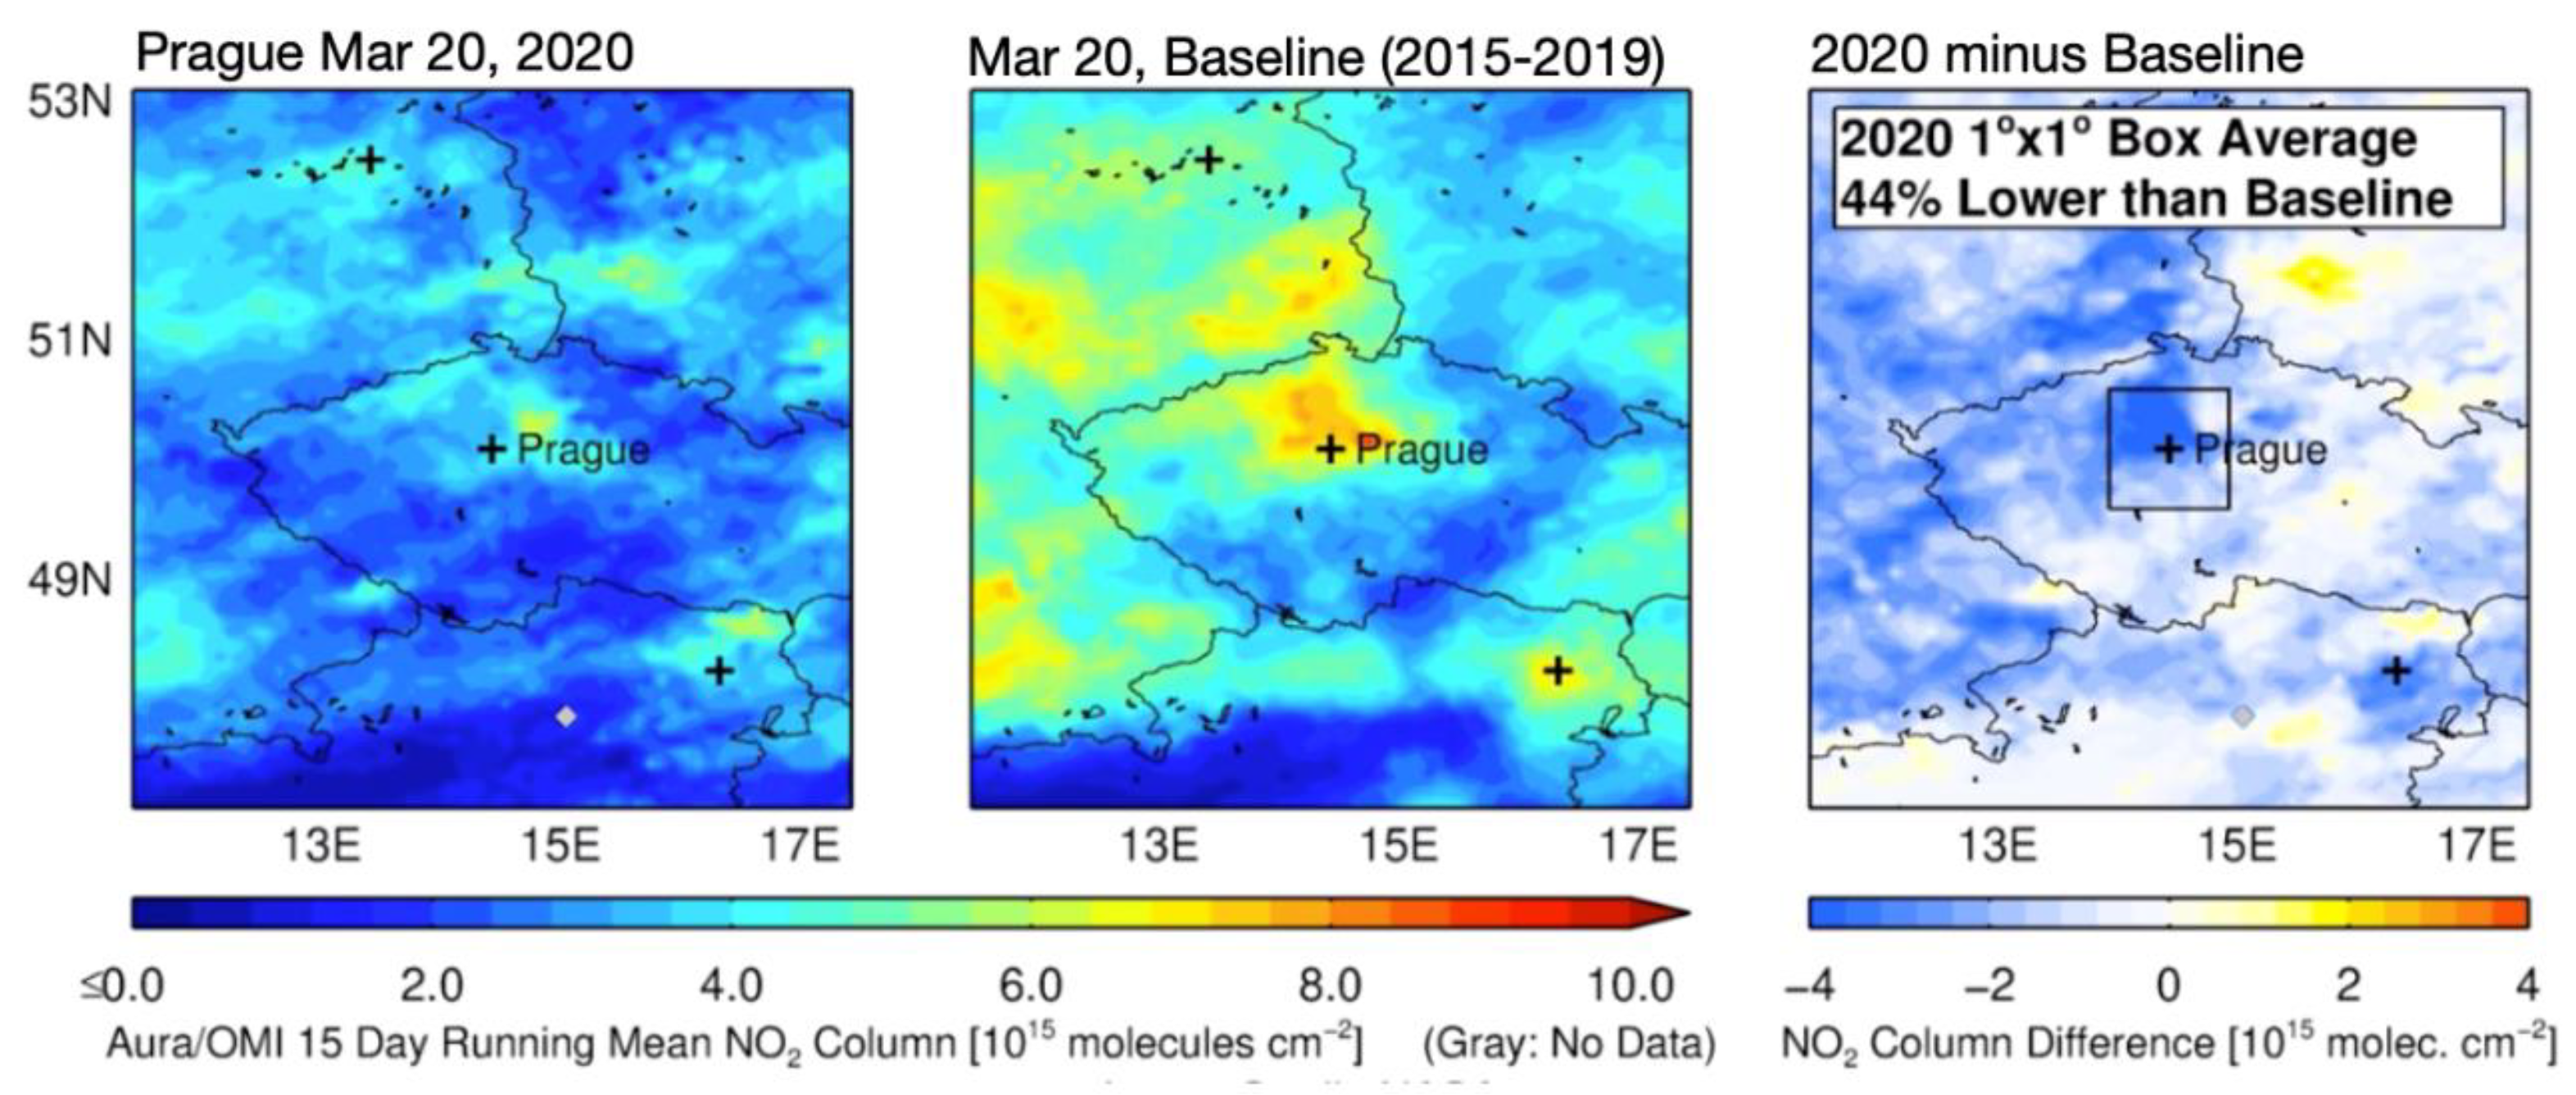
The period between late February and March is remarkable as, in this period, the official rules were implemented by the Czech government. As a consequence of this, an improvement in air quality occurred as the pollutants were found in lower quantities.Besides, as can be seen in
Figure 6, the levels of nitrogen dioxide over Prague were way higher in March of 2019 compared to the same month the following year (2020). This indicates a downturn of 44% from the baseline.
In reference to the pollution analysis,
Figure 7 shows the evolution of the values of PM
10 and NO
2 during the first eight months of 2020.
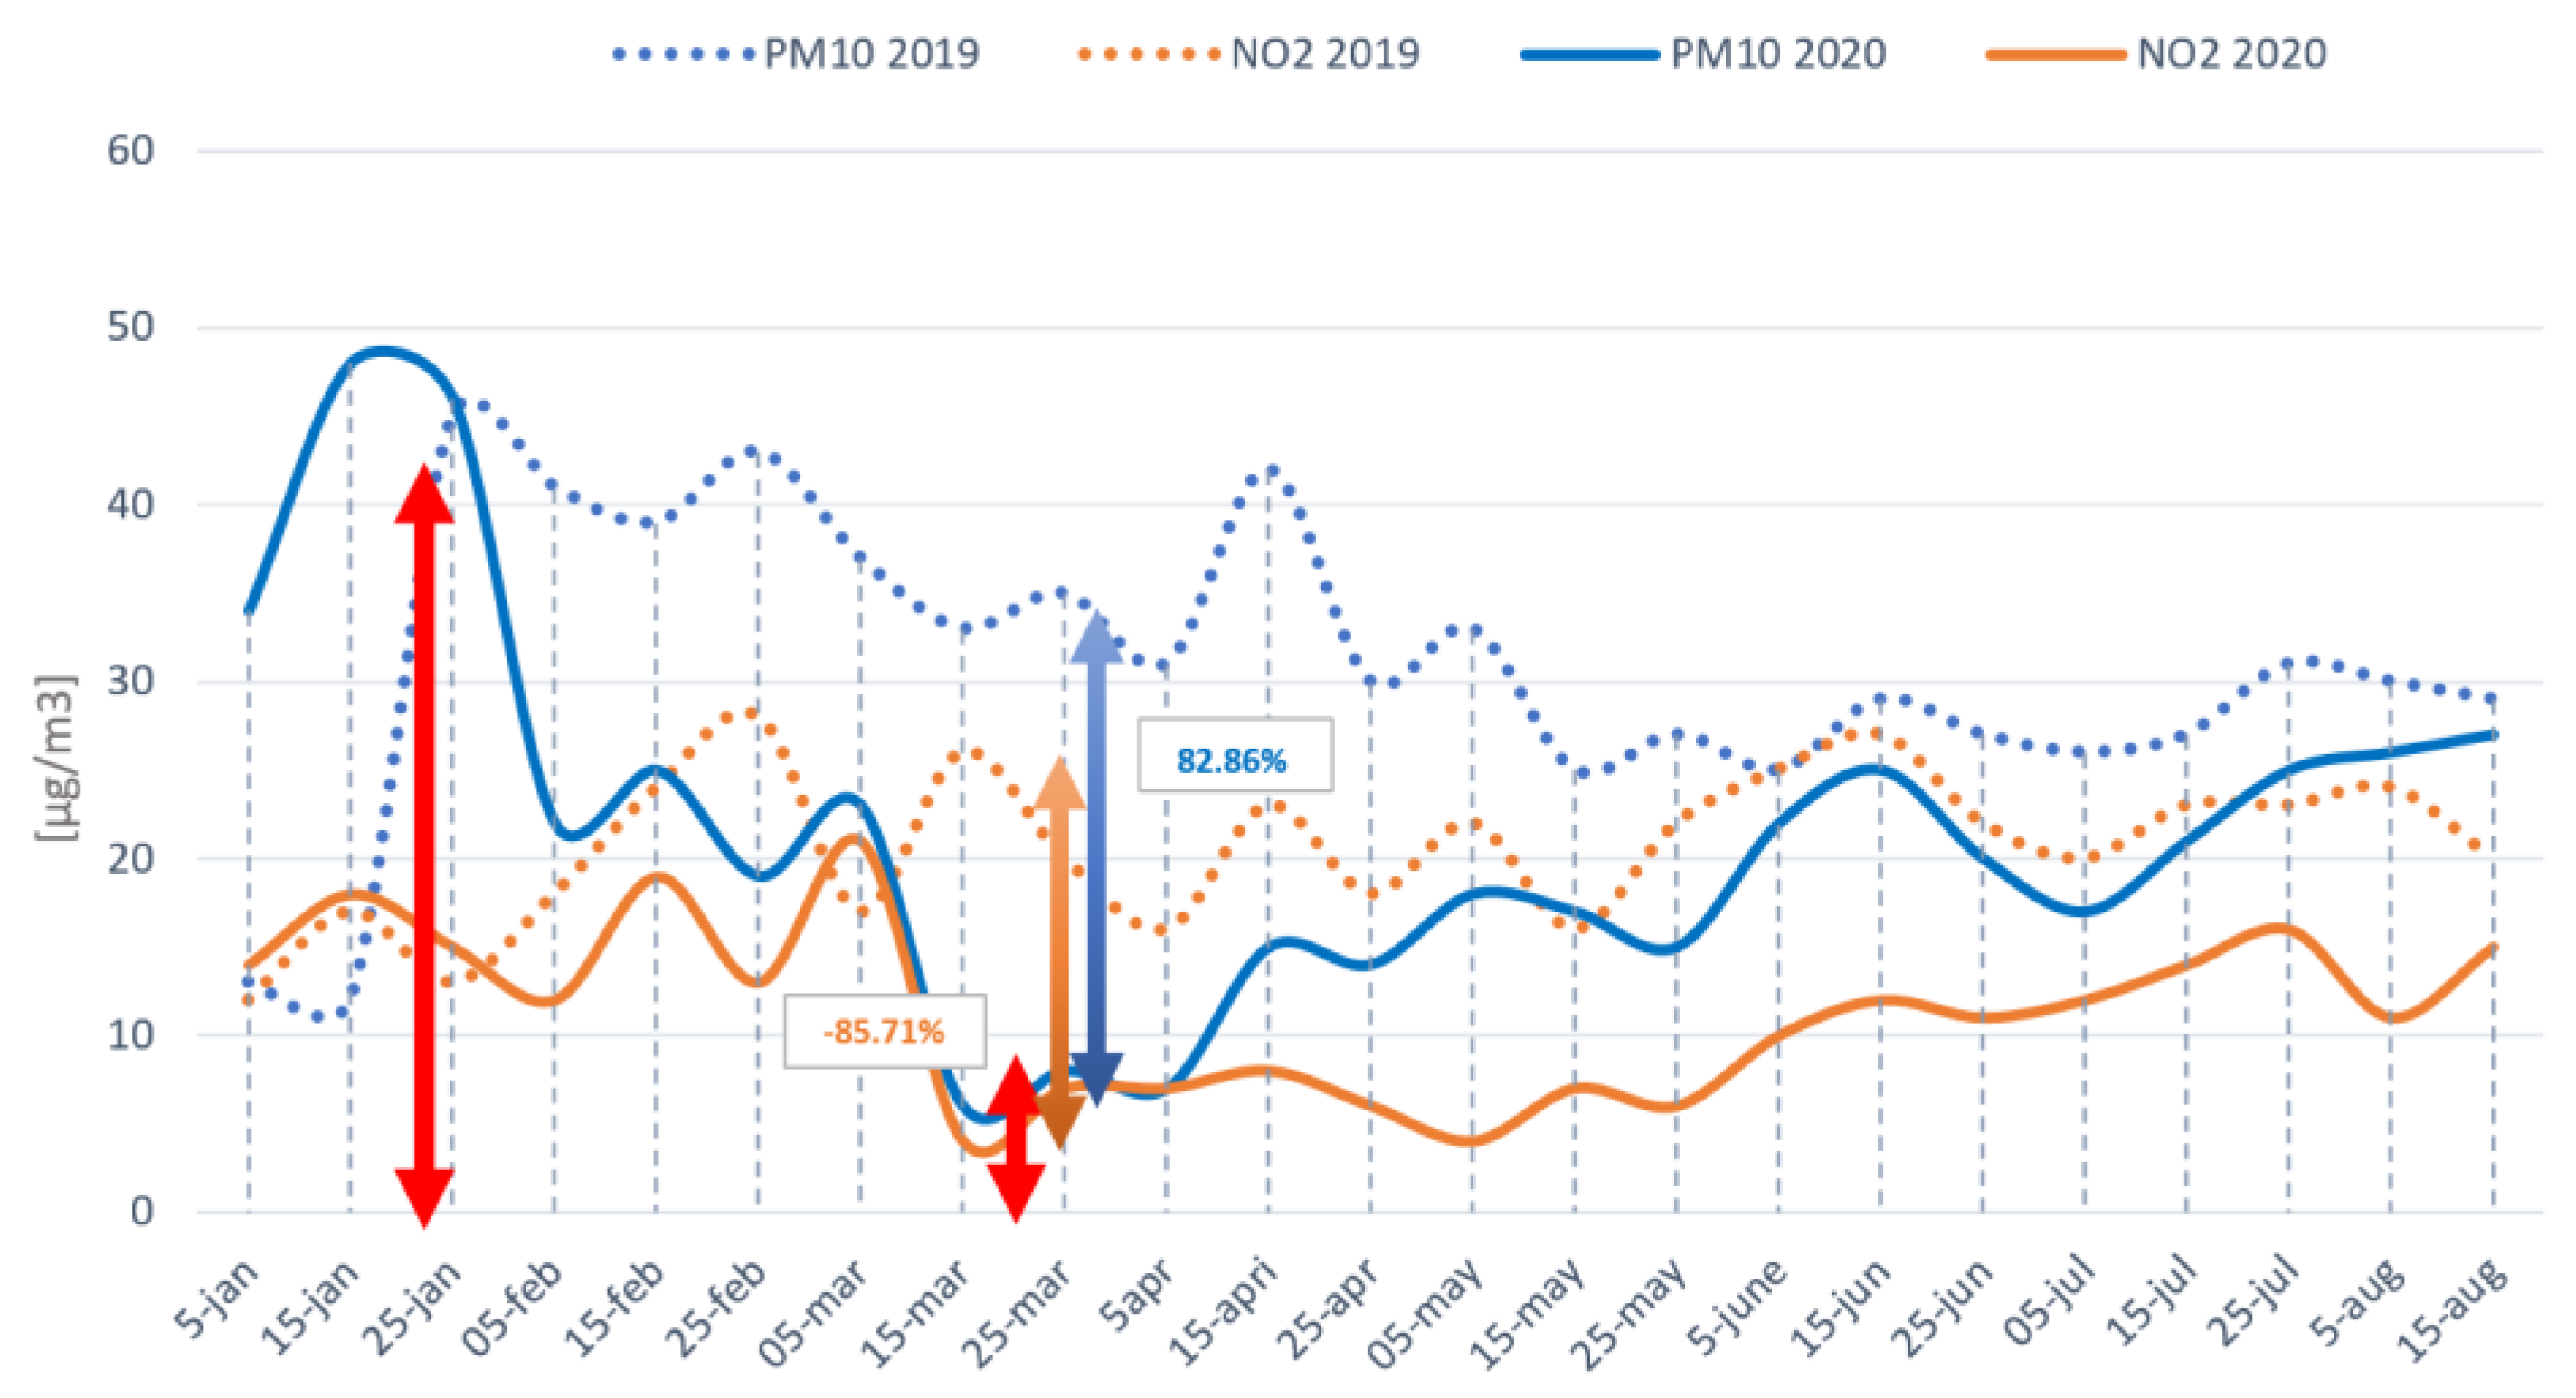
In
Figure 7, which has been elaborated with data from the air quality data platform, also named AQICN [
15], as a trend in the main cities of Europe, a significant decrease in PM
10 and NO
2 levels during March can be seen. Unlike other cities studied in this research, exclusively values of PM
10 rapidly returned to normal, rising from below 5 to above 15 µg/m
3 in less than a month. On the other hand, levels of NO
2 remained low (around 5 µg/m
3) three months after the lockdown. Comparing these pollutants to the previous year, a reduction of 82.86% of PM
10 and 85.86% in the case of NO
2 can be seen.
4.3. Analysis of Air Quality and Pollution Trends in Madrid
Madrid is, among others, the Spanish city with higher levels of pollution, due to a large number of traffic movements every day. This makes the contrast of mobility values that can be seen very noticeable from the period previous to the lockdown to the moment when the state of alarm was declared. In Spain, the number of active cases started rising from hundreds to thousands in the first two weeks of March [
24], which induced the Government to declare the State of Alarm on 14 March.
After two months of mandatory lockdown, the State established a system to revert the social situation to normal, organizing a de-escalation through different steps, which would be supervised by each region of Spain to decide when the region accomplishes the requirements to advance a step in the transition. In Madrid, on the 11 of May, the City entered “Phase 0,” which remained for two weeks, allowing few outdoor activities like sport or walk, until the 25 of May, always done individually, when the city moved to “Phase 1,” removing some limitations and restrictions in the outdoor activities, and opening some bars and restaurants. Two weeks later, the Region of Madrid took a step forward to “Phase 2” where some cultural activities were allowed with capacity limitations. On the 21 of June, Madrid moved to a phase called “New Normality” where the activities were less restrictive in several ways.
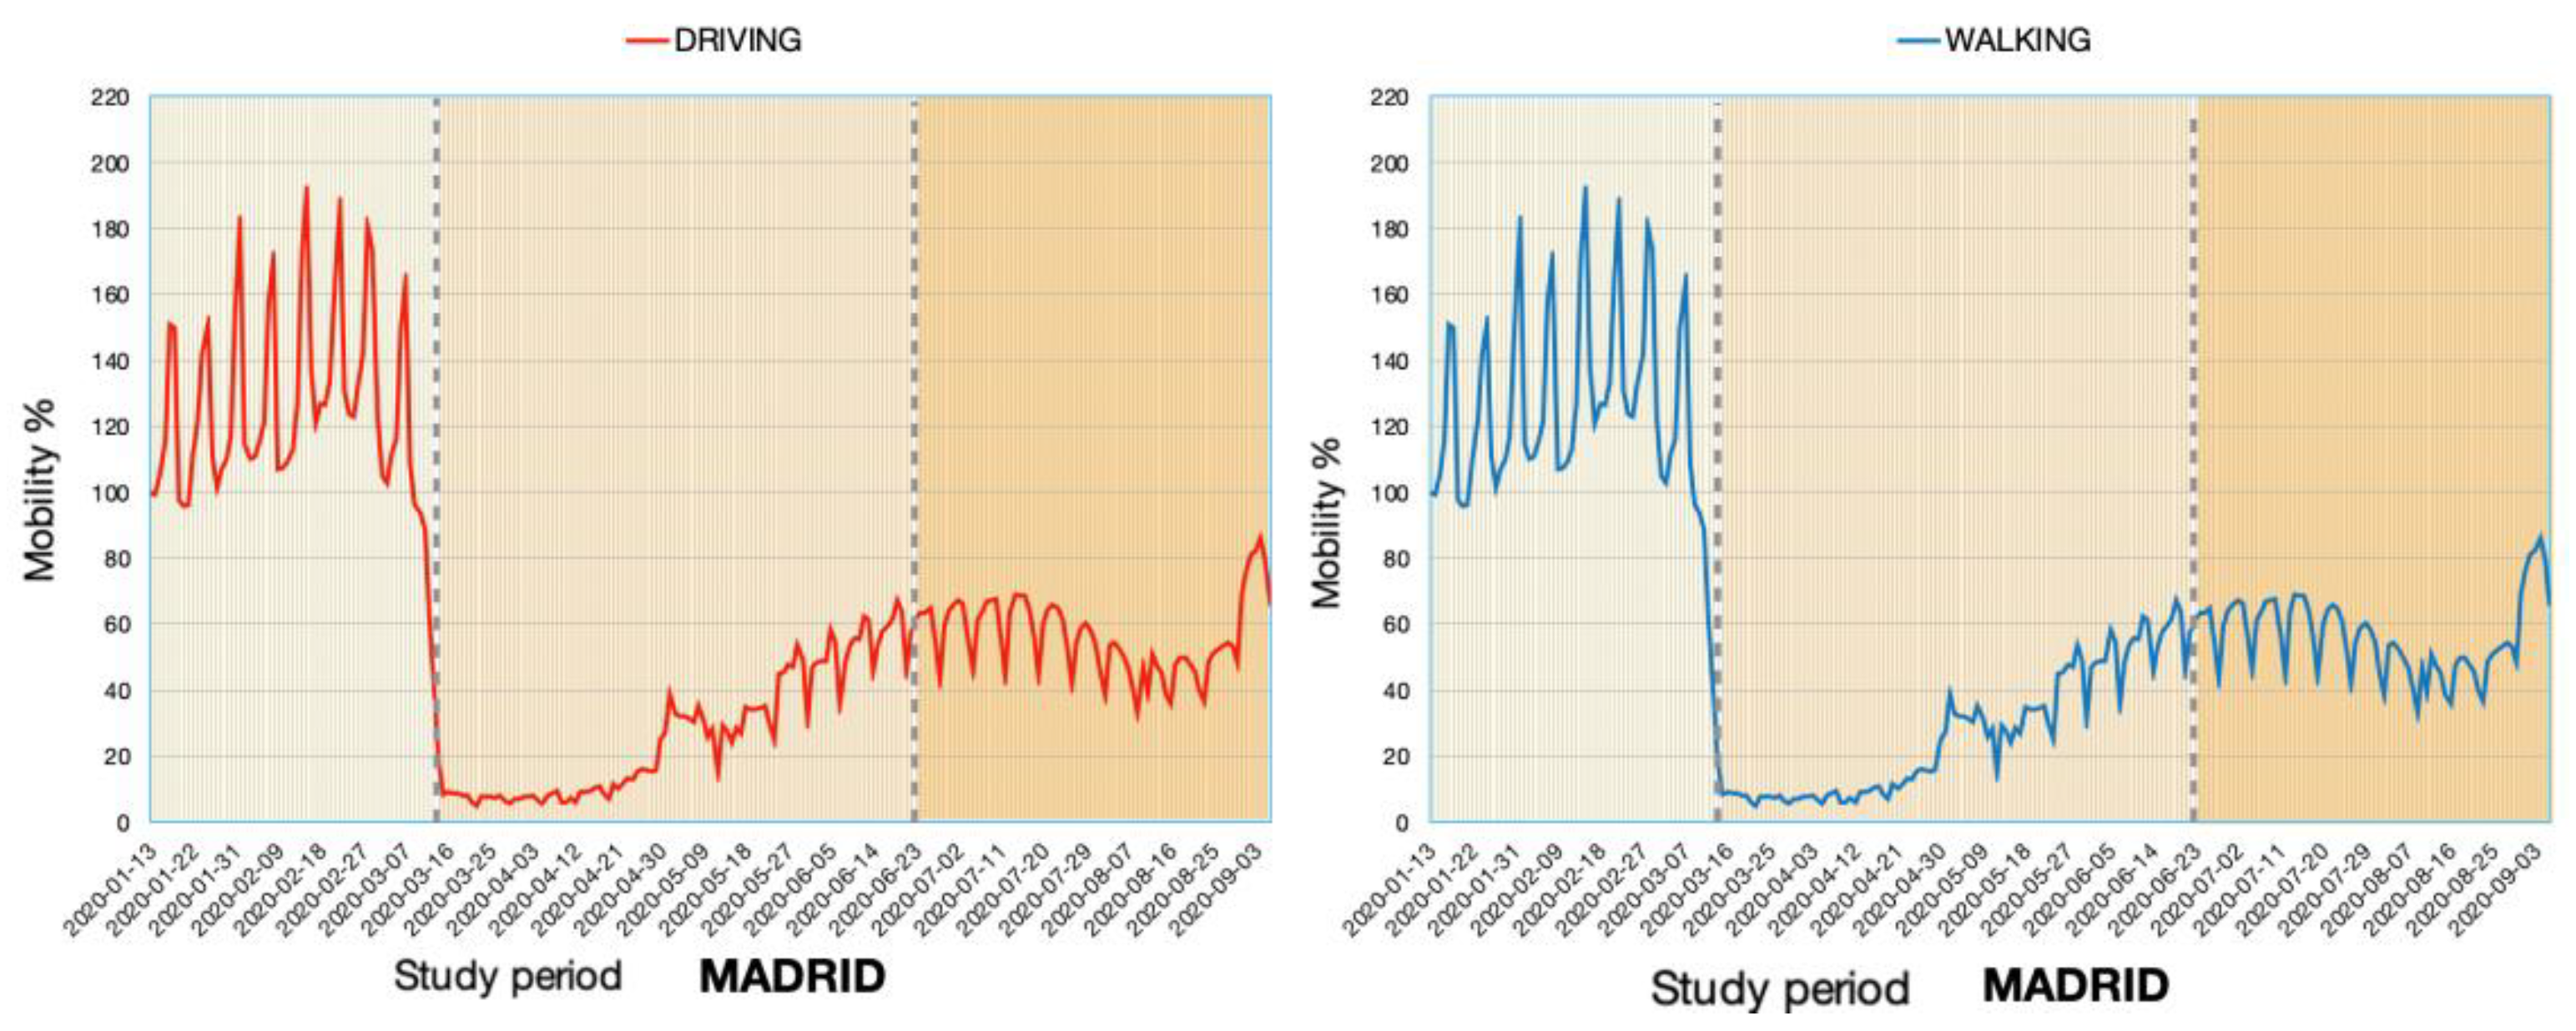
This evolution in the “de-escalade” had an impact on the number of emissions produced by the traffic because the number of trips was decreased drastically when the State of Alarm was established, as can be seen in
Figure 8, which indicates the evolution of mobility, elaborated with data extracted from Apple’s mobility trend [
22].
This downfall phenomenon of transport indicates how the traffic is a vital point to improve the air quality, as the traffic is directly related to the emission of harmful gases into the environment such as nitrogen dioxide (NO
2) and carbon dioxide (CO
2). In
Figure 9, it can be seen how in different regions of Spain, the air quality improved radically compared to the same period of last year.
Large cities such as Barcelona, Madrid, Valencia, and Bilbao are, among others, the cities where the air pollutants dropped down from almost 160 to below 20 µg/m3 as in the case of Madrid. In total, the downturn of NO2 values in this Spanish city was 49% compared to the baseline from 2015 until 2019.
On the other hand, the air pollution analysis in Madrid clearly shows the different phases of de-escalation that the city had, where each phase is connected with a gradual increase in air pollution. This tendency is shown in
Figure 10 which analyzes the evolution of PM
10 and NO
2 from January until August of 2020, a period in which the pandemic increased to its worst situation in Spain. This figure has been elaborated with data extracted from the website AQICN [
18].
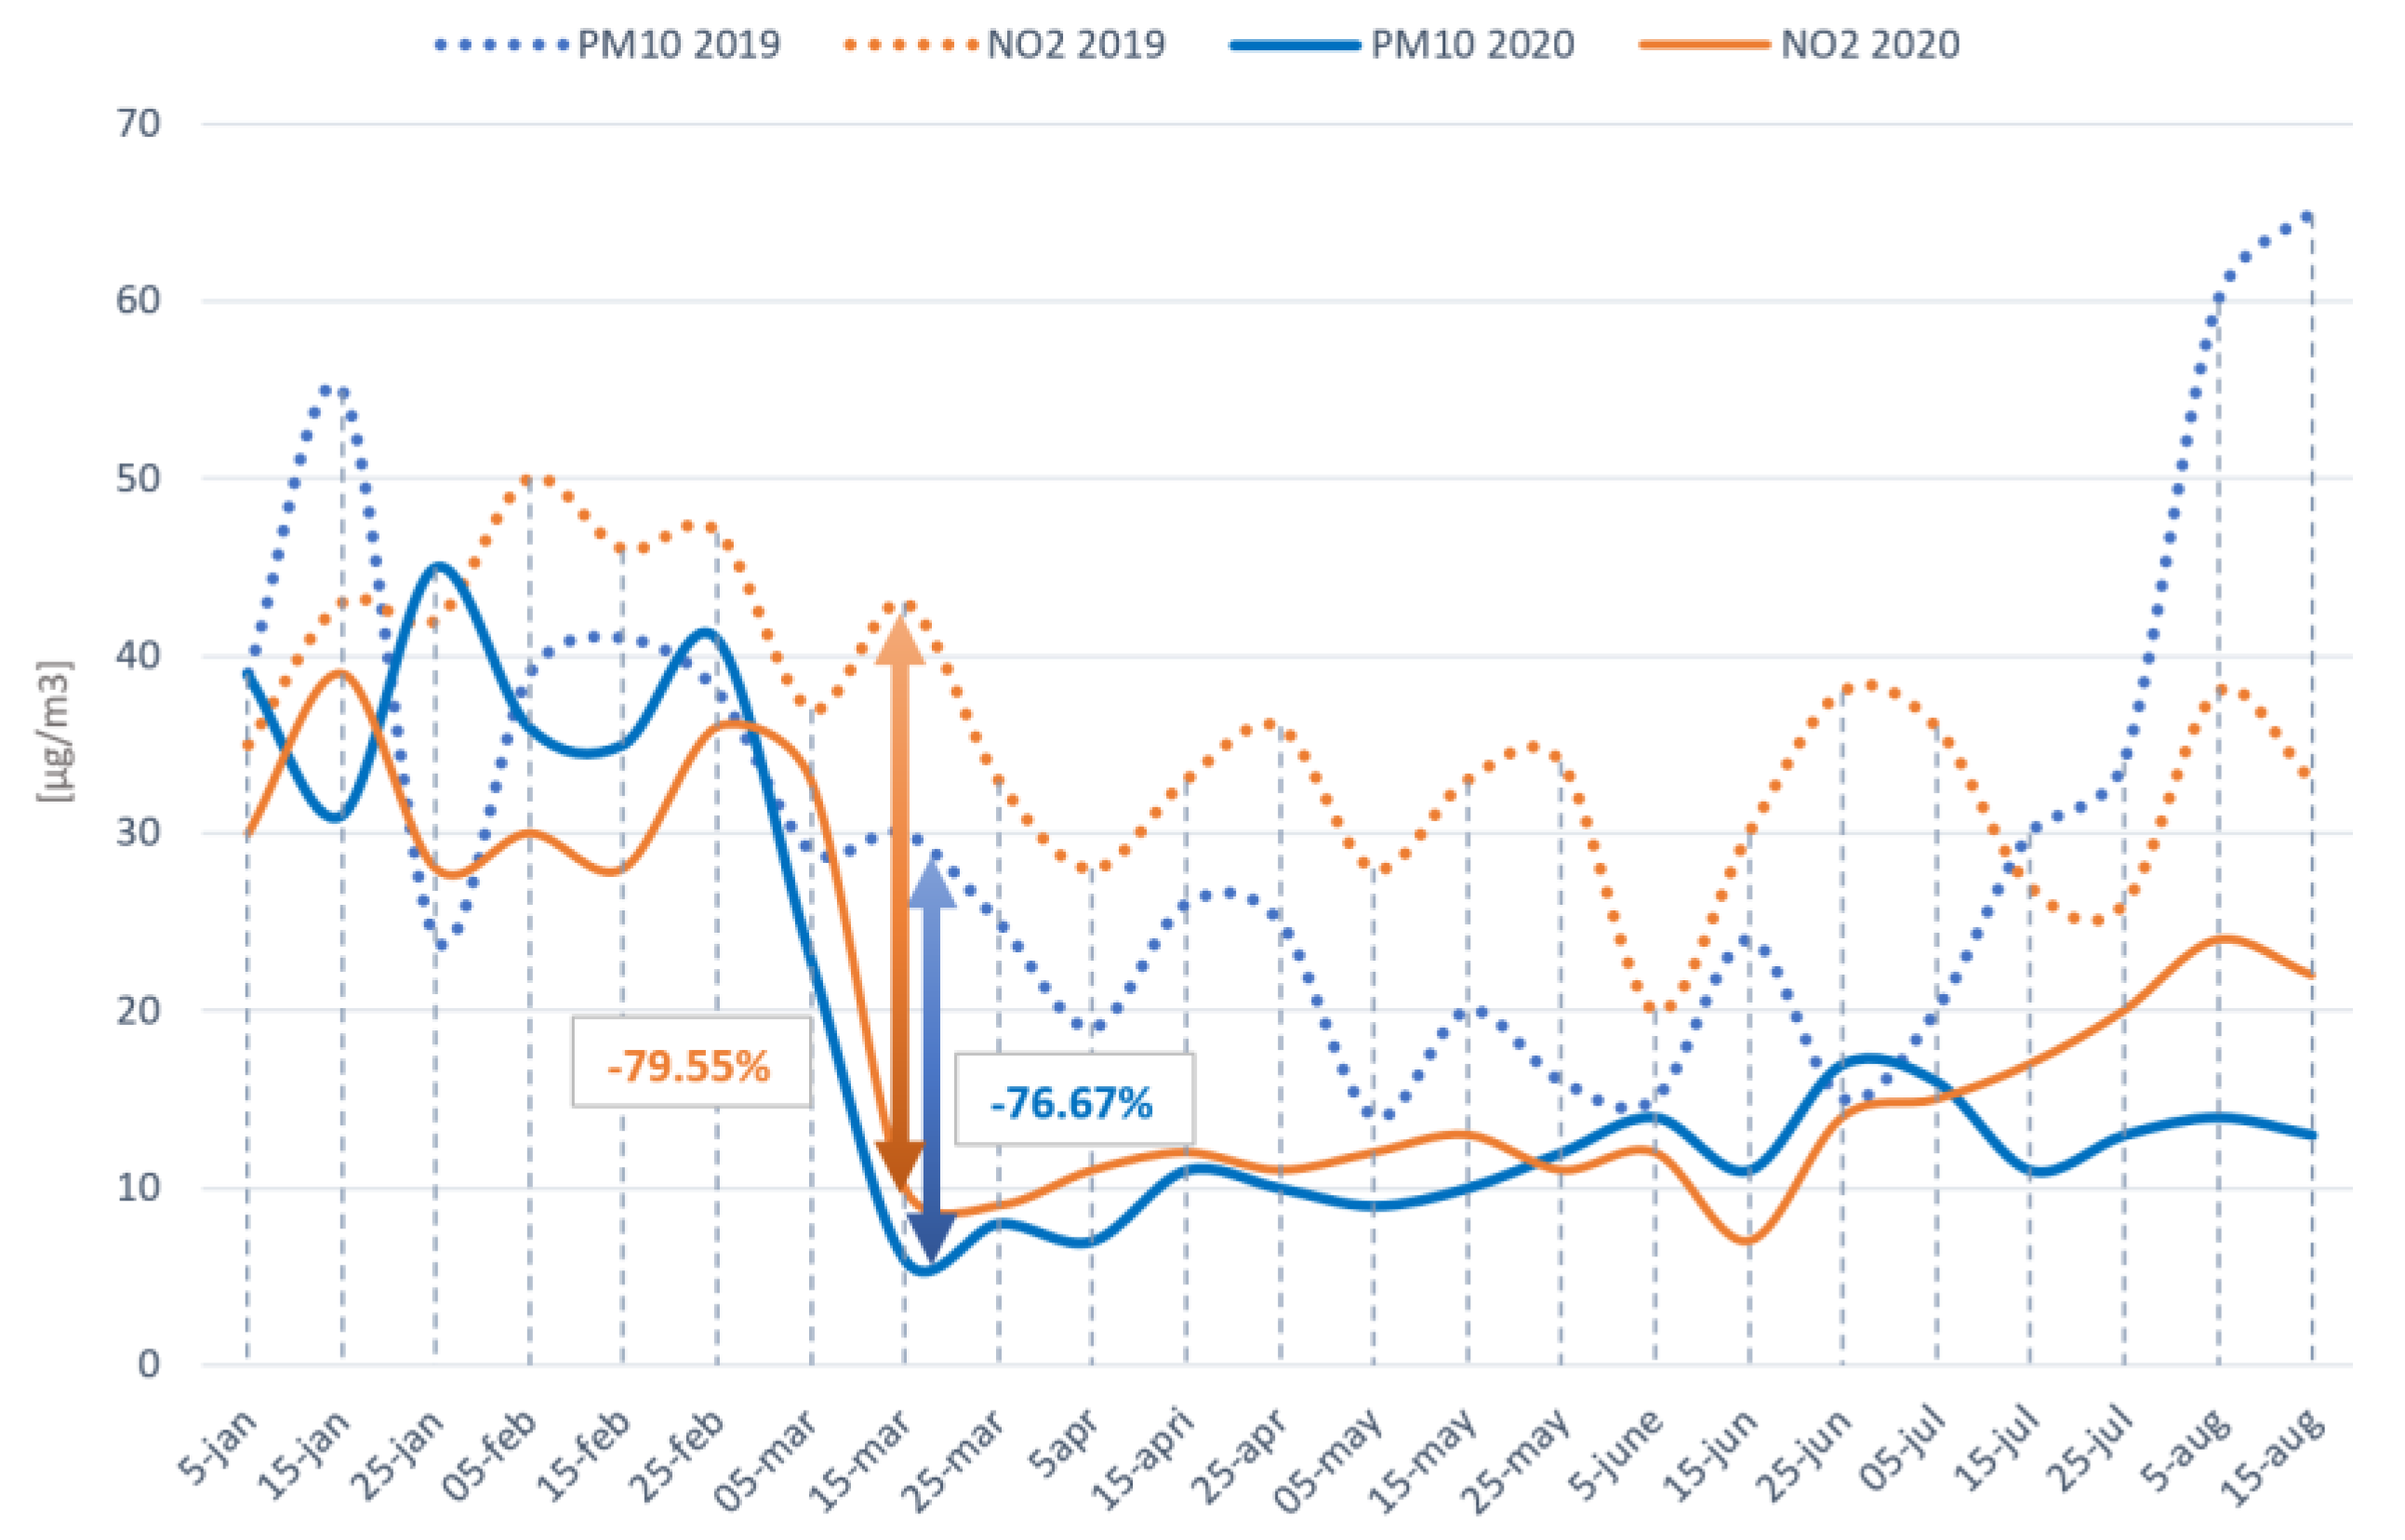
Figure 10 shows how the city started the years 2020 and 2019 with values around 30 and 40 of PM
10 and NO
2. In the 2020 case, this tendency continues until the state of alarm (14 March 2020). After this period, a drastic fall can be seen as a result of a restriction in mobility ordered by the Spanish Government. The low values continue until phase 0 (4 May 2020), where some uplifting of restrictions took place, resulting in a slight increase in pollutants as is shown in
Figure 10. With each phase, the values increase gradually; however, these values remain lower than the values before the pandemic or the year 2019. As it is observable in
Figure 10, the values of pollutants such as PM
10 downturned by 76.67% and NO
2 by 79.55%.
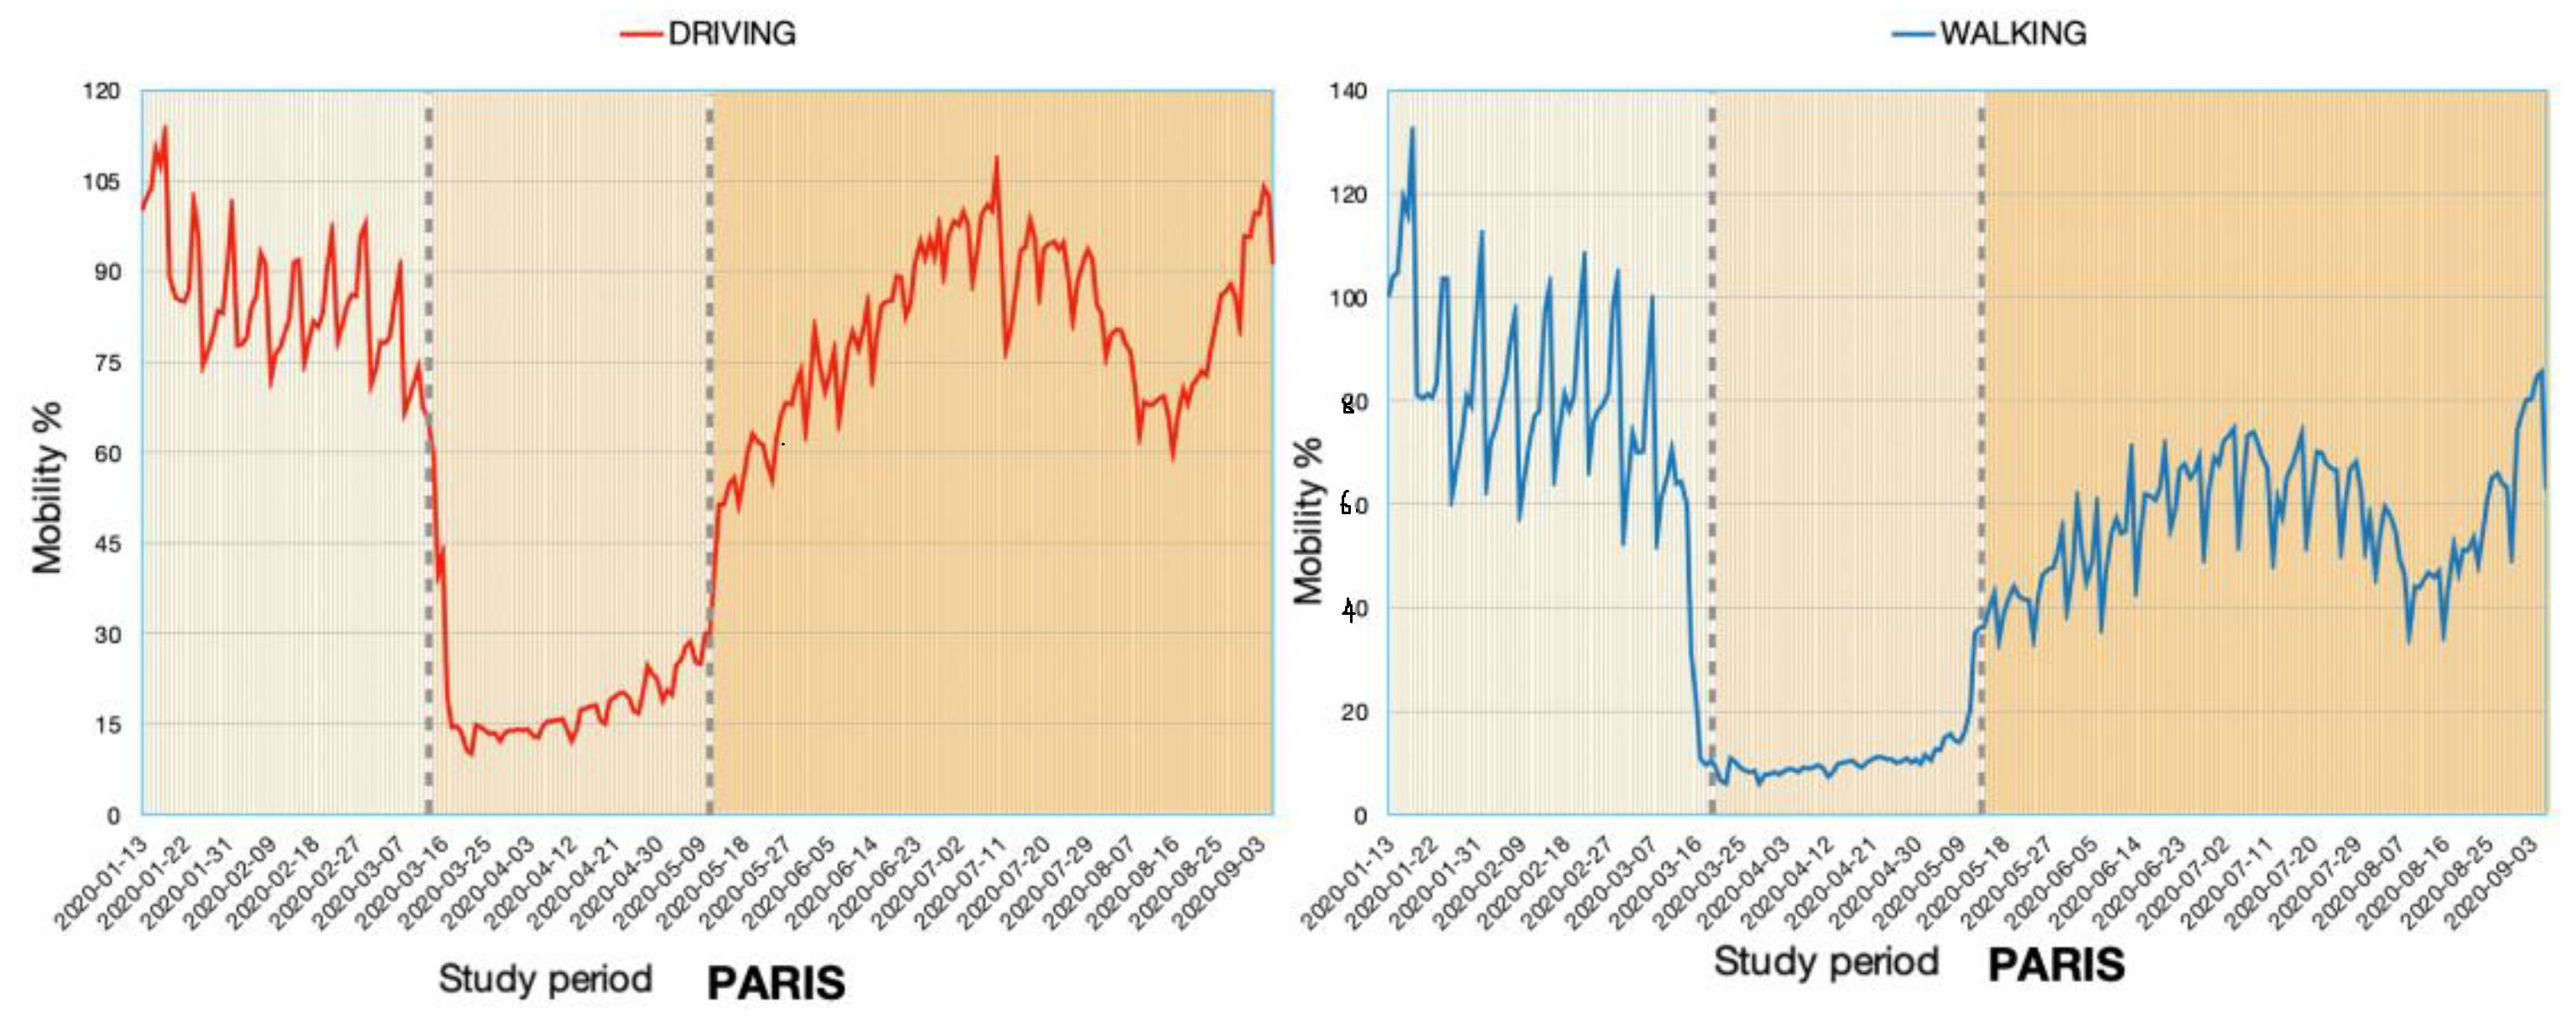
4.4. Analysis of Air Quality and Pollution Trends in Paris
Despite the high number of affected people shown by contiguous countries such as Spain and Italy, in the first moment, France was not hit as hard as its neighbor countries. Nevertheless, the government declared a state of alarm in the same period, specifically on the 16 of March. This lockdown was supposed to last no more than 15 days. However, it extended until the 11 of May, the same as in most of the European countries. Given the fact that Paris is the biggest and busiest city in France, the impact of the transport variations was very notorious in this location. The lockdown period decreased drastically the number of trips that connect Paris with other French cities.
A reduction of around 95% [
22] could be seen in the number of particular movements, with regard to the average number of trips before the pandemic situation.
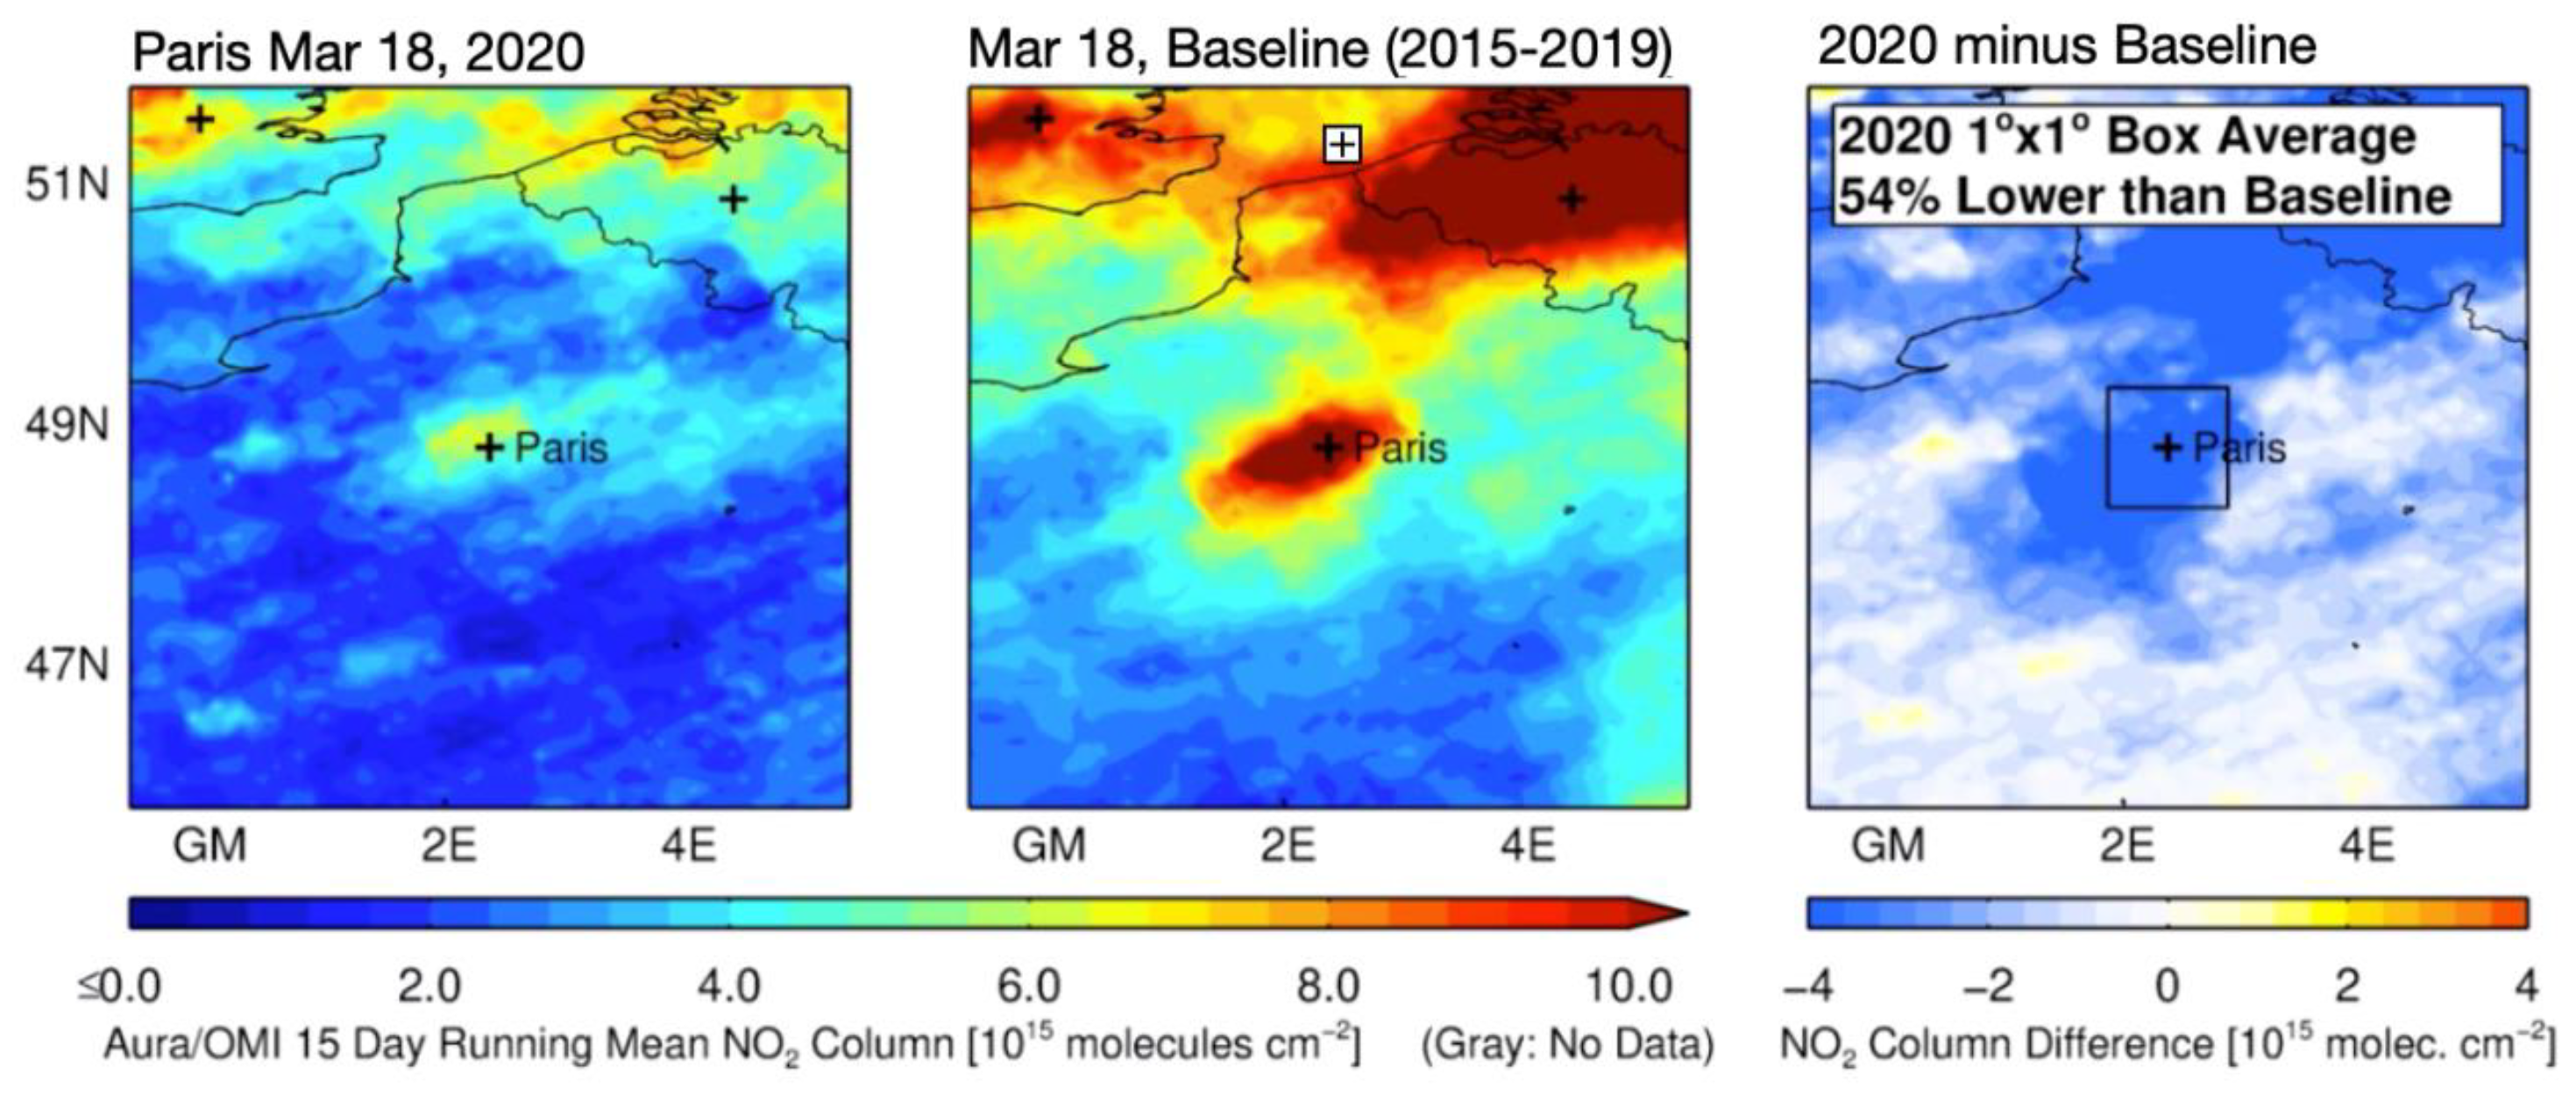
As can be seen in
Figure 11, the mobility trend in the city of Paris decreased drastically right before the State of Alarm to values almost ten times lower than the previous week, resulting in a reduction in the levels of NO
2, compared to the same period in the previous year, as can be seen in
Figure 12.
The reduction in these pollutants, especially the NO2 values, reduced by 54% from the baseline. This indicates the clear impact of the emergence of the pandemic on air quality over Paris and other large urban areas.
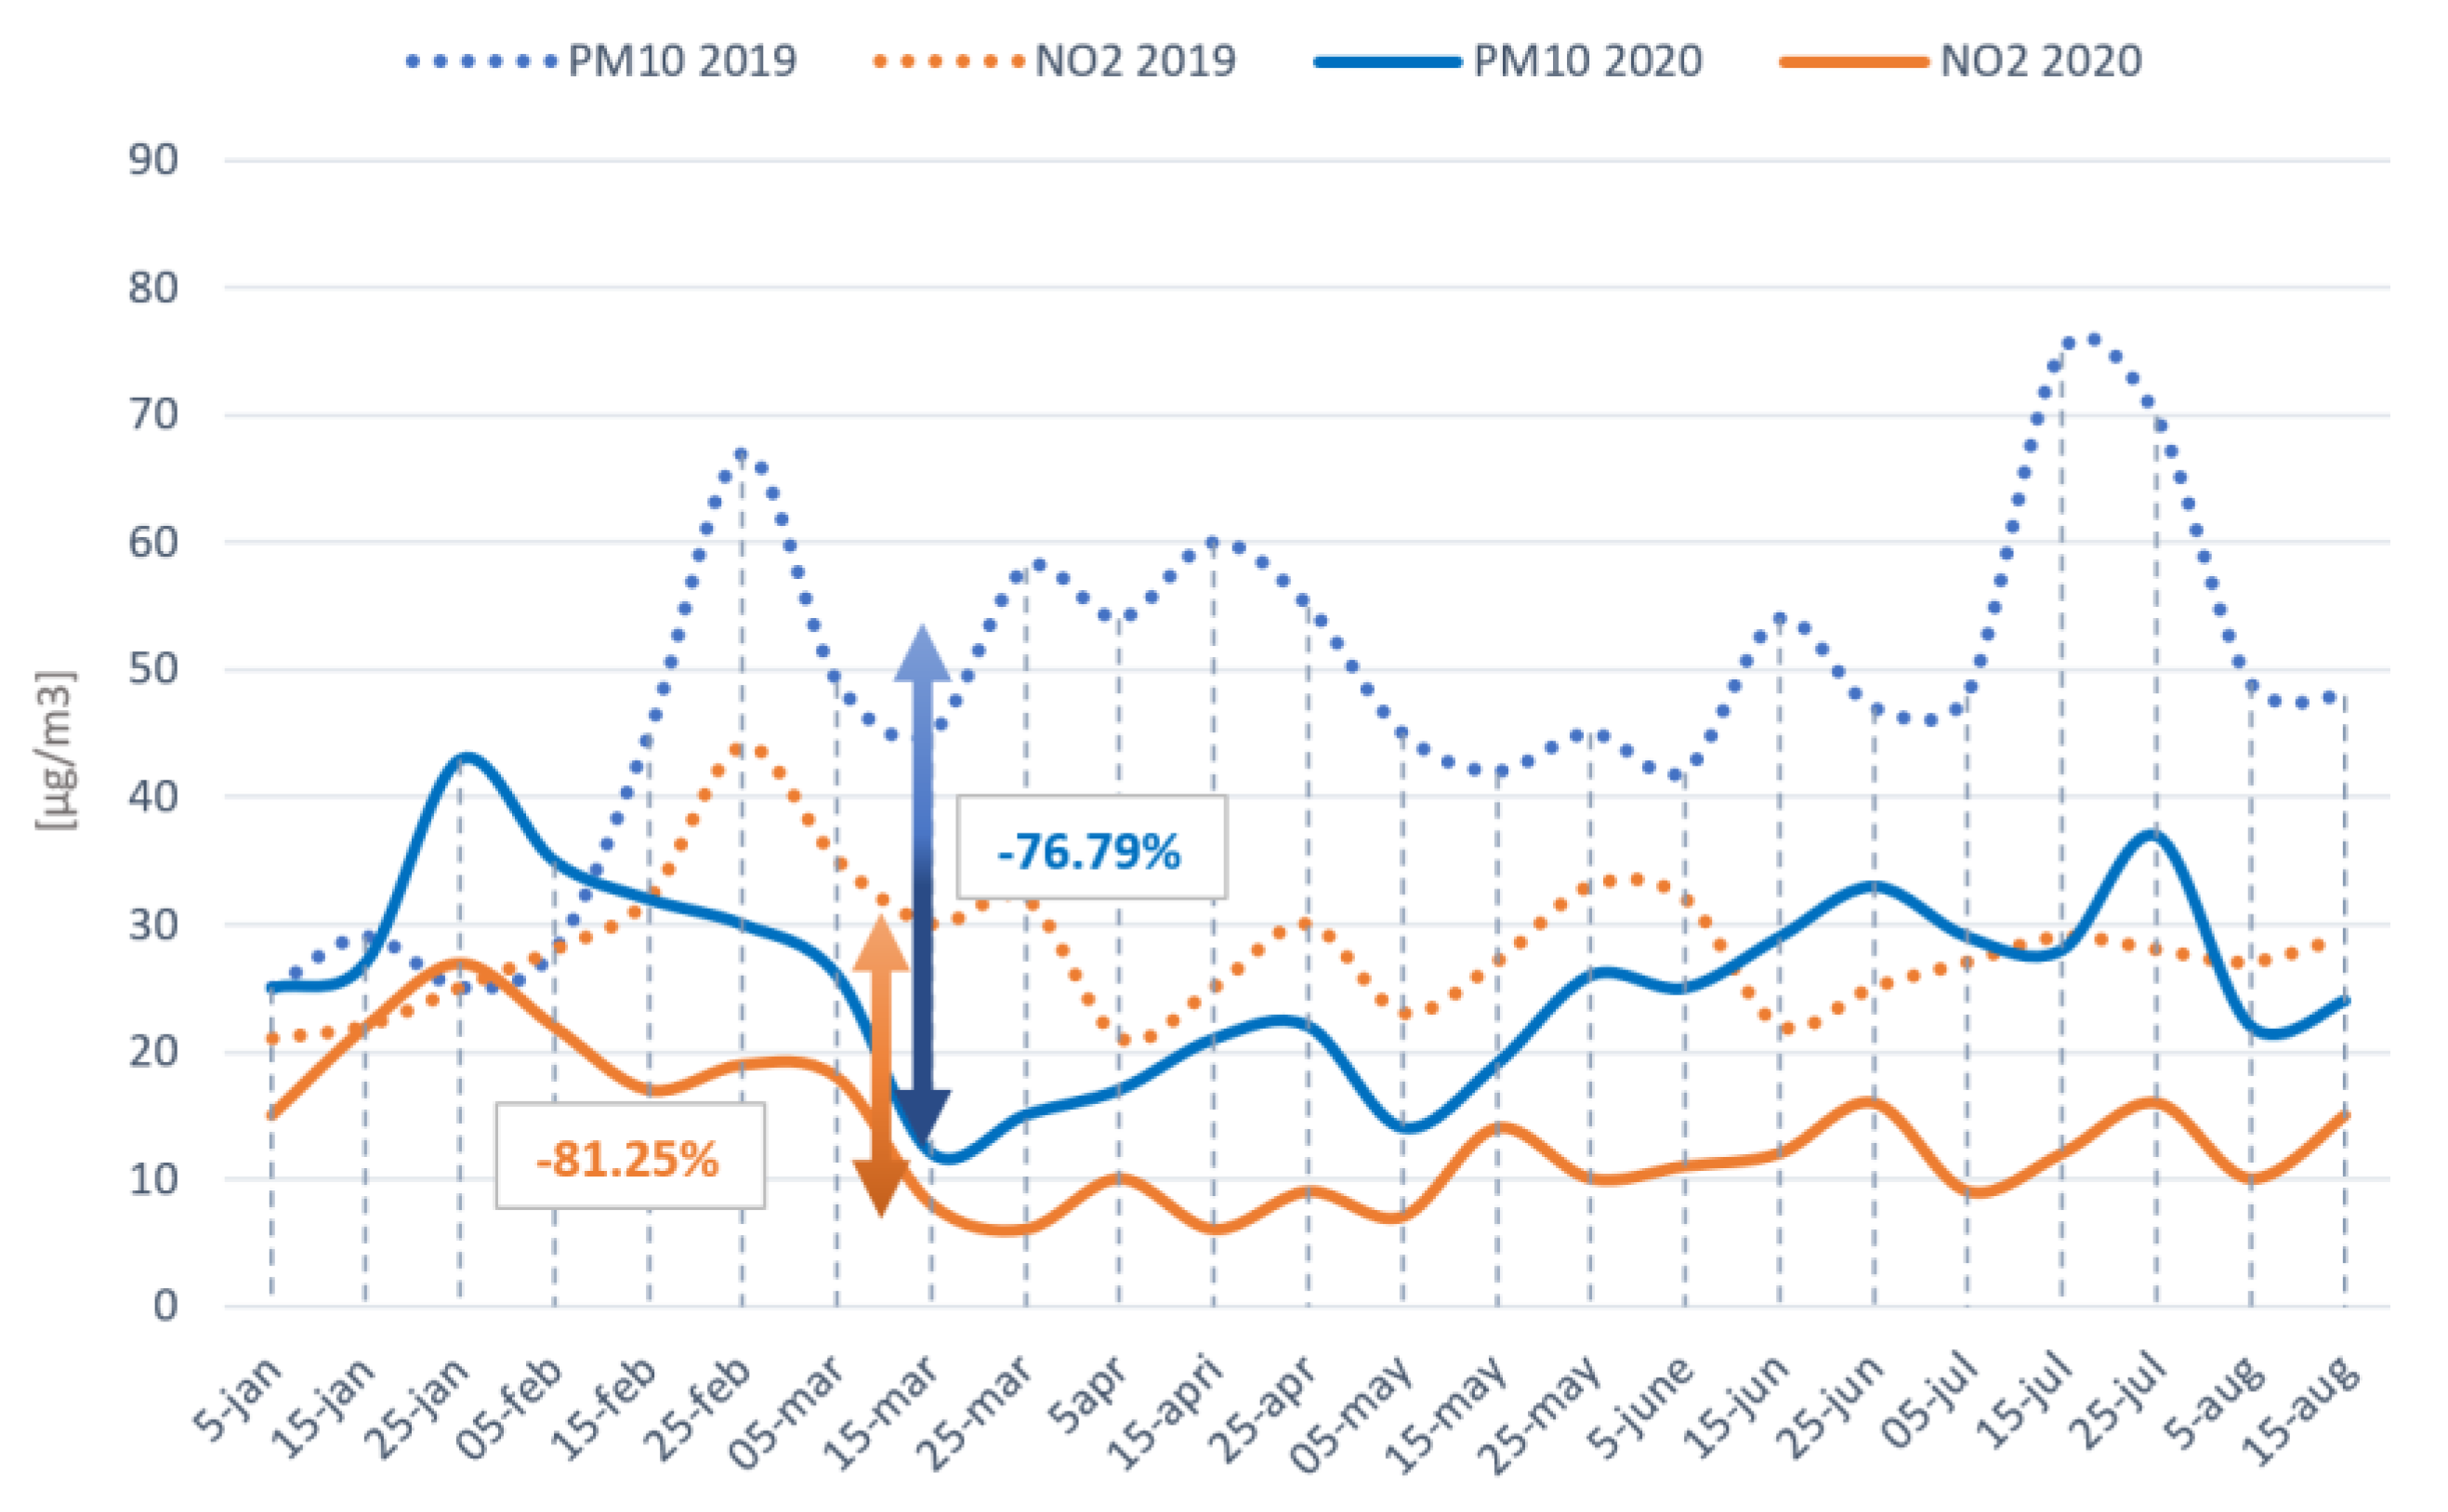
Thus, the evolution of the NO
2 and PM
10 levels and their analysis can be seen in
Figure 13, from the first 8 months of the years 2019 and 2020. This figure, as other figures in this paper, has been elaborated with data from the air quality historical data platform [
18].
In
Figure 13, a big difference between the PM
10 and NO
2 levels can be seen between the years 2019 and 2020. Even if both years started with a very similar path, already at the beginning of February, the levels in 2020 started to decrease, with a much noticeable low step within the first 15 days of March due to the established state of alarm. After this reduction, the levels started to increase slowly through the following months. Although, in late August, both levels of PM
10 and NO
2 in 2020 were not more than 50% of the levels in 2019, which means that the levels just increased at the same speed during those two years.
In summary, probably due to the low number of trips during the summer season, the levels of both values did not yet return to normal at the end of August.
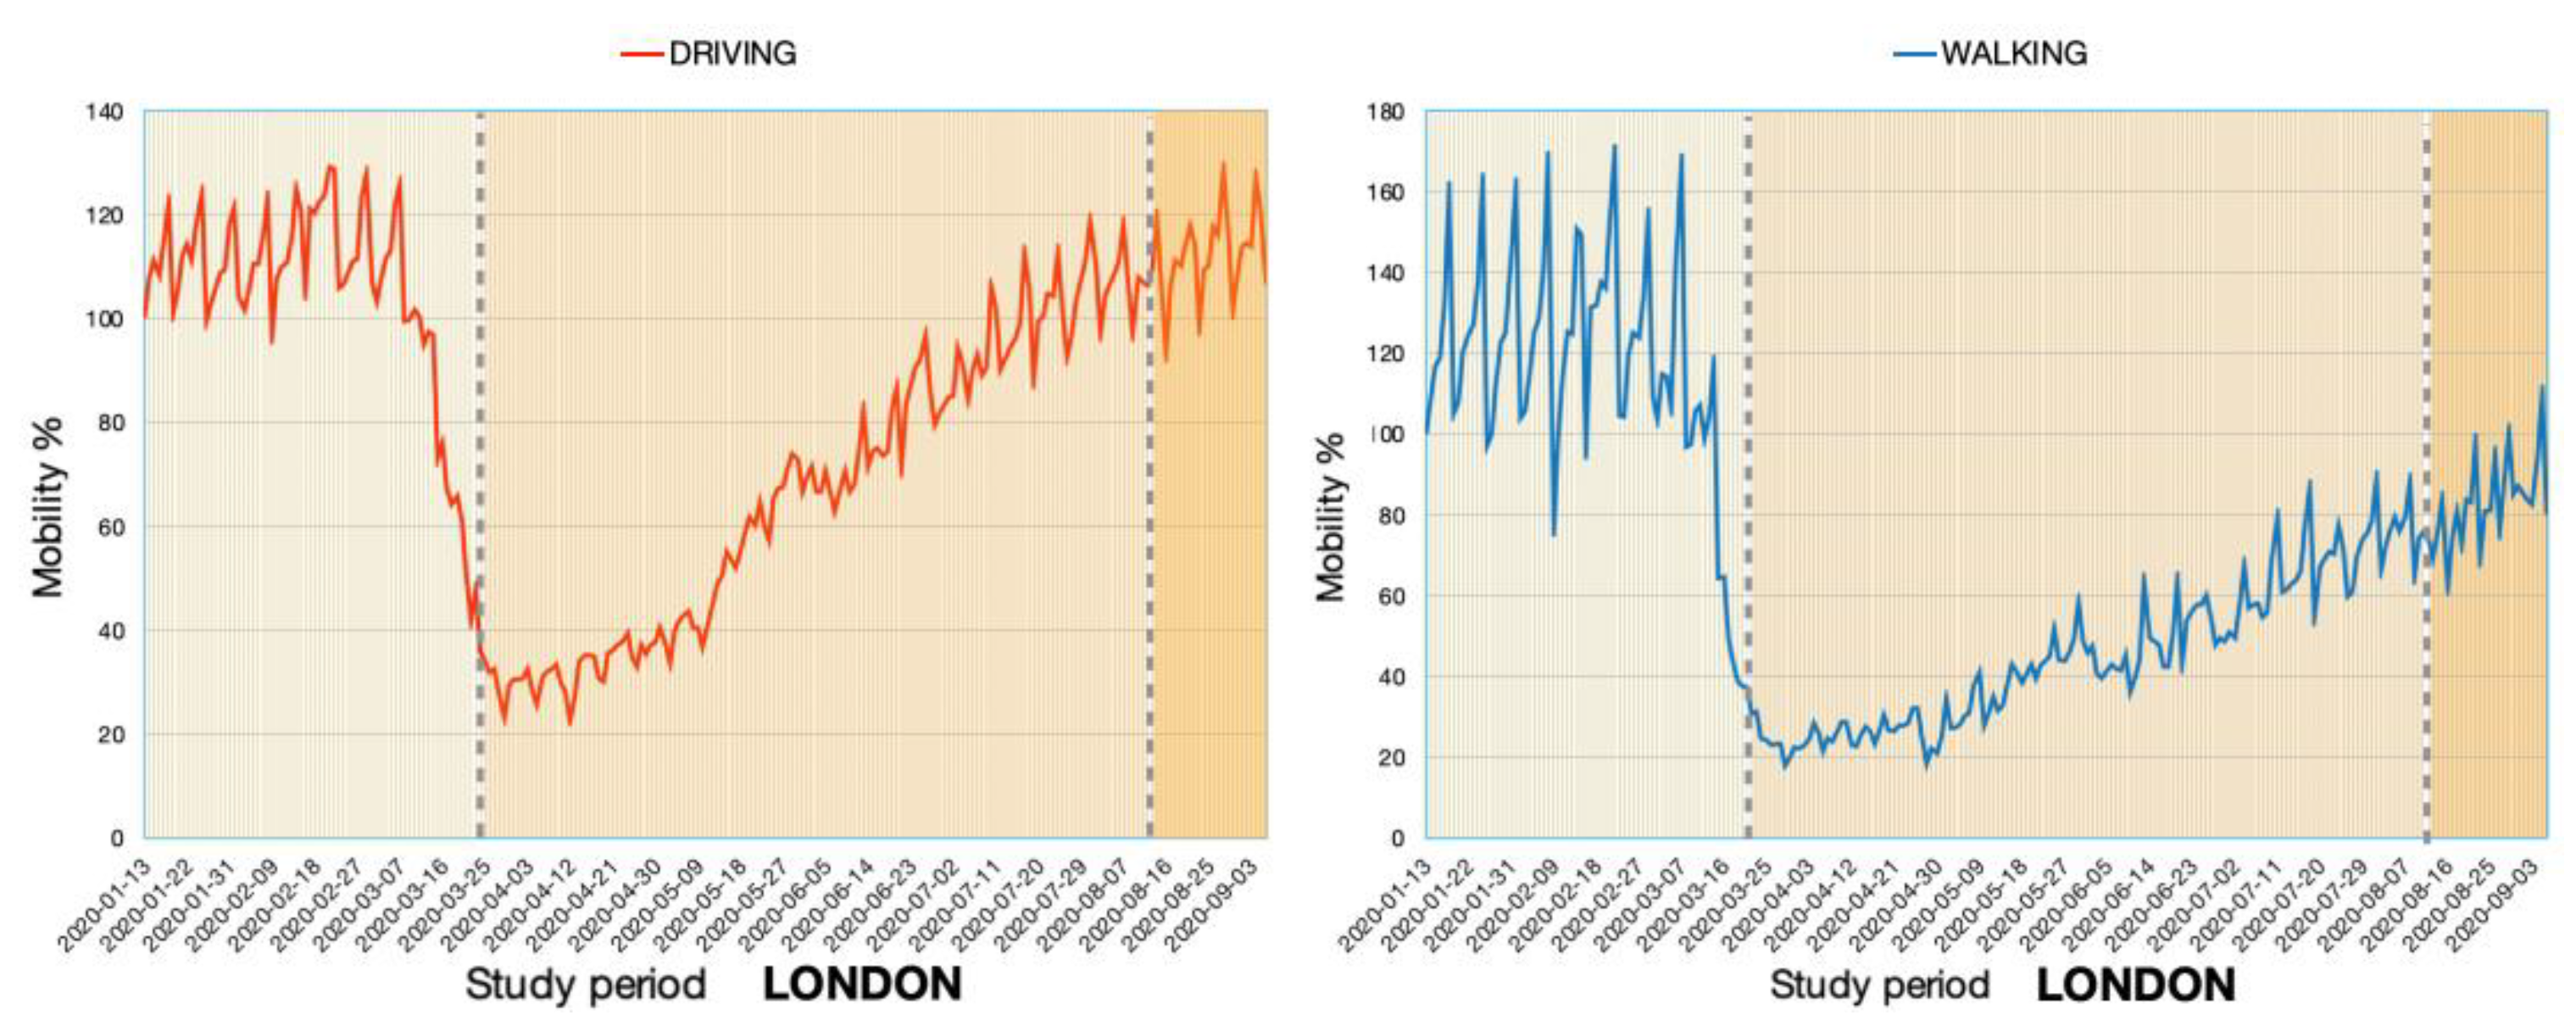
4.5. Analysis of Air Quality and Pollution Trends in London
London was the last city to declare a state of alarm with strict restrictions that took place on 23rd of March. With the rapid increase in COVID-19 cases, London became one of the most infected cities in England. The initial increase in cases took place on 6 March with a total number of 551 cases, and these cases increased drastically up to 39,419 cases in the period of time from March until the start of September. Along with large numbers of cases, London also suffers from pollution originating from traffic in various parts of the city, creating high levels of pollution. As mentioned before, vehicle movements cause particles such as NO
2, along with PM
10. Due to the pandemic situation, the national traffic system decreased its service, as it is shown in
Figure 14 elaborated with data extracted from the mobility website of Apple’s mobility trend [
22].
The fall in traffic by the end of March creates a drop-down of the curve. That is the period when the state of alarm was declared by the British government. Mobility restrictions and the closure of industrial activities are some of the main components that helped to improve the air quality.
By observing the tendencies of traffic, they can be considered a significant component in order to improve the air quality of large cities where most of the environmental obstacles are normally created from the NO
2 and PM
10. Then, as the number of movements decreased that much, the levels of NO
2 in the atmosphere followed the same tendency, as can be seen in
Figure 15.
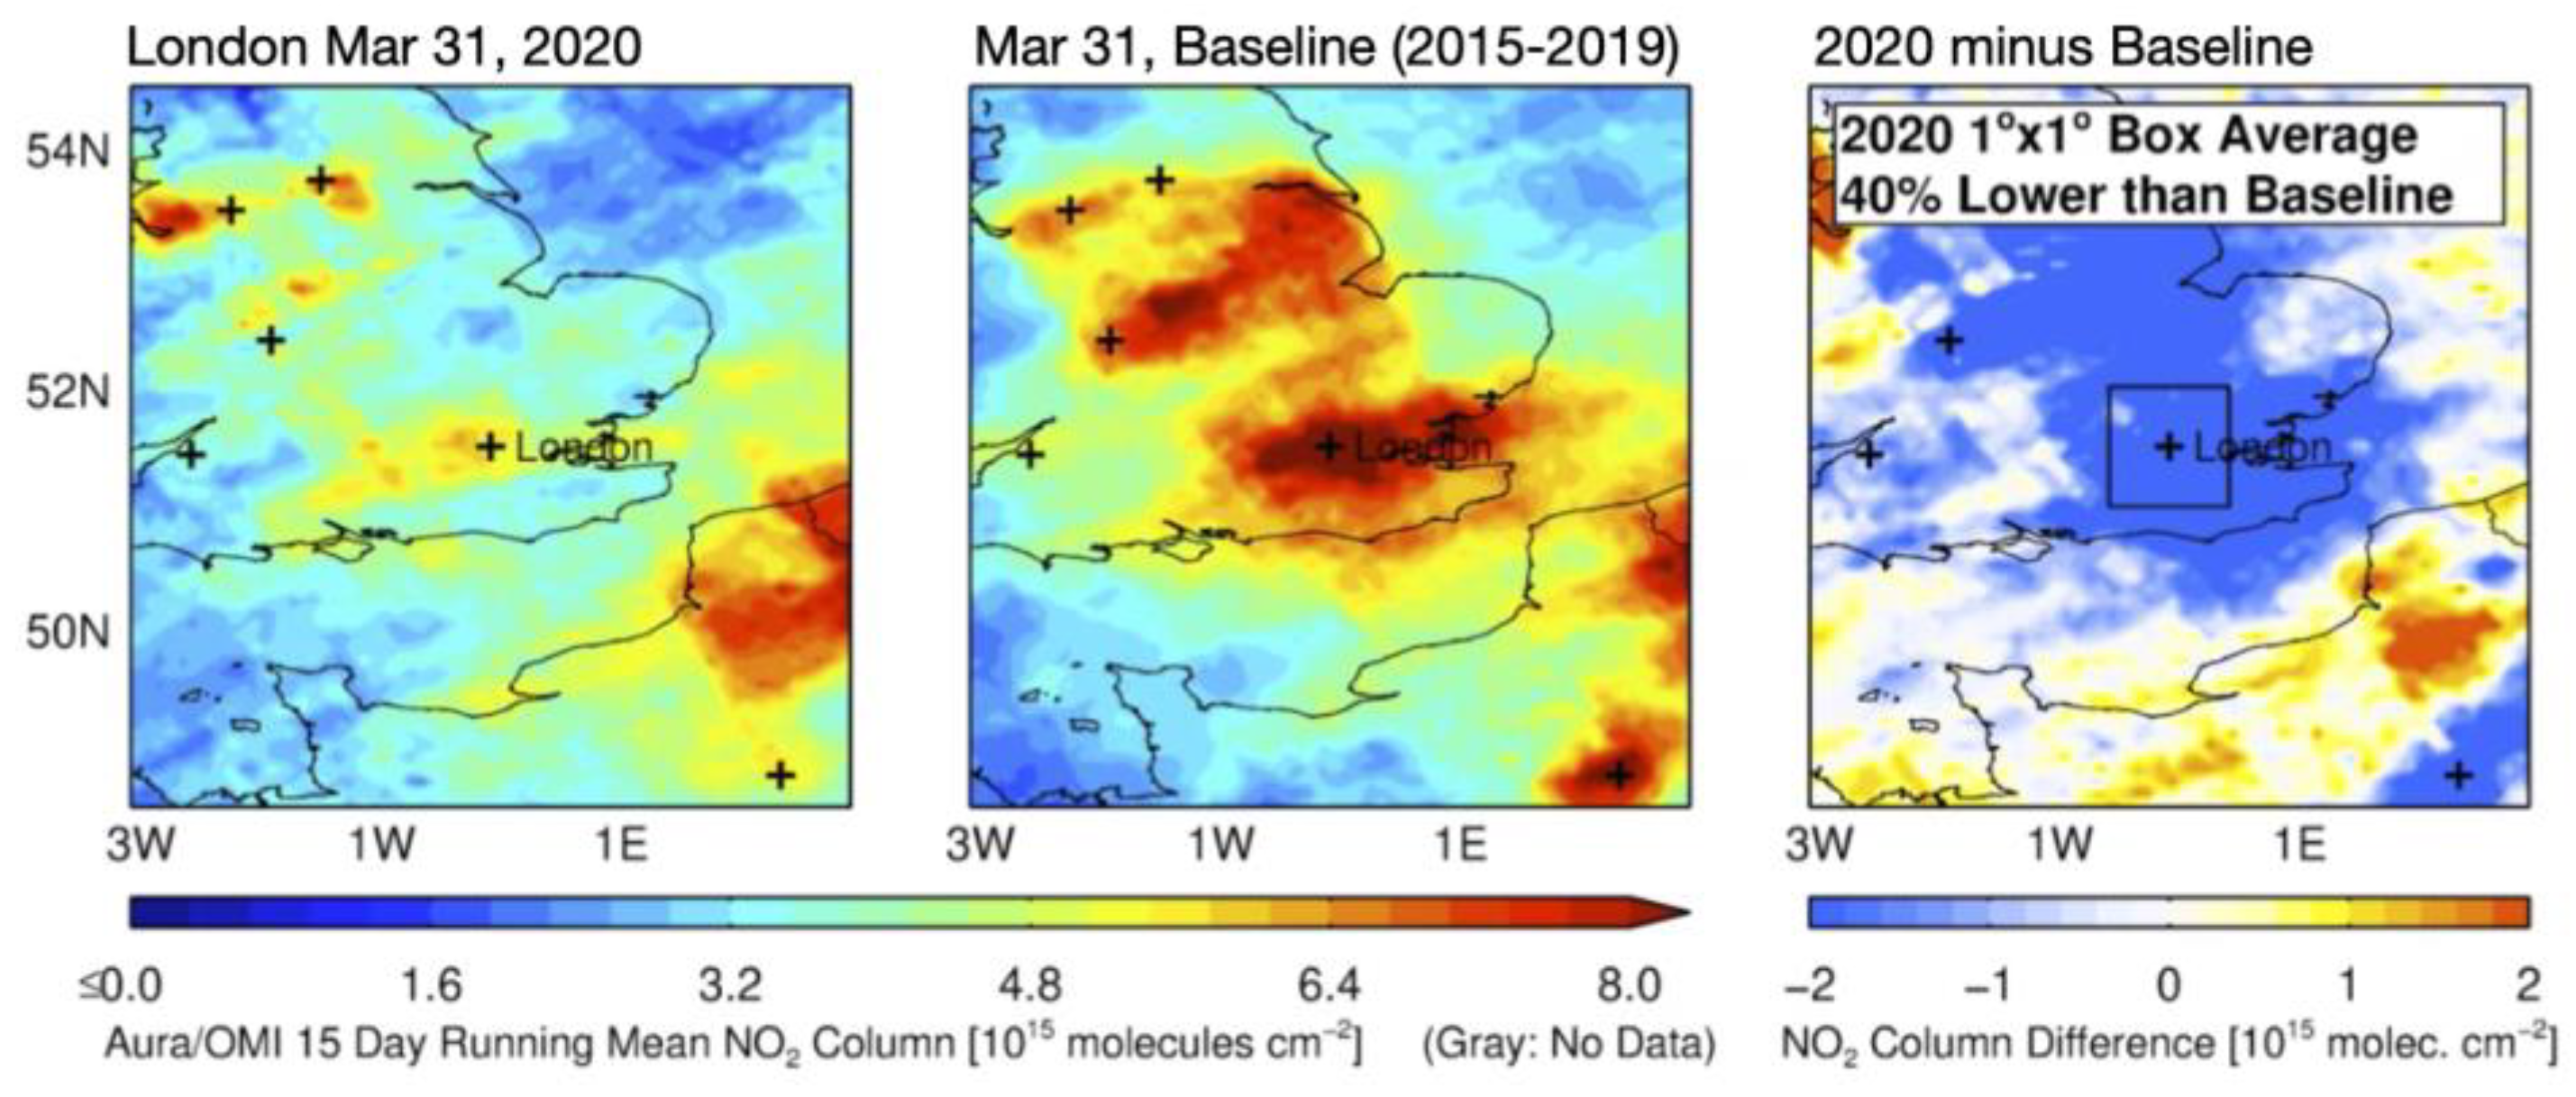
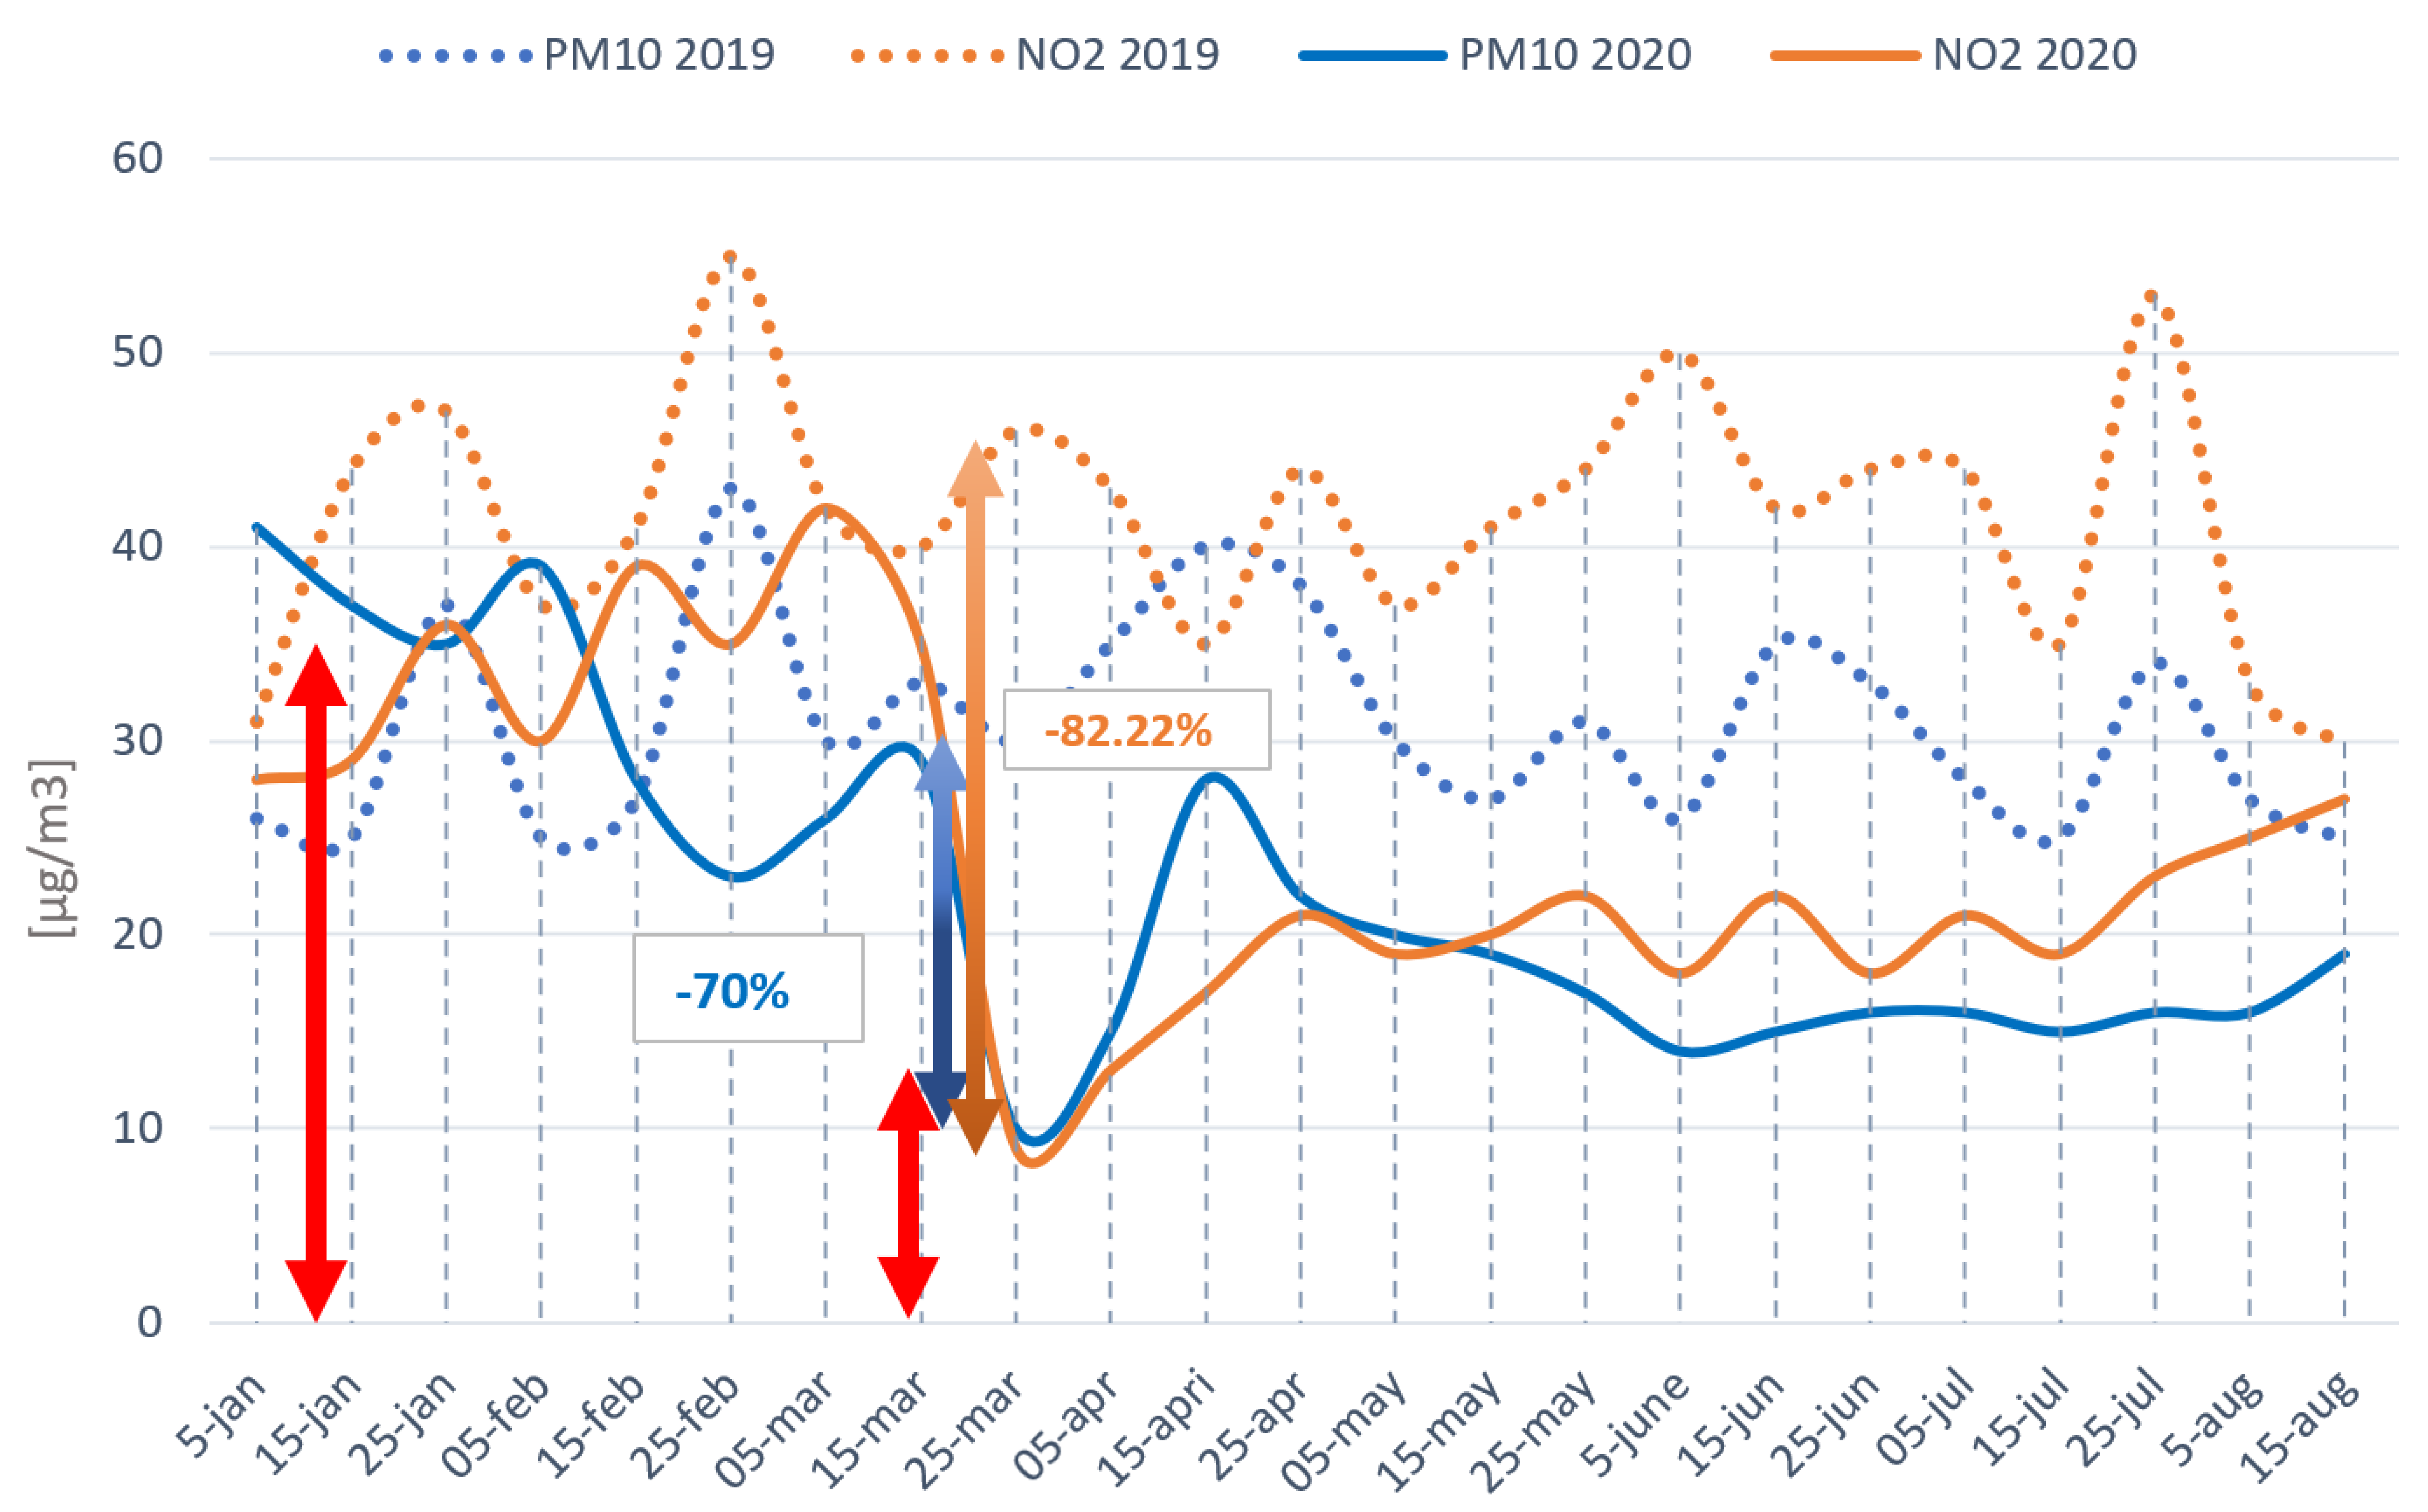
The air pollution and the presence of air pollutants over London can be observed in
Figure 16 where air pollutants such as PM
10 and NO
2 are shown, recorded by the air quality measuring station located in London.
Figure 16, which has been created from the website of AQICN [
18], shows how the year 2019 had a large value of pollution due to different fields, but remarkably, the traffic mobility within the city. At the beginning of 2020, the values remained high around 30 µg/m
3 for the PM
10 and around 40 µg/m
3 for the NO
2; however, after declaring the state of alarm, pollution decreased highly in most areas of the city, reaching up to levels below 10 µg/m
3 for both values. Compared to the previous year, the values reduced by 82.22% and 70% respectively for NO
2 and PM
10.
Nevertheless, after the first week of lockdown, the levels of both PM10 and NO2 increased slightly to levels around 20 µg/m3, remaining on those values during the following months, until the end of summer, when the figure shows a tendency for the values to increase to the usual levels before the pandemic situation.
5. Discussion
The transport system with the use of motor vehicles is known as the main source of pollution in large cities, especially pollutants such as NOx whose origin is mostly located in the combustion of fuels used in motor vehicles. Therefore, in this paper, the potential impact that traffic restrictions can have on the environment and human health is shown.
This paper has analyzed the values from January until August of 2020. The beginning of 2020 is marked by values around 100 µg/m
3, indicating the high levels of pollutants in the air at the measuring period. Once the state of alarm was declared by the authorities and the World Health Organization (WHO), the values decreased harshly by 83.64% in the case of Milan, and the reduction in other European cities was around 89.8%, and similar situations took place in the analyzed cities. The general values of PM
10 can be seen in
Table 2:
Regarding the exact values of the air pollutant, in this case, PM
10 reduced drastically from values such as 110 µg/m
3 to values below 50 µg/m
3 in a short period of time, indicating the high impact of traffic on the environment. The alteration and reduction in air pollutants have affected the air quality, urban traffic being the main source for pollution over large cities as it is the case of the studied areas in this paper. The ease of lockdown took place after several months from declaring it, which led to an increase in airborne pollutants; however, the values of these pollutants once the mobility restrictions were being lifted are remarkable. The values were higher than in the lockdown period, but these values never reached the “normal” state, improving the air quality of the cities after several months of declaring the restriction mobility and state of alarm, as it can be seen in
Table 2, marking the three main periods of study: The beginning of the year, the lockdown period, and after the lockdown. Thus, in this paper, the comparison of the stage of lockdown with the previous year (2019) indicates a significant improvement in the air quality where green landscapes have played an important role in order to provide healthy air quality spots inside large cities. Once the restrictions were being lifted, the values regarding air quality remained at positive figures as in the case of Milan: 25 µg/m
3 corresponding to the period with the ease of restrictions. In the case of Prague, the values remained around 16 µg/m
3, very similar to cities such as Madrid (12 µg/m
3) or London (15 µg/m
3). In the case of Paris, it is worth noticing the lack of drastic mitigation of daily-based traffic, which has led Paris to an air pollution of 38 µg/m
3 of PM
10 by August; however, this value remains lower than the previous year or the beginning of 2020, which indicates a clear footprint from traffic on our planet and environment.
These results should motivate the global system to rethink the current laws, regulations, and mobility policies, so the emissions can reduce in order to achieve improved air quality over large urban areas. Therefore, this study shows the importance of awareness of the human effect on pollution, and it has been studied in the current paper. A reduction in the use of both public and private transport results in a reduction in different airborne pollutants such as PM10 and NO2. This tendency shares the same pattern in different cities as all the mentioned cities have presented a harsh decrease regarding pollution. Based on the data, it can be related to the health of citizens, as improved air quality leads to better life quality. The lack of pollutants is hard to eliminate in large cities, but with human action and political interest, it has shown their impact on the environment.
6. Conclusions
As seen in the studied cities, a high number of hazardous gasses is emitted every day. Increasing the emission of these gases directly influences and damages the greenhouse effect. Therefore, a positive consequence from the emergence of this pandemic is the awareness regarding current situations taking place worldwide, which questions the environmental regulation and legislation. This motivates the modification of environmental policies in the long term as the improvement in air quality and the environment is highly conceivable with the help of conscious human activities regarding planetary health and air quality.
A strict lockdown of a short period of time has shown an important positive effect on the environment and air quality of different cities. The stoppage of different activities such as industrial, economic, and transport along with mobility restrictions of the citizens has provoked a unique opportunity to study the impact of human activities on the environment.
Large cities require more displacements, which results in more traffic. Every vehicle emits harmful gases, normally in the combustion process, where NO2 and NO are primarily formed and emitted directly into the environment. The reduction in particles such as PM10 and NO2 measured at monitoring stations located in different European cities are the key elements in order to improve the air quality, as they can be highly harmful, inducing some breathing diseases.
Therefore, this study demonstrates the interconnection between humans and planetary health by the emergence of COVID-19, showing how, with the lack of movements for approximately two months, the air concentration of particles such as nitrogen dioxide or PM10 in the atmosphere reached minimum values in the main cities. This was analyzed in this study, checking the evolution of those values in Europe during the months when the COVID-19 situation hit most of the European countries. Specifically, five of the main European cities were analyzed, Milan, Prague, Madrid, Paris, and London, in order to understand the significant reduction in the concentration of pollutants in the air. At some of these cities, like Madrid, London, or Milan, the mobility trend was extremely hard-hit by the pandemic situation, a fact that can be distinguished in the evolution of the data registered about NO2 and PM10 values. On that collection, a drastic fall in the NO2 and PM10 levels can be seen accordingly to the State of Alarm decree date, when the emissions reduced up to 25% of the average emissions in Madrid and London (from 40 to 10 µg/m3), up to 33% of the average emissions in Prague (from 20 to 6 µg/m3) and Milan (from 60 to 20 µg/m3), and up to 50% in Madrid (From 30 to 15 µg/m3); therefore, the human action that, in this case, was motivated by the emergence of COVID-19, led to major improvements in air quality and has shown its impact on large cities, thus making this action a key to enhance the current pollution issue that has a resolvable characteristic.


