Abstract
The driving mechanism of soil quality (SQ) has important implications for arable land protection, sustainable agricultural development and ecological environment conservation. This study builds a “perception–response” theoretical framework to investigate how farmers’ land use behavior may affect SQ from the temporal and spatial perspectives. Based on soil sampling data, farmer survey data and socioeconomic statistical data collected in a typical peri-urban area of northeast China, geo-statistical analysis and econometric models have been applied to examine the effect of farmers’ land use behavior (FLUB) on SQ. The results show that during 1980–2010, the target of FLUB has been shifted from “grain output maximization” to “grain output and profit maximization” and then to “profit maximization”. The FLUB, including land use pattern, land use degree and land input intensity, also show obvious differences in space. These differences result in distinct impacts on the variation of SQ in time and space. Generally, the soil organic matter (OM) tends to decline, the available nitrogen (AVN) and available phosphorus (ANP) tend to rise, while the available potassium (AVK) increases after an initial decline. Moreover, the further distance from the city center, the greater the spatial variation of SQ in space. These findings are not only helpful from a theoretical and practical significance for policy-makers to improve SQ in the outskirts of metropolitan areas, but also make an important contribution to the sustainable development of peri-urban agriculture (PUA).
1. Introduction
Cultivated land is the most basic means of agricultural production. In order to guarantee both the quantity and quality of food security in China, the fundamental premise of sustainability is paramount for all agricultural land. There is no more time for unsustainable land uses, in the midst of climate change, biodiversity loss, fresh water quality decline, etc. [1,2]. However, due to the large population in China, the continuous development and acceleration of industrialization and urbanization have resulted in a decreasing amount of cultivated land [3,4,5]. In this context, in order to ensure food security, it is necessary to increase the cultivated land input intensity to maintain a high production capacity, which often leads to excessive use of fertilizers and other agricultural production materials, resulting in the degradation of soil quality (SQ) and ecological environment, that is more obvious in peri-urban areas [6,7,8,9]. Therefore, utilizing cultivated land resources reasonably, preventing cultivated land quality (CLQ) from declining, and improving the level of intensive land management, have not only become the most important matters that need to be solved urgently, but also remain some of the key scientific problems to explore the relationship between human and land resources conservation in peri-urban agriculture (PUA) [10].
With the establishment of the rural farmer responsibility system in the 1980s in rural China, farmers have become independent and basic decision-making units. Farmers’ land use behavior (FLUB) has therefore become a direct force that determines the growth of agricultural production [11,12]. As they are the managers of the land and the decision-making body, their behavior determines whether the land is utilized rationally, including the selection of land use pattern, land management measures and land input intensity. All these may cause changes in the quality of arable land [13]. For example, some land use behavior such as the appropriate application of organic fertilizers, the conservation tillage and the returning of straw to arable land when harvesting, are regular ways to maintain or improve SQ. On the contrary, unreasonable human activities, such as excessive grazing and excessive use of chemical fertilizers, could cause soil pollution, soil erosion or soil degradation, which accelerates the decline of SQ [14,15]. Thus, reasonable support for qualified FLUB is the core challenge to protect and improve the SQ and the sustainability of new forms of agriculture in urban and peri-urban areas.
At present, the existing literature mainly focuses on the following three aspects. First, the study on SQ and its driving mechanism has been explored a lot. On the one hand, some studies have proposed various calculation methods to quantitatively evaluate SQ, such as comprehensive SQ index [16,17,18], multi-variable index Kriging interpolation [19], and dynamic model method [20,21]. On the other hand, some researchers have uncovered the influencing factors of SQ from the aspects of land use pattern [22,23], farming system [24] and agricultural management measures [25]. Second, as regards to FLUB, most studies put emphasis on farmers’ behavior in land rental market participation [26,27], land-related input [28], adoption of agricultural technology [29,30] and SQ protection [31] and then identify the impacts of agricultural ecological environment policy [32], land tenure arrangement [33], market factors [34] and farmer characteristics on FLUB [35,36,37]. Third, some researchers begin to pay attention to the relationship between SQ protection and farmers’ behavior. They have attempted to study how soil nutrient degradation could be affected by farmers’ management measures with low external technology inputs [38,39], the influencing factors of farmers’ land management decisions [40], farmers’ cognition on land quality [41,42], and SQ evaluation based on FLUB [14].
Although the extant literature has carried out in-depth study on FLUB and SQ, there are still several aspects that can be improved. First, as regards to the angle of view, most of the existing studies related to driving mechanism of SQ have focused on the impacts of natural factors. As the increasing intervention of farmers’ activities on land use, human factors have become the main factors affecting the SQ change. However, as to the studies that refer to the effect of human factors, there are only simple descriptions and thus a lack of convincing empirical analysis. Second, in terms of the research object, under the rapid growth of the Chinese economy, what changes have taken place in FLUB, and how may such changes affect SQ? Such questions still need to be answered with more convincing evidence. Third, in terms of research methodology, the question of how to integrate the research methods of natural science and social science based on specific data sources and model applications remains to be further explored. Fourth, in terms of the research area, few studies have focused on the peri-urban areas, which is one of the areas with the most drastic changes in land use.
This study aims to answer two questions: what has happened to the SQ in the peri-urban areas, and how? To this end, theoretically, an analysis framework explaining the driving mechanism of FLUB on SQ has been built from two dimensions of time and space. This paper takes Sujiantun as the research area. It is a peri-urban of Shenyang city, Liaoning province in northeast China. We try to uncover the variation of SQ in time and space dimensions, and explore the change of FLUB and its impact on it. In what follows, Section 2 presents a conceptual framework linking FLUB and the variation of SQ. Section 3 explains the method including survey design, data processing and the econometric modeling. The results and discussion are reported in Section 4, followed by the concluding section.
2. Theoretical Framework
2.1. Definitions
2.1.1. FLUB
As for the definition of FLUB, some researchers deem it as the production decision made based on the changes in the prices of agricultural production, production behavior or land resource utilization behavior [43,44,45]. However, FLUB is actually the production decision-making behavior process of farmers in land use, including the decision of “what to grow (land use pattern)”, “how much to grow (land use degree),” and “how to grow (land input intensity)” (see Figure 1). Therefore, in this study, the definition of FLUB contains three aspects: land use pattern, land use degree and land input intensity. Correspondingly, land use pattern means the selection of crop types is quantified by whether (or not) growing cash crops (WGCC). Land use degree implies the degree of land use required to reach a certain output, and we qualify it by a multiple cropping index (MCI). Land input intensity signifies the selection of investment and technology; land input intensity (LII) is applied to qualify it.
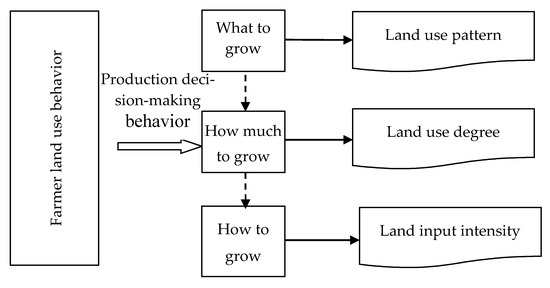
Figure 1.
The definition of farmers’ land use behavior (FLUB).
2.1.2. SQ
Regarding the SQ, scholars propose that it is reflected by the capacity of products of the cultivated land, a variety of attributes and functions, such as natural quality and utilization quality [46,47,48]. In this study, in order to investigate the effect of FLUB on SQ from the micro-level perspective, relatively stable indexes, such as surface texture and soil configuration, should be avoided when quantifying SQ indexes. Instead, indexes that are greatly affected by FLUB and can accurately reflect SQ should be selected. After screening and comparison, combined with the data availability of this study, four indexes were finally selected to quantify SQ, i.e., soil organic matter (OM), soil available nitrogen (AVN), soil available phosphorus (AVP) and soil available potassium (AVK).
2.2. The Driving Mechanism of SQ Change by the FLUB
Figure 2 describes the driving mechanism of farmers’ targets and the land use behavior that may affect the temporal and spatial variation of SQ. First of all, cultivated land holds the capacity of both producing food and generating economic value. The former mainly satisfies rural farmers’ food demand, while the latter mainly meets their profit needs. A farmer is both a producer and a consumer, which determines that the production and consumption behaviors are constrained by the supply of capital, knowledge/knowhow and soft skills of farmers. From the perspective of behavior theory of farmers [14,15], the goal of farmers’ production is to maximize utility. Whereas, according to the theory of development economics [42,43], the goal of farmers to maximize utility appears in diverse forms at different stages of economic development. Hence, the farmers’ land use target is constantly changing with the economic growth. In this process, farmers will produce and measure their own needs, which are food demand and economic value demand. The former is to meet the family’s food consumption, while the latter can meet the family’s profit demand [49,50]. Under the strong constraints of farmers’ food consumption, farmers tend to give priority to meeting farmer food consumption needs, and thus their decision-making is based on the satisfaction of farmer food consumption capacity. After the food consumption is satisfied, it is the demand for the economic value of land. Eventually, the function of cultivated land will match the needs of farmers.
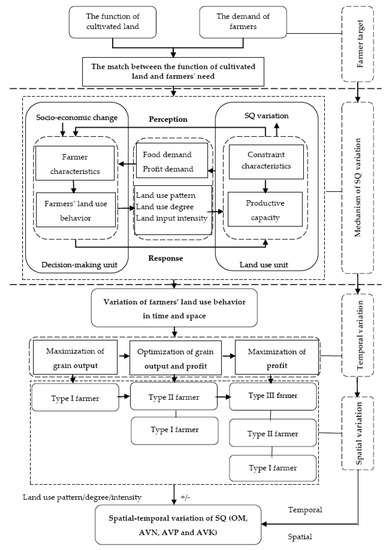
Figure 2.
The driving mechanism of soil quality (SQ) change by the FLUB in the temporal and spatial variation.
Secondly, with the rapid economic development, the high-speed increase of the population, the continuous expansion of the city size and the continuous adjustment of policy systems, a large amount of cultivated land has been used for non-agricultural purposes, resulting in a decline in both the quantity and quality of arable land. These external pressures also make farmers constantly adjust FLUB to maximize utility based on farmer characteristics, such as land, labor, capital, and technology, and the perception of the SQ. When these adjustments impact upon the cultivated land, it is due to the change of the farmers’ land use behavior, including the farmers’ land use pattern, land use degree and land input intensity. Accordingly, there will be varying degrees of impact on the cultivated land productive capacity. Eventually, FLUB forms a “perception–response” loop between land use decision-making units and land-use units.
Specifically, temporally, the loop as named here can be expressed as: from meeting the food demand for basic surviving issue → demand for profit (on the basis of solving the basic surviving needs) → demand for profit maximization. Correspondingly, the farmers’ land use target has been shifting from maximization of grain output → optimization of grain output and profit → maximization of profit. Profit and profit maximization can also be partially overlapped with basic self-sufficiency. However, the described logic helps to underline the tremendous changes which have taken place the last decades. In the stage of maximization of grain output, there is only Type I farmer, whose income completely comes from farming. They are pure farmers. In the second stage, Type II farmer appears, who has concurrent off-farm employment, but farming is still the major income source. In the third stage, the Type III farmer arises, who has a concurrent off-farm employment and off-farm income becomes the major income source. Spatially, at different distances from the central city, farmers’ land use targets will be distinct, therefore, the farmer types will be a variation in space (see Figure 2).
Finally, along with the change in land use behavior, a series of variation in the SQ will inevitably be caused [51,52]. SQ will present different evolution trends in time and different distribution characteristics in space. Among them, the land use pattern of farmers is mainly reflected by the choice of planting structure, which would affect the soil fertility level and the nutrients cycling in the agricultural ecosystem. The difference in the nutrient cycle between different crops would lead to changes in the balance of nutrients in the soil such as nitrogen (N), phosphorus (P), and potassium (K) required by plants. Land use degree is mainly represented by the degree of the disturbance on SQ by human activity. The increase of land use degree means the raise of soil nutrient consumption. If no corresponding measures are taken, it will lead to nutrient loss and other forms of land degradation. The impact of land input intensity on the SQ is the most direct. Reasonable land input is conducive to the supplement and accumulation of the corresponding soil nutrients, thereby improving the contents of soil nutrient. On the contrary, unreasonable land input will result in soil compaction, salinization, and other damage to the SQ.
3. Materials and Mixed Methods Approach
3.1. Study Sites
As Figure 3 shows, the Sujiatun district has been selected as the study area, which is located in peri-urban areas of a metropolitan city—Shenyang, the central city with the strongest advancement of industrialization and urbanization among the three northeastern provinces in China. The study area has the most drastic changes in land use due to the continuous extension of city boundaries and the expansion of socio-economic activities from the urban area to the rural areas [53]. SQ protection has undoubtedly become one of the most sensitive and active events [54,55]. In 2019, there are 425,000 permanent residents in the region, the urbanization rate is 73%. The GDP is 22.7 billion yuan (RMB) and the growth rate was about 6.5%, with the increasing rate of industrialization at 7.4%. The facility agriculture area has reached 43,000 ha. Ten national demonstration areas with high yields of grain crops have been established, with the grain yield stable at about 230,000 tons. Therefore, Sujiatun district, as a peri-urban area, is a typical and representative study area to explore the links between FLUB and SQ change. Furthermore, as Figure 3 shows, Linhu street (inner peri-urban), Yongle town (outer peri-urban) and Wanggangbao town (middle peri-urban) were all selected from the west plain area of Sujiatun district, which ensures that the natural conditions are similar in the three study sites. This guarantees that, under relative homogeneous natural conditions, the variation of SQ is driven by human factors.
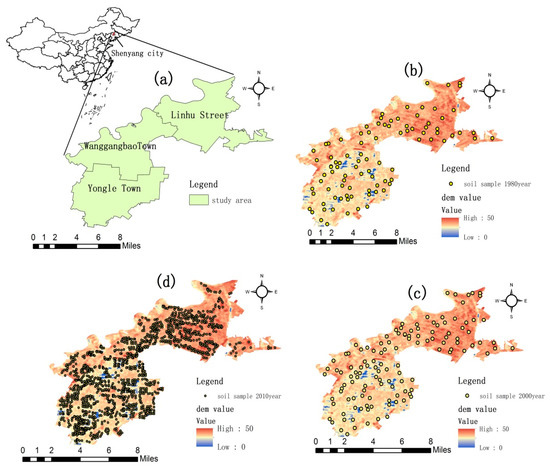
Figure 3.
The study area location in the Sujiatun district of Shenyang city (a); with a total of 119, 141 and 1437 sampling points in 1980, 2000 and 2010 (b–d), respectively.
3.2. Data Collection and Processing
3.2.1. SQ Sampling A Data and Preprocessing
The data sources mainly include the second Soil Census data in 1980, the soil data provided by the soil fertilizer station of Sujiatun District Agricultural Technology Extension Center in 2000 and the cultivated land fertility survey data in 2010. In order to ensure the comparability of the three periods of data, based on the sample plots determined in the second soil census, the original plots will be sampled in each period, and then the number of sample points will be increased according to the actual needs. The sampling time was before the beginning of growing crops in spring, and the sampling depth was 0 to 20 cm. The laboratory analysis of soil samples was carried out by the national standard method, and was consistent in 3 periods. Finally, 119, 141 and 1437 sampling points were obtained. The national standard method was used for laboratory analysis of soil samples, and the analysis methods of the three periods were consistent.
In data processing, the domain method is mainly used to identify the specific value, that is, to identify the specific value according to the multiple of standard deviation. Generally, the specific value is determined as the sample mean plus 3 times of mean square deviation, and then the maximum value of normal value is used to replace the specific value. MAPGIS module of ArcGIS 10.2 is used to convert the data of WGS84 coordinate system and Beijing 54 coordinate system, and output SHP format that can be received by ArcView, so as to get 1980, 2000 and 2010. At the same time, geostatistics software GS + (9.0) was used to analyze the spatial structure of SQ. Three kinds of semi variance models, i.e., the exponential model, spherical model and Gaussian model, were used to establish the optimal semi variance theoretical model. Kriging interpolation and other geostatistical analysis methods were used to conduct spatial analysis and draw spatial distribution maps. SPSS 20.0 and excel 2010 were used for statistical analysis.
3.2.2. Socio-Economic Datasets
The socio-economic data used in the study mainly come from two aspects, one is the survey data of farmers in the study area, the other is the statistical data provided by the Bureau of statistics of the study area. This was in order to ensure the accuracy of the study and ensure that the data of the sampling points and the farmers survey data can be from one-to-one correspondence. The specific process is as follows: Firstly, according to the spot size, crop species and yield level, the number and location of distribution points were determined and 1437 sample points were obtained. The corresponding number of farmers was 1437 as land users. The average representative area of sample points was 7.81 ha. Secondly, on the basis of the different distance from the City Center, 4–5 villages were selected in each study area, a total of 14 villages were determined in the three areas. Thirdly, 10–20 households have been randomly selected from each town. Meanwhile, in order to ensure the validity and reliability of the data, we use the form of direct dialogue with farmers. The questionnaire was designed according to the content of the theoretical framework. It includes household characteristics, sample points characteristics, sample points input and output, farmers’ land use behavior, agricultural technology training services, market survey, land policy and the family’s income and expenditure, etc. Most of the questions are closed. The number of 240 questionnaires was obtained, and 238 valid questionnaires were obtained except for the invalid questionnaires. The effective rate of the questionnaire was 99.2%. Among them, there are 79 households in Linhu street, accounting for 33.2% of the total sample size, 78 households in Wanggangbao Township, accounting for 32.8% of the total sample size, and 81 households in Yongle Township, accounting for 34.0% of the total sample size, which meet the requirements of wide coverage and sufficient quantity of the above samples.
3.3. Econometric Models
According to the theoretical framework, we can build the following econometric analysis model:
FLUB can be captured by three quantifiable independent variables (see Table 1): land use pattern (indicated by whether growing cash crops, WGCC, 1—growing cash crops, 0—otherwise), land use degree (indicated by multiple cropping index (MCI)) and land input intensity (LII). WGCC indicates whether a farmer plants grain or cash crops or both, which states different land use patterns, the main cash crop is vegetables and fruits in the study area; MCI is an abbreviation of the multiple cropping index, it equals the frequency of planting crops on the same spot in a year. This is the ratio of the production area to plot area, which reflects different degrees of land use; LII stands for the amount of input (including manure, labor or capital inputs) per unit of land, which implies the difference of land input intensity among farmers.

Table 1.
Descriptive statistics of SQ during 1980–2010.
The variation of SQ can be explained by indicators that are sensitive to the change of FLUB, including soil organic matter (OM), available nitrogen (AVN), available phosphorus (AVP), and available potassium (AVK).
The relationship between SQ and FLUB can be represented by:
Different types of farmers (for instance Type I farmer, Type II farmer and Type III farmer) have diverse land use behaviors, such as WGCC, MCI and LII. It will have distinct degrees of impact on SQ.
Bring Equations (1) and (2) into (3), we obtain Equation (4):
It should be noted that the above model is a general model of the interaction mechanism between FLUB and the change of SQ. In the specific analysis, according to data availability, we use the statistical data to analysis the variation of FLUB in the temporal perspective. The soil sampling and the interviews are applied to clarify the spatial difference of FLUB and the econometric models. SPSS20.0 software was used to analyze the econometric models.
4. Results and Discussion
4.1. The Spatial and Temporal Variation of SQ in the Metropolitan Suburbs
4.1.1. The Spatial-Temporal Variation of OM
Over the past 30 years, the OM content has changed a lot, showing a general trend of decreasing. It declined from 30.88 g/kg in 1980 to 20.07 g/kg in 2010 (see Table 1 and Table 2, Figure 4 and Figures S1 and S2). According to index grade of SQ in study (see Table 2), it is determined by the index standard grade the Second National Soil Survey, the requirements of local planting system and laboratory analysis results of soil samples in 1980, 2000 and 2010. In 1980, OM was mainly featured as Grade II (25–30 g/kg) and Grade III (20–25 g/kg), accounting for 42.8% and 25.8% of the total area, respectively. By 2000, it was still dominated by Grades II and III, accounting for 49.0% and 47.3%. Compared with 1980, OM showed a declining trend (see Table 1 and Table 2). Spatially, the decline range in most areas was between 0–5 g/kg. However, in the southern part of Yongle town, which is the farthest from the city center, there was even a small increase of OM by 0–5 g/kg. In 2010, OM continued to decline to Grade III, which accounted for 84.1%. Compared with 2000, OM in Linhu street and Wanggangbao town generally fell between 0–5 g/kg, while OM in Yongle town increased by 0–5 g/kg. When comparing with 1980, OM in Linhu street and north Wanggangbao town decreased between 5–10 g/kg. However, in the central and southern part of Yongle town, OM raised by 0–5 g/kg (see Figure 4).
Table 2.
Grade of SQ during 1980–2010.
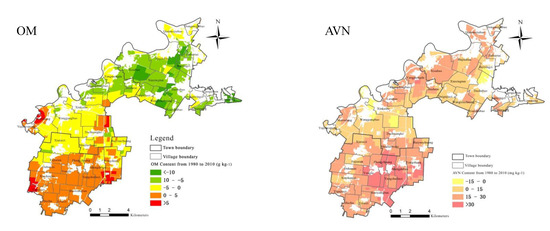
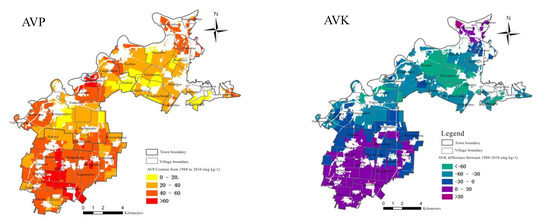
Figure 4.
The spatial variation of SQ from 1980 to 2010.
4.1.2. The Spatial-Temporal Variation of AVN
During 1980–2010, the overall AVN content showed a trend of first decreasing and then sharply increasing, it slightly declined from 109.38 mg/kg in 1980 to 108.36 mg/kg in 2000 and then rose to 126.80 mg/kg in 2010 (see Table 1 and Table 2, Figure 4 and Figures S1 and S2). In 1980, AVN mainly distributed in Grade III (120–135 mg/kg), Grade IV (105–120 mg/kg) and Grade V (90–105 mg/kg), accounting for 13.6%, 39.1% and 47.3% of the total area, respectively. By 2000, AVN is mainly characterized as Grades IV and V, accounting for a total area of 57.0% and 37.3%, respectively. Compared with 1980, AVN content in the study area generally rises by 0–15 mg/kg in Linhu street, the eastern Wanggangbao town, and the central and middle Yongle town. Area with a decline of AVN was located in the middle and western Wanggangbao town. In the western Wanggangbao, the decrease of AVN was more than 15 mg/kg. By 2010, AVN was mainly dominated by Grades III (60.1%) and IV (23.6%). Compared with 2000, the AVN content in most areas rose by 0–15 mg/kg and by 15–30 mg/kg. It increased more in Wanggangbao town and Yongle town than in the Linhu street. Compared with 1980, the increase of AVN ranged from 0–15 mg/kg to 15–30 mg/kg in Yongle town. Within Yongle town, it rose by 15–30 mg/kg in the north, and 0–15 mg/kg in the central and southern parts. The increase of AVN in some areas of Yongle town even exceeded 30 mg/kg.
4.1.3. The Spatial-Temporal Variation of AVP
During 1980–2010, the content of AVP has an overall increasing trend, but the increasing range is different (see Table 1 and Table 2, Figure 4 and Figures S1 and S2). In 1980, the AVP was distributed in Grade VI, accounting for 91.1% (10226 hm2). By 2000, the AVP was mainly concentrated in Grade III (40–50 mg/kg), Grade IV (30–40 mg/kg) Grade V (20–30 mg/kg) and Grade VI, accounting for 16.4%, 21.4%, 22.0% and 35.2%, respectively. Compared with 1980, the average increase of AVP content in most regions was 0–20 mg/kg, while the increase in middle/west of Yongle town was 20–40 mg/kg. By 2010, it mainly concentrated at Grade I, II and III, accounting for 24.5%, 26.2%, and 28.2%, respectively. Compared with 2000, the increase of AVP in most areas was 20–40 mg/kg. Compared with 1980, the increase of AVP in Linhu street and Wanggangbao town was 20–40 mg/kg, while the increase in Yongle town was 40–60 mg/kg from 1980 to 2010. In some area in the central part, the increase of AVP was ever over 60 mg/kg.
4.1.4. The Spatial-Temporal Variation of AVK
Between 1980 and 2010, the content of AVP decreased gradually, but the rate of decrease differed in time. It declined to 103.62 mg/kg in 2000, then it increased rapidly by 2010, with an average value grown by 30.67 mg/kg (see Table 1 and Table 2, Figure 4 and Figures S1 and S2). The AVK was mainly distributed in Grade II and Grade III in 1980, accounting for 34.7% and 33.5%, respectively. In 2000, the AVK was mainly concentrated in Grade V (100–120 mg/kg) and Grade VI (<100 mg/kg), accounting for 47.5% and 44.9%. Compared with 1980, the AVK in soil decreased significantly. Among which, the decline range of Linhu street and most areas of Wanggangbao town was more than 60 mg/kg, the decline range of southern Wanggangbao town and northern Yongle town was between 30–60 mg/kg, and the decline range of central/southern Yongle township was between 0–30 mg/kg. However, in 2010, the dominant type is Grade III (3657 hm2) and Grade IV (3670 hm2). Compared with 2000, the increase range in Linhu street and the north Wanggangbao town is 0–30 mg/kg, while in most area of Yongle town the increase range is more than 30 mg/kg.
Based on the above geostatistical analysis, the spatial-temporal variation of SQ is significant. The OM content tends to decrease, the AVN and AVP contents gradually increase, while the AVP content decreases first and then increases over time. Among them, the rapid decline of OM content is one of the main reasons leading to the degradation of SQ, which will directly affect the productivity of cultivated land and adversely affect the sustainable development of PUA. Meanwhile, the closer to the city center, the greater the decrease of OM content is. It may be due to the fact that farmers are more likely to set land aside due to continuous urban sprawl, non-agricultural employment opportunities and uncertainties to keep the farmland for next years. That might reduce the interest of the farmers to maintain or increase OM. The farther away from the urban area, the greater the increase of the available nutrient content (AVN, ANP and AVK) is. This can be linked to the fact that production intensities increase when approaching the city—more in the direction of “exploiting” the soil via horticulture, high-value crops and narrow rotations. This is obviously different from the change of SQ caused by natural factors [7,56], so the in-depth research from the perspective of FLUB is necessary.
4.2. FLUB and SQ: the Driving Mechanism
4.2.1. Temporal Variation of FLUB
Land Use Pattern (WGCC)
Figure 5 shows the change of grain (maize and rice) and cash crop (vegetables and fruits) production area in Sujiatun district from 1980 to 2010. As can be seen, the grain production area has declined from 32,457 hm2 in 1980 to 25,812 hm2 in 2010, with a total decrease of 6645 hm2 and an average annual decrease of 221.5 hm2 within the 30 years. In particular, since 2000, it has been declining at an even faster rate. By 2003, it was basically the same as that of high-value crops. The change of vegetables planting area has experienced three stages. In the first stage (1980–1990), it increased slowly, from 2271 hm2 in 1980 to 3271 hm2 in 1990. In the second stage (1991–1999), the vegetable planting area increased rapidly from 4030 hm2 in 1992 to 8230 hm2 in 2000, with an average annual growth of 420 hm2. In the third stage (2001–2010), the vegetable planting area fluctuated. It first decreased slightly, then increased slowly, and kept at a high level as a whole. The result shows that the cash crop production area is gradually increasing, especially since 2000. The main reason is that the demand of urban residents for agricultural products is rising by the rapid urbanization and a large number of labor transfer.
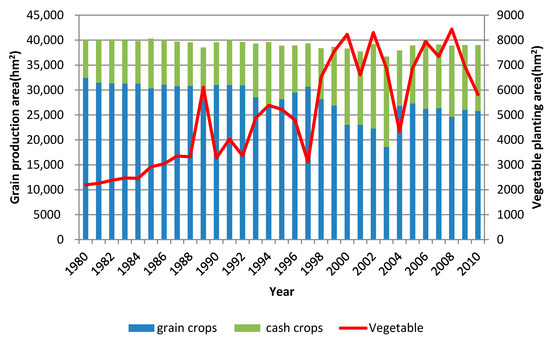
Figure 5.
The change of crop production area during 1980–2010.
Land Use Degree (MCI)
As Figure 6 shows, the MCI has been increasing during 1980–2010, presenting an increasing degree of land use overall. It may roughly be divided into three stages. In the first stage (1980–1990), the MCI increased from 100.23% to 102.96%, during which it experienced a wave in 1986 at 105.04% and a trough in 1989 at 100.16%. The second stage was from 1991 to 2000, during which the MCI was in a relatively stable status, rising from 104.41% in 1991 to 104.67% in 2000. The third stage was from 2001 to 2010, when the MCI rose sharply and then steadily. It rose from 103.42% in 2000 to 111.88% in 2010, and experienced a trough (101.27% in 2003) and a peak (112.37% in 2006). From the beginning of this century, the MCI increased significantly. In the early stage of reform and opening up, due to the limitation of climate conditions in the study area, only one crop of corn or rice can be planted. Therefore, the MCI is mainly 100%. However, with the improvement of agricultural production technology and the marketization reform of agricultural products, farmers began to plant high-value crops such as vegetables and fruits, which greatly improved the multiple cropping index of land.
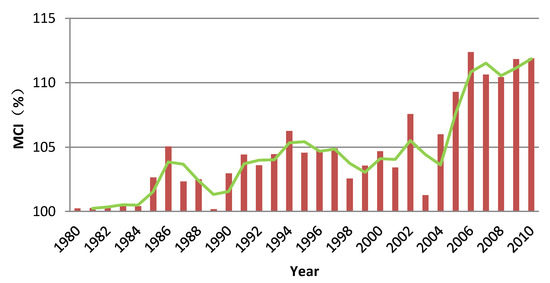
Figure 6.
The change of multiple cropping index (MCI) in Sujiatun district during 1980–2010.
Land Input Intensity (LII)
From 1980–2010, the inputs of fertilizers present the characteristics of decrease in fluctuation (see Figure 7). The input of manure per unit arable land decreased during 1980–2010 as a whole, it is from 29.8 t/hm2 in 1980 to 14.9 t/hm2 in 2010, with a decrease of nearly 50%. However, it shows that the decrease of manure input is gradually slowing down from 2000. The major chemical fertilizers which farmers applied were mainly nitrogenous and phosphate fertilizers. The compound fertilizers applied has been gradually increasing since 2000.
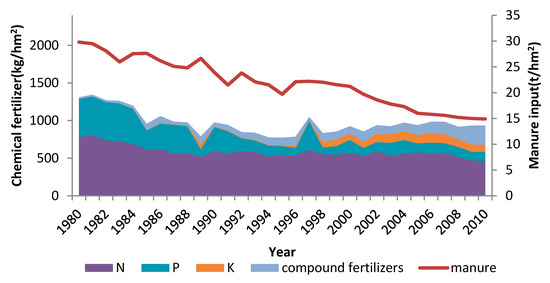
Figure 7.
The change of fertilizers input in Sujiatun district during 1980–2010.
Based on the above statistical analysis, we can clearly see that the production area of grain crops with low intensity and profits is gradually decreasing, and the cash crops with high intensity and profits is gradually increasing. In addition, farmers began to use chemical fertilizers instead of manure, and the application methods of chemical fertilizers gradually became more reasonable. In the early days of China’s reform and opening up, the labor market, agricultural product market and means of production market have a low degree of development. In order to meet the family’s food demand, grain crops are mainly planted. The fertilizer input is mainly manure because of more labor-time invested in it. With the deepening reform of the production factors market, the opportunity cost of labor gradually rises, farmers also gradually change the traditional way of land investment. The input of assets is increased, such as the substitution of chemical fertilizer for manure. Due to the extensive application of chemical fertilizers, the problems of soil pollution and soil nutrient imbalance are becoming increasingly serious, which are urgent to be solved in the sustainable development of agriculture. With the continuous promotion of agricultural science and technology, farmers gradually realize the importance of scientific fertilization [57,58], which not only saves costs, but also ensures the productivity of arable land. As a result, the input of compound fertilizer is gradually increasing.
4.2.2. Spatial Difference of FLUB in 2010
Land Use Pattern (WGCC)
Figure 8 presents the spatial difference in land use pattern. We find that there are obvious differences in crop selection behavior. The selection of crops shifted from the single crop to three types, i.e., grain crop only, both grain and cash crops, and cash crop only. Moreover, with the increase of distance, the planting area of grain crop was gradually decreasing, while that of cash crops was gradually increasing. Among the farmers who grew grain crop, there were 74 farmers (93.7% of the samples in this town) in Linhu street, 23 farmers (29.5%) in Wanggangbao town, and 2 farmers (2.5%) in Yongle town. The farmer who plant cash crops is just the opposite
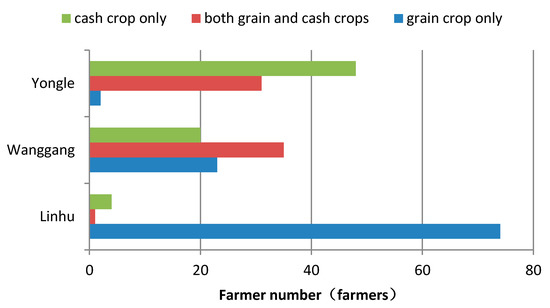
Figure 8.
Farmers’ land use pattern in Sujiatun district in 2010.
Land Use Degree (MCI)
The MCI are also spatially different among the three regions (see Figure 9). A total of 74 farmers (93.7%) of the samples in Linhu street were with an MCI of 1. It followed by 39 farmers (50.0%) in Wanggangbao town and 2 farmers (2.5%) in Yongle township. But Yongle town had the highest proportion of samples with an MCI of 2.0–2.5 and 2.5–3.0, accounting for 14.8% and 16.0% of the total samples in this area, respectively.
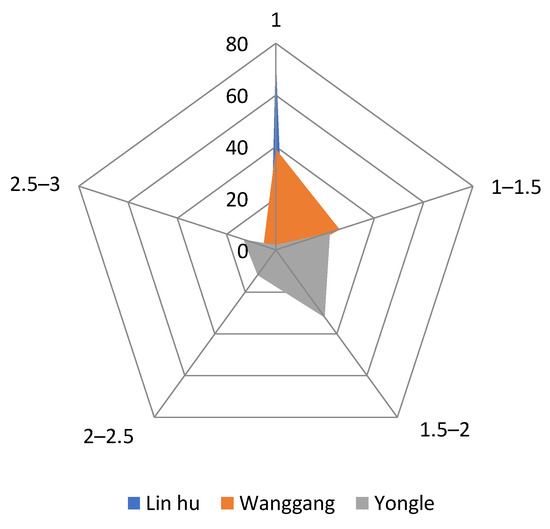
Figure 9.
Land use degree in the study sites in 2010.
Land Input Intensity (LII)
The LII mainly includes labor and capital inputs (see Figure 10). In terms of labor input, with the increase of distance from the city center, the number of family laborers increases. For example, the per mu (Mu is a unit of area in China, 1 ha. = 15 mu) input in Linhu street is mainly concentrated in 0–10 working days/mu, while that in Yongle town is between 10–20 working days/mu and above 30 working days/mu. From the aspect of capital input, there is a similar spatial differentiation trend. With the increase of land input intensity, the proportion of farmers is decreasing in Linhu street and increasing in Yongle town.
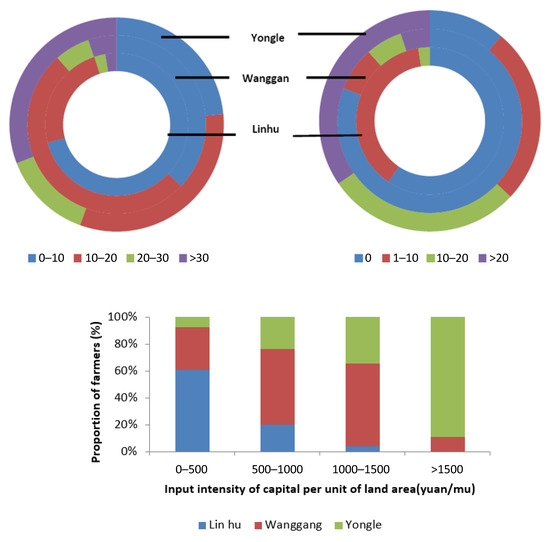
Figure 10.
Land input in the study sites in 2010.
From the above analysis, it can be seen that with the continuous acceleration of industrialization and urbanization, there are obvious differences in land use target and types of farmers in the study area. Spatially, Linhu street (inner suburb) was dominated by the Type III farmers who mainly grew time-saving and labor-saving corn and with a low land use degree and land input intensity. It is mainly Type I farmers in Yongle town (outer suburb) who planted (greenhouse) vegetables and thus with the highest land use degree and land input intensity. Type II farmers who mainly planted corn and vegetables dominate the Wanggangbao town (middle suburb), presenting a relative high land use degree and land input intensity. These distinct features will inevitably have different effects on the change of SQ.
4.2.3. The Response of SQ to Farmer Land Use Behavior: An Empirical Analysis FLUB
In order to analyze the impact mechanism of FLUB on the SQ, through the comparison of different model estimation forms, the multiple linear regression model is finally adopted. The analysis results are shown in Table 3. From the empirical results, it can be seen that farmers’ land use pattern, land use degree and land input intensity have different influence on the change of SQ.
Table 3.
Model estimate results.
The Response of SQ to Type III Farmers in the Inner Suburb
As Table 3 shows, whether growing a cash crop (WGCC) and land input intensity (LII) have significant and positive impacts on the contents of OM and AVP. The multiple cropping index (MCI) has negative effects on the contents of AVN, AVP and AVK. With an increase of MCI by one unit, the AVN, AVP and AVK would decrease by 11.496 mg/kg, 44.078 mg/kg and 15.469 mg/kg, holding other conditions unchanged. In terms of the degree of influence, the MCI is the most important factor affecting the SQ. The degree of influence on AVN can be ordered as: MCI > LII. Similarly, the order for AVP is: MCI> WGCC.
Since the farmers in Linhu Street are closest to the central city, there are more non-agricultural employment opportunities. Due to the high opportunity cost of labor, the enthusiasm for agricultural production is not high, so they mainly grow grain crops which are time/effort-saving and neglect management of arable land, they usually use chemical fertilizers rather than manure, which leads to the extensive land use. The OM has obviously declined. It will have a negative impact on the quality protection of SQ in this area. Therefore, the question of how to improve farmers’ planting enthusiasm and reasonably guide farmers’ fertilization behavior is very important for the sustainable development of the agriculture.
The Response of SQ to Type II Farmer in the Middle Suburb
Whether growing a cash crop (WGCC) has a significant and positive impact on the content of OM, AVN, AVP and AVK, with other conditions unchanged, they are 4.799, 7.454, 100.170 and 61.205 mg/kg higher, respectively, on plots planting cash crops than those planting other crops. From the perspective of influence degree, the content of OM and AVN is mainly affected by WGCC. The order of influence degree of AVP is: WGCC > multiple cropping index (MCI) > land input intensity (LII), and the order for AVK is: WGCC > LII. So WGCC is the most important factor affecting the SQ in Wanggangbao town.
Farmers in this region mainly grow both cash and grain crops. As such, their land use target is dual. They need to take full advantage of farmer labor and make full use of capital. They also need to ensure the satisfaction of basic consuming of family members, and pursue the maximum profit of products on this basis. The change of land use is manifested in the improvement of intensive degree, the continuous adjustment of planting structure, and the swing of farmers’ land use pattern between cash and grain crops. Therefore, the WGCC is the most important factor affecting the SQ. It is the bidirectional impact on soil quality, in which the direction of development depends on the implementation of government management policies. When the government policy is implemented in place, farmers will make reasonable investment and management of land, which is conducive to the improvement of the quality of cultivated land. On the contrary, once farmers consider that “farming is not cost-effective”, it may be followed by the decline of the SQ. So, the government needs to reasonably guide farmers to make a choice between cash crops and grain crops according to the actual situation of land use target.
The Response of SQ to Type I Farmer in the Outer Suburb
Land input intensity (LII) has significant and positive influence on AVN, AVP and AVK. With an additional 1 yuan/mu of land input, the content of AVN, AVP and AVK would increase by 0.007, 0.025 and 0.037 mg/kg, respectively. From the point of degree of influence, AVN and AVK are mainly influenced by LII. Whereas the effect on AVP can be sorted as: LII > multiple cropping index (MCI) > whether growing a cash crop (WGCC). As can be seen, LII is the most important factor affecting the SQ in Yongle town. The reason is that farmers in this region (Type I farmer) mainly plant cash crops, thus the impact of WGCC on the change of SQ is reduced. Therefore, LII becomes the most important factor affecting SQ variation.
The development of industrialization and urbanization provides a good agricultural products market for Type I farmers who grow cash crops in the region. Due to the moderate distance to the city center, the opportunity cost of farmers’ employment in non-farm industry is relatively high. Compared with working outside of town, the income from planting cash crops is higher. In order to maximize profit, Type I farmers would increase LII, which in turn would improve the SQ in Yongle town. However, if the number of land management does not reach a certain degree, it is difficult to fully reflect the scale economy of land. So moderately expanding the scale of land management will become the direction of sustainable development of agriculture in the area.
5. Conclusions
This study was inspired primarily by our interest in detecting whether the law of spatial-temporal evolution of SQ is related to FLUB and how the influence mechanism is. We have done so by conducting a set of careful tests based on a conceptual framework. Our results contribute to the debates about the effects of FLUB on SQ in PUA.
We find that during 1980 and 2010, SQ shows a trend of phasic variation in the study area. There is also clear difference as the distance from the city center varies. We further find that, with the various adjustment of farmers’ land use target, the WGCC, MCI and LII are obvious diversity in time and space. Additionally, there are significant distinct in terms of the direction, significance level and degree of their effects on SQ. All these evidences verify the proposition that FLUB indeed has a conditional effect on SQ.
Four important policy implications can be advanced on the basis of the findings. Firstly, by increasing the economic stimulation and improving the comparative benefit of agricultural production, farmers will have stronger willingness to protect the SQ. Secondly, a stable land use contract is one of the fundamental driving forces to maintain SQ, which can help farmers form a reasonable expectation benefit from the arable land. Thirdly, the government should actively guide the transfer of arable land rights and promote the appropriate scale operation of land. In particular, it is possible for a Type I farmer to achieve it. Fourthly, optimizing the reasonable layout of the agricultural industry is very important to realize the development of urban agriculture in metropolitan suburbs, which can achieve the coordinated development of ecological services, landscape culture and tourism functions. In brief, they are valid in the sustainable development of peri-urban areas of china. They also have successful experiences for other countries to go by the sustainability of new forms of agriculture in urban and peri-urban areas.
This study also has some limitations, which might open up avenues for future research using either better datasets or different case studies. First, there is no in-depth empirical analysis of the perception process of farmers to SQ due to the limited length of the paper. Second, we only obtained three datasets in 1980, 2000 and 2010, which makes it impossible to use an econometric model to analyze the impact of FLUB on SQ from the time dimension. Meanwhile, due to the adjustment of the administrative boundaries in three regions, the statistical caliber will change in time. Therefore, the average value of the socio-economic data in the study area is adopted. Despite these limitations, this paper is a contextual attempt on the study of drive mechanisms of soil quality changes. We hope to establish a bridge between soil science and social science in order to expand the scope of existing research. In addition, the peri-urban areas are a focus of the government and researchers in the rapid process of industrialization and urbanization in China and global studies [59,60,61,62]. These policy implications are of great significance to the protection of SQ in the region and the sustainability of PUA.
Supplementary Materials
The following are available online at https://www.mdpi.com/2073-445X/10/2/171/s1, Figure S1: The spatial variation of SQ from1980 to 2000; Figure S2: The spatial variation of SQ from 2000 to 2010.
Author Contributions
H.L. and J.L. conceived and designed the experiments; H.L. collected and analyzed the data; J.L. and H.L. wrote the paper. All authors have read and agreed to the published version of the manuscript.
Funding
This research was funded by the National Key R&D Project (2016YFD0300210); the National Natural Science Foundation of China (72074153, 71703106 and 71773054), Humanities and Social Science Foundation of the Ministry of Education of China (18YJC790241), Social Science Planning Foundation of Liaoning Province (L18BJY006).
Institutional Review Board Statement
Not applicable.
Informed Consent Statement
Not applicable.
Data Availability Statement
The data presented in this study are available on request from the corresponding author. The data are not publicly available due to privacy restrictions.
Conflicts of Interest
The authors declare no conflict of interest.
Glossary
| Abbreviation | Definition |
| CLQ | Cultivated land quality |
| FLUB | Farmers’ land use behavior |
| OM | Organic matter |
| AVN | Available nitrogen |
| AVP | Available phosphorus |
| AVK | Available potassium |
| PUA | Peri-urban agriculture |
| WGCC | Whether grow cash crop |
| MCI | Multiple cropping index |
| LII | Land input intensity |
| Type I farmer | Whose income mainly comes from farming |
| Type II farmer | Who has concurrent off-farm employment, but farming is still the major income source |
| Type III farmer | Who has a concurrent off-farm employment, but off-farm income becomes the major income source |
| N | Nitrogen |
| P | phosphorus |
| K | potassium |
References
- Wu, Y.; Shan, L.; Guo, Z. Cultivated Land Protection Policies in China Facing 2030: Dynamic Balance System Versus Basic Farmland Zoning. Habitat Int. 2017, 69, 126–138. [Google Scholar] [CrossRef]
- Zhang, W.; Wang, W.; Li, X. Economic Development and Farmland Protection: An Assessment of Rewarded Land Conversion Quotas Trading in Zhejiang, China. Land Use Policy 2014, 38, 467–476. [Google Scholar] [CrossRef]
- Li, M. The Effect of Land Use Regulations on Farmland Protection and Non-Agricultural Land Conversions in China. Aust. J. Agric. Resour. Econ. 2019, 63, 643–667. [Google Scholar] [CrossRef]
- Huang, Z.; Du, X.; Castillo, C.S.Z. How Does Urbanization Affect Farmland Protection? Evidence from China. Resour. Conserv. Recycl. 2019, 145, 139–147. [Google Scholar] [CrossRef]
- Cheng, L.; Jiang, P.; Chen, W. Farmland Protection Policies and Rapid Urbanization in China: A Case Study for Changzhou City. Land Use Policy 2015, 48, 552–566. [Google Scholar]
- Zhong, T.; Mitchell, B.; Scott, S. Growing Centralization in China’s Farmland Protection Policy in Response to Policy Failure and Related Upward-Extending Unwillingness to Protect Farmland Since 1978. Environ. Plan. C—Politics Space 2017, 35, 1075–1097. [Google Scholar] [CrossRef]
- Wu, K.; Han, C.; Sun, Z. Spatial and Temporal Distribution of Soil Fertility as Affected by Urbanization. Chin. J. Soil Sci. 2007, 38, 242–246. [Google Scholar]
- Shi, Y.; Duan, W.; Fleskens, L.; Li, M.; Hao, J. Study on Evaluation of Regional Cultivated Land Quality based on Resource-Asset-Capital Attributes and Its Spatial Mechanism. Appl. Geogr. 2020, 125, 102284. [Google Scholar] [CrossRef]
- Brunori, E.; Salvati, L.; Antogiovanni, A.; Biasi, R. Worrying about ‘Vertical Landscapes’: Terraced Olive Groves and Ecosystem Services in Marginal Land in Central Italy. Sustainability 2018, 10, 1164. [Google Scholar] [CrossRef]
- Tang, H.; Wu, W.; Yu, Q. Agricultural Land System Research and Its Key Scientific Problems. Sci. Agric. Sin. 2015, 48, 900–910. [Google Scholar]
- Kong, X.; Li, C.; Liang, Y. Arable Land Productivity and its Elastic Loss on the Basis of Farm Household Land Use Behavior. Prog. Geogr. 2010, 29, 869–877. [Google Scholar]
- Cai, Y.; Yu, L. Rural Household Participation in and Satisfaction with Compensation Programs Targeting Farmland Preservation in China. J. Clean. Prod. 2018, 205, 1148–1161. [Google Scholar] [CrossRef]
- Zhong, T.; Huang, X. Review on the Researches of Land Use Change at Farm Household Level. J. Nat. Resour. 2007, 22, 341–352. [Google Scholar]
- Kong, X.; Liu, L.; Qin, J. Theory and Methodology for the Construction of Arable Land Quality Evaluation System Based on Household Behaviors. Prog. Geogr. 2007, 26, 75–85. [Google Scholar]
- Chen, M.; Wu, Y.; Liu, T. Research and Prospect of Farmland Protection in China Based on Farmers’ Behavior. J. Nanjing Agric. Univ. 2012, 12, 66–72. [Google Scholar]
- Silva, A.M.M.; Ramos, M.L.G. Soil Quality Indicators under Management Systems in a Quilombola Community the Brazilian Cerrado. Sci. Agric. 2019, 76, 518–526. [Google Scholar] [CrossRef]
- Sefati, Z.; Khalilimoghadam, B.; Nadian, H. Assessing Urban Soil Quality by Improving the Method for Soil Environmental Quality Evaluation in a Saline Groundwater Area of Iran. Catena 2019, 173, 471–480. [Google Scholar] [CrossRef]
- Romano-Armada, N.; Amoroso, M.J.; Rajal, V.B. Construction of a Combined Soil Quality Indicator to Assess the Effect of Glyphosate Application. Sci. Total Environ. 2019, 682, 639–649. [Google Scholar] [CrossRef]
- Ratcliffe, S.; Bosman, B.; Carnol, M. Spatial and Temporal Variability of Biological Indicators of Soil Quality in Two Forest Catchments in Belgium. Appl. Soil Ecol. 2018, 126, 148–159. [Google Scholar] [CrossRef]
- Tang, L.; Hayashi, K.; Ohigashi, K. Developing Characterization Factors to Quantify Management Impacts on Soil Quality of Paddy Fields within Life Cycle Assessment. J. Clean. Prod. 2019, 238, 1–10. [Google Scholar] [CrossRef]
- Van Leeuwen, J.P.; Creamer, R.E.; Cluzeau, D. Modeling of Soil Functions for Assessing Soil Quality: Soil Biodiversity and Habitat Provisioning. Front. Environ. Sci. 2019, 7, 47–52. [Google Scholar] [CrossRef]
- Lyu, K.; Chen, K.; Zhang, H. Relationship between Land Tenure and Soil Quality: Evidence from China’s Soil Fertility Analysis. Land Use Policy 2019, 80, 345–361. [Google Scholar] [CrossRef]
- Ruf, T.; Makselon, J.; Udelhoven, T. Soil Quality Indicator Response to Land-Use Change from Annual to Perennial Bioenergy Cropping Systems in Germany. Glob. Chang. Biol. Bioenergy 2018, 10, 444–459. [Google Scholar] [CrossRef]
- Viaud, V.; Santillan-Carvantes, P.; Akkal-Corfini, N. Landscape-Scale Analysis of Cropping System Effects on Soil Quality in a Context of Crop-Livestock Farming. Agric. Ecosyst. Environ. 2018, 265, 166–177. [Google Scholar] [CrossRef]
- Nilsson, P. The Role of Land Use Consolidation in Improving Crop Yields among Farm Households in Rwanda. J. Dev. Stud. 2019, 55, 1726–1740. [Google Scholar] [CrossRef]
- Dib, J.B.; Krishna, V.V.; Alamsyah, Z. Land-Use Change and Livelihoods of Non-Farm Households: The Role of Income from Employment in Oil Palm and Rubber in Rural Indonesia. Land Use Policy 2018, 76, 828–838. [Google Scholar] [CrossRef]
- Xu, D.; Guo, S.; Xie, F. The Impact of Rural Laborer Migration and Household Structure on Household Land Use Arrangements in Mountainous Areas of Sichuan Province, China. Habitat Int. 2017, 70, 72–80. [Google Scholar] [CrossRef]
- Hayes, T.; Murtinho, F.; Wolff, H. The Impact of Payments for Environmental Services on Communal Lands: An Analysis of the Factors Driving Household Land-Use Behavior in Ecuador. World Dev. 2017, 93, 427–446. [Google Scholar] [CrossRef]
- Tian, Q.; Brown, D.G.; Zheng, L. The Role of Cross-Scale Social and Environmental Contexts in Household-Level Land-Use Decisions, Poyang Lake Region, China. Ann. Assoc. Am. Geogr. 2015, 105, 1240–1259. [Google Scholar] [CrossRef]
- Luo, X.; Feng, S.; Reidsma, P. Agricultural and Environmental Policy Response Simulation Based on the Household Bioeconomy Model—A Case Study of the Taihu Lake Basin. Chin. Rural Econ. 2013, 11, 72–85. [Google Scholar]
- Naab, J.B.; Mahama, G.Y.; Yahaya, I. Conservation Agriculture Improves Soil Quality, Crop Yield, and Incomes of Smallholder Farmers in North Western Ghana. Front. Plant Sci. 2017, 8, 1–12. [Google Scholar] [CrossRef]
- Wang, Y.; Bilsborrow, R.E.; Zhang, Q. Effects of Payment for Ecosystem Services and Agricultural Subsidy Programs on Rural Household Land Use Decisions in China: Synergy or Trade-Off? Land Use Policy 2019, 81, 785–801. [Google Scholar] [CrossRef]
- Trung, T.N.; Bauer, S.; Grote, U. Does Land Tenure Security Promote Manure Use by Farm Households in Vietnam? Sustainability 2016, 8, 1–9. [Google Scholar]
- Wang, C.; Wang, L.; Jiang, F. Differentiation of Rural Households’ Consciousness in Land Use Activities: A Case from Bailin Village, Shapingba District of Chongqing Municipality, China. Chin. Geogr. Sci. 2015, 25, 124–136. [Google Scholar] [CrossRef]
- Song, J.; Wang, R. Measuring the Spatial Dimension of Automobile Ownership and its Associations with Household Characteristics and Land Use Patterns: A Case Study in Three Counties, South Florida (USA). Sustainability 2017, 9, 558. [Google Scholar] [CrossRef]
- Ahimbisibwe, V.; Auch, E.; Groeneveld, J. Drivers of Household Decision-Making on Land-Use Transformation: An Example of Woodlot Establishment in Masindi District, Uganda. Forests 2019, 10, 619. [Google Scholar] [CrossRef]
- Sakane, N.; Van Wijk, M.T.; Langensiepen, M. A Quantitative Model for Understanding and Exploring Land Use Decisions by Smallholder Agrowetland Households in Rural Areas of East Africa. Agric. Ecosyst. Environ. 2014, 197, 159–173. [Google Scholar] [CrossRef]
- Zimmerman, E.K.; Tyndall, J.C.; Schulte, L.A. Farmer and Farmland Owner Views on Spatial Targeting for Soil Conservation and Water Quality. Water Resour. Res. 2019, 55, 3796–3814. [Google Scholar] [CrossRef]
- Kuria, A.W.; Barrios, E.; Pagella, T. Farmers’ Knowledge of Soil Quality Indicators along a Land Degradation Gradient in Rwanda. Geoderma Reg. 2019, 16, 1–10. [Google Scholar] [CrossRef]
- Bai, Z.; Caspari, T.; Gonzalez, M.R. Effects of Agricultural Management Practices On Soil Quality: A Review of Long-Term Experiments for Europe and China. Agric. Ecosyst. Environ. 2018, 265, 1–7. [Google Scholar] [CrossRef]
- Omari, R.A.; Bellingrath-Kimura, S.D.; Addo, E.S. Exploring Farmers’ Indigenous Knowledge of Soil Quality and Fertility Management Practices in Selected Farming Communities of the Guinea Savannah Agro-Ecological Zone of Ghana. Sustainability 2018, 10, 1034. [Google Scholar]
- Liu, H.; Wang, Q.; Wu, Y. Research on Farmers’ Cognition Degree, Behavioral Decision Response and Influencing Mechanism in Farmland Quality Protection. China Land Sci. 2018, 32, 52–58. [Google Scholar]
- Tan, S.; Tan, Z.; Huang, X. Farm Households’ Behaviors and Soil Degradation in China: From the View of the New Institutional Economics. Soils 2004, 36, 141–144. [Google Scholar]
- Ouyang, J.; Song, C.; Yu, Z. Land Use Choice and Environmental Impact of Different Types of Farmers in Huang-Huaihai plain—A Case Study of Quzhou County, Hebei Province. J. Nat. Resour. 2004, 19, 1–11. [Google Scholar]
- Li, T.; Kong, X.B.; Liang, Y. Found the Research Frame on the Arable Land Evaluation Based On Household Decision Behavior. J. China Agric. Univ. 2010, 15, 101–107. [Google Scholar]
- Drobnik, T.; Greiner, L.; Keller, A. Soil Quality Indicators—From Soil Functions to Ecosystem Services. Ecol. Indic. 2018, 94, 151–169. [Google Scholar] [CrossRef]
- Bunemann, E.K.; Bongiorno, G.; Bai, Z. Soil Quality—A Critical Review. Soil Biol. Biochem. 2018, 120, 105–125. [Google Scholar] [CrossRef]
- Eagle, A.J.; Eagle, D.E.; Stobbe, T.E. Farmland Protection and Agricultural Land Values at the Urban-Rural Fringe: British Columbia’s Agricultural Land Reserve. Am. J. Agric. Econ. 2015, 97, 282–298. [Google Scholar] [CrossRef]
- Cary, J.W.; Wilkinson, R.L. Perceived Profitability and Farmers ‘Conservation Behaviour. J. Agric. Econ. 1997, 48, 13–21. [Google Scholar] [CrossRef]
- Willock, J.; Deary, I.J.; Edwards-Jones, G.; Gibson, G.J.; McGregor, M.J.; Sutherland, A.; Barry, D.J.; Morgan, O.; Grieve, R. The Role of Attitudes and Objectives in Farmer Decision Making: Business and Environmentally-Oriented Behaviour in Scotland. J. Agric. Econ. 1999, 50, 286–303. [Google Scholar] [CrossRef]
- Mills, J.; Gaskell, P.; Ingram, J.; Dwyer, J.; Reed, M.; Short, C. Engaging Farmers in Environmental Management through a Better Understanding of Behaviour. Agric. Hum. Values 2017, 34, 283–299. [Google Scholar] [CrossRef]
- Norton, G.W.; Alwang, J. Introduction to Economics of Agricultural Development. Am. J. Agric. Econ. 1993, 2, 160–164. [Google Scholar]
- Cak, A.D.; Moran, E.F.; Figueiredo, R.D.O. Urbanization and Small Household Agricultural Land Use Choices in the Brazilian Amazon and the Role for the Water Chemistry of Small Streams. J. Land Use Sci. 2016, 11, 203–221. [Google Scholar] [CrossRef]
- Yang, Y.; Liu, Y.; Li, Y. Quantifying Spatio-Temporal Patterns of Urban Expansion in Beijing during 1985–2013 with Rural-Urban Development Transformation. Land Use Policy 2018, 74, 220–230. [Google Scholar] [CrossRef]
- Kong, X.; Zhang, B.; Wen, L. Theoretical Cognition and Research Trend of Cultivated Land Quality Based on Factor-Process-Function. China Land Sci. 2018, 32, 14–20. [Google Scholar]
- Hu, K.; Wang, S.; Li, H. Spatial Scaling Effects on Variability of Soil Organic Matter and Total Nitrogen in Suburban Beijing. Geoderma 2014, 226, 54–63. [Google Scholar] [CrossRef]
- Mette, C.M. Land Use Patterns among Small Farmer Settlers in the Northeastern Ecuadorian Amazon. Hum. Ecol. 1998, 26, 573–598. [Google Scholar]
- Pan, W.K.Y.; Walsh, S.J.; Bilsborrow, R.E.; Frizzelle, B.G.; Baquero, B. Farm Level Models of Spatial Patterns of Land Use and Land Cover Dynamics in the Ecuadorian Amazon. Agric. Ecosyst. Environ. 2004, 111, 117–138. [Google Scholar] [CrossRef]
- Dadashpoor, H.; Ahani, S. Land Tenure-related Conflicts in Peri-urban Areas: A review. Land Use Policy 2019, 85, 218–229. [Google Scholar] [CrossRef]
- Yoshida, S. Urbanization on Farmland Size and Diversified Farm Activities in Japan: An Analysis Based on the Land Parcel Database. Land 2020, 9, 315. [Google Scholar] [CrossRef]
- Calzolari, C.; Tarocco, P.; Lombardo, N. Assessing Soil Ecosystem Sservices in Urban and Peri-urban Areas: From Urban Soils Survey to Providing Support Tool for Urban Planning. Land Use Policy 2020, 99, 105037. [Google Scholar] [CrossRef]
- Torquati, B.; Giacchè, G.; Tempesta, T.; Ungaro, F. Landscapes and Services in Peri-Urban Areas and Choice of Housing Location: An Application of Discrete Choice Experiments. Land 2020, 9, 393. [Google Scholar] [CrossRef]


Publisher’s Note: MDPI stays neutral with regard to jurisdictional claims in published maps and institutional affiliations. |
© 2021 by the authors. Licensee MDPI, Basel, Switzerland. This article is an open access article distributed under the terms and conditions of the Creative Commons Attribution (CC BY) license (http://creativecommons.org/licenses/by/4.0/).