
Scale-Dependent Impacts of Urban Morphology on Commercial Distribution: A Case Study of Xi’an, China

 ,
,
Abstract
1. Introduction
- (1)
- Is the relationship between urban morphology and commercial distribution based on blocks stronger than that based on grids?
- (2)
- How does the relationship change at different scales? At which scale is the relationship the strongest?
- (3)
- Is it possible to predict the urban function distribution characteristics of urban land from the perspective of urban morphology?
2. Methodology
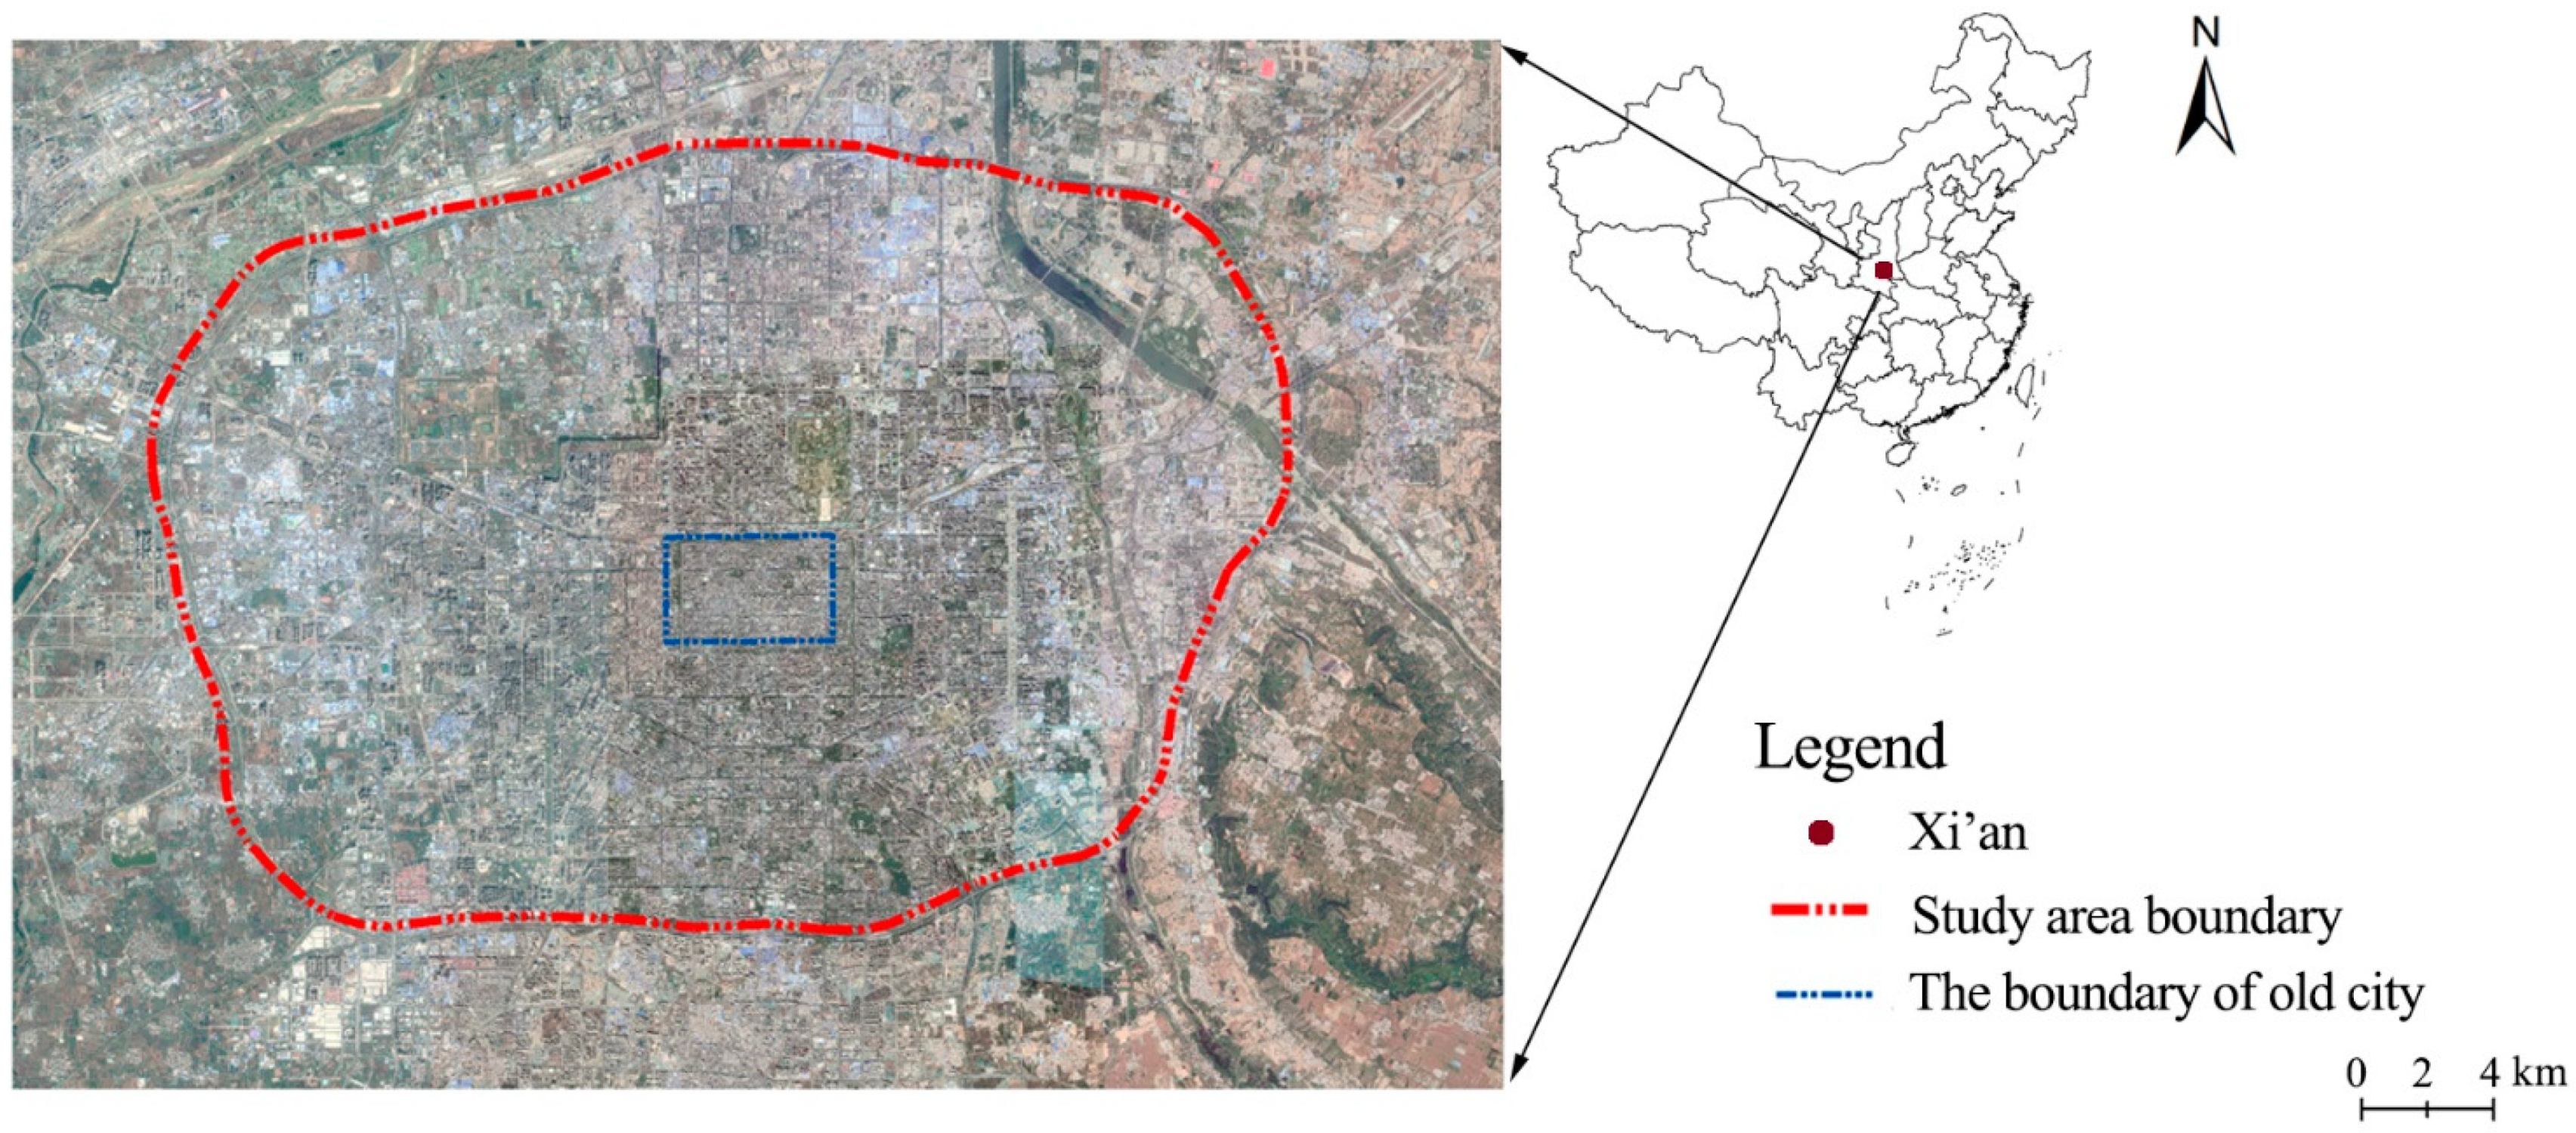
2.1. Study Area
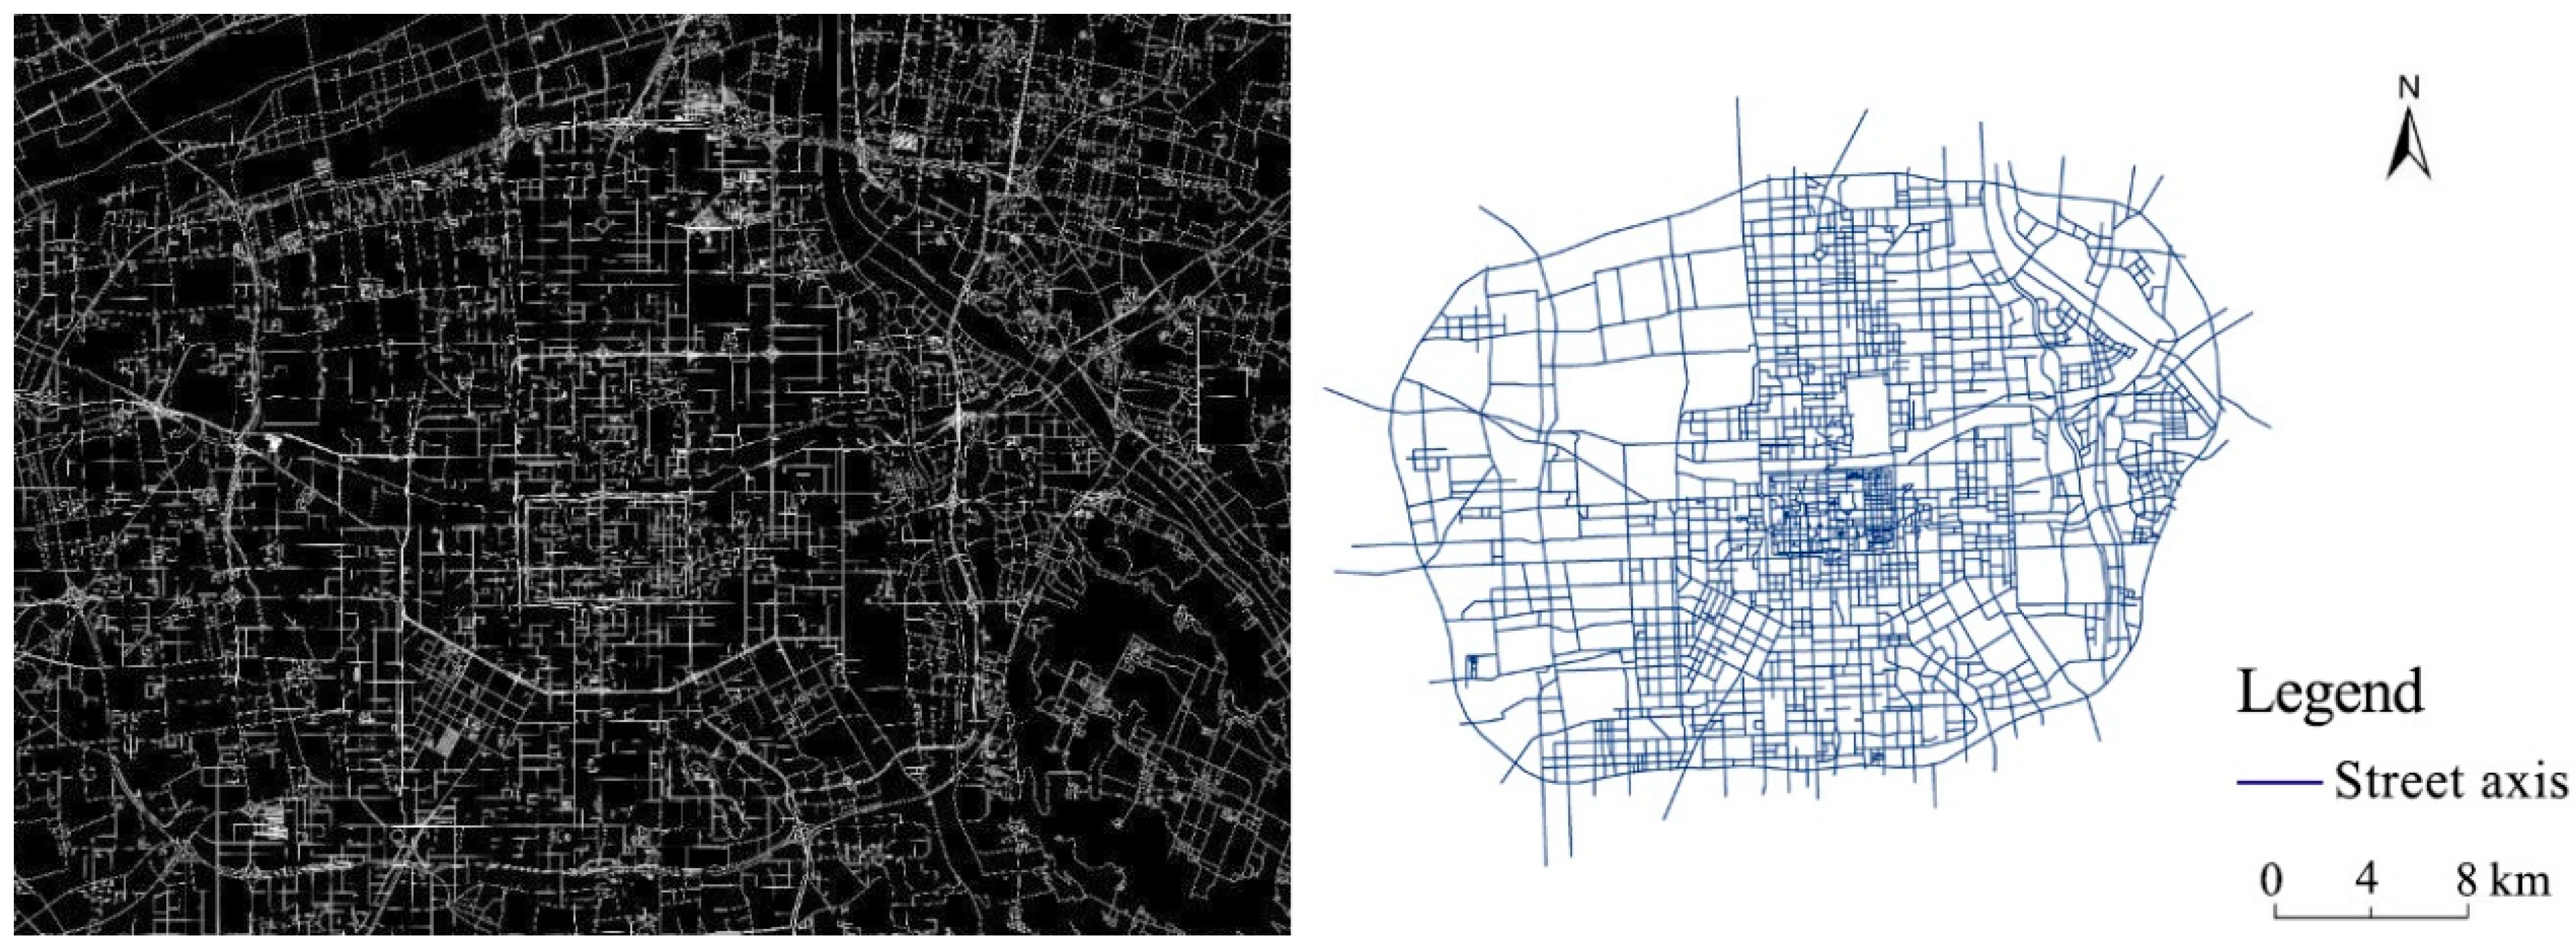
2.2. Data and Processing
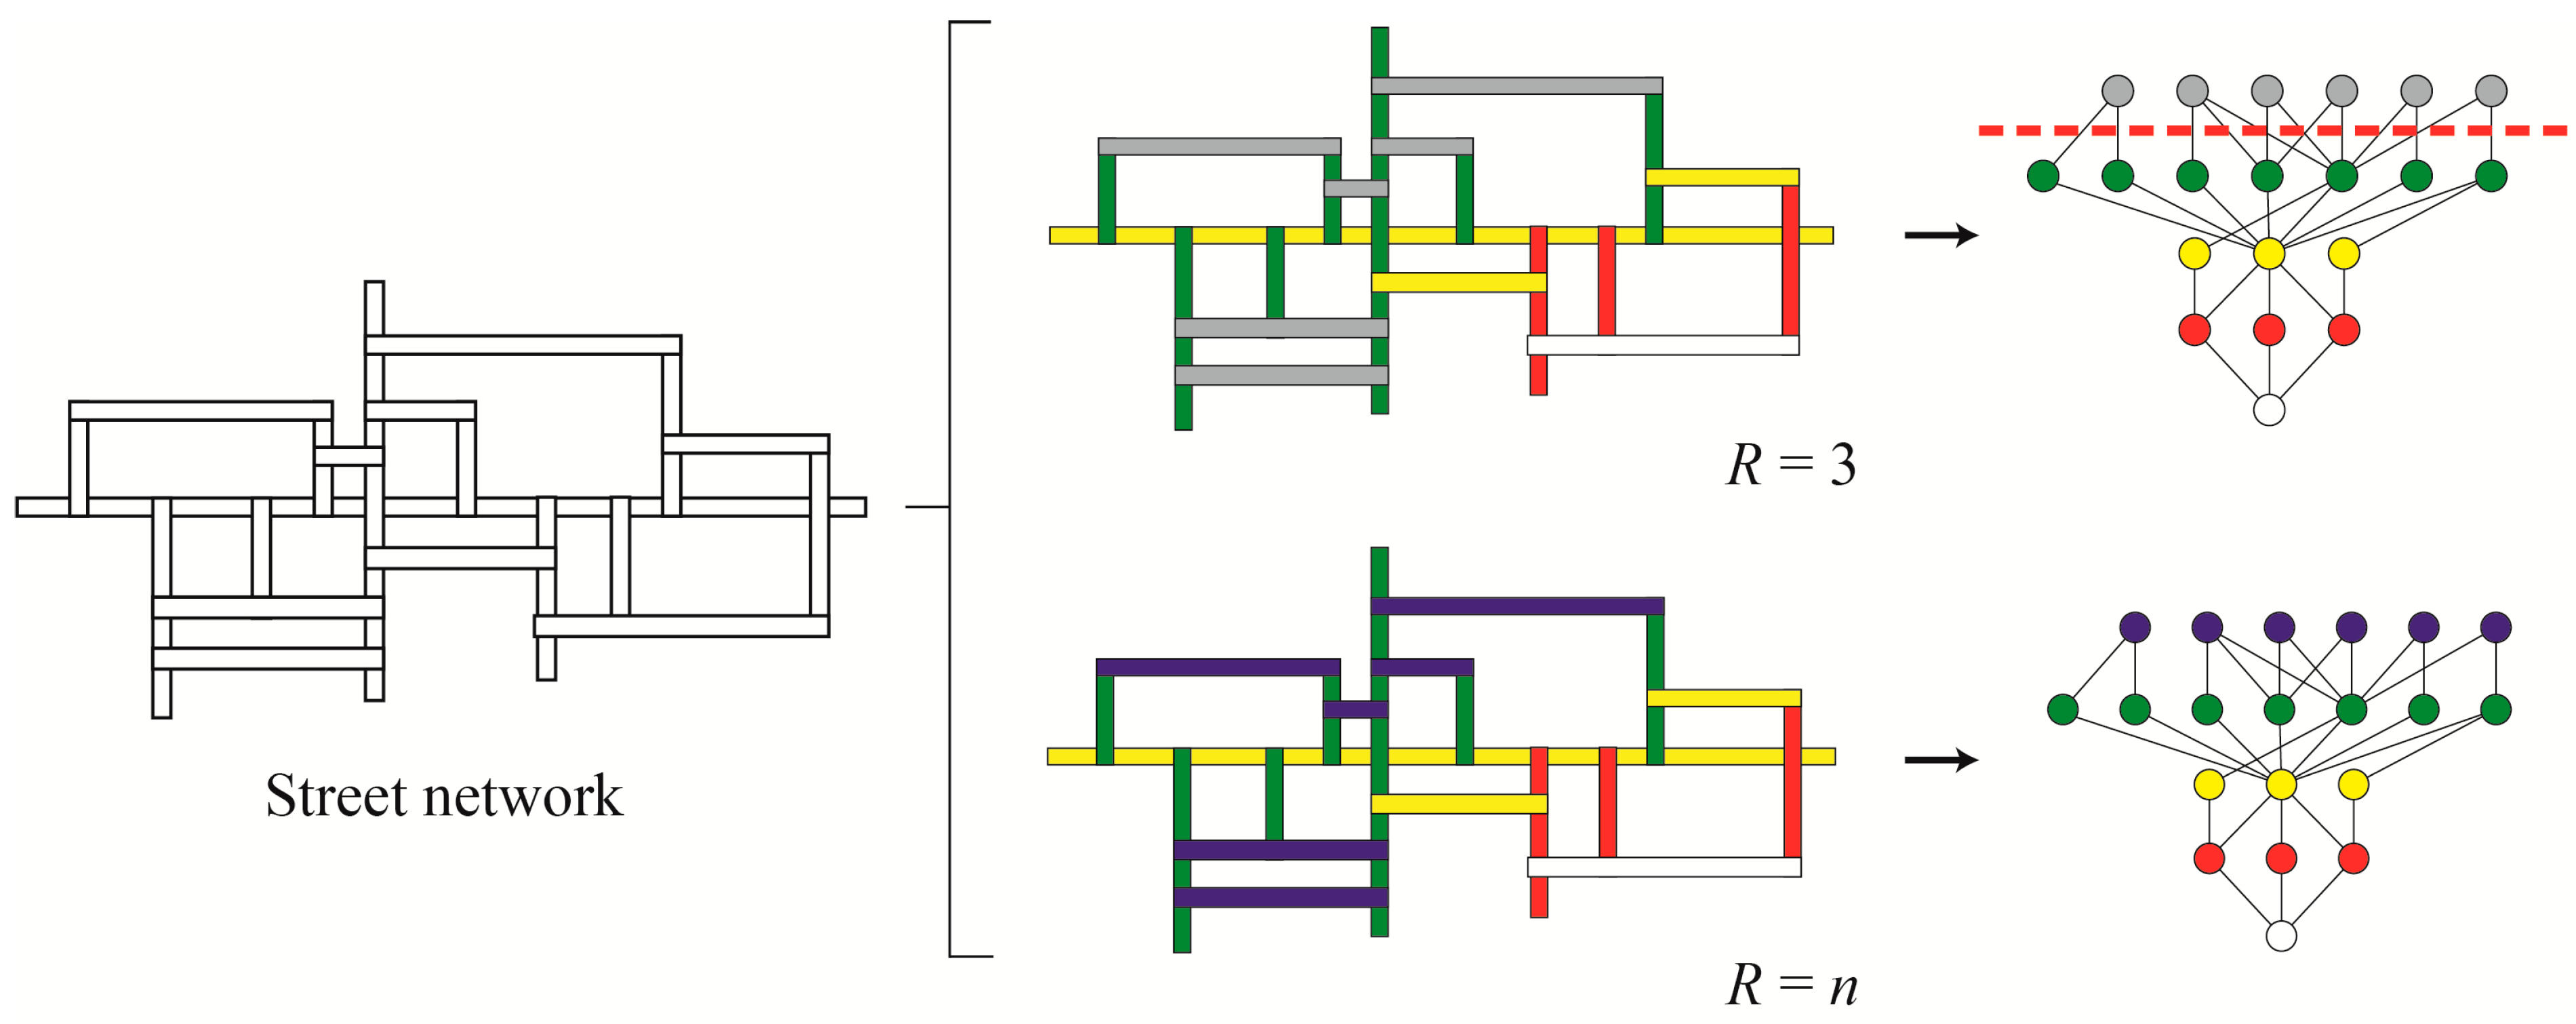
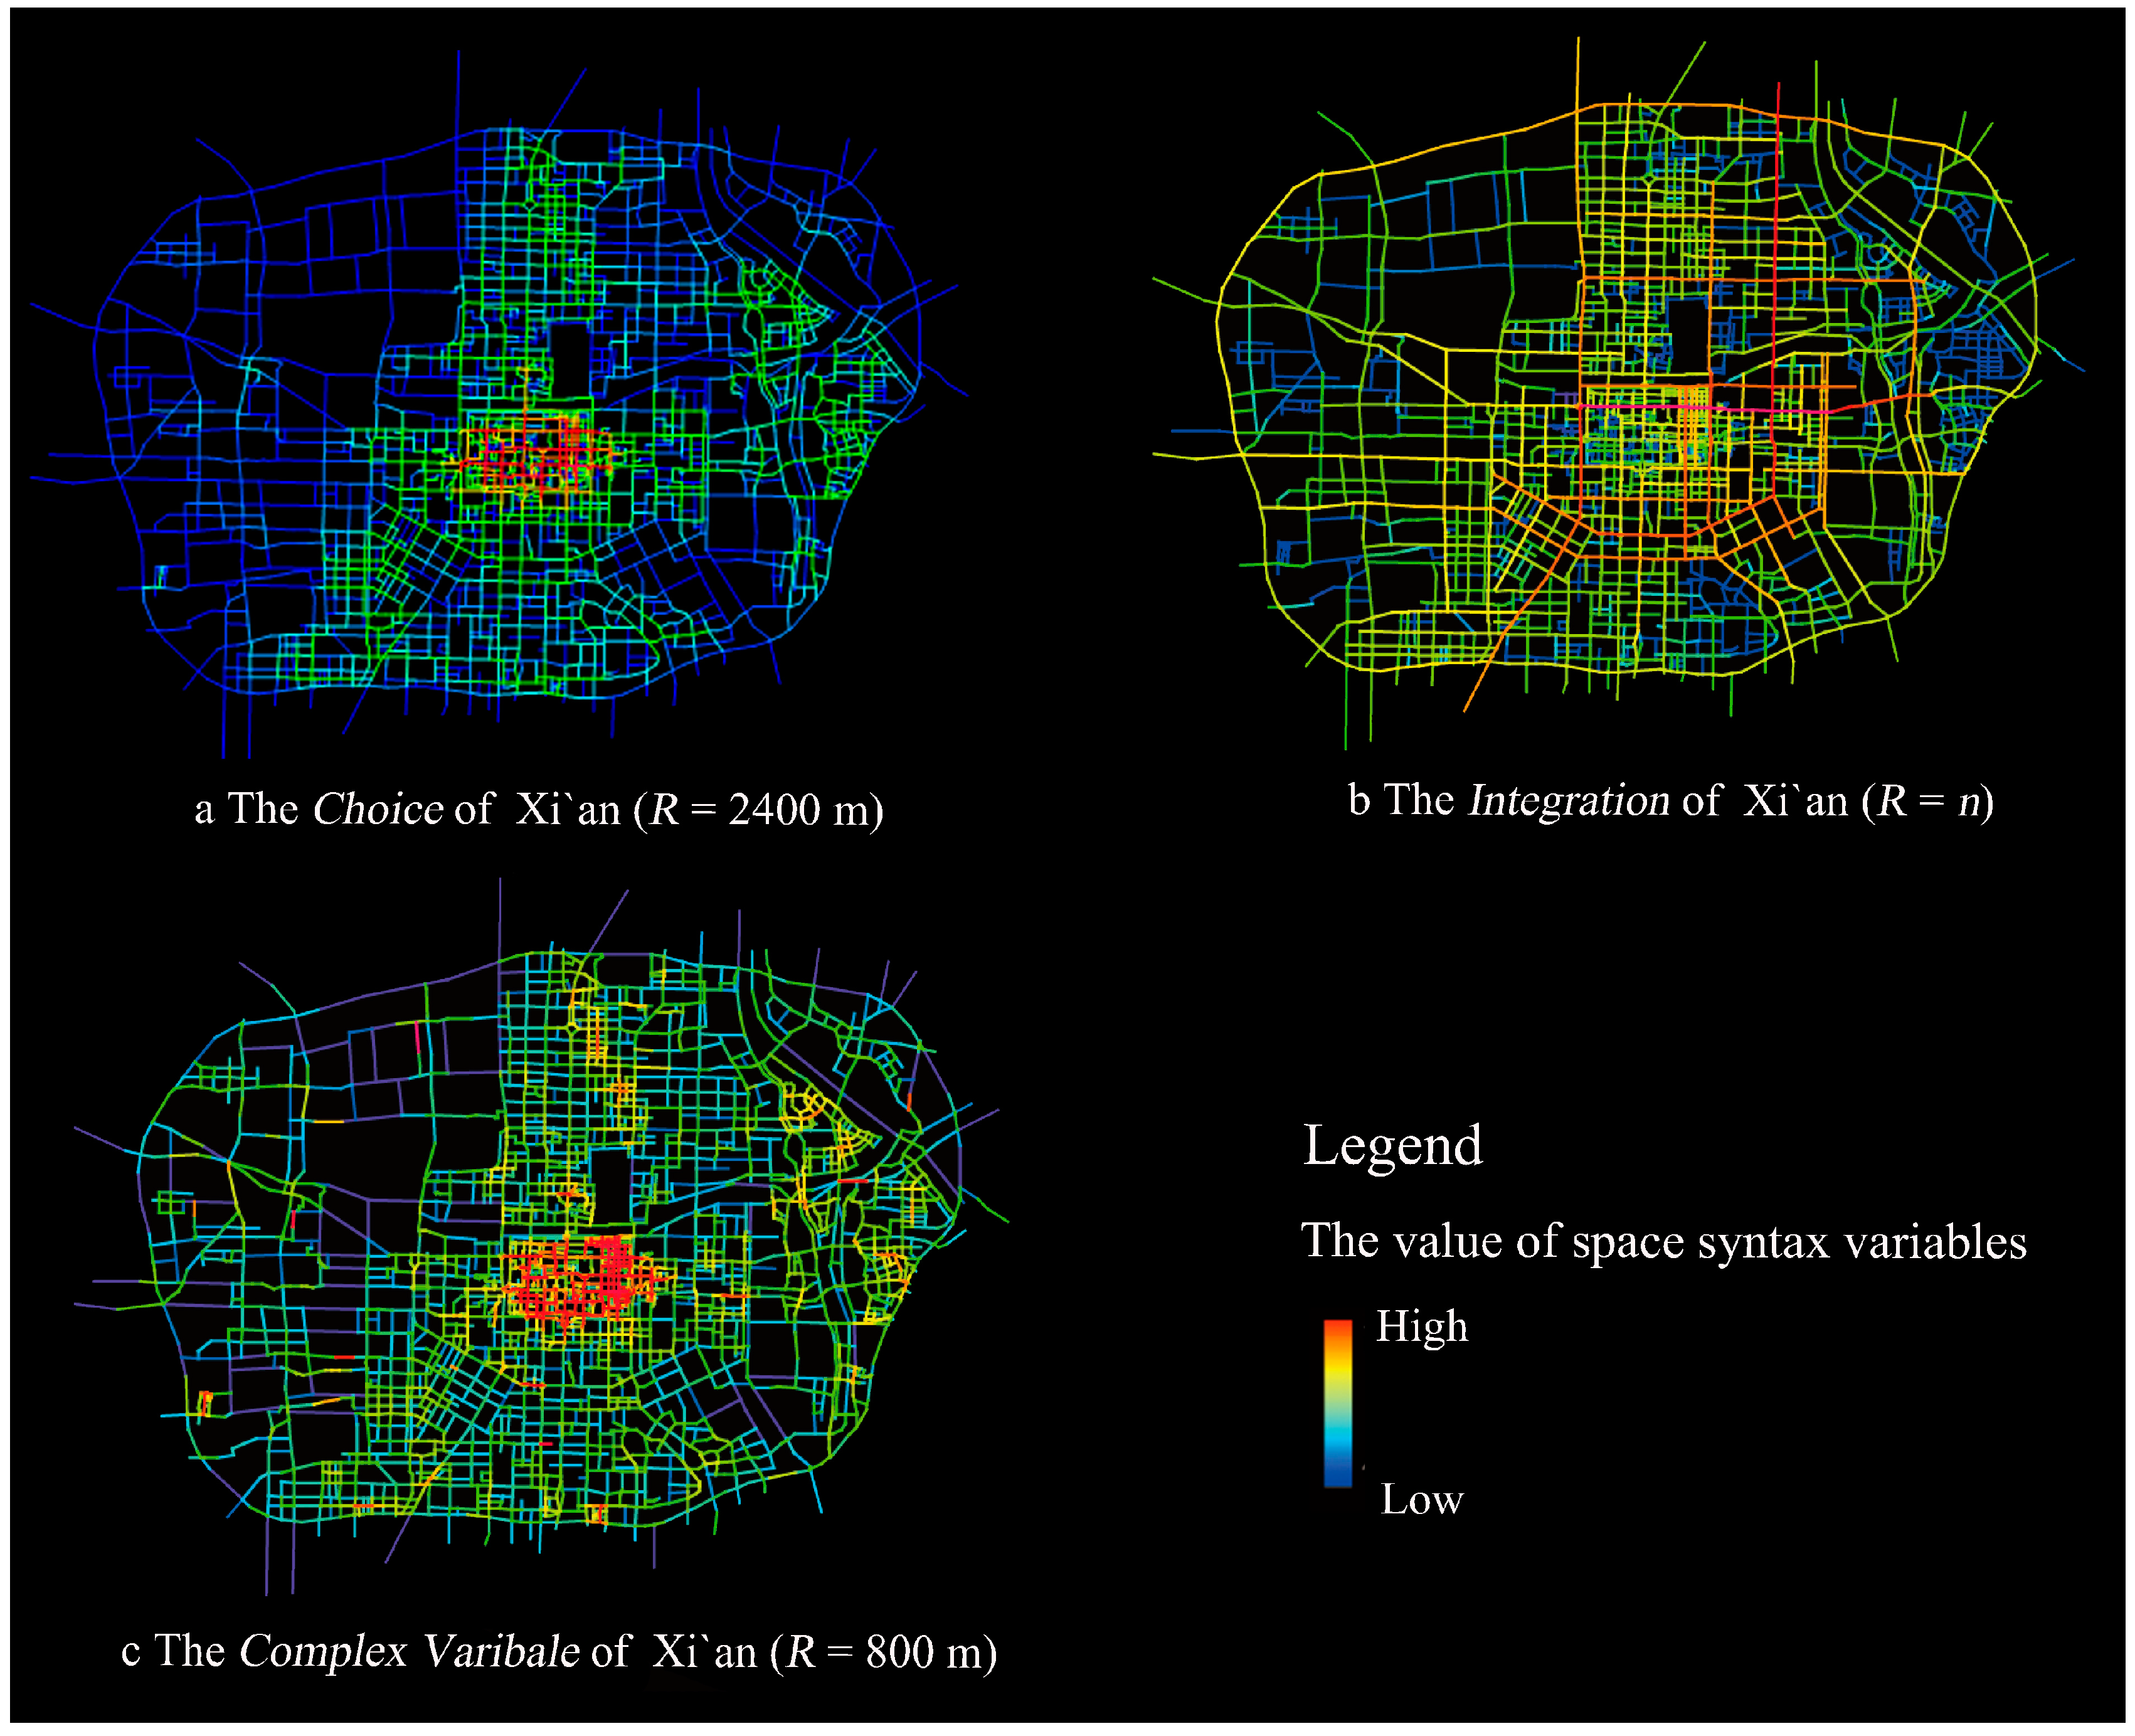
2.3. Selection of Variables in Space Syntax
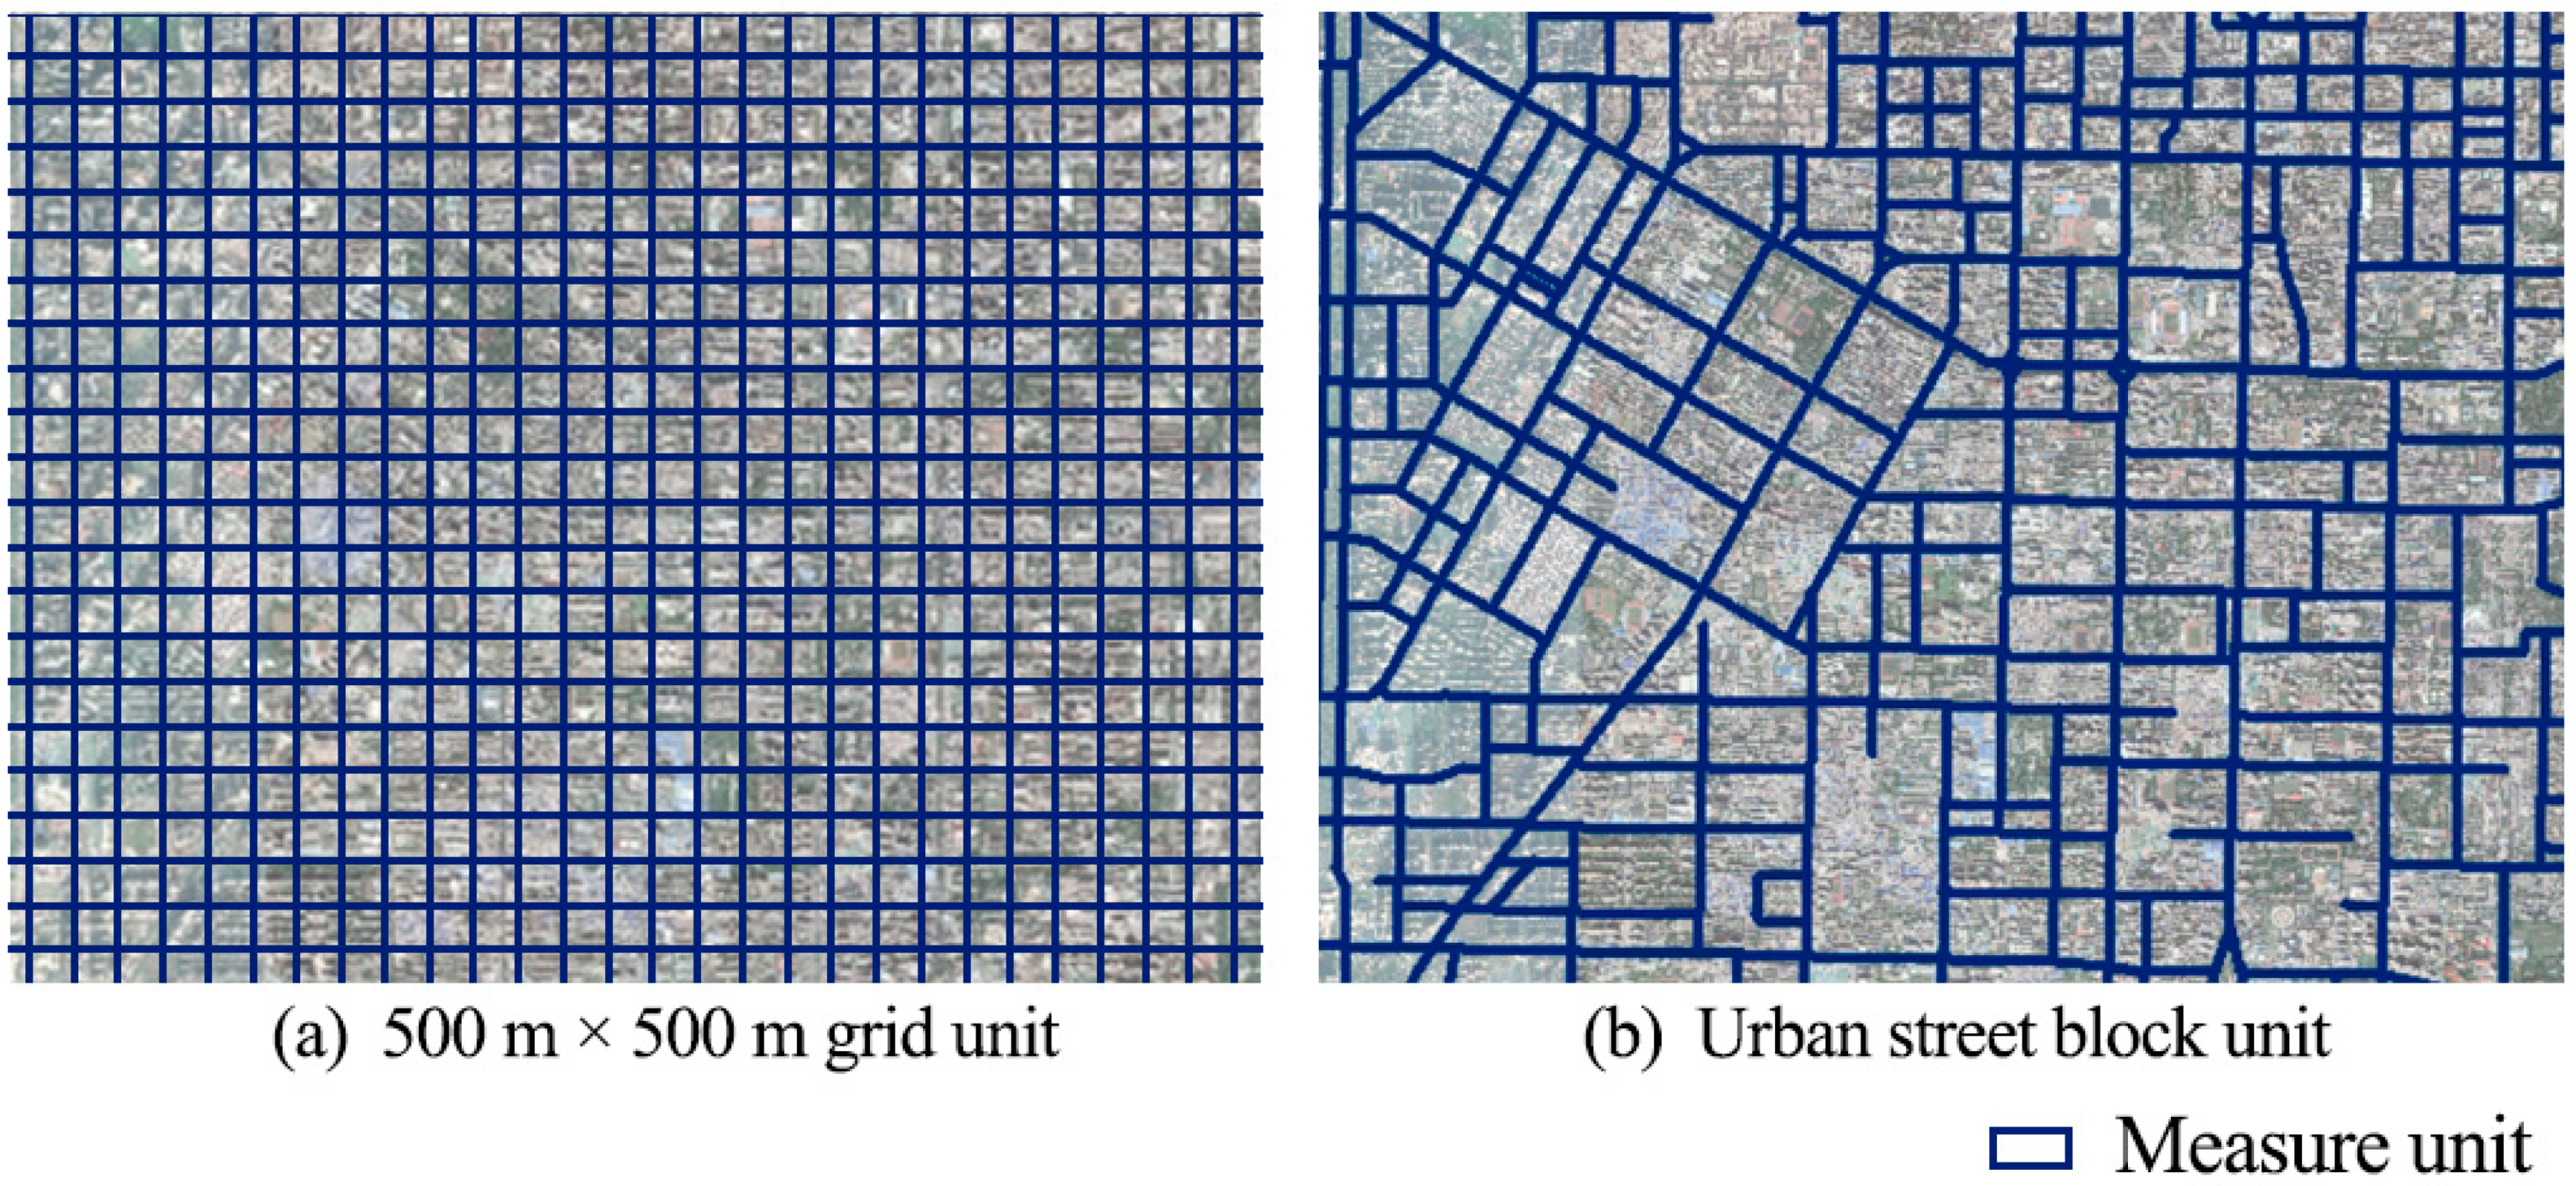
2.4. Analysis of Relationships at Different Scales with the Two Measurement Units
2.5. Correlation Analysis
3. Results
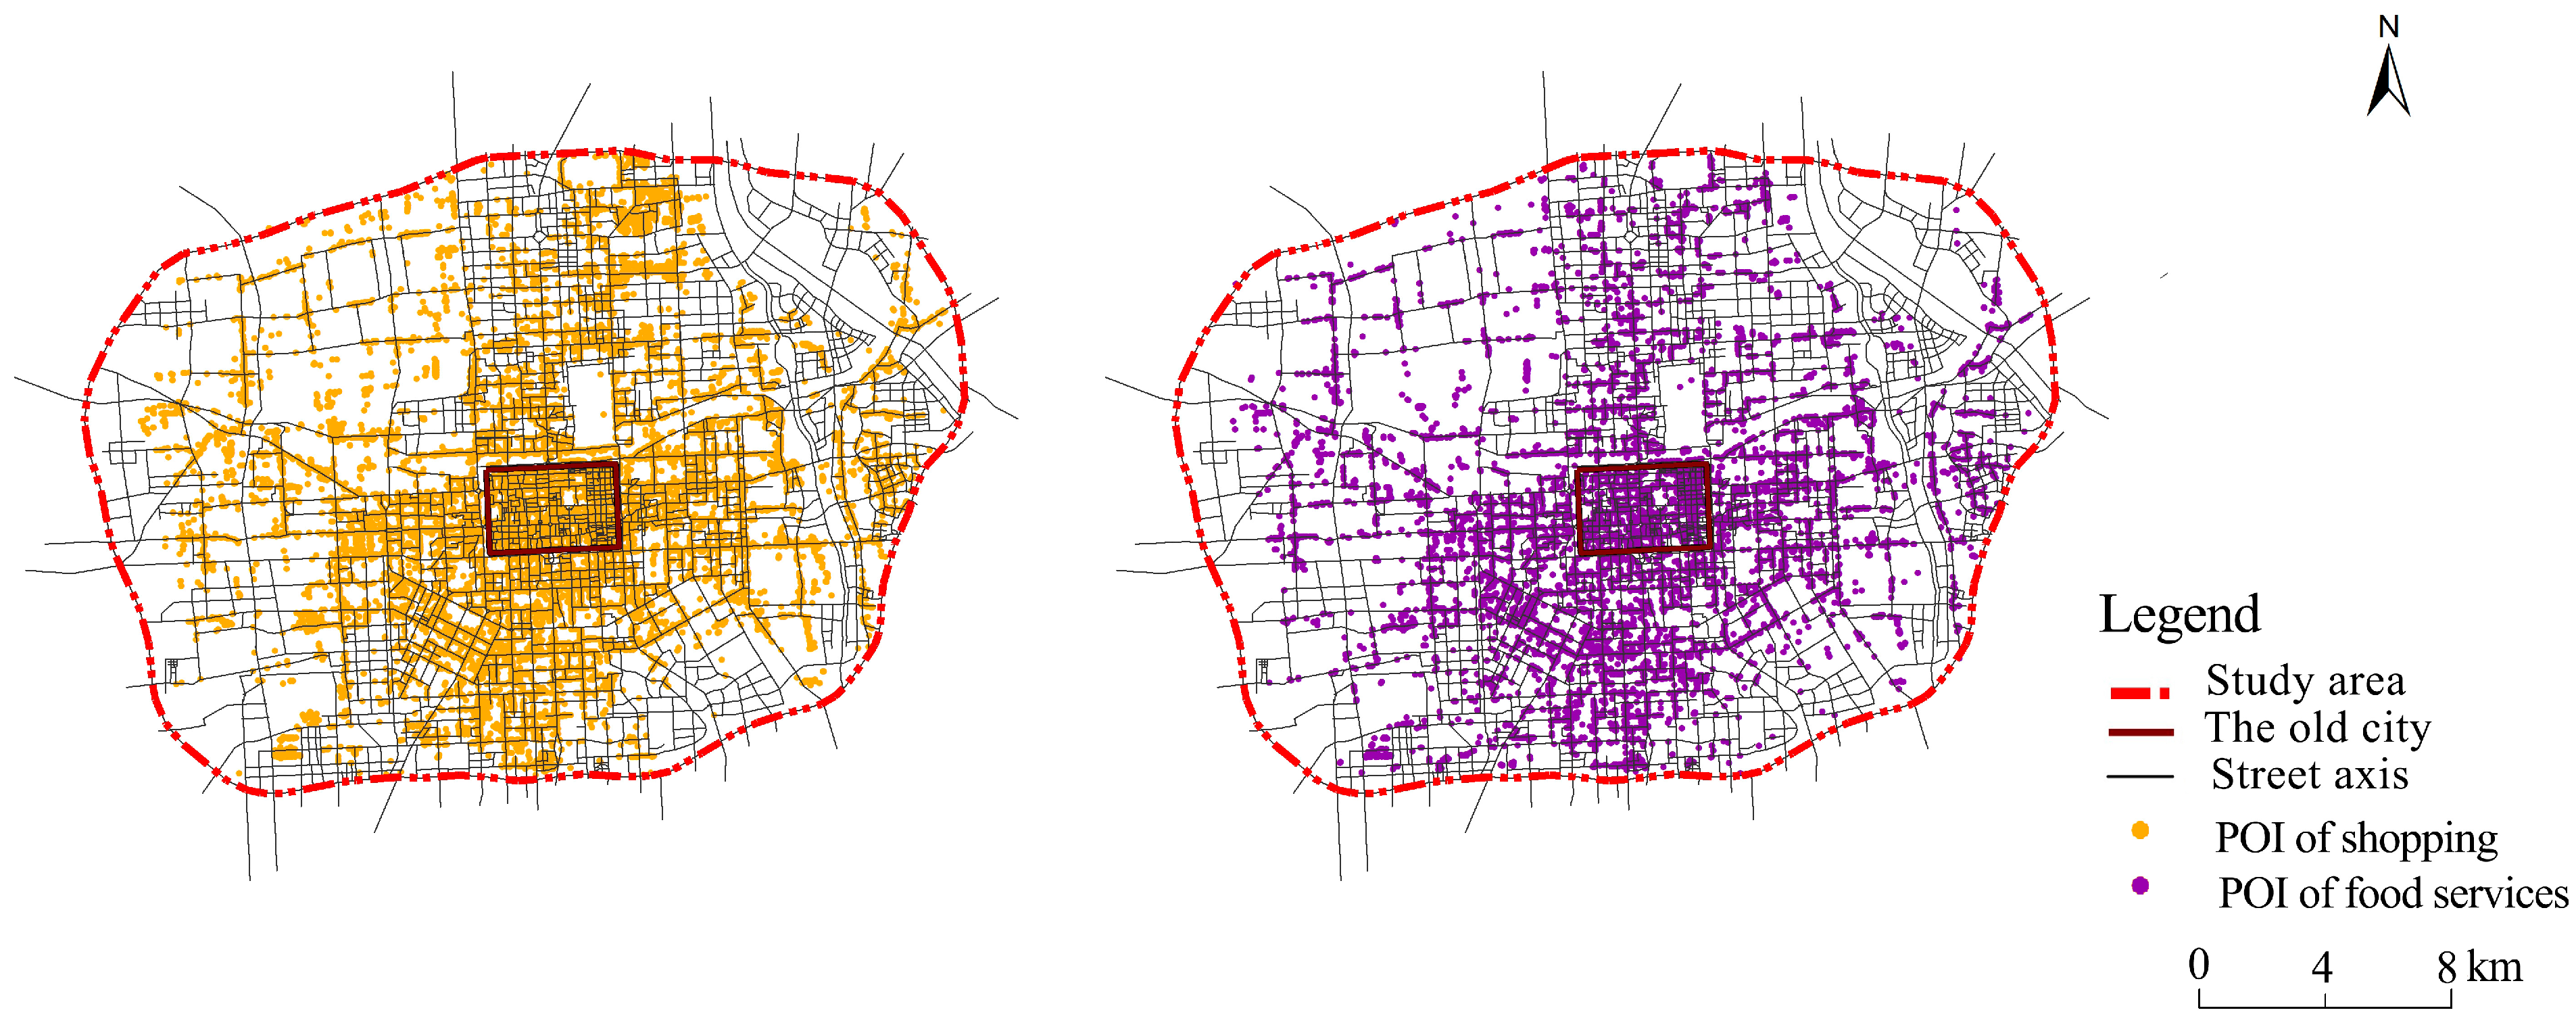
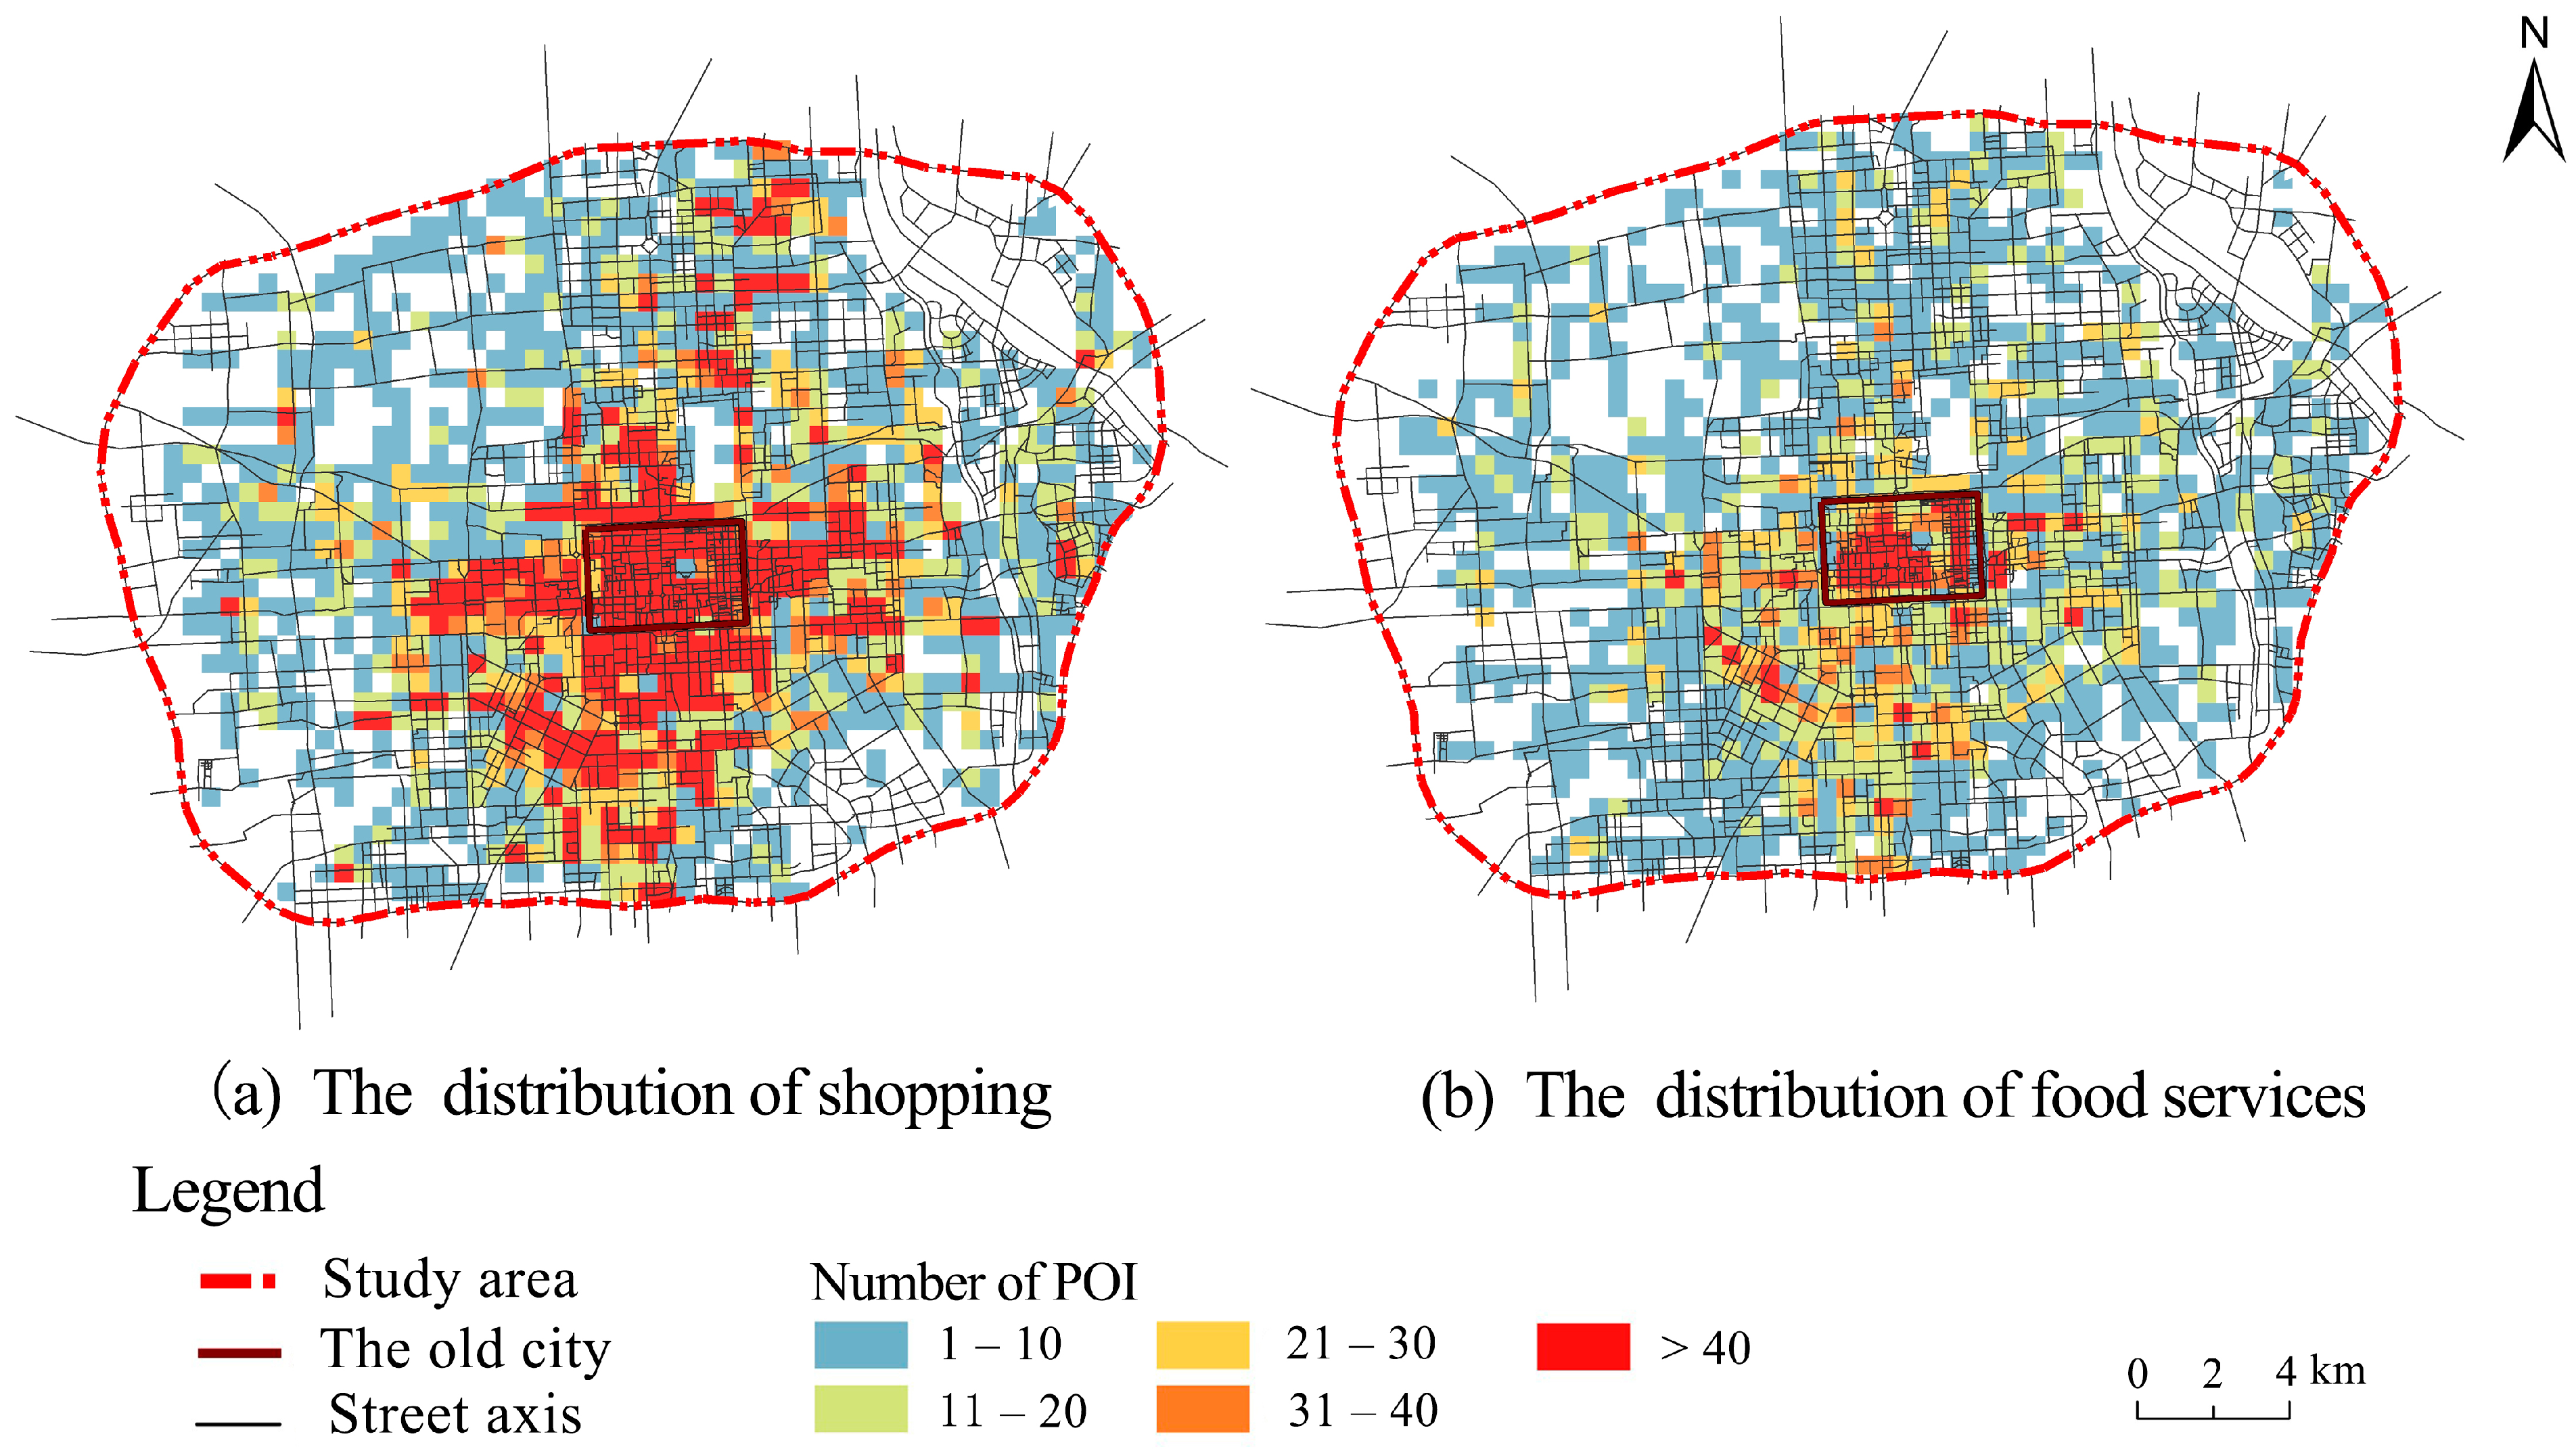
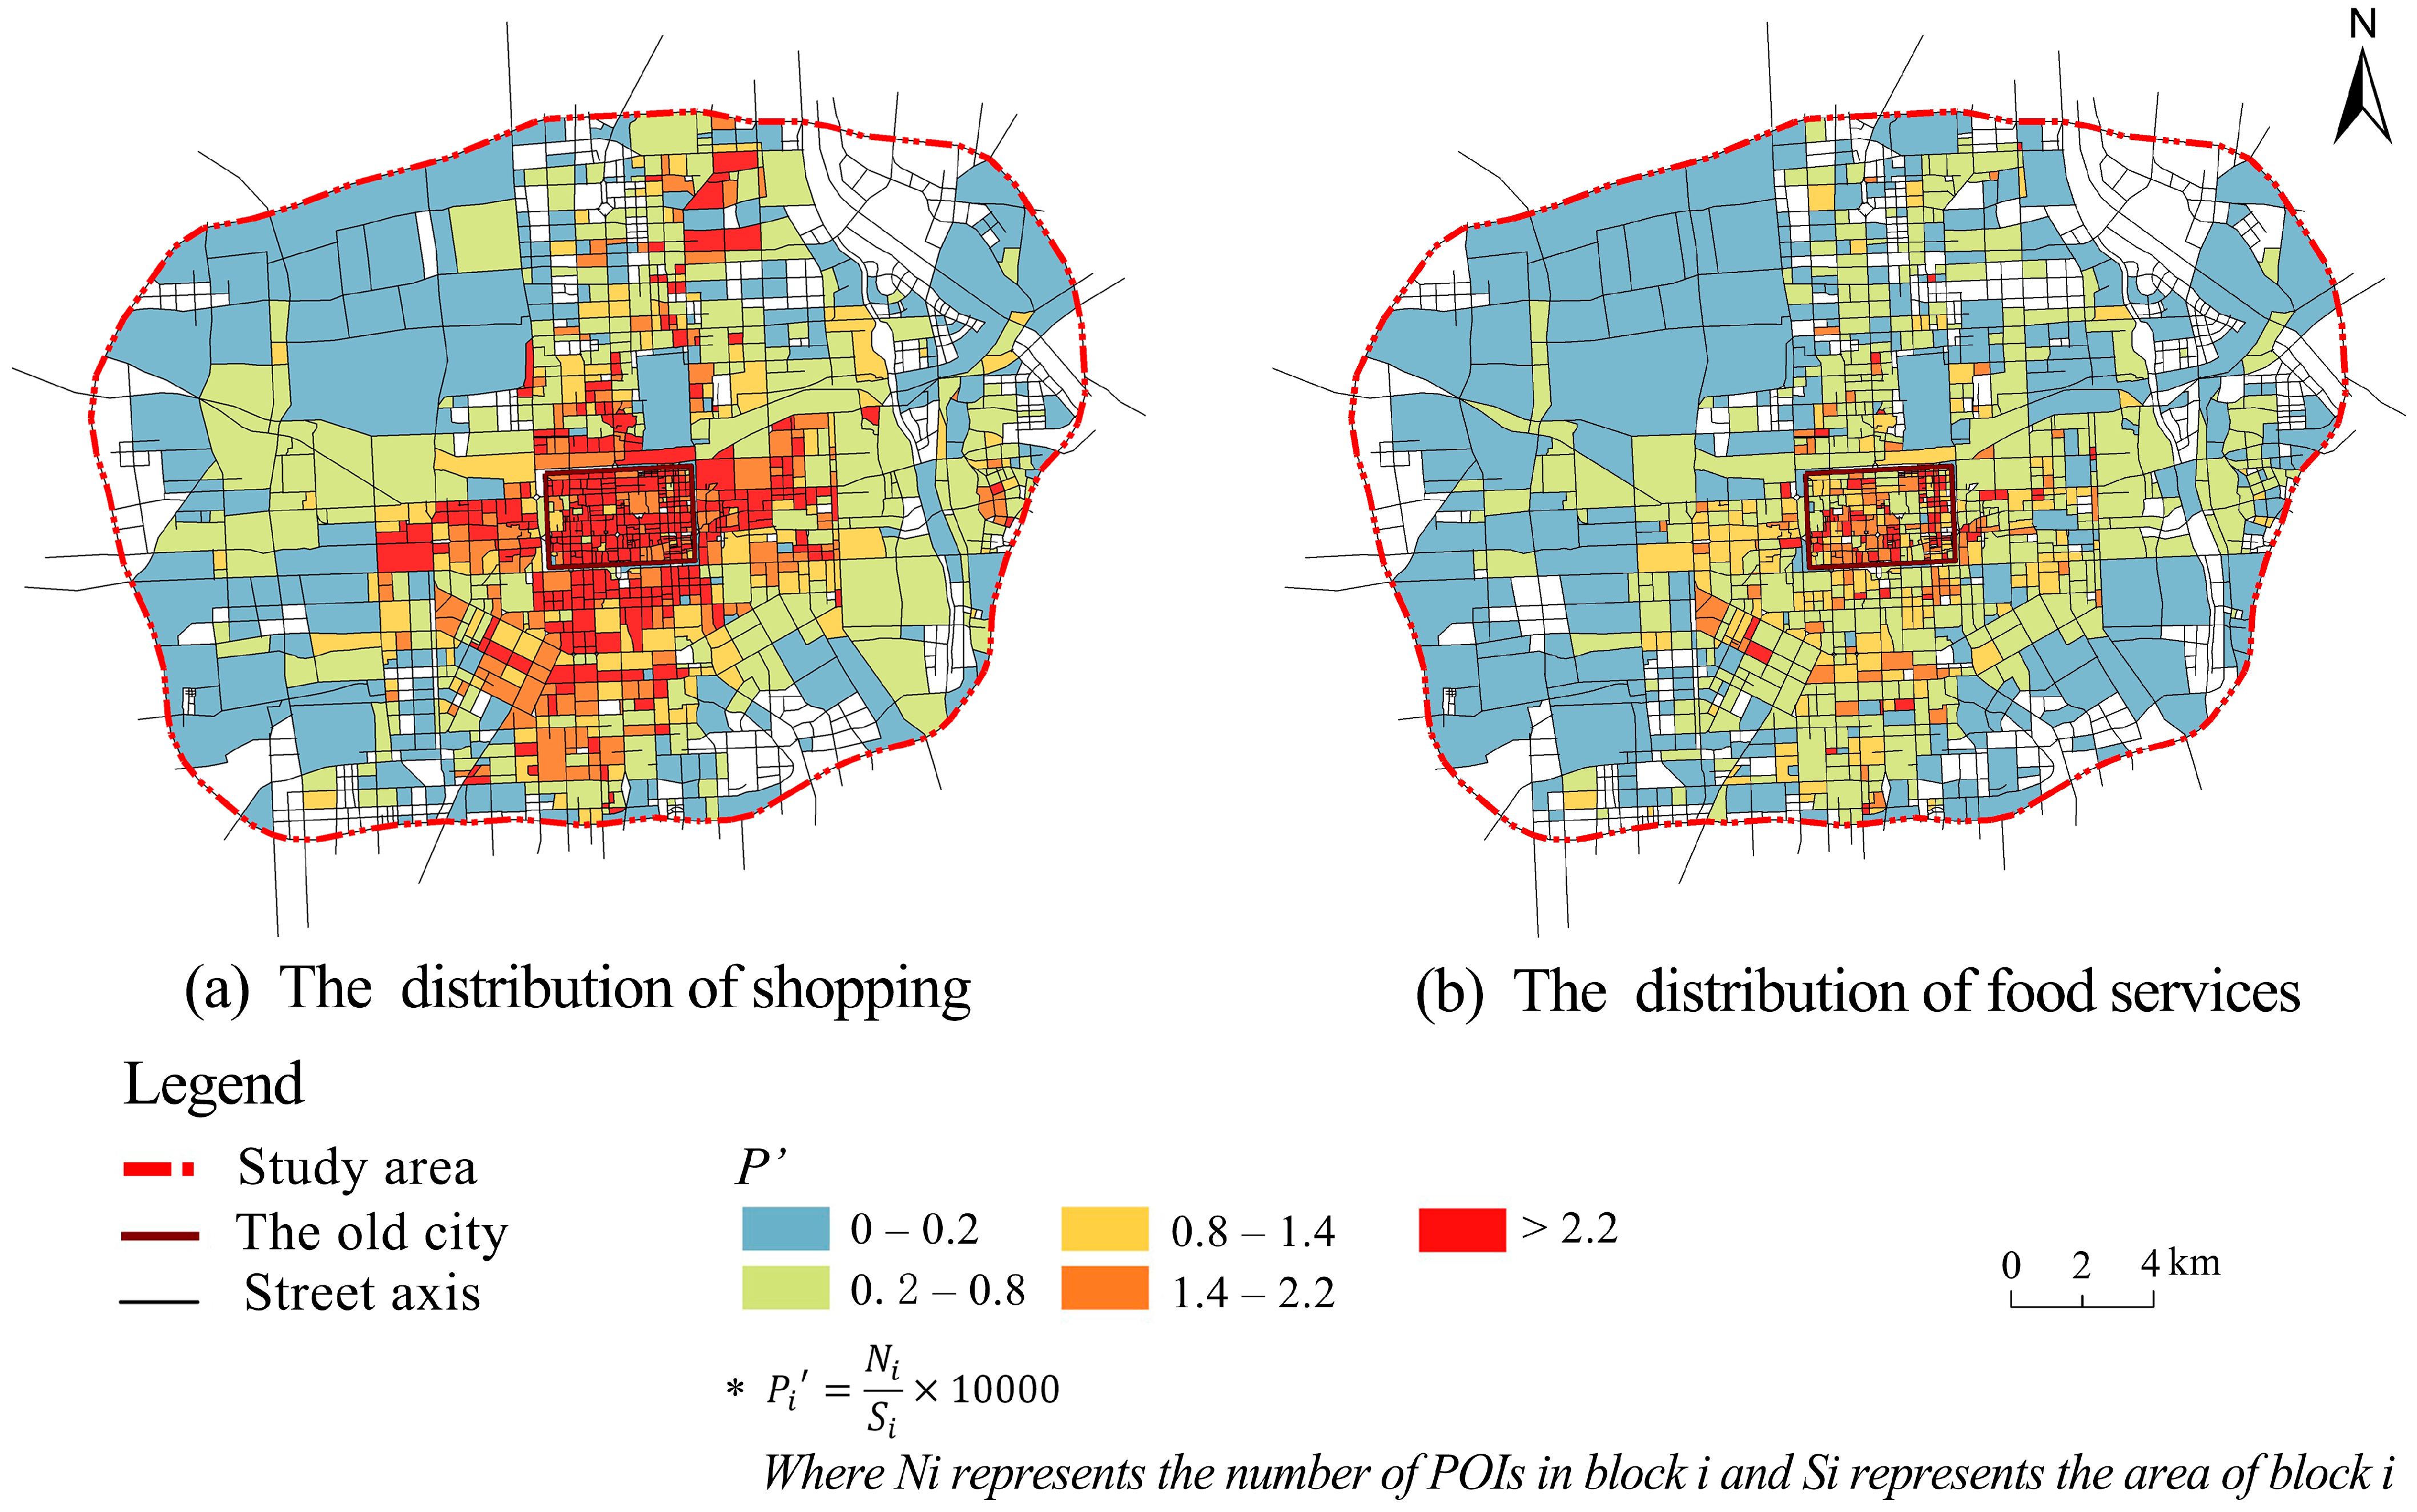
3.1. The Spatial Distributions of Food Service and Shopping
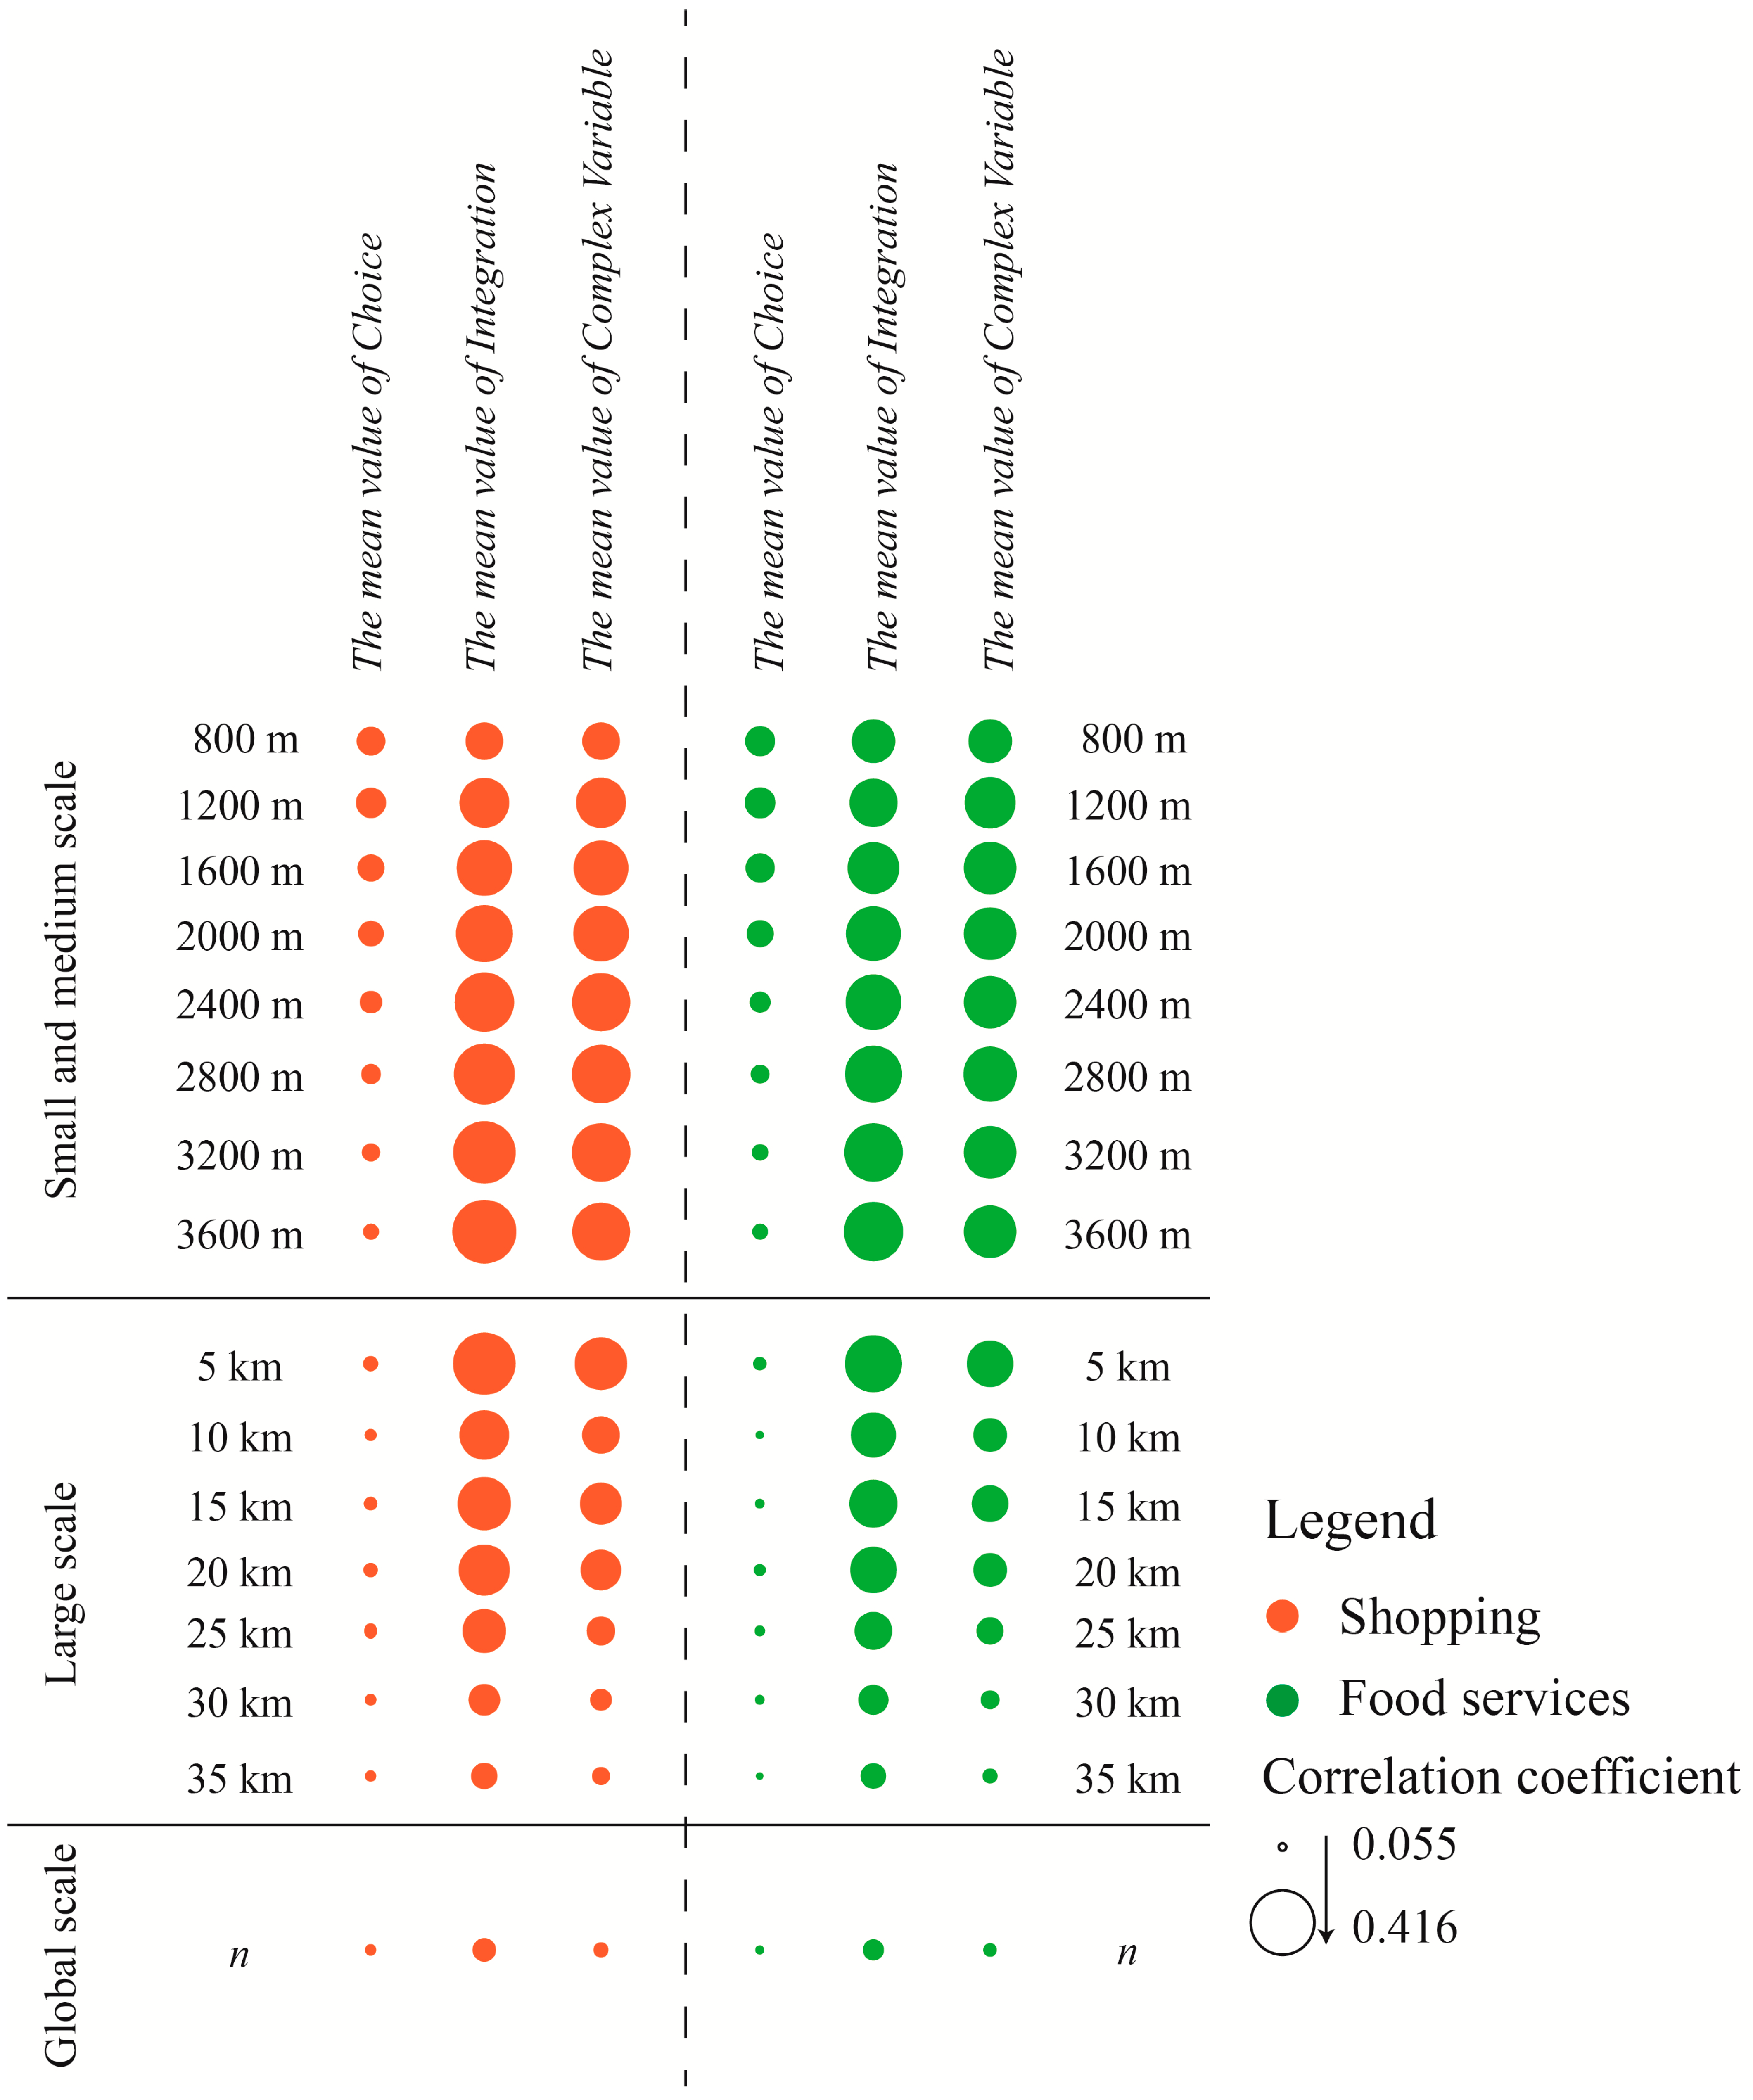
3.2. The Relationship between Urban Morphology and Commercial Distribution Measured by Grids
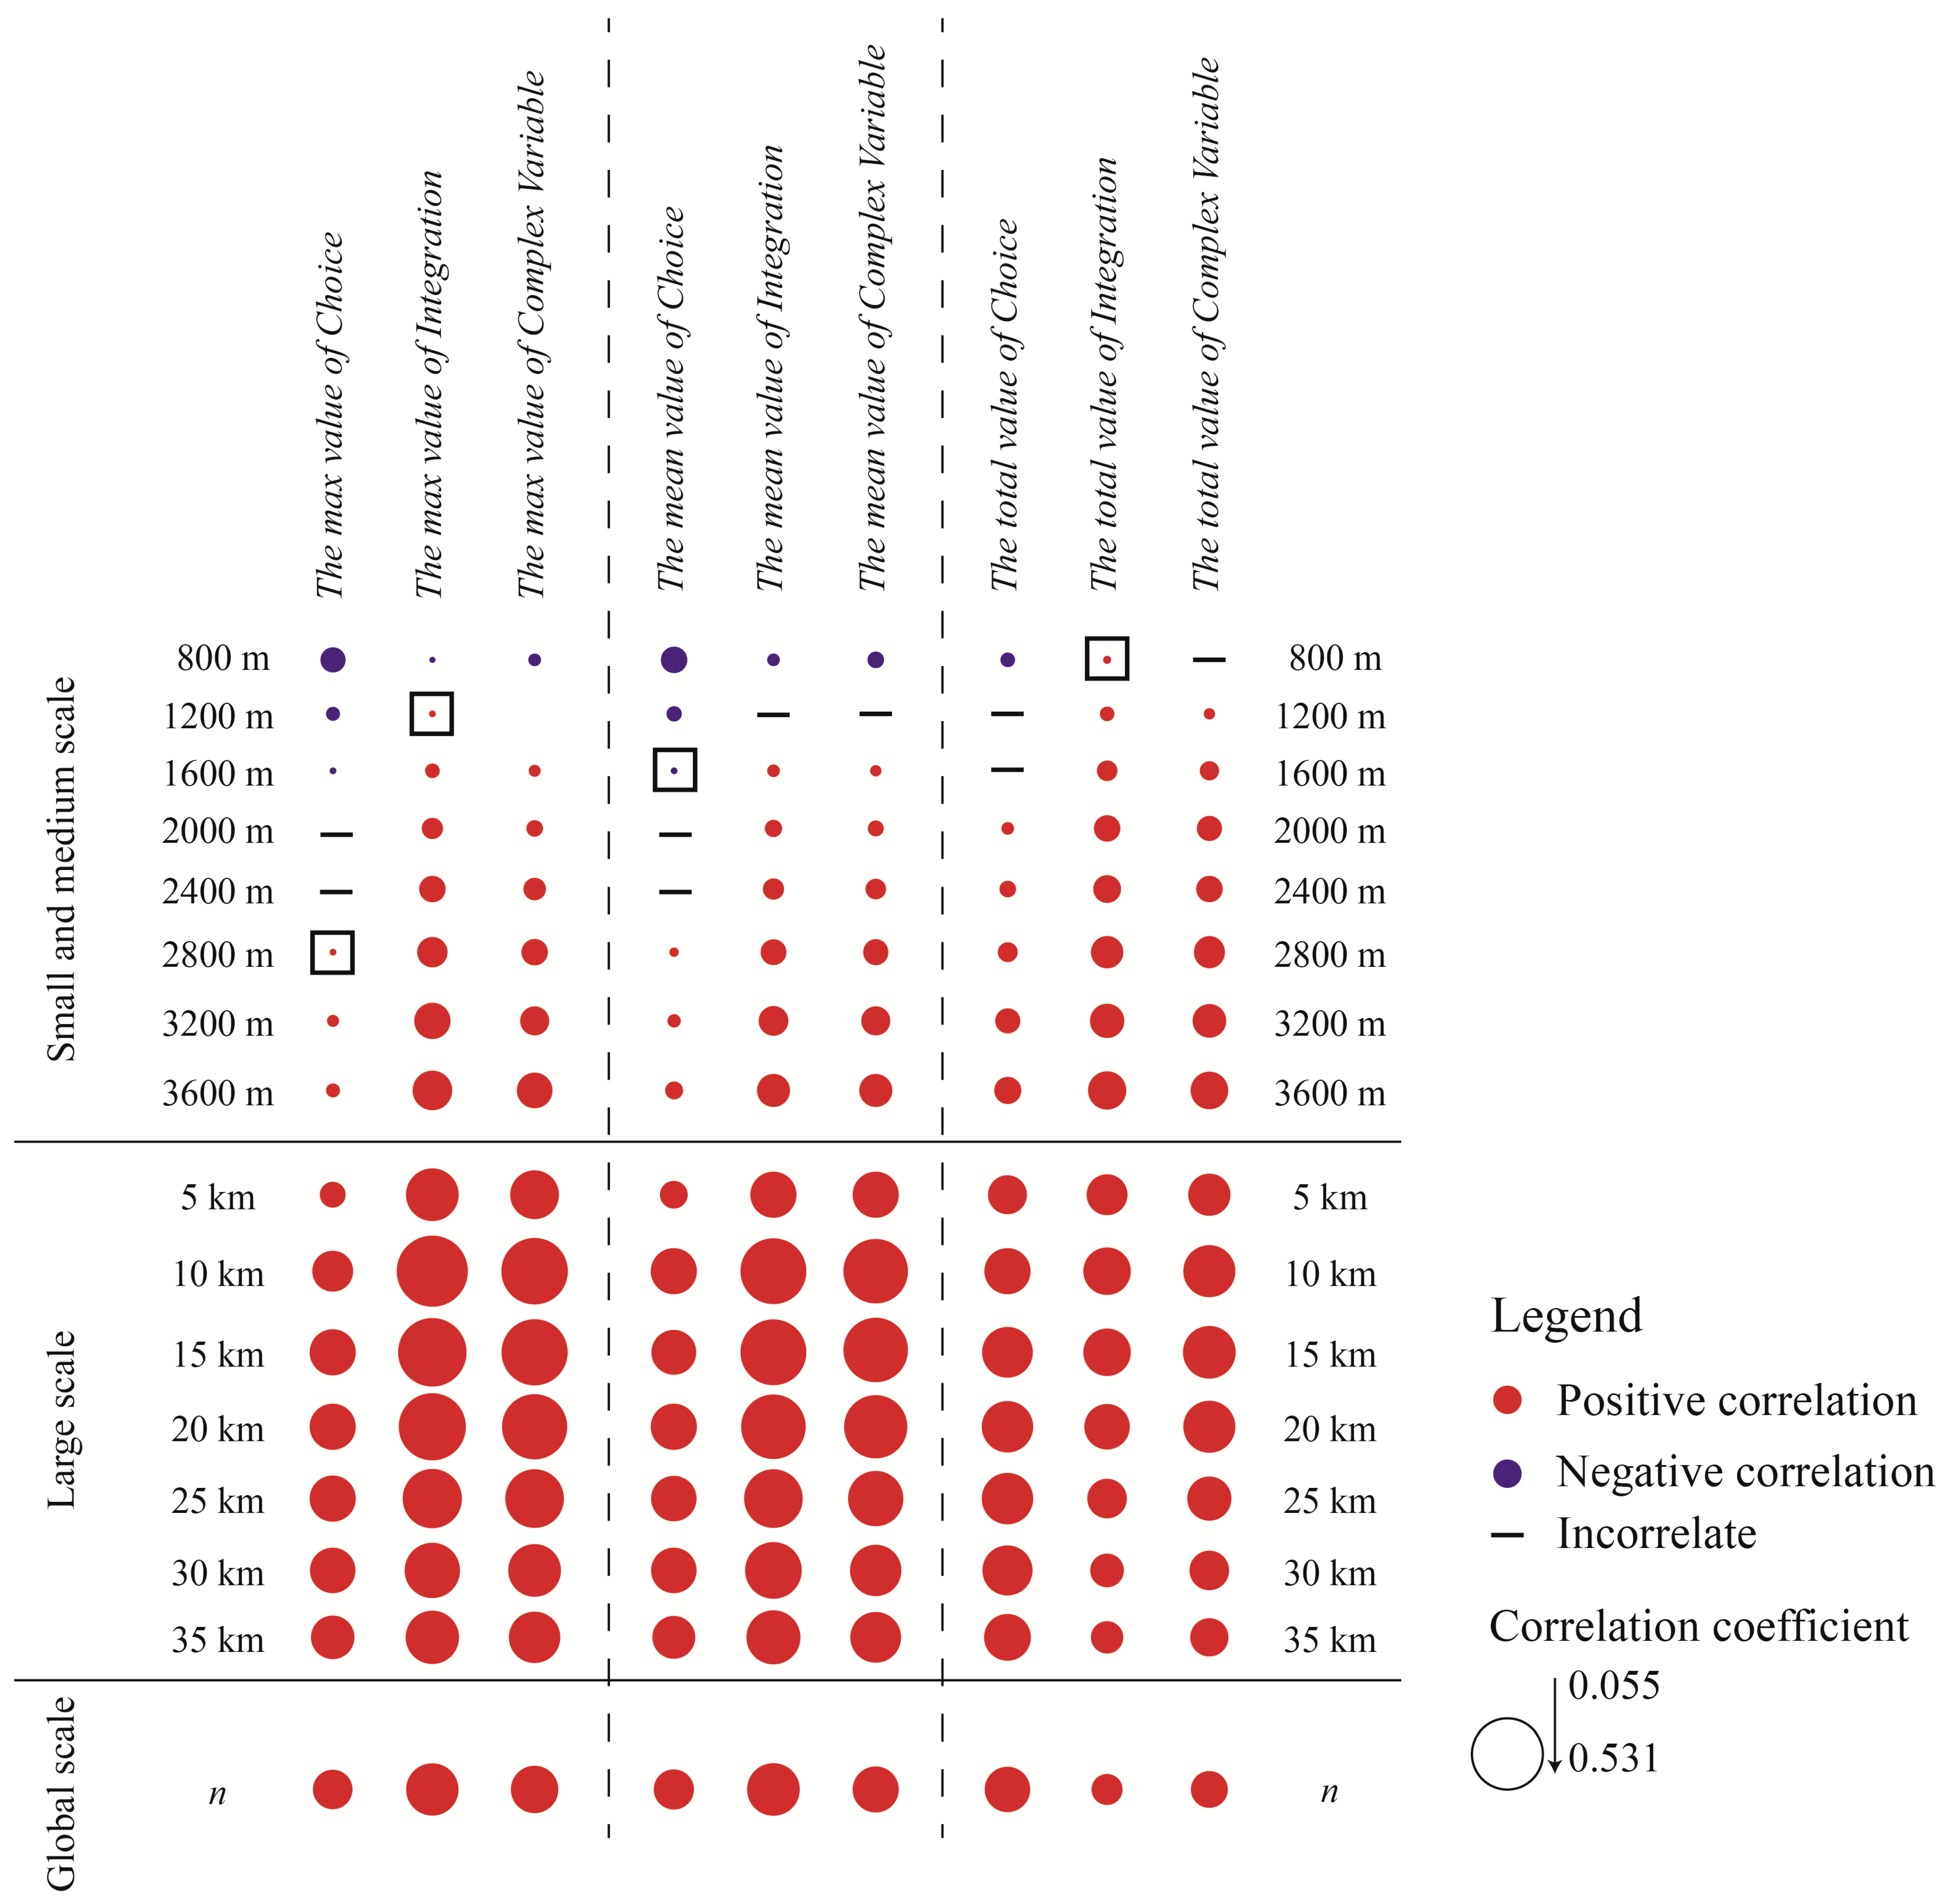
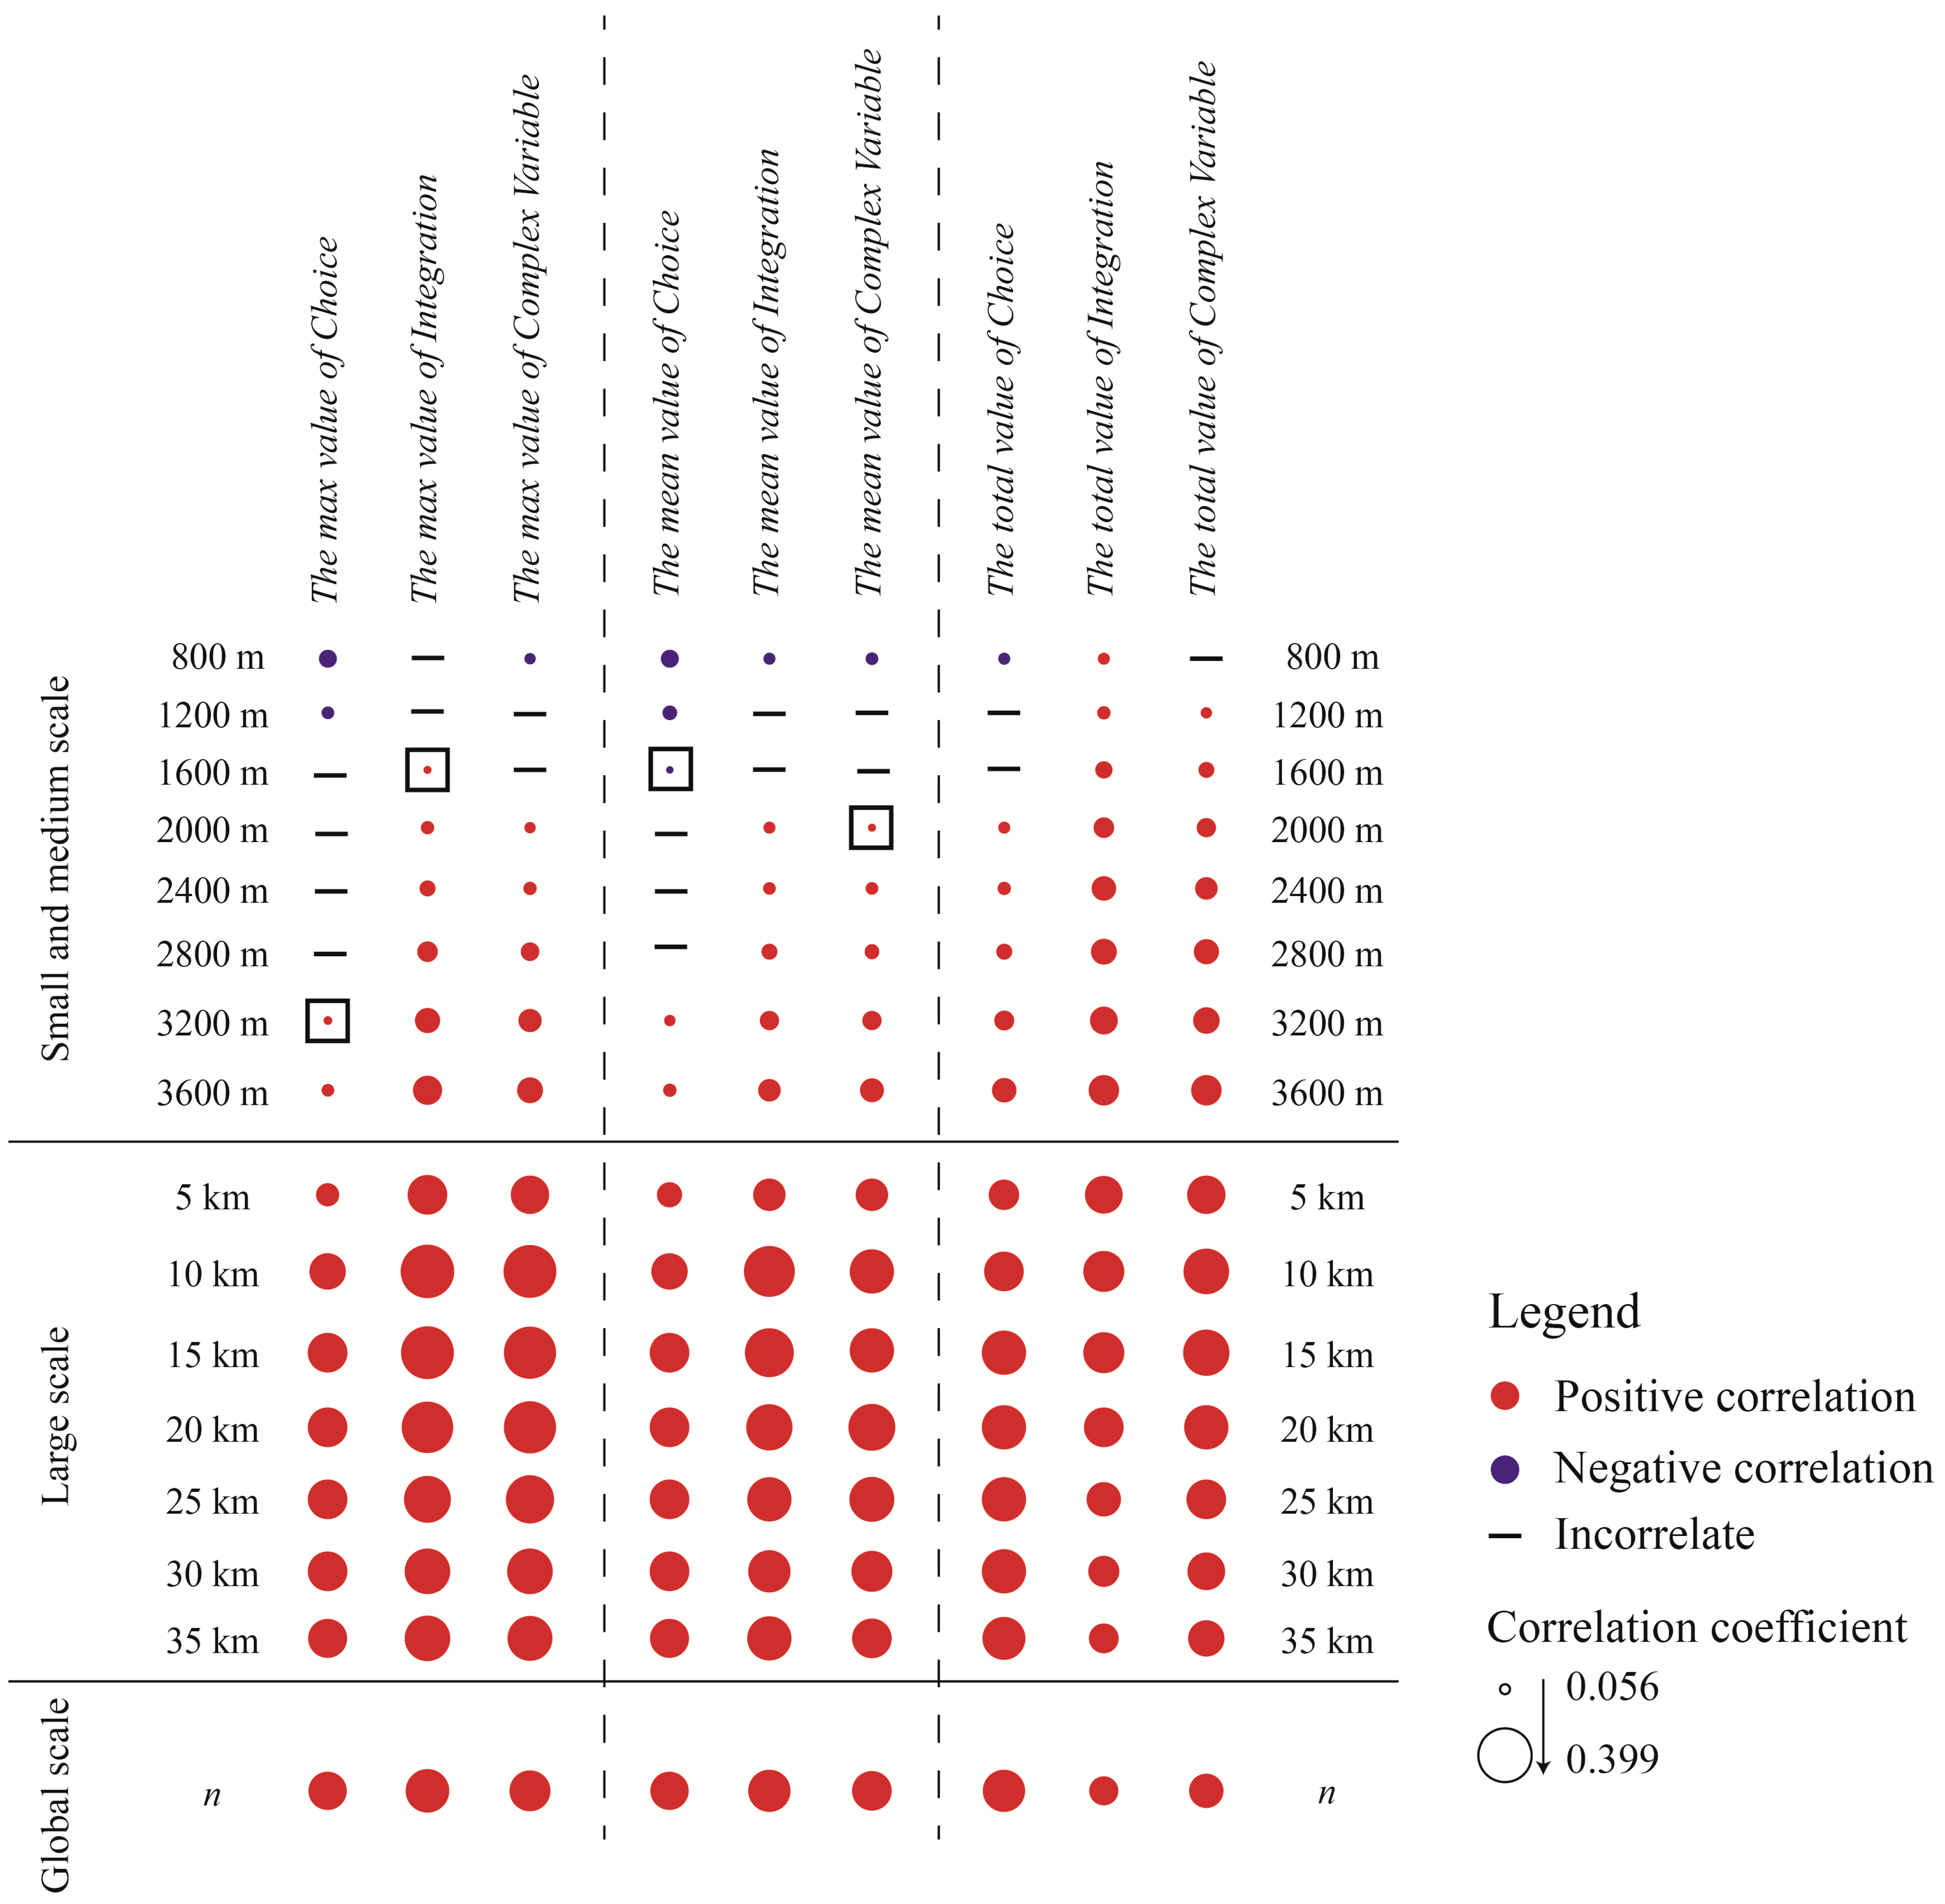
3.3. The Relationship between Urban Morphology and Commercial Distribution Measured by Blocks
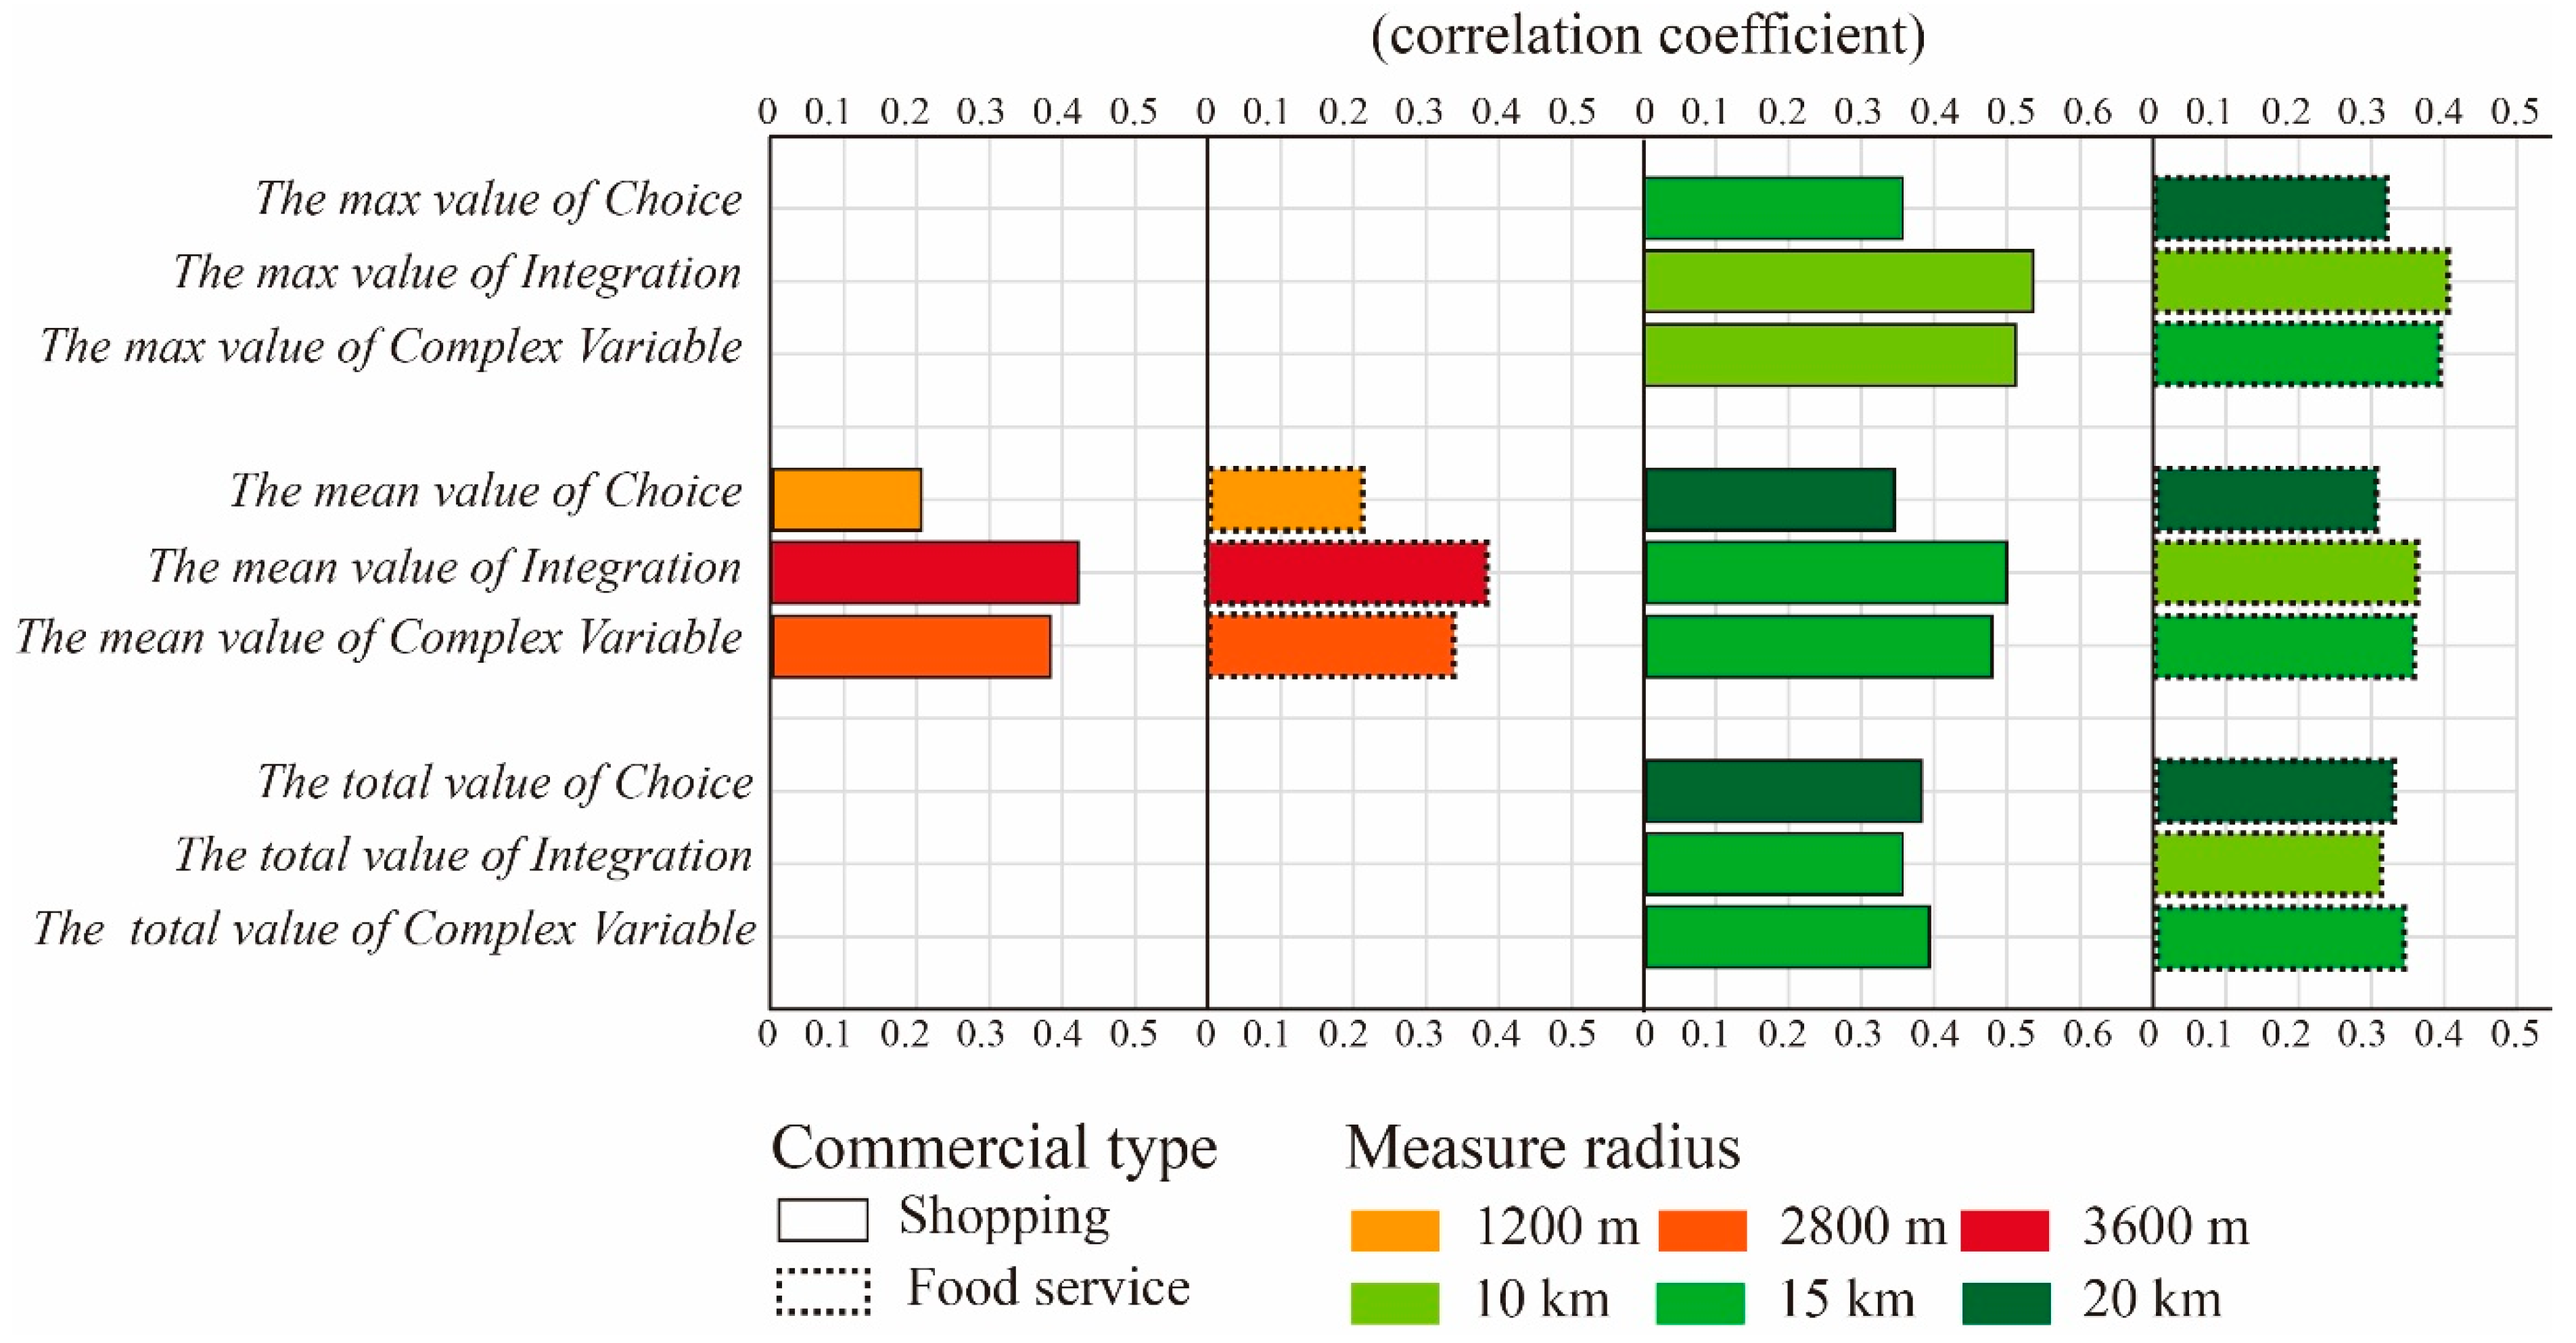
3.4. Summary
4. Discussion
4.1. Implications of This Study
4.2. Potential Development in the Future
5. Conclusions
Author Contributions
Funding
Data Availability Statement
Conflicts of Interest
References
- Campanella, T.J. The Concrete Dragon: China’s Urban Revolution and What It Means for the World; Chronicle Books: San Francisco, CA, USA, 2012. [Google Scholar]
- Shahbaz, M.; Chaudhary, A.R.; Ozturk, I. Does urbanization cause increasing energy demand in Pakistan? Empirical evidence from STIRPAT model. Energy 2017, 122, 83–93. [Google Scholar] [CrossRef]
- Zhang, W.; Li, B. Research on an Analytical Framework for Urban Spatial Structural and Functional Optimisation: A Case Study of Beijing City, China. Land 2021, 10, 86. [Google Scholar] [CrossRef]
- Buettner, T. Urban estimates and projections at the United Nations: The strengths, weaknesses, and underpinnings of the world urbanization prospects. Spatial Demography 2015, 3, 91–108. [Google Scholar] [CrossRef]
- Ye, Y.; Yeh, A.; Zhuang, Y.; van Nes, A.; Liu, J. Form Syntax as a contribution to geodesign: A morphological tool for urbanity-making in urban design. Urban Des. Int. 2017, 22, 73–90. [Google Scholar] [CrossRef]
- Yang, T.; Pan, H.; Hewings, G.; Jin, Y. Understanding urban sub-centers with heterogeneity in agglomeration economies—Where do emerging commercial establishments locate? Cities 2019, 86, 25–36. [Google Scholar] [CrossRef]
- Hillier, B. Space is the Machine: A Configurational Theory of Architecture; Cambridge University: Cambridge, UK, 1996. [Google Scholar]
- Duan, J.; Hillier, B. Space Syntax and Urban Planning; Southeast University Press: Nanjing, China, 2007. [Google Scholar]
- Muniz, I.; Garcia-Lopez, M. Urban form and spatial structure as determinants of the ecological footprint of commuting. Transp. Res. Part D Transp. Environ. 2019, 67, 334–350. [Google Scholar] [CrossRef]
- Vasanen, A. Functional polycentricity: Examining metropolitan spatial structure through the connectivity of urban sub-centres. Urban Stud. 2012, 49, 3627–3644. [Google Scholar] [CrossRef]
- Zhong, C.; Schläpfer, M.; Müller Arisona, S.; Batty, M.; Ratti, C.; Schmitt, G. Revealing centrality in the spatial structure of cities from human activity patterns. Urban Stud. 2017, 54, 437–455. [Google Scholar] [CrossRef]
- Anas, A.; Arnott, R. Kenneth Urban Spatial Structure. J. Econ. Lit. 1998, 36, 1426–1464. [Google Scholar]
- Barnsley, M.J.; Barr, S.L. Distinguishing urban land-use categories in fine spatial resolution land-cover data using a graph-based, structural pattern recognition system. Comput. Environ. Urban 1997, 21, 209–225. [Google Scholar] [CrossRef]
- Bafna, S. Space syntax: A brief introduction to its logic and analytical techniques. Environ. Behav. 2003, 35, 17–29. [Google Scholar] [CrossRef]
- Hilbert, M.; López, P. The World’s Technological Capacity to Store, Communicate, and Compute Information. Science 2011, 332, 60–65. [Google Scholar] [CrossRef]
- Yang, T. A Study on Spatial Structure and Functional Location Choice of the Beijing City in the light of Big Data. In Proceedings of the 10th Space Syntax Symposium, London, UK, 13–17 July 2015. [Google Scholar]
- Sheng, Q.; Liu, N. Comparing the Use of Actual Space and Virtual Space: A Case Study on Beijing’s Wangfujing Area. In Proceedings of the 10th Space Syntax Symposium, London, UK, 13–17 July 2015. [Google Scholar]
- Dinda, S.; Chatterjee, N.D.; Ghosh, S. An integrated simulation approach to the assessment of urban growth pattern and loss in urban green space in Kolkata, India: A GIS-based analysis. Ecol. Indic. 2021, 121, 107178. [Google Scholar] [CrossRef]
- Allen, P.M.; Sanglier, M. A dynamic model of growth in a central place system. Geogr. Anal. 1979, 11, 256–272. [Google Scholar] [CrossRef]
- Fang, C.; Yu, X.; Zhang, X. Big data analysis on the spatial networks of urban agglomeration. Cities 2020, 102, 102735. [Google Scholar] [CrossRef]
- Boeing, G. Spatial information and the legibility of urban form: Big data in urban morphology. Int. J. Inform. Manag. 2021, 56, 102013. [Google Scholar] [CrossRef]
- Zhang, L.; Ye, Y.; Zeng, W. A Systematic Measurement of Street Quality through Multi-Sourced Urban Data: A Human-Oriented Analysis. Int. J. Environ. Res. Public Health 2019, 16, 1782. [Google Scholar] [CrossRef]
- Zhang, Y.; Xie, X.; Zhang, J. A Configurational Perspective on the Transformation of Small-and Medium-Sized Historical Towns in Zhejiang, China; Editorial Universitat Politècnica de València: Valencia, Spain, 2017. [Google Scholar]
- Chang, M.; Bus, P.; Schmitt, G. Feature Extraction and K-means Clustering Approach to Explore Important Features of Urban Identity. In Proceedings of the 16th IEEE International Conference on Machine Learning and Applications (ICMLA), Cancun, Mexico, 18–21 December 2017. [Google Scholar]
- Ren, T. Research on Design Update of Commercial Space in Community Street Based on Space Syntax Taking Yulin Community of Chengdu as an Example. In Proceedings of the 3rd International Conference on Arts, Design and Contemporary Education (ICADCE), Moscow, Russia, 29–30 May 2017. [Google Scholar]
- Sheng, Q.; Jiao, J. Understanding the Impact of Street Patterns on Pedestrian Distribution: A Case Study in Tianjin. In Proceedings of the 12th Space Syntax Symposium, Beijing, China, 8–13 July 2019. [Google Scholar]
- Ye, Y.; Van Nes, A. Quantitative tools in urban morphology: Combining space syntax, spacematrix, and mixed-use index in a GIS framework. Urban Morphol. 2014, 18, 9. [Google Scholar]
- Zhang, X.; Steeneveld, G.; Zhou, D. A diagnostic equation for the maximum urban heat island effect of a typical Chinese city: A case study for Xi’an. Build. Environ. 2019, 158, 39–50. [Google Scholar] [CrossRef]
- Xie, Y.; Ward, R.; Fang, C. The urban system in West China: A case study along the mid-section of the ancient Silk Road—He-Xi Corridor. Cities 2007, 24, 60–73. [Google Scholar] [CrossRef]
- Yang, Y.; Jia, Y.; Ling, S.; Yao, C. Urban natural resource accounting based on the system of environmental economic accounting in Northwest China: A case study of Xi’an. Ecosyst. Serv. 2021, 47, 10233. [Google Scholar] [CrossRef]
- The Municipal People’s Government of Xi’an. Available online: http://www.xa.gov.cn/sq/csgk/rkzk/5d4907af65cbd87465a5f024.html (accessed on 30 January 2021).
- Song, H.; Deng, S.; Lu, Z.; Li, J.; Ba, L.; Wang, J.; Sun, Z.; Li, G.; Jiang, C.; Hao, Y. Scenario analysis of vehicular emission abatement procedures in Xi’an, China. Environ. Pollut. 2021, 269, 116187. [Google Scholar] [CrossRef]
- The Communiqué on China’s Ecological Environment in 2017. Available online: http://www.mee.gov.cn/xxgk2018/xxgk/xxgk15/201912/t20191231_754132.html (accessed on 30 January 2021).
- Jiang, B.; Claramunt, C. Integration of space syntax into GIS:new perspectives for urban morphology. Trans. GIS 2002, 6, 295–309. [Google Scholar] [CrossRef]
- Yang, T.; Hillier, B. The fuzzy boundary: The spatial definition of urban areas. In Proceedings of the 6th International Space Syntax Symposium, Istanbul, Turkey, 12–15 June 2007; pp. 1–16. [Google Scholar]
- Jiang, B. SimPed: Simulating Pedestrian Flows in a Virtual Urban Environment. J. Geogr. Inf. Decis. Anal. 1999, 3, 21–30. [Google Scholar]
- Jiang, B.; Claramunt, C. Topological analysis of urban street networks. Environ. Plan B-Urban 2004, 31, 151–162. [Google Scholar] [CrossRef]
- Hillier, B.; Yang, T.; Turner, A. Advancing depthmap to advance our understanding of cities. In Proceedings of the 8th International Space Syntax Symposium, Santiago, Chile, 3–6 January 2012; Pontificia Universidad Catolica de Chile: Santiago, Chile, 2006. [Google Scholar]
- Burger, M.J.; Meijers, E.J.; Van Oort, F.G. Regional Spatial Structure and Retail Amenities in the Netherlands. Reg Stud. 2013, 48, 1972–1992. [Google Scholar] [CrossRef]
- Li, X.; Lv, Z.; Zheng, Z.; Zhong, C.; Hijazi, I.H.; Cheng, S. Assessment of lively street network based on geographic information system and space syntax. Multimed. Tools Appl. 2015, 76, 17801–17819. [Google Scholar] [CrossRef]
- Yang, T. Morphological transformation of the Old City of Beijing after 1949. In Proceedings of the 3rd Great Asian Street Symposium, Singapore, 31 August 2004; National University of Singapore: Singapore, 2004. [Google Scholar]
- Sayed, K.A.; Turner, A.; Hillier, B.; Iida, S.; Penn, A.; Shibo, G.; Yang, T. Segment Analysis & Advanced Axial and Segment Analysis: Chapter 5 & 6 of Space Syntax Methodology: A Teaching Companion. Urban Des. 2016, 1, 32–35. [Google Scholar]
- Dalton, N.S. Fractional configuration analysis and a solution to the Manhattan problem. In Proceedings of the 3rd International Symposium on Space Syntax, Atlanta, GA, USA, 7–11 May 2001; Georgia Institute of Technology: Atlanta, GA, USA, 2001. [Google Scholar]
- Dalton, N.S.; Peponis, J.; Dalton, R. To tame a TIGER one has to know its nature: Extending weighted angular integration analysis to the description of GIS road-centerline data for large scale urban analysis. In Proceedings of the 4th International Space Syntax Symposium, London, UK, 17–19 June 2003; University College London: London, UK, 2003. [Google Scholar]
- Hillier, B.; Iida, S. Network and psychological effects in urban movement. In Proceedings of Spatial Information Theory, Ellicottville, NY, USA, 14–18 September 2005; Springer: Berlin/Heidelberg, Germany, 2005. [Google Scholar]
- Turner, A. Angular analysis. In Proceedings of the 3rd International Symposium on Space Syntax, Atlanta, GA, USA, 7–11 May 2001. [Google Scholar]
- Kuldeep, K. SPSS for Applied Sciences: Basic Statistical Testing. J. Royal Stat. Soc. 2014, 177, 990. [Google Scholar]
- Susan, S. Quantitative Data Analysis with IBM SPSS 17,18 & 19: A Guide for Social Scientists. Int. Stat. Rev. 2012, 80, 334–335. [Google Scholar]
- Faisel, Y. Statistics Using SPSS: An Integrative Approach, second edition. J. Appl. Stat. 2010, 37, 2119–2120. [Google Scholar]
- Hillier, B.; Hanson, J. The Social Logic of Space; Cambridge University Press: Cambridge, UK, 1984. [Google Scholar]
- Hillier, B.; Turner, A.; Yang, T. Metric and topogeometric properties of urban street networks: Some convergences, divergences and new results. J. Space Syntax Stud. 2009, 1, 279. [Google Scholar]


| Variables | Formula | Parameter | Meaning |
|---|---|---|---|
| Choice | Where djk is the shortest path between the j-th line and the k-th line, djk(i) is the shortest path including the i-th line between the j-th line and the kth line. | The greater the value, the greater the possibility the space is crossed. | |
| Integration | n is the total number of nodes in the connection diagram, MDi is the average depth value | Greater integration means higher traffic accessibility, stronger centrality, and a more convenient street space. | |
| Complex Variable | It is the integration value of the i-th part space, Ci is the number of spaces intersecting with the i-th part of the space | The larger the complex variable, the greater the potential that the street space will become a spatial activity center. |
| Scale Class | Radius |
|---|---|
| Small and medium scale | 800 m/1200 m/1600 m/2000 m/2400 m/ 2800 m/3200 m/3600 m |
| Large scale | 5 km/10 km/15 km/20 km/25 km/30 km/35 km |
| Global scale | n |
| Relationship Measurement Unit | Commercial Distribution Measurement Metric | Urban Morphology Measurement Metric |
|---|---|---|
| 500 m × 500 m grid | Log value of the total number of POIs within the measurement unit | The mean value of C The mean value of I The mean value of CV |
| Urban street block | Log value of the total number of POIs within the measurement unit | The max value of C The max value of I The max value of CV The mean value of C The mean value of I The mean value of CV The total value of C The total value of I The total value of CV |
| Number of Line Segments within the Study Area | Max MD | Min MD | Mean MD |
|---|---|---|---|
| 2477 | 22.132 km | 0.966 km | 12.147 km |
Publisher’s Note: MDPI stays neutral with regard to jurisdictional claims in published maps and institutional affiliations. |
© 2021 by the authors. Licensee MDPI, Basel, Switzerland. This article is an open access article distributed under the terms and conditions of the Creative Commons Attribution (CC BY) license (http://creativecommons.org/licenses/by/4.0/).
Share and Cite
Liang, F.; Liu, J.; Liu, M.; Zeng, J.; Yang, L.; He, J. Scale-Dependent Impacts of Urban Morphology on Commercial Distribution: A Case Study of Xi’an, China. Land 2021, 10, 170. https://doi.org/10.3390/land10020170
Liang F, Liu J, Liu M, Zeng J, Yang L, He J. Scale-Dependent Impacts of Urban Morphology on Commercial Distribution: A Case Study of Xi’an, China. Land. 2021; 10(2):170. https://doi.org/10.3390/land10020170
Chicago/Turabian StyleLiang, Fan, Jianhong Liu, Mingxing Liu, Jingchao Zeng, Liu Yang, and Jianxiong He. 2021. "Scale-Dependent Impacts of Urban Morphology on Commercial Distribution: A Case Study of Xi’an, China" Land 10, no. 2: 170. https://doi.org/10.3390/land10020170
APA StyleLiang, F., Liu, J., Liu, M., Zeng, J., Yang, L., & He, J. (2021). Scale-Dependent Impacts of Urban Morphology on Commercial Distribution: A Case Study of Xi’an, China. Land, 10(2), 170. https://doi.org/10.3390/land10020170