Changes in Vegetation of Flooded Savannas Subject to Cattle Grazing and Fire in Plains of Colombia

 ,
, 
 ,
,  ,
,  and
and
Abstract
1. Introduction
2. Methods
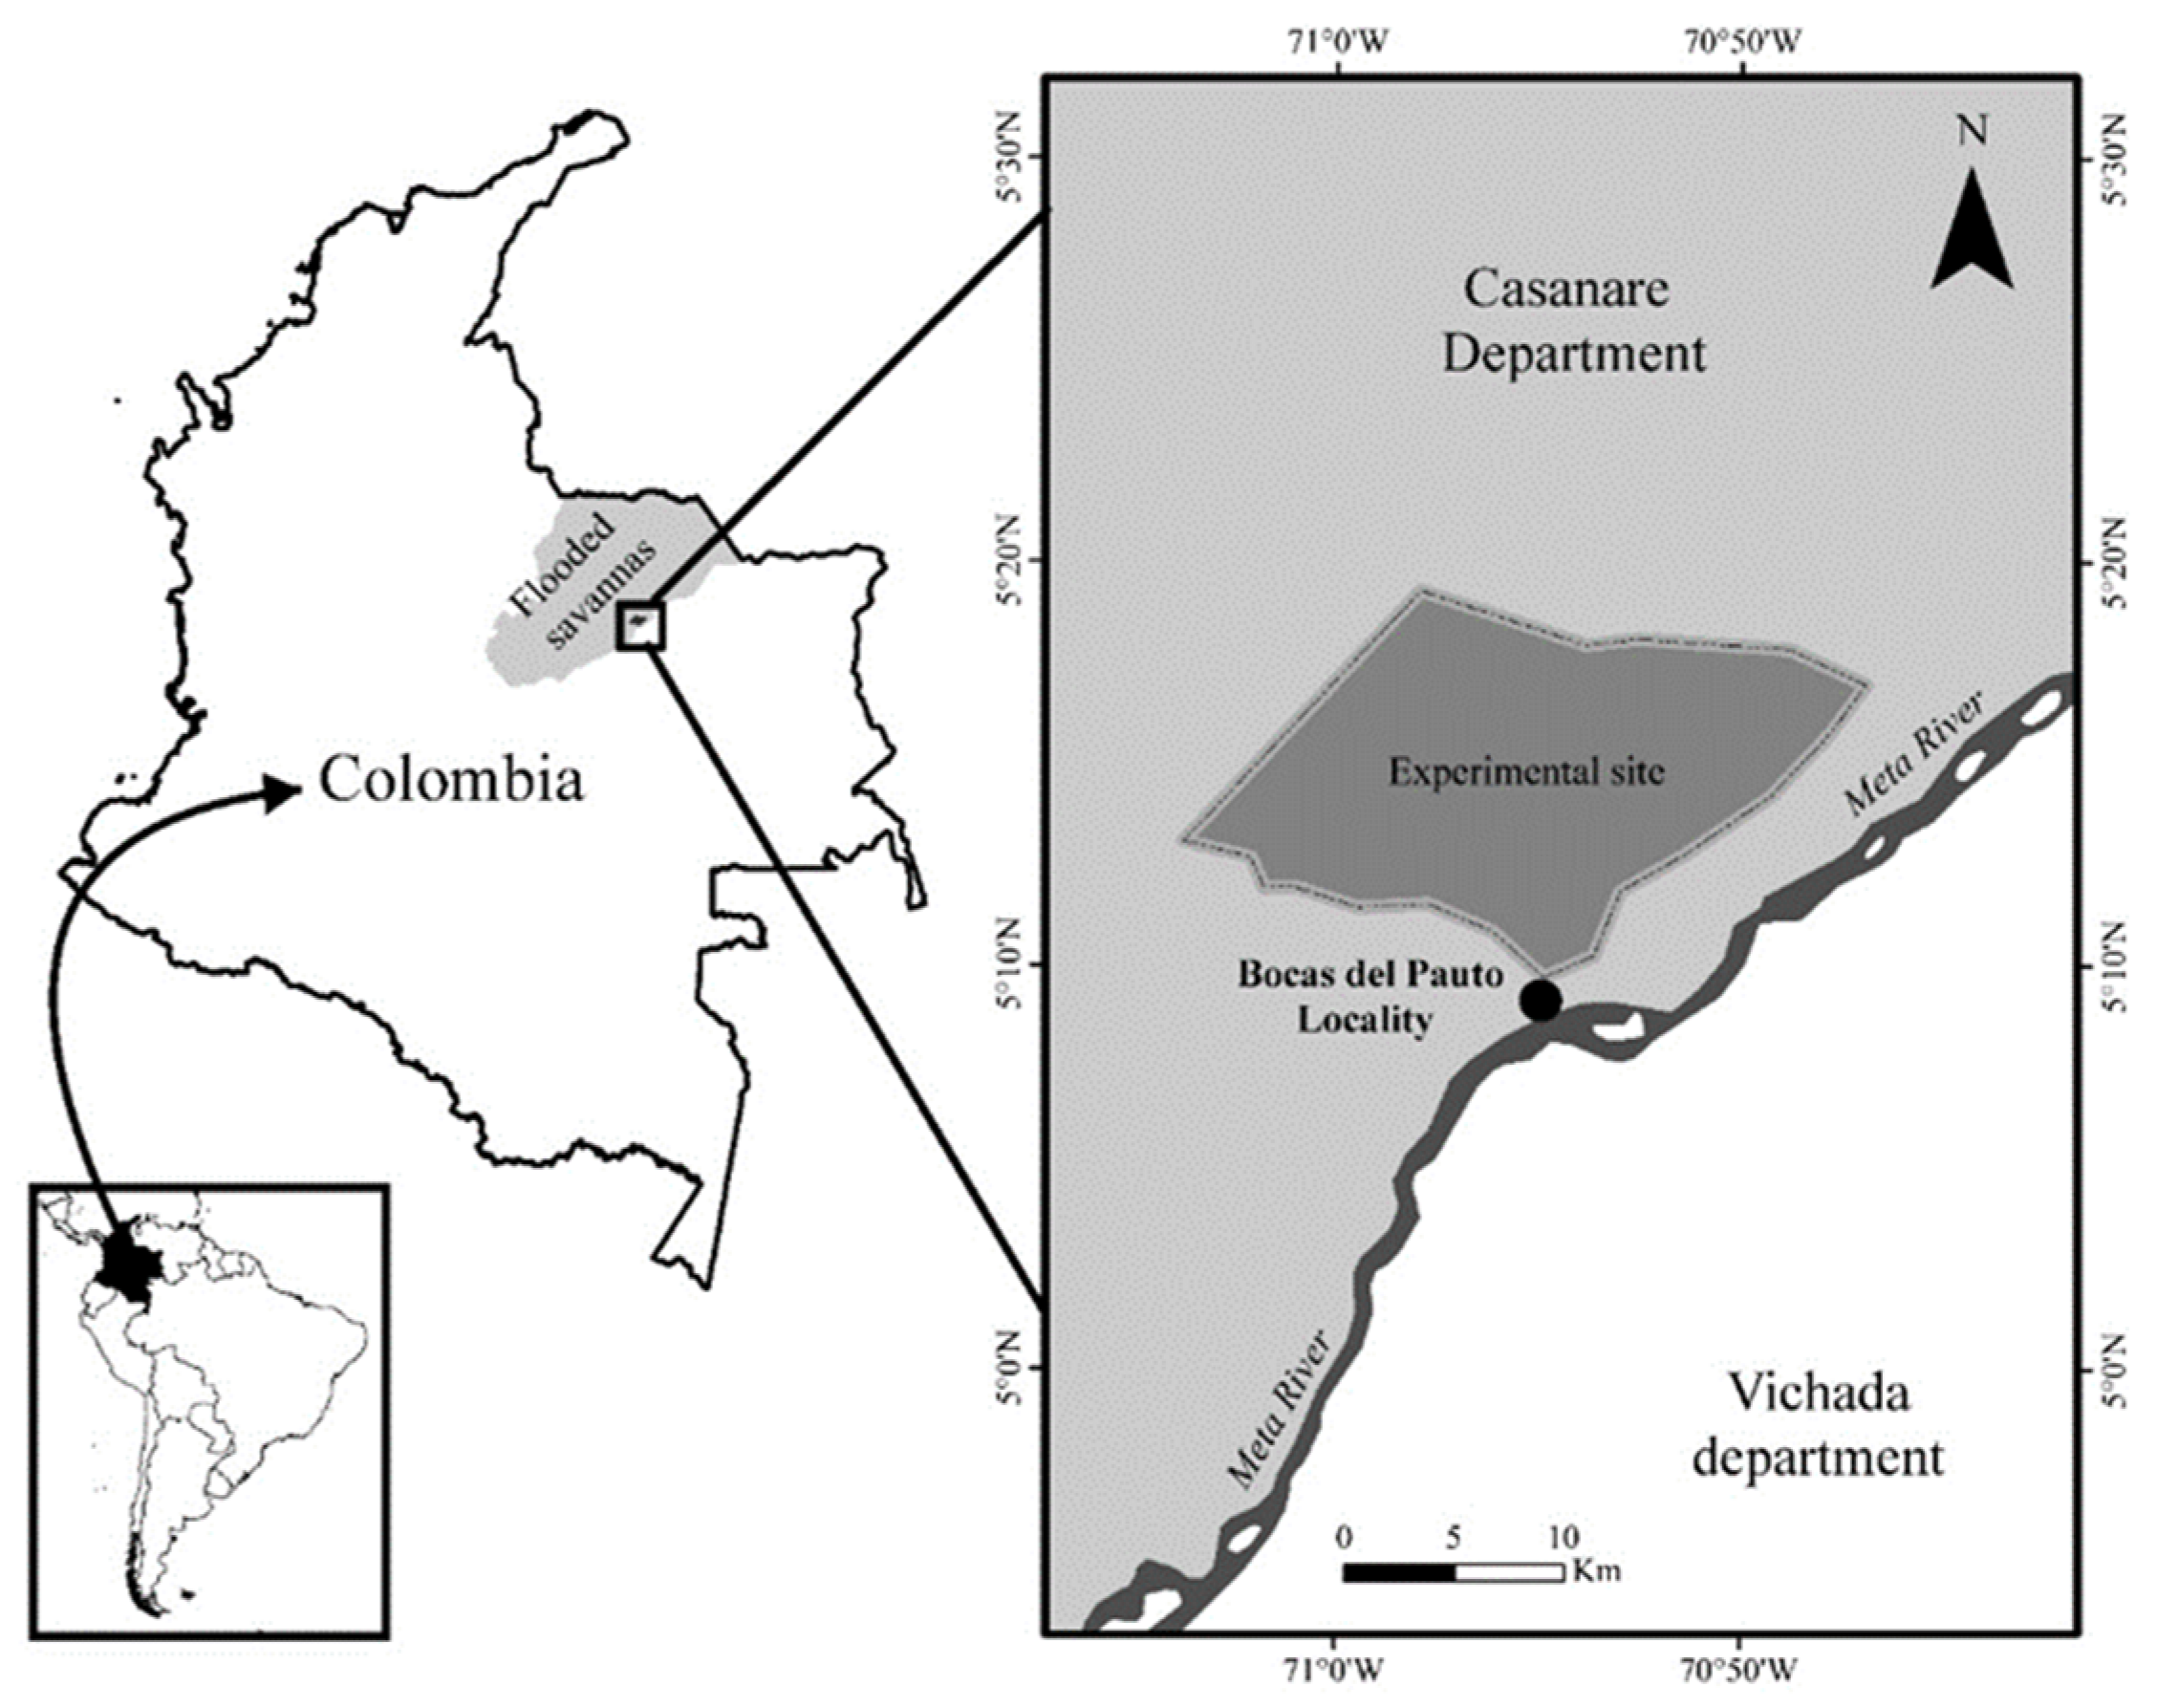
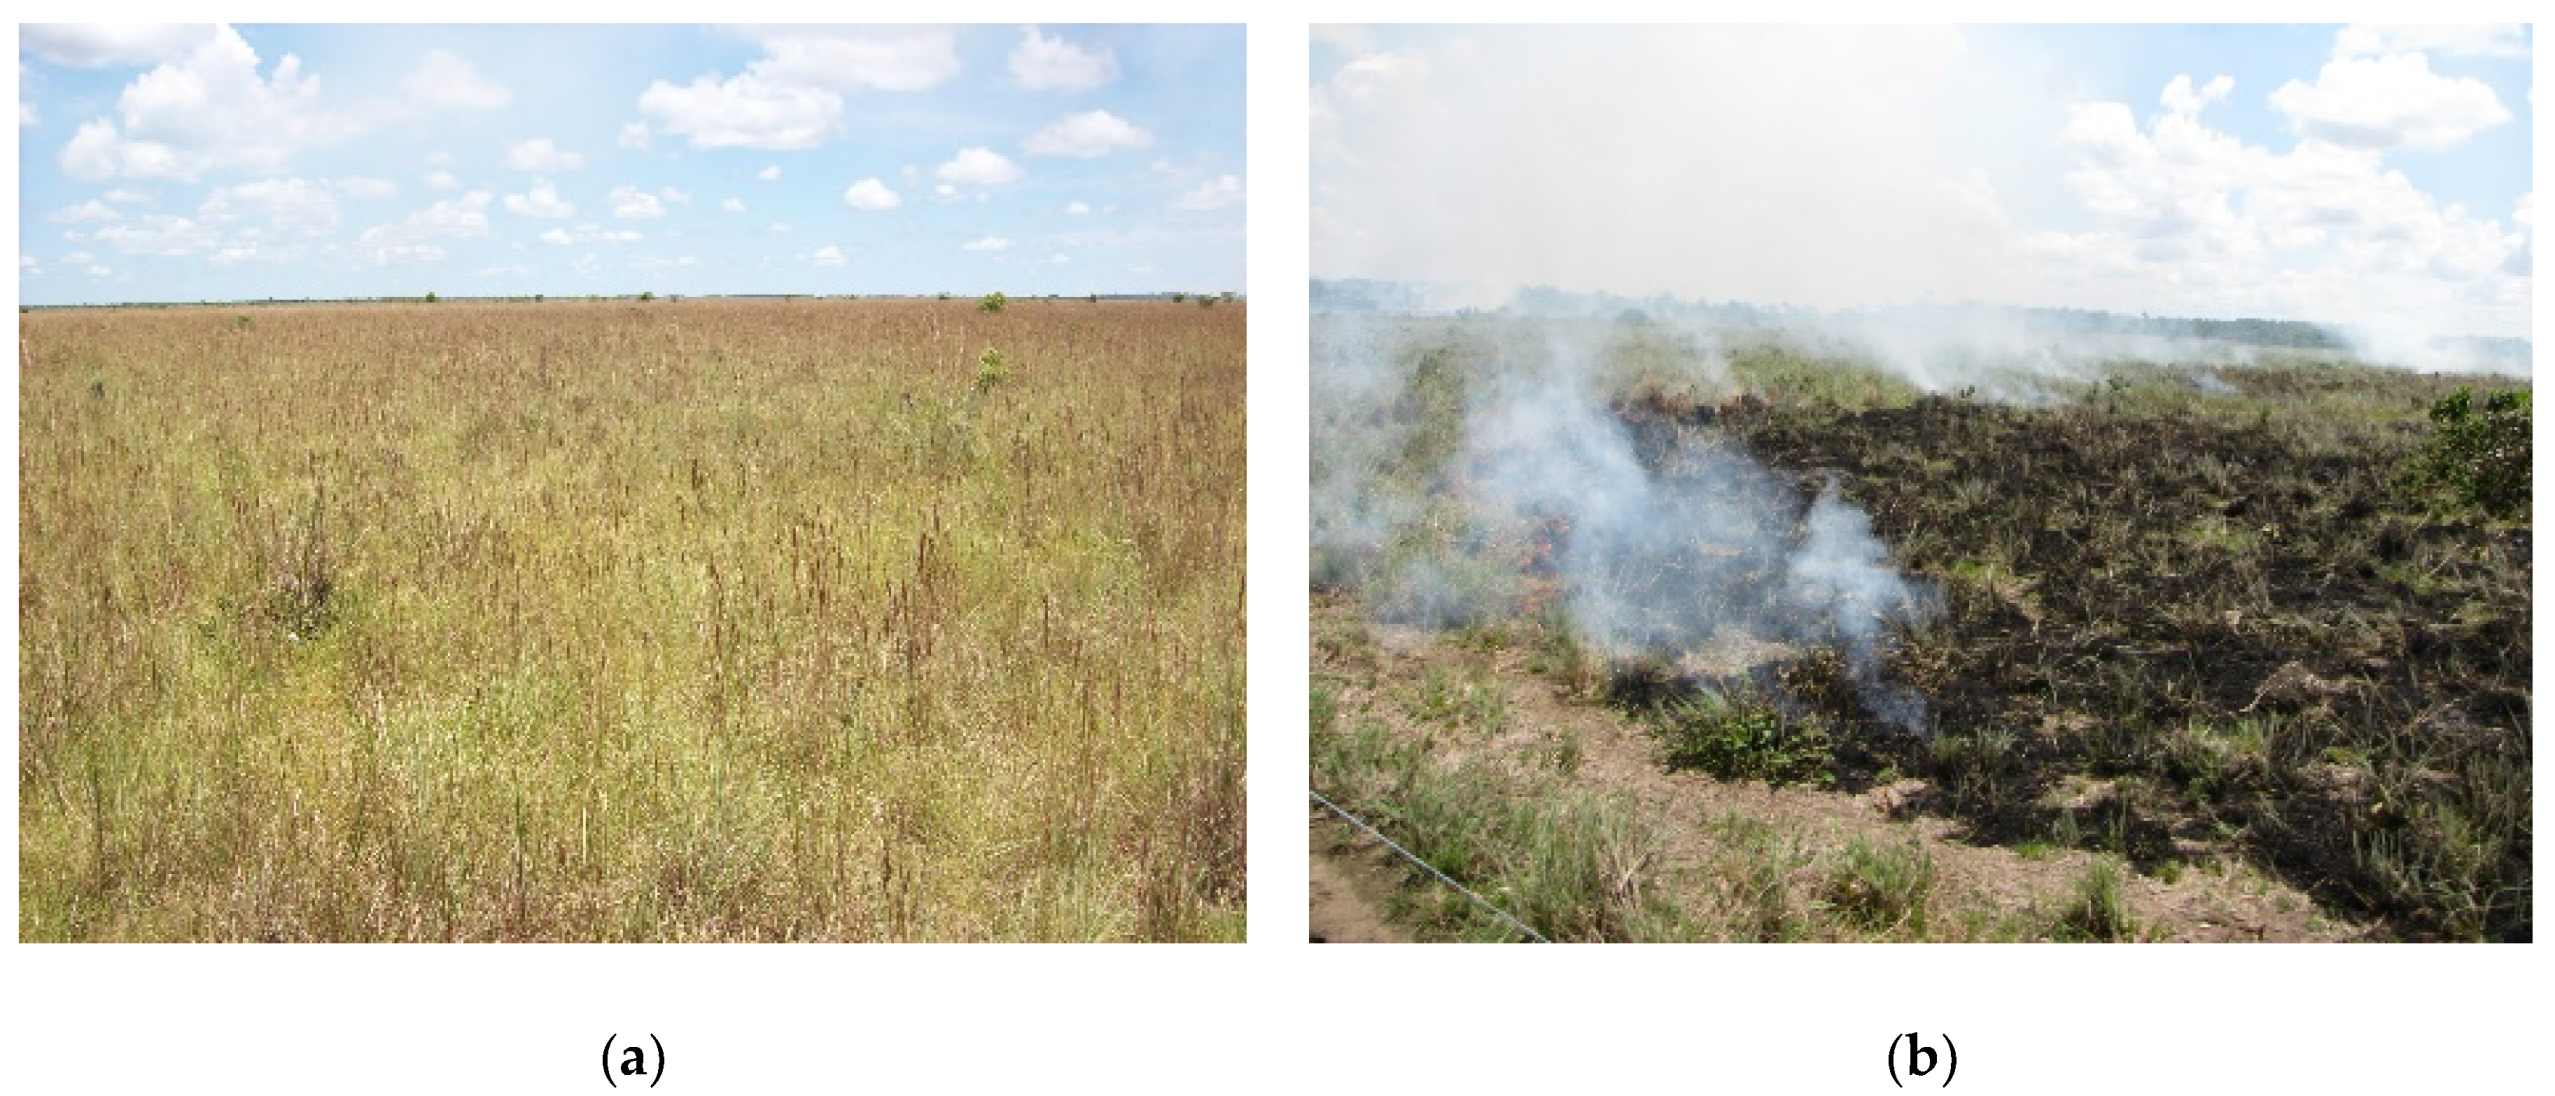
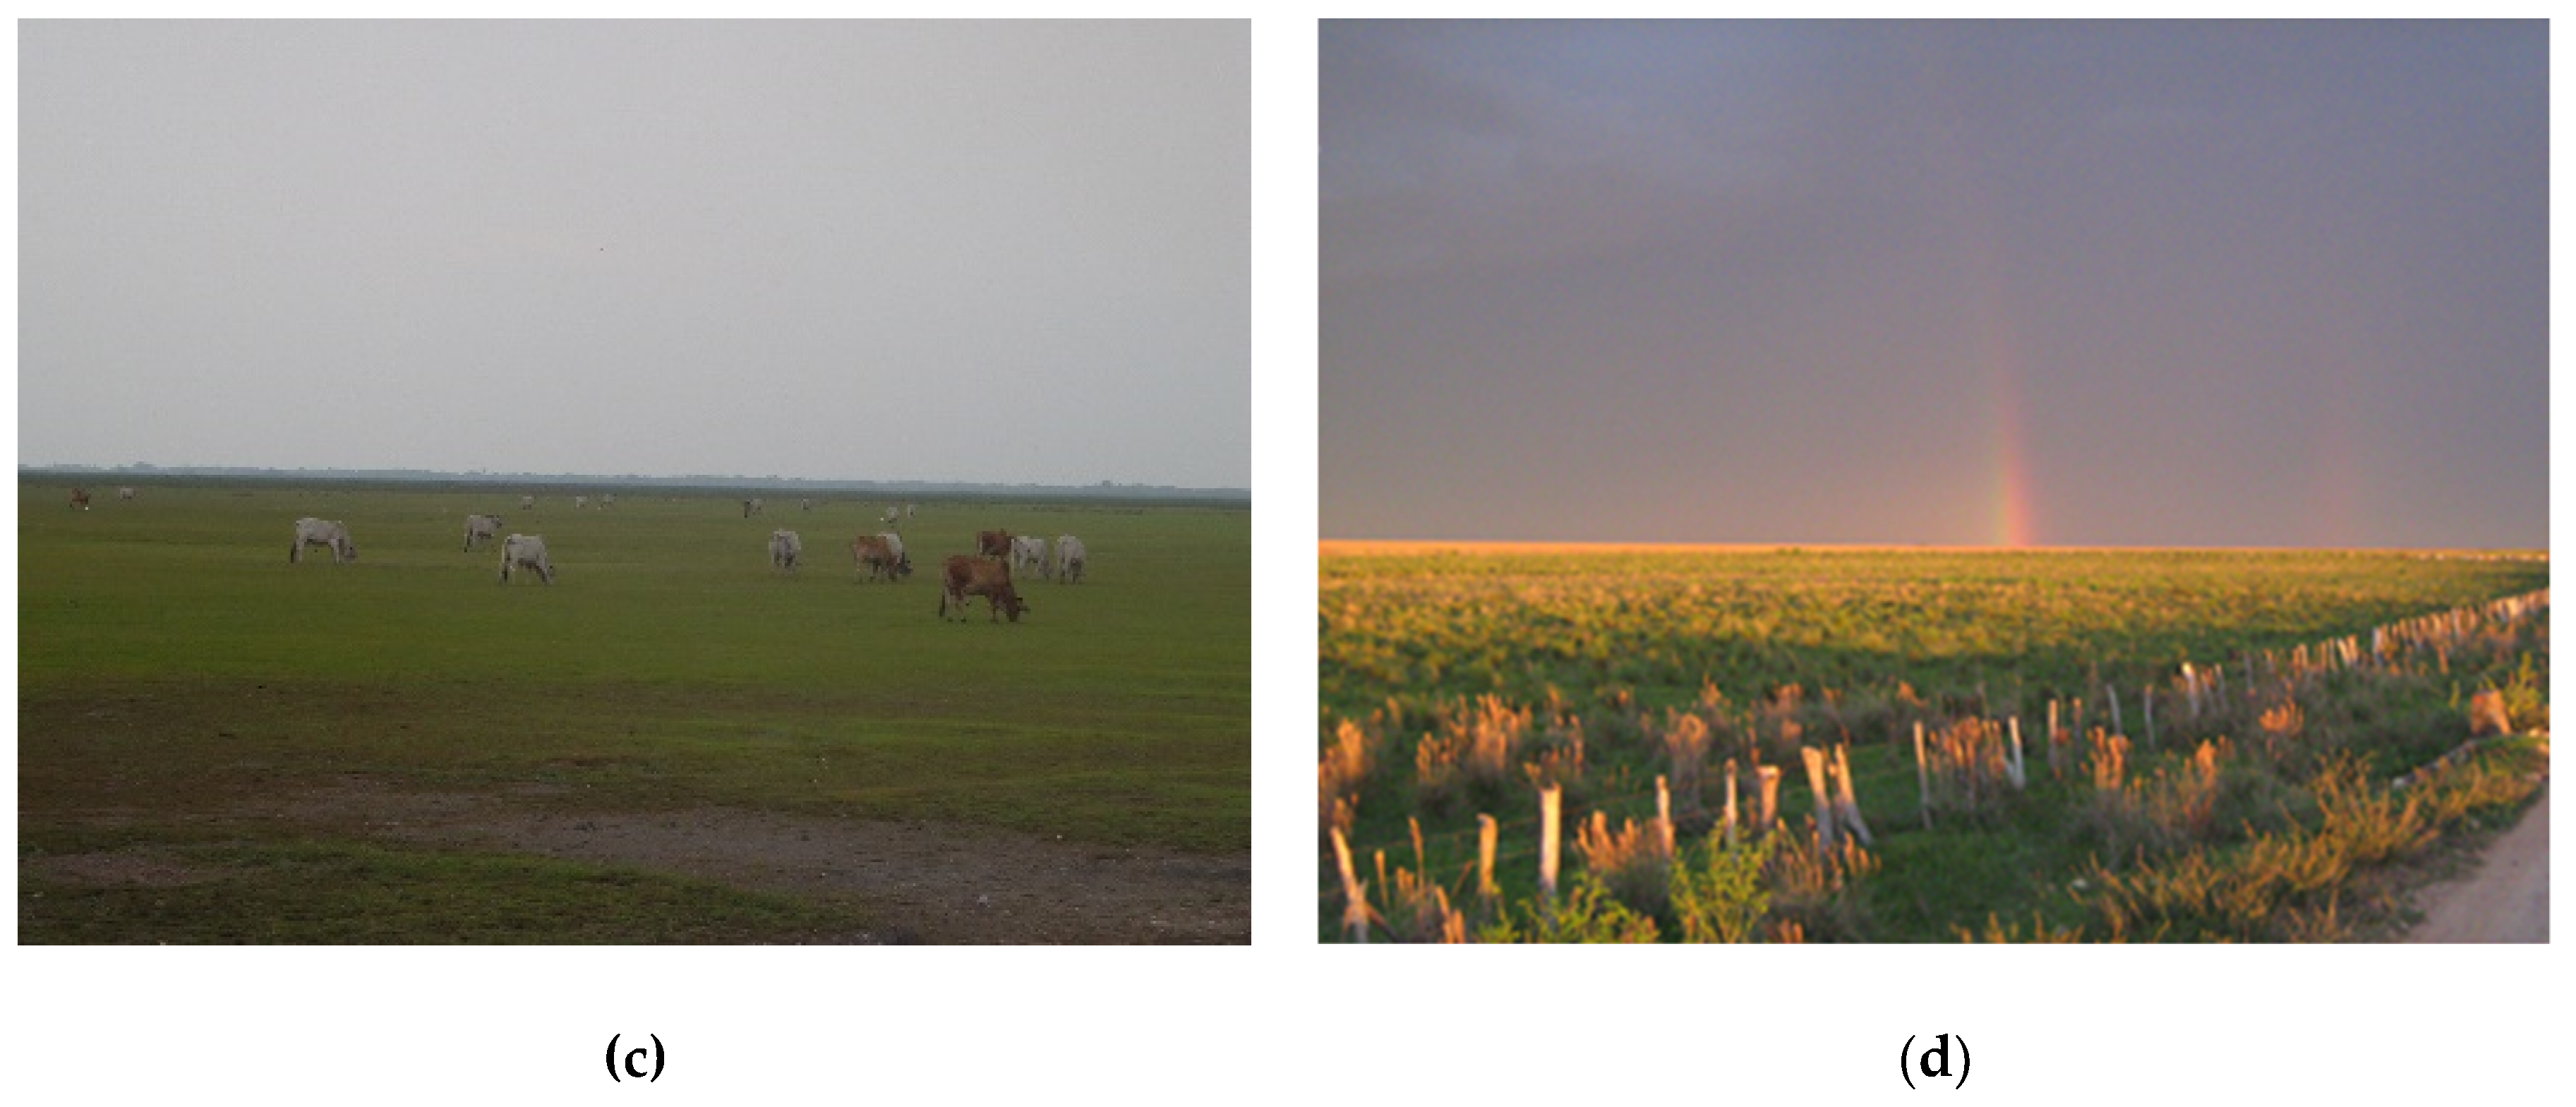
2.1. Study Site
2.2. Treatment Characterization and Data Acquisition
2.3. Data Analysis
3. Results
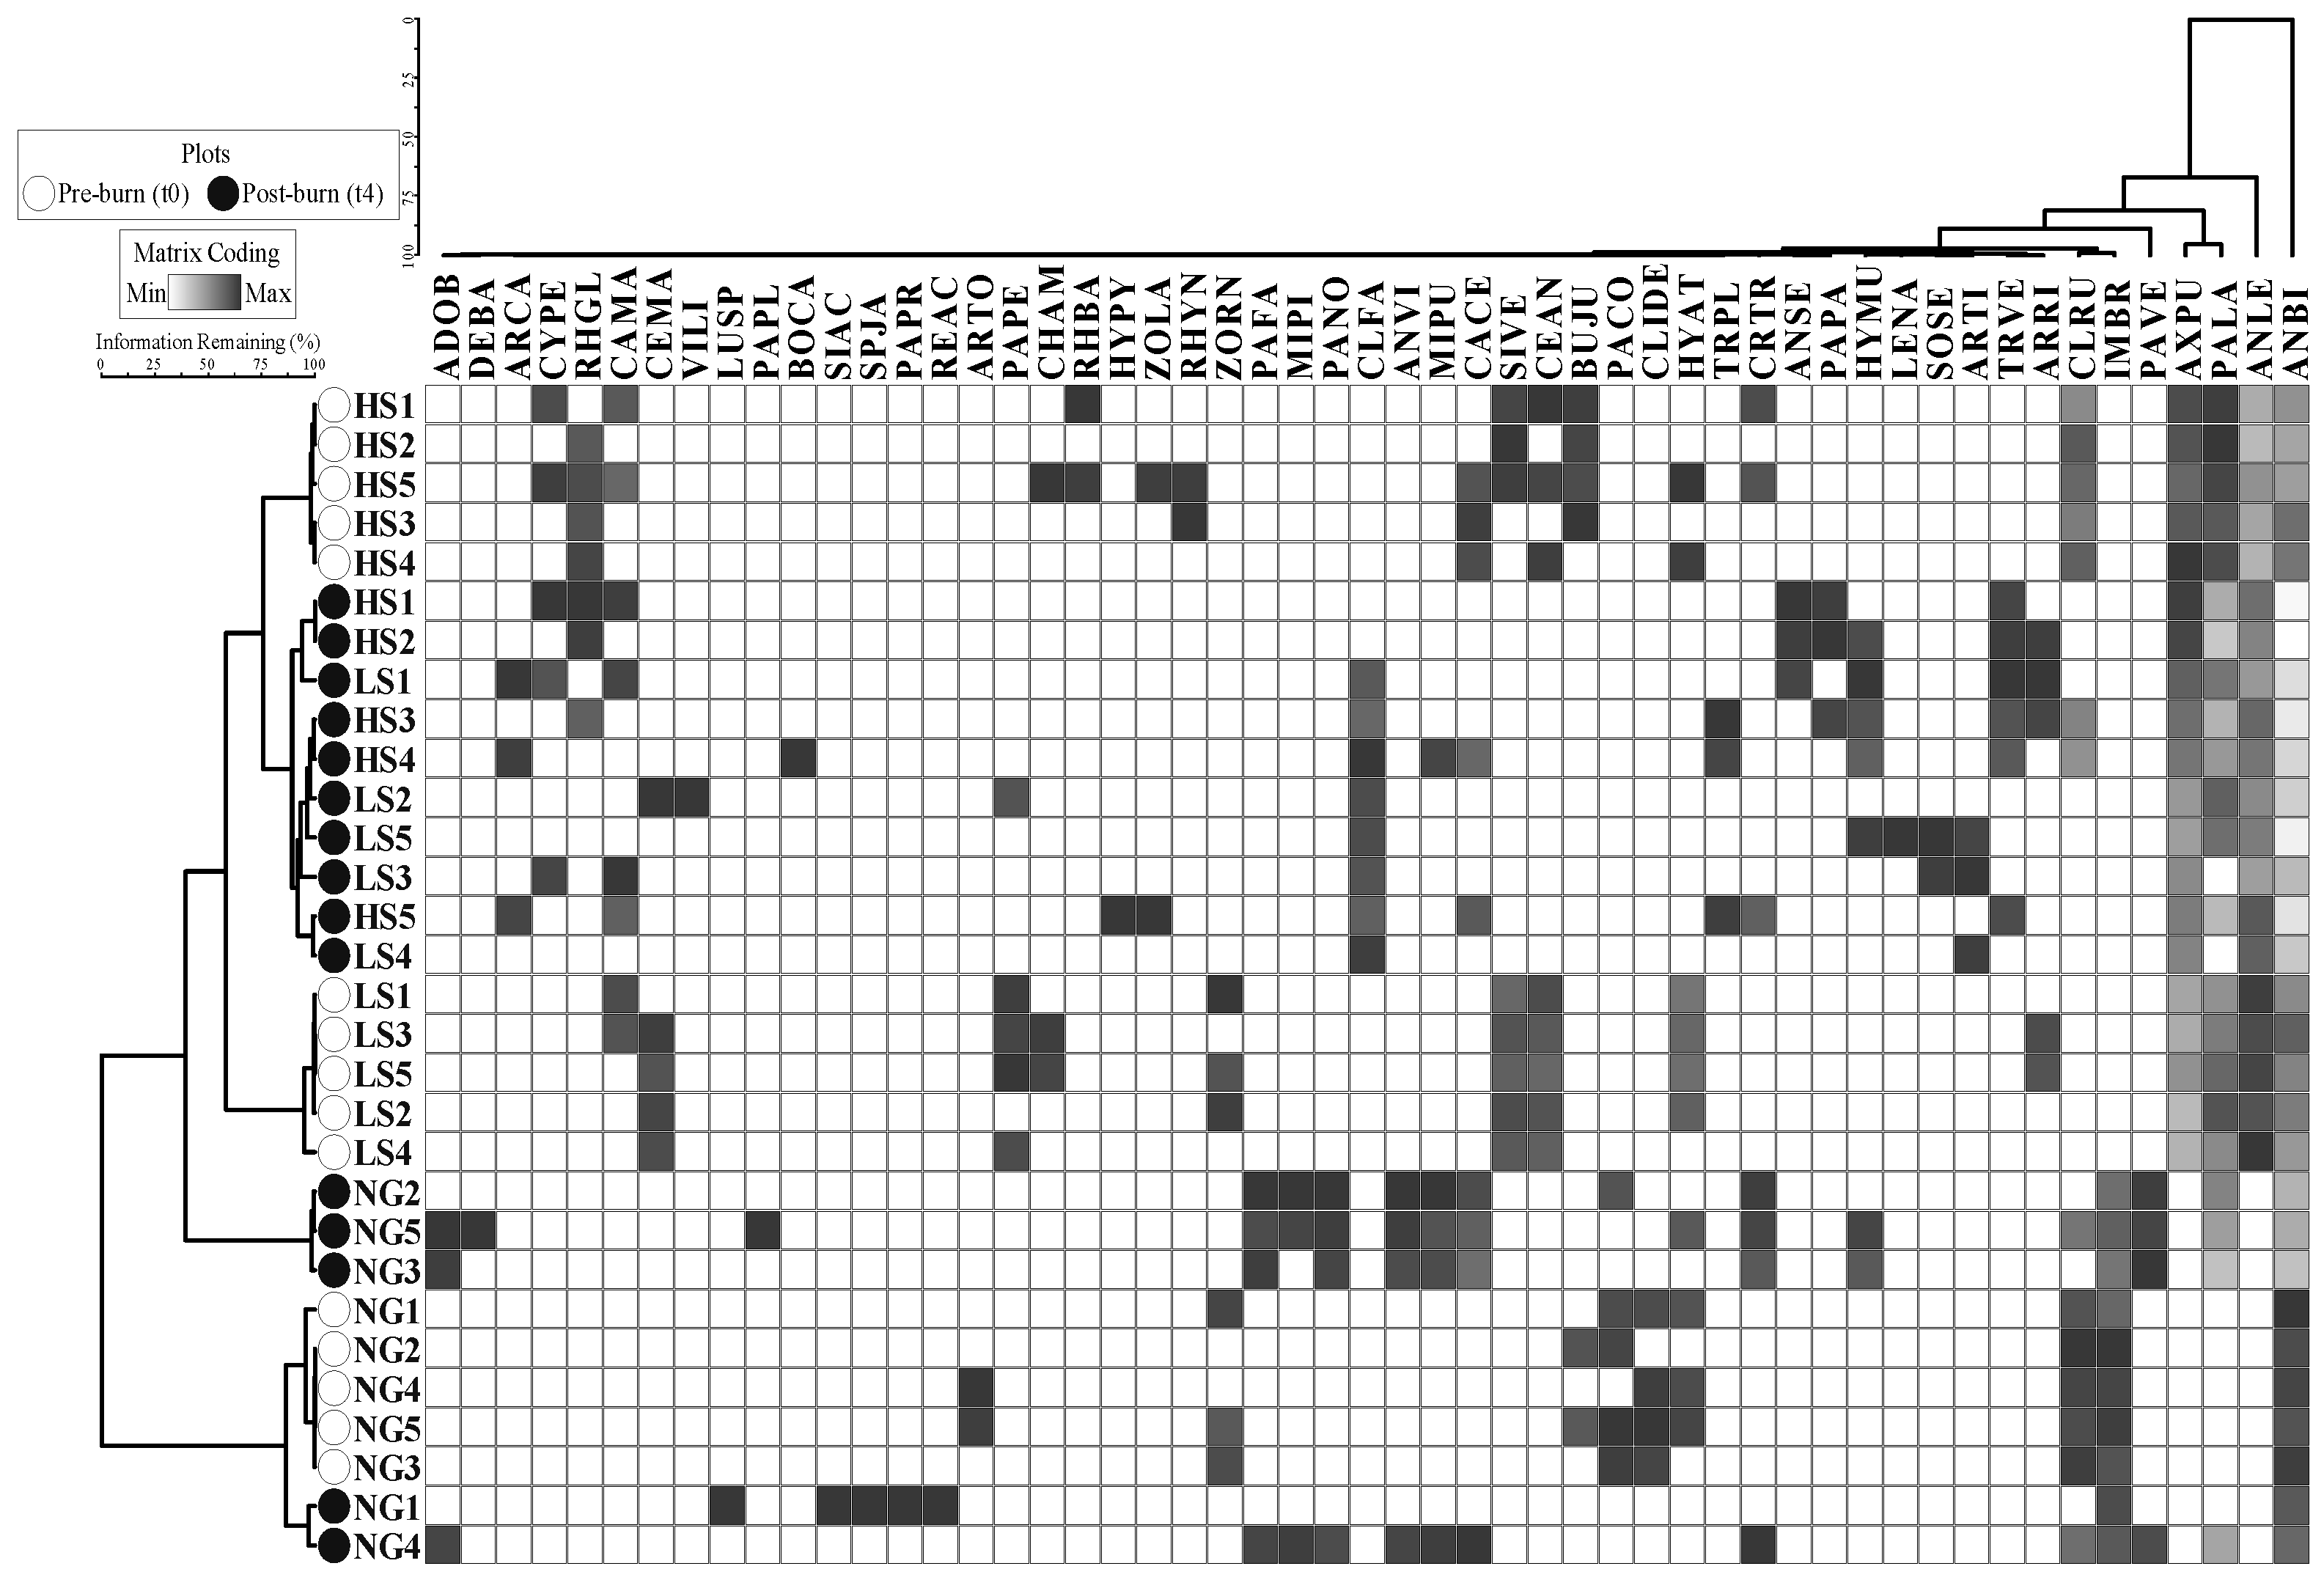
3.1. Composition of Vascular Plant Assemblages
3.2. Vegetation Response to Differential Cattle Stocking Rates and Burning
3.3. Exclusive and Shared Plant Species among Grazing Treatments
4. Discussion
4.1. Vascular Plant Assemblages before and after Burning
4.2. The Effects of Burning and Previous Grazing Intensity on Vegetation Composition and Structure
4.3. The Role of Grazing and Burning Management
5. Conclusions
Supplementary Materials
Author Contributions
Funding
Institutional Review Board Statement
Informed Consent Statement
Data Availability Statement
Acknowledgments
Conflicts of Interest
References
- Mbow, C.; Nielsen, T.T.; Rasmussen, K. Savanna fires in east-central Senegal: Distribution patterns, resource management and perceptions. Hum. Ecol. 2000, 28, 561–583. [Google Scholar] [CrossRef]
- Mistry, J.; Berardi, A.; Andrade, V.; Krahô, T.; Krahô, P.; Leonardos, O. Indigenous fire management in the cerrado of Brazil: The case of the Krahô of Tocantíns. Hum. Ecol. 2005, 33, 365–386. [Google Scholar] [CrossRef]
- Burgess, E.E.; Moss, P.; Haseler, M.; Maron, M. The influence of a variable fire regime on woodland structure and composition. Int. J. Wildland Fire 2015, 24, 59–69. [Google Scholar] [CrossRef]
- Abreu, R.C.; Hoffmann, W.A.; Vasconcelos, H.L.; Pilon, N.A.; Rossatto, D.R.; Durigan, G. The biodiversity cost of carbon sequestration in tropical savanna. Sci. Adv. 2017, 3, e1701284. [Google Scholar] [CrossRef] [PubMed]
- Bowman, D.M.; Balch, J.K.; Artaxo, P.; Bond, W.J.; Carlson, J.M.; Cochrane, M.A.; D’Antonio, C.M.; DeFries, R.S.; Doyle, J.C.; Harrison, S.P. Fire in the Earth system. Science 2009, 324, 481–484. [Google Scholar] [CrossRef]
- Rodríguez-Trejo, D.A.; Pausas, J.G.; Miranda-Moreno, A.G. Plant responses to fire in a Mexican arid shrubland. Fire Ecol. 2019, 15, 11. [Google Scholar] [CrossRef]
- Rodríguez, I. Pemon perspectives of fire management in Canaima National Park, southeastern Venezuela. Hum. Ecol. 2007, 35, 331–343. [Google Scholar] [CrossRef]
- Romero-Ruiz, M.; Flantua, S.; Tansey, K.; Berrio, J. Landscape transformations in savannas of northern South America: Land use/cover changes since 1987 in the Llanos Orientales of Colombia. App. Geo. 2012, 32, 766–776. [Google Scholar] [CrossRef]
- Hoogesteijn, A.; Hoogesteijn, R. Cattle ranching and biodiversity conservation as allies in South America’s flooded savannas. Great Plains Res. 2010, 20, 37–50. Available online: http://digitalcommons.unl.edu/greatplainsresearch (accessed on 10 March 2020).
- Carriazo, F.; Labarta, R.; Escobedo, F.J. Incentivizing sustainable rangeland practices and policies in Colombia’s Orinoco region. Land Use Policy 2019, 95, 104203. [Google Scholar] [CrossRef]
- Lipsett-Moore, G.J.; Wolff, N.H.; Game, E.T. Emissions mitigation opportunities for savanna countries from early dry season fire management. Nat. Commun. 2018, 9, 2247. [Google Scholar] [CrossRef] [PubMed]
- Phalan, B.; Onial, M.; Balmford, A.; Green, R.E. Reconciling food production and biodiversity conservation: Land sharing and land sparing compared. Science 2011, 333, 1289–1291. [Google Scholar] [CrossRef]
- Török, P.; Valkó, O.; Deák, B.; Kelemen, A.; Tóthmérész, B. Traditional cattle grazing in a mosaic alkali landscape: Effects on grassland biodiversity along a moisture gradient. PLoS ONE 2014, 9, e97095. [Google Scholar] [CrossRef] [PubMed]
- Török, P.; Hölzel, N.; van Diggelen, R.; Tischew, S. Grazing in European open landscapes: How to reconcile sustainable land management and biodiversity conservation? Agr. Ecosys. Environ. 2016, 234, 1–4. [Google Scholar] [CrossRef]
- Malan, J.-A.C.; Flint, N.; Jackson, E.L.; Irving, A.D.; Swain, D.L. Environmental factors influencing cattle’s water consumption at offstream watering points in rangeland beef cattle. Livest. Sci. 2020, 231, 103868. [Google Scholar] [CrossRef]
- Treydte, A.C.; Baumgartner, S.; Heitkönig, I.M.A.; Grant, C.C.; Getz, W.M. Herbaceous Forage and Selection Patterns by Ungulates across Varying Herbivore Assemblages in a South African Savanna. PLoS ONE 2013, 8, e82831. [Google Scholar] [CrossRef] [PubMed]
- Peñuela, L.; Fernández, A.; Castro, F.; Ocampo, A. Uso y Manejo de Forrajes Nativos en la Sabana Inundable de la Orinoquía, 1st ed.; The Nature Conservancy: Bogotá, Colombia; Fundación Horizonte verde: Bogotá, Colombia; Fundación Biodiversa de España y Corporinoquía: Bogotá, Colombia, 2011; pp. 4–66. [Google Scholar]
- Peñuela, L.; Solano, C.; Ardila, V.; Galán, S. Sabana Inundable y Ganadería, Opción Productiva de Conservación en la Orinoquia, 1st ed.; Fundación Natura: Bogotá, Colombia, 2014; pp. 27–230. [Google Scholar]
- Olson, D.M.; Dinerstein, E. The Global 200: Priority ecoregions for global conservation. Ann. Missouri. Bot. Gard. 2002, 89, 199–224. [Google Scholar] [CrossRef]
- Hurtley, S. Surveying Savannas. Science 2014, 343, 460. [Google Scholar] [CrossRef]
- Robinson, T.P.; Wint, G.R.W.; Conchedda, G.; Van Boeckel, T.P.; Ercoli, V.; Palamara, E.; Cinardi, G.; D’Aietti, L.; Hay, S.I.; Gilbert, M. Mapping the Global Distribution of Livestock. PLoS ONE 2014, 9, e96084. [Google Scholar] [CrossRef]
- Gilbert, M.; Nicolas, G.; Cinardi, G.; Van Boeckel, T.P.; Vanwambeke, S.O.; Wint, G.R.W.; Robinson, T.P. Global distribution data for cattle, buffaloes, horses, sheep, goats, pigs, chickens and ducks in 2010. Sci. Data 2018, 5, 180227. [Google Scholar] [CrossRef]
- Blydenstein, J. Tropical Savanna Vegetation of the Llanos of Colombia. Ecology 1967, 48, 1–15. [Google Scholar] [CrossRef]
- Esquivel, A.; Llanos-Herrera, L.; Agudelo, D.; Prager, S.D.; Fernandes, K.; Rojas, A.; Valencia, J.J.; Ramirez-Villegas, J. Predictability of seasonal precipitation across major crop growing areas in Colombia. Clim. Serv. 2018, 12, 36–47. [Google Scholar] [CrossRef]
- Huertas Herrera, A.; Baptiste Ballera, B.L.G.; Toro Manríquez, M.; Huertas Ramírez, H. Manejo de la quema de pastizales de sabana inundable: Una mirada del pueblo originario Sáliva en Colombia. Chungará 2019, 51, 1. [Google Scholar] [CrossRef]
- FAO-UNESCO. Soil Map of the World: Revised Legend. World Soil Resources Report 60; Food and Agriculture Organization of the United Nations: Rome, Italy, 1988. [Google Scholar]
- Rippstein, G.; Escobar, G.; Motta, F. Agroecología y Biodiversidad de las Sabanas en los Llanos Orientales de Colombia, 1st ed.; CIAT: Cali, Colombia, 2001. [Google Scholar]
- Escobar, E.; Belarcázar, J.; Rippstein, G. Clave de las Principales Plantas de Sabana de la Altillanura de los Llanos Orientales en Carimagua, Meta, Colombia, 1st ed.; CIAT: Cali, Colombia, 1993. [Google Scholar]
- Braun-Blanquet, J. Fitosociología: Bases Para el Estudio de las Comunidades Vegetales; Ed Blume: Madrid, España, 1979. [Google Scholar]
- Adamson, R.S. The Classification of Life-Forms of Plants. Bot. Rev. 1939, 5, 546–561. [Google Scholar] [CrossRef]
- Gimingham, C.H. The Use of Life Form and Growth Form in the Analysis of Community Structure as Illustrated by a Comparison of Two Dune Communities. J. Ecol. 1951, 39, 396–406. [Google Scholar] [CrossRef]
- ter Braak, C.J.; Šmilauer, P. Topics in constrained and unconstrained ordination. Plant. Ecol. 2015, 216, 683–696. [Google Scholar] [CrossRef]
- McCune, B.; Mefford, M.J. Multivariate Analysis of Ecological Data, Version 4.0; MjM software Design: Gleneden Beach, OR, USA, 1999. [Google Scholar]
- Willott, S.J. The effects of selective logging on the distribution of moths in a Bornean rainforest. Phil. Trans. R Soc. Lond. B 1999, 354, 1783–1790. [Google Scholar] [CrossRef]
- César, R.G.; Viani, R.A.G.; Silva Candido da, M.; Brancalion, P.H.S. Does a native grass (Imperata brasiliensis Trin.) limit tropical forest restoration like an alien grass (Melinis minutiflora P. Beauv.)? Trop. Conserv. Sci. 2014, 7, 639–656. [Google Scholar] [CrossRef]
- Venter, Z.S.; Hawkins, H.-J.; Cramer, M.D. Cattle don’t care: Animal behaviour is similar regardless of grazing management in grasslands. Agr. Ecosys. Environ. 2019, 272, 175–187. [Google Scholar] [CrossRef]
- Powell, J.; Martin, B.; Dreitz, V.J.; Allred, B.W. Grazing Preferences and Vegetation Feedbacks of the Fire-Grazing Interaction in the Northern Great Plains. Rangel. Ecol. Manag. 2018, 71, 45–52. [Google Scholar] [CrossRef]
- Braasch, M.; García-Barrios, L.; Ramírez-Marcial, N.; Huber-Sannwald, E.; Cortina-Villar, S. Can cattle grazing substitute fire for maintaining appreciated pine savannas at the frontier of a montane forest biosphere-reserve? Agr. Ecosys. Environ. 2017, 250, 59–71. [Google Scholar] [CrossRef]
- Stringham, T.K.; Krueger, W.C.; Shaver, P.L. State and transition modeling: An ecological process approach. J. Range. Manag. 2003, 56, 106–113. [Google Scholar] [CrossRef]
- Roos, K.; Rollenbeck, R.; Peters, T.; Bendix, J.; Beck, E. Growth of tropical bracken (Pteridium arachnoideum): Response to weather variations and burning. Invas. Plant. Sci. Manag. 2010, 3, 402–411. [Google Scholar] [CrossRef]
- Moog, F. Forage and Legumes as Protein Supplements for Pasture Based Systems. Feeding Dairy Cows in the Tropics; Food and Agriculture Organization of the United Nations: Bangkok, Thailand, 1991. [Google Scholar]
- Huertas Ramírez, H. Digestibilidad in vitro de las gramíneas nativas Axonopus purpussi, Metz y Trachypogon vestitus, Anders en suelos de sabana de los Llanos Orientales. Master’s Thesis, Universidad Nacional de Colombia, Bogotá, Colombia, 1977. [Google Scholar]
- Baruch, Z. Trachypogon plumosus (POACEAE), un caso de alta diversidad interpoblacional en sabanas neotropicales. Interciencia 2005, 30, 488–494. [Google Scholar]
- Mazzini, F.; Relva, M.; Malizia, L. Impacts of domestic cattle on forest and woody ecosystems in southern South America. Plant. Ecol. 2018, 219, 913–925. [Google Scholar] [CrossRef]
- Hernández-Valencia, I.; López-Hernández, D. Pérdida de nutrimentos por la quema de la vegetación en una sabana de Trachypogon. Rev. Biol. Trop. 2002, 50, 1013–1019. [Google Scholar]
- Mapiye, C.; Mwale, M.; Chikumba, N.; Chimonyo, M. Fire as a rangeland management tool in the savannas of southern Africa: A review. Trop. Subtrop. Agroecosystems 2008, 8, 115–124. [Google Scholar]
- Clark, P.E.; Williams, C.J.; Kormos, P.R.; Pierson, F.B. Postfire grazing management effects on mesic sagebrush-steppe vegetation: Mid-summer grazing. J. Arid. Environ. 2018, 151, 104–112. [Google Scholar] [CrossRef]


| Treatment | Bare Soil | Graminoid | Forb | Shrub | Total Vegetation |
|---|---|---|---|---|---|
| NG | 0.0 a | 89.9 b | 1.0 | 9.1 c | 100.0 b |
| LS | 2.3 a | 96.0 c | 1.7 | 0.0 a | 97.7 b |
| HS | 8.7 b | 85.9 a | 2.9 | 2.5 b | 91.3 a |
| F (p) | 12.29 (0.001) | 28.07 (<0.001) | 1.92 (0.189) | 71.31 (<0.001) | 12.29 (0.001) |
| Factors | Bare Soil | Graminoid | Forb | Shrub | Fern | Total Vegetation |
|---|---|---|---|---|---|---|
| A: Treatments | ||||||
| NG | 44.4 a | 53.5 b | 1.4 | 0.4 b | 0.3 | 53.3 b |
| LS | 47.0 a | 51.2 b | 1.8 | 0.0 a | 0.0 | 52.9 b |
| HS | 59.6 b | 39.7 a | 0.5 | 0.2 ab | 0.0 | 40.4 a |
| F (p) | 15.82 (<0.001) | 14.45 (<0.001) | 2.86 (0.067) | 8.56 (0.001) | - | 16.27 (<0.001) |
| B: Post-burn time points | ||||||
| t1 | 72.9 d | 27.0 a | 0.1 a | 0.0 a | 0.0 | 26.6 a |
| t2 | 57.3 c | 41.8 b | 0.7 a | 0.1 ab | 0.1 | 42.2 b |
| t3 | 41.5 b | 57.0 c | 1.1 a | 0.3 ab | 0.1 | 57.3 c |
| t4 | 29.7 a | 66.7 d | 2.9 b | 0.4 b | 0.3 | 69.6 d |
| F (p) | 63.35 (<0.001) | 60.48 (<0.001) | 7.35 (0.004) | 4.31 (0.009) | - | 77.90 (<0.001) |
| Interaction: A × B | ||||||
| F (p) | 1.72 (0.136) | 1.55 (0.182) | 1.12 (0.367) | 2.54 (0.032) | - | 2.00 (0.084) |
| Factors | Height |
|---|---|
| A: Treatments | |
| NG | 44.0 c |
| LS | 30.3 b |
| HS | 21.7 a |
| F (p) | 31.64 (<0.001) |
| B: Post-burn times | |
| t1 | 20.2 a |
| t2 | 26.3 a |
| t3 | 35.3 b |
| t4 | 46.1 c |
| F (p) | 23.90 (<0.001) |
| Interaction: A × B | |
| F (p) | 2.00 (0.083) |
Publisher’s Note: MDPI stays neutral with regard to jurisdictional claims in published maps and institutional affiliations. |
© 2021 by the authors. Licensee MDPI, Basel, Switzerland. This article is an open access article distributed under the terms and conditions of the Creative Commons Attribution (CC BY) license (http://creativecommons.org/licenses/by/4.0/).
Share and Cite
Herrera, A.H.; Ballera, B.L.G.B.; Toro-Manríquez, M.D.R.; Lencinas, M.V.; Martínez Pastur, G.J.; Ramírez, H.H. Changes in Vegetation of Flooded Savannas Subject to Cattle Grazing and Fire in Plains of Colombia. Land 2021, 10, 108. https://doi.org/10.3390/land10020108
Herrera AH, Ballera BLGB, Toro-Manríquez MDR, Lencinas MV, Martínez Pastur GJ, Ramírez HH. Changes in Vegetation of Flooded Savannas Subject to Cattle Grazing and Fire in Plains of Colombia. Land. 2021; 10(2):108. https://doi.org/10.3390/land10020108
Chicago/Turabian StyleHerrera, Alejandro Huertas, Brigitte L. G. Baptiste Ballera, Mónica D. R. Toro-Manríquez, María V. Lencinas, Guillermo J. Martínez Pastur, and Hugoberto Huertas Ramírez. 2021. "Changes in Vegetation of Flooded Savannas Subject to Cattle Grazing and Fire in Plains of Colombia" Land 10, no. 2: 108. https://doi.org/10.3390/land10020108
APA StyleHerrera, A. H., Ballera, B. L. G. B., Toro-Manríquez, M. D. R., Lencinas, M. V., Martínez Pastur, G. J., & Ramírez, H. H. (2021). Changes in Vegetation of Flooded Savannas Subject to Cattle Grazing and Fire in Plains of Colombia. Land, 10(2), 108. https://doi.org/10.3390/land10020108