Article

Modeling the Size of Protection Zones of Cultural Heritage Sites Based on Factors of the Historical and Cultural Assessment of Lands

Department of Engineering Geodesy, Saint Petersburg Mining University, Saint Petersburg 199106, Russia
*
Author to whom correspondence should be addressed.
Land 2021, 10(11), 1201; https://doi.org/10.3390/land10111201
Submission received: 30 September 2021 / Revised: 29 October 2021 / Accepted: 4 November 2021 / Published: 6 November 2021
(This article belongs to the Section Land Planning and Landscape Architecture)

Abstract

:
This article addresses the global issue of preserving cultural heritage, which is associated, among other things, with the lack of provision for boundaries of protection zones for cultural heritage sites. This paper analyzes the worldwide experience in the field of establishing protection zones for cultural heritage sites, identifies the issues of preserving cultural heritage in Russia, as well as imperfections in the management of lands containing cultural heritage sites. To improve the management of such lands, a method of historical and cultural assessment of territories has been developed, which, on the basis of evaluative factors, makes it possible to characterize the historical and cultural value of a territory. In this article, based on this list of factors, a method for mathematical substantiation of the boundaries of protection zones of cultural heritage sites has been developed; this method includes seven stages. Using mathematical and statistical methods, models were obtained to determine the area of the protection (buffer) zone and the development control zone, the analysis of which revealed differentiation between the factors of historical and cultural assessment that characterize the urban environment, depending on the type of zones. The interpretation of the obtained models and the fields of their use are given.

1. Introduction

One of the main principles of the UNESCO Convention is the preservation of cultural heritage. The need to strengthen the protection and sustainability of cultural and natural world heritage is also laid down in the Sustainable Development Goals (SDGs) adopted by the United Nations (UN) Member States in 2015 [1]. At present, in the context of active human economic activity in urbanized areas as well as the impact of negative environmental and urban planning factors, this issue is becoming more and more relevant [2,3]. In their study, G. Chen, J. Shi, Y. Xia, and K. Furuya [4] revealed the influence of urbanization on the attractiveness of historical landscapes for tourism and on the sustainable development of territories of historical landscaping. C. Udeaja, C. Trillo, K.G.B. Awuah, B.C.N. Makore et al. [5] conducted a study of the city of Surat with the involvement of experts and proved that urbanization processes led to the destruction of valuable historical and cultural monuments, as well as the loss of intangible cultural heritage.
Considering the inevitability of the renovation and urbanization of historical territories, which is required to maintain favorable environment for city residents, it is necessary to develop a historical urban environment management procedure.
According to L.A. Soares, M.D. Valente, A. Yago Sampaio Brito, V. Furtado [6], J. Whitehand, and K. Gu [7], unprecedented rates of urbanization require justified decisions to preserve the “urban fragment”, which has a historical and social value, by establishing buffer zones.
Scientists from different countries of the world are engaged in forming boundaries for zones of protection of cultural heritage sites. Among them, it is worth noting M.B. Schlee [8], who pays attention to the need of establishing buffer zones to preserve the urban landscape. Buffer zones are analogous to zones of protection of cultural heritage sites in Russia; their concept is enshrined in the UNESCO Convention. In addition, the Xi’an Declaration (China, ICOMOS, 2005), the Vienna Memorandum (Austria, UNESCO, 2005), and the results of the meetings in Hiroshima (Japan, 2006) and Davos (Switzerland, 2008) define the role of a buffer zone as protecting and preserving world cultural heritage to ensure the sustainable development of territories. According to P. Roders and V. Ors [9], in the management of territories that have cultural or natural value, it is necessary to apply the “historic urban landscape” or HUL approach, which involves the combination of urban planning, cultural heritage management, and sustainable development of territories. Such foreign scientists as T. Colleta [10], P. Roders, V. Ors [9], M.B. Schlee [8], R. S. Hribar, D. Bole and P. Pipan [11] focus on the fact that the establishment of the boundaries of protection zones for cultural heritage sites (buffer zones) is one of the conditions for ensuring the rational use of territorial, natural, and labor resources. The modern approach to the use of historical urban areas involves a transition from principles of conservation and stagnation of objects to the principles of sustainable development of territories [11,12].
Today, there are various approaches to preserving integral historical environments in the process of land use regulation abroad [13]. For example, the model of cultural landscapes in the protection of historical territories and the renovation of industrial territories (USA, Germany, Japan) [14,15], adaptation of historical centers with the maximum participation of the population, and consideration of historical and cultural value as a potential for the development of a territory (Austria) [11] do not utilize the establishment of buffer zones as an effective tool to preserve valuable objects. In France, the areas around valuable objects are called “environmental perimeters”, where any works within the boundaries of which should be carried out only with permission from the Chief Architect [16]. In Latvia, protection zones around cultural monuments are understood as zones that should be established to ensure the protection and preservation of cultural monuments [17,18]. In most European countries, the establishment of buffer zones is considered the main way to create a favorable historical urban environment with a focus on sustainable development of urban areas [19]. However, none of the studied approaches considers the establishment of buffer zones for cultural heritage sites from the point of view of mathematical interpretation and modeling, which makes it impossible to obtain objectively and mathematically substantiated basic dimensions of such zones. In their paper, Y. Endo and H. Takamura [20] emphasize that historical buildings have an impact on the use of territories, but the assessment of this impact has been little studied. In this field, it is proposed to improve the historical and cultural assessment of territories by substantiation and mathematical interpretation of applied assessment factors that describe the urban environment [20].
The lack of such buffer zones leads to the destruction and loss of value of cultural heritage sites. For example, in India, there is no legislative system for registering and protecting cultural heritage sites, and as a result, historical buildings and adjacent territories fall into decay [5].
The global issues of preserving and adapting cultural heritage sites have also been brought up in Russia. Russia has tremendously rich historical and cultural heritage. According to the Unified Interdepartmental Statistical Information System (UISIS) [1], as of 1 January 2021, there are 269,195 immovable monuments of history and culture in Russia, of which 43.8% of the monuments belong to identified Cultural Heritage Sites (CHS) (Figure 1). The cultural heritage of the Russian Federation is concentrated in 519 historical settlements, of which 41 are federal settlements.
Modern mechanisms for the use of lands populated with cultural heritage sites or falling into the zones of their influence, according to L.V. Averina and I.S. Myamina, are economically and legally imperfect [21].
Immovable cultural heritage sites act as mode-forming objects that impose special restrictions on the use of urban areas [22]. These restrictions are considered in the process of land use regulation, which is associated both with creating conditions for sustainable development of territories, ensuring the comfort of living of the population and increasing its wellbeing, as well as preserving the environment, reducing the negative impact on the environment and humans, and preserving cultural heritage sites. Effective and rational use of territories makes it possible to maintain land and resource potential and to ensure sustainable development, which the modern world is seeking to achieve [18,23,24].
According to the Federal Law dated 25,06,2002 No. 73-FZ “On Cultural Heritage Sites (Historical and Cultural Monuments) of the Peoples of the Russian Federation” to ensure the safety of a real estate object’s value from the point of view of architecture, history, culture, or science, the boundaries of the protection zones are established within its historical and landscape environment. The current legislation of the zone of protection of cultural heritage sites covers three types of zones, which differ by imposed restrictions: protection zones, urban development control zones and business activities control zones (DCZ&BACZ), and zones of protected natural landscapes. Within the boundaries of the protection zone of the cultural heritage site, a special land tenure mode shall be ensured, which provides for the prohibition of new construction and the restriction of economic activities—for example, improvement of the adjacent territory or placement of special memorial plaques. The DCZ&BACZ mode restricts the conduct of land management, engineering, and other economic works, but allows construction in historical areas in compliance with the norms for the preservation of valuable historical buildings. The protected natural landscape zone enables restrictions, such as establishing a ban on the construction and reconstruction of buildings to preserve and restore the natural landscape [25,26]. Currently, less than 15% of cultural heritage sites have approved boundaries for protection zones, and no more than 5% of the established boundaries have been entered into the Unified State Register [27] (Figure 2).
This circumstance leads to negative consequences for the state of cultural heritage sites. The lack of established land tenure modes leads to uncertainty and the possibility of urban planning and construction errors in the future [10,13,24]. Within the boundaries of the protection zones, construction and reconstruction are prohibited; the development and economic activity control zones restrict new construction and the scope of reconstruction, which is a key point in the preservation of cultural heritage sites. According to the annual State Report on the State of Culture issued in 2020, about 10% of all cultural heritage sites are in an unsatisfactory condition, while protection zones have not been approved for almost half of them. Due to these circumstances, we can talk about noncompliance with the protection legislation and the problem of impending threats to the condition and value of cultural heritage sites, which leads to the irrational use of limited territorial resources [28,29].
The approval of the boundaries for protection zones relies upon the basis of border designs that are developed by scientific and design organizations using deep archival, historical, cultural, and other research. The field of historical and cultural research is distinguished by the fact that it is based on qualitative characteristics, as well as on archival, historical, and cultural textual and graphic descriptions. This ensures the reliability and completeness of the substantiation of design boundaries for protection zones; however, these studies are rather time consuming and unsupported by objective numerical data [26,27].
One of the tools for solving the problem of establishing optimal sizes of protection zones for cultural heritage sites and modernizing the process of designing their boundaries can be the use of mathematical and statistical methods as a stage of project boundaries for modeling the required area of protection zones for cultural heritage sites. This will allow the collection of objective data on the current condition of the territory and predicting, based on the existing situation, the dimensional values for other objects. Moreover, models of zones of protection for cultural heritage sites will help make the process of developing the designs of the boundaries of protection zones more efficient and reduce their cost [28].
In Russia, the problems of the legal regime of territories occupied by cultural heritage sites and adjacent territories are studied by such scientists as A.A. Varlamov, R.A. Kirillov [30], L.V. Averina, I.S. Myamina [21], N.N. Melnikov [25], and M.S. Trofimova [27]. The work of Yu. Kurashov [26], as well as earlier works of the authors of this article [28,31], is concerned with assessing the lands encumbered with cultural heritage objects to regulate nature management.
Since it is necessary to maintain favorable conditions for the inhabitants of the city, the renovation of valuable historical quarters is inevitable. Due to these circumstances, the most optimal solution is the adaptation of the site to modern conditions with the parallel establishment of protection zone boundaries for the cultural heritage site; without these boundaries, the site becomes poorly protected from the influence of ongoing economic activities in the adjacent territory [10,14,15]. In this regard, it becomes necessary to find a balance between the stringent land tenure system in historical cities, which extends to the territories within the boundaries of the protection zones of cultural heritage sites, and the ability of these sites to adapt in the conditions of constant urban environment transformation. The latter is expressed in the most careful but effective possible use of these facilities, without stagnation in the use and development of the natural resource potential of the territories.
Since the main lever of influence on the modes of use of territories adjacent to cultural heritage sites are cultural heritage protection zones (buffer zones), improving the development and use of urban areas is associated with the establishment of their modes and boundaries [32,33].
Based on the above statement, the study pursued the goal of improving the mechanisms for preserving cultural heritage sites in terms of managing encumbered land resources. To achieve this goal, the following tasks were solved: first, by examining modern trends, the existing problems in the field of land use regulation within the boundaries of cultural heritage protection zones were identified; second, using economic and statistical methods, models of the size of the protection zones of cultural heritage sites were built; third, the differentiation of the historical and cultural assessment factors according to the types of protection zones of cultural heritage sites were proved.

2. Materials and Methods
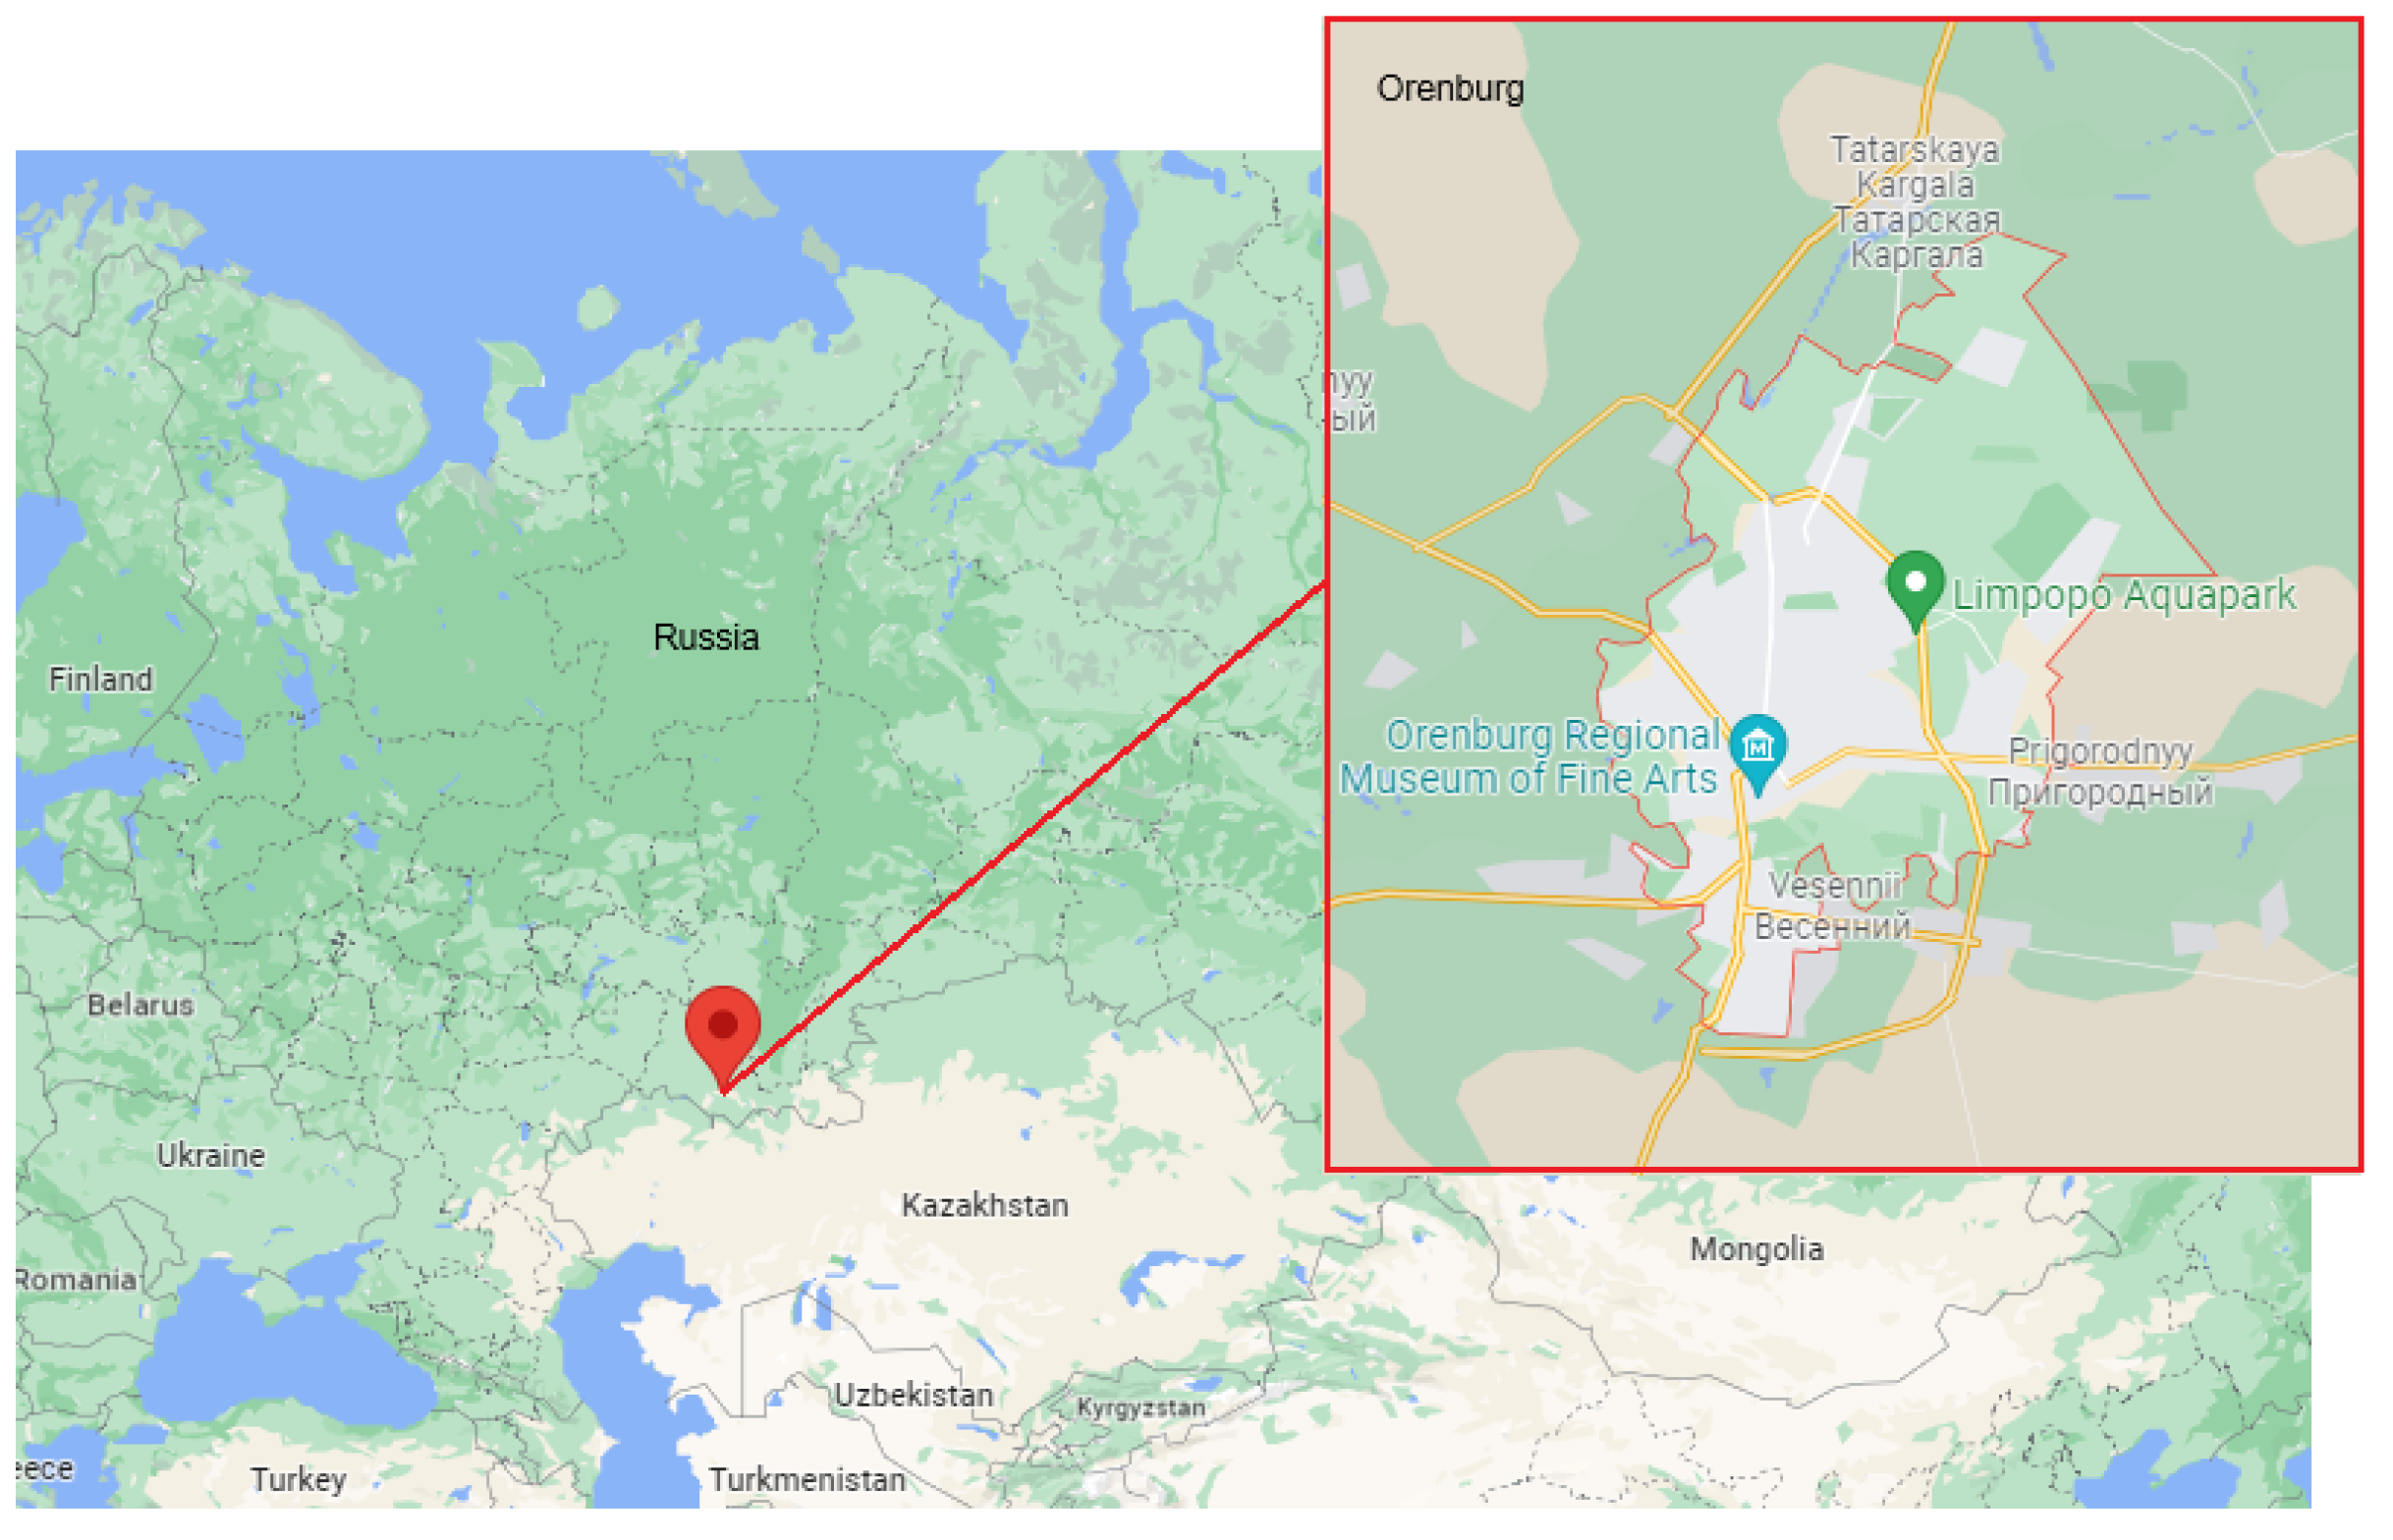
2.1. Research Area

The study object is Orenburg, and the territory of historical settlement of regional significance is the regional center of the Orenburg region (Figure 3).
Orenburg, or “Steppe Capital”, was founded in 1743 at the intersection of the Ural and Sakmara rivers as a fortress to protect Russian borders, and later it became a center of trade between Russia and Central Asia. Within the boundaries of Orenburg, there are 478 monuments of architecture, urban planning, and history (Figure 4).
The names of many famous people are associated with Orenburg: the first cosmonaut, Yu. A. Gagarin, who studied at the First Chkalovsk Higher Aviation School; P.I. Rychkov, scientist and the first associate member of the St. Petersburg Academy of Sciences; writer, ethnographer, and lexicographer V.I. Dal; poet and writer A.S. Pushkin; writer L.N. Tolstoy; Ukrainian poet and artist T.G. Shevchenko; poet Musa Jalil; musician and conductor M.L. Rostropovich; and many others lived and worked here. The long history of the city is reflected in its layout; the historical core is an image of a typical Russian provincial town with predominant buildings of the 18th and 19th centuries. The population of the city as of 2021 is more than 560,000 people.
Justification of the boundaries of the study area is based on the data from the project of the Historical and Cultural Baseline Plan, the master plan of the city of Orenburg.

2.2. Simulation Steps

Modeling the area of the buffer zone and DCZ&BACZ of cultural heritage sites was carried out using the city of Orenburg as an example. The cartographic base was created using Geographical Information System (GIS) MapInfo Professional 19.0, while statistical data processing was carried out using Microsoft Excel 2010 and Gretl software solutions.
The initial research data are information on the area of the established boundaries of protection zones in Orenburg, obtained from regulatory legal acts on the approval of boundaries and acts of state examination of projects of boundaries of cultural heritage site protection zones, as well as statistical information from the public cadastral map of Rosreestr (Russian State Register), UISIS, and the Unified State Register of Cultural Heritage Sites. All information was obtained from official sources that are publicly available on the Internet.
The analysis of sources showed that in December 2020, in Orenburg, the boundaries of protection zones and development control zones for 25 cultural heritage sites were established, while the boundaries of the protected natural landscape zone were established for one object only (the landmark “Zauralnaya Roscha”). The process of establishing the boundaries of such zones is rather slow. Thus, a question arises: why it is impossible to analyze the size of the boundaries of the zones directly? The fact is that the configuration and size of the boundaries of the zones of protection for cultural heritage sites are very different and do not lend themselves to systematic analysis [34].
Modeling the size of the protection zones and DSC&BACZ was carried out using mathematical and statistical methods in the sequence shown in Figure 5.
The first stage of research includes the formation of a list of factors of historical and cultural assessment of lands that characterize the features of the urban environment (Figure 6) [31].
The initial substantiation of their composition was carried out through the analysis of scientific and regulatory literature [34,35], then they were tested for multicollinearity to confirm the possibility of using a linear regression method [36,37].
To identify the correlation between the factors, the method of inflation factors was used. The Variance Inflation Factor (VIF) shows how many times the variance of the regression coefficient increases due to the correlation of the regressors X1,…, Xk compared to the variance of this coefficient if the regressors were uncorrelated. The Variance Inflation Factor is calculated by Formula (1):
V I F j = 1 ( 1 R J 2 )
where Rj2 is the coefficient of determination of the j-th regressor Xj for all other regressors, and j = 1,…, k, k is the number of model factors.
It is believed that if the Variance Inflation Factor VIF > 10, then this regressor leads to multicollinearity [38].
The factor inflation method makes it possible to correctly identify multicollinearity, but its disadvantage is that when several factors are collinear, this method cannot be used to identify which of them should be excluded from the model [38,39]. In mathematical statistics, there are several methods for eliminating correlating factors, such as t-statistics, Belsley’s method, analysis of the matrix of partial correlation coefficients of dependent correlating variables, and the resulting indicator. The simplest and most effective way is to identify which of the correlating factors has a greater correlation coefficient with the independent variable, that is, to assess the connection degree of one feature with one factor excluding the influence of all other factors.
Calculations to identify multicollinearity and the construction of correlated matrices are presented in earlier studies by the authors [31].
The next stage of modeling is the assignment of values to the estimated factors, that is, carrying out a historical and cultural assessment of the territory in accordance with the previously developed methodology [39]. This method is based on the expression of historical and cultural features of the territories in the form of semantic values of evaluative factors with their subsequent transformation into a quantitative value using the fuzzy sets theory. A scoring scale has been developed for each factor. For example, the urban planning factor takes into account the impact of the site on the surrounding buildings and compositional relations (Table 1).
The fourth stage is associated with the use of the least-squares method for developing mathematical models for the area of the protection zone and the DCZ&BACZ [8,10]. Since each type of protection zone is characterized by and assigned with various restrictions and established modes of land plot use, the modeling is performed individually for each type of zone.
At this stage, the hypothesis about the linear form of the multiple regression equation was verified and was put forward because of the absence of multicollinearity between the factors [39,40]. The creation of the multiple regression equation was carried out on the basis of the obtained quantitative characteristics of the area of the studied protection zones (the resulting indicator) and on the values of the factors (regressors) by sequentially including the factors in the model and systematically checking the quality of the resulting equations until all the quality indicators of the constructed model stop improving, while all criteria for evaluating the model will represent satisfactory requirements [41,42,43].
The original model includes a list of all evaluative factors. The significant factors were selected by the method of sequential exclusion of factors by the value of t-statistics. The method operates so that, after constructing the regression equation and assessing the significance of all regression coefficients, the factor for which the coefficient is insignificant and has the smallest value of t-statistics is excluded from the model. A new multiple regression equation is then obtained, and the significance of all remaining regression coefficients is evaluated again. If there are insignificant ones among them, then again, the factor with the smallest value of the t-criterion is excluded. The process of excluding factors stops when all the regression coefficients are significant, i.e., the values of tobs > tcrit [43].
The verification of the obtained models for compliance with the quality criteria was carried out on the basis of the analysis of statistical characteristics, including the coefficient of determination, t-statistics, Fisher’s coefficient, the Durbin–Watson test, the Kolmogorov–Smirnov test, the Breusch–Godfrey test, and graphic methods [38,43].
The coefficient of determination is calculated to assess the quality of fitting the linear function of the model. It characterizes the proportion of the variance of the zone area, explained by regression in the overall regression of the final area (2) [44]:
R 2 = 1 i = 1 n ( y i y ^ i ) 2 i = 1 n ( y i y ¯ ) 2
where y i is the observed values of the zone area, y ¯ is the average value according to the observed data, y ^ i is the model values of the area of the protection zone of cultural heritage sites built according to the estimated parameters.
Fisher’s F test makes it possible to assess the significance of the correlation index, and, consequently, the entire regression equation. If the actual value of the F-criterion is greater than the tabular value, then the relationship between the factors and the area of the protection zone is reliable and the equation of the dependence of the area on the factors of historical and cultural assessment fully reflects this relationship. If the actual value of the F-criterion is less than the tabular value, then the relationship between them is random.
The observed value of the Fisher’s coefficient Fobs is calculated by Formula (3):
F o b s = R 2 1 R 2 f 2 f 1
where R is the coefficient of the correlation of factors and the area of the protection zone; f1 and f2 are the number of degrees of freedom. The number of the degrees of freedom of the explained variance f1 is equal to the number of factors in the historical and cultural assessment. The number of degrees of freedom of the unexplained variance is f2 = N-k-1, where N is the number of evaluated sites (a total of 25 historical and cultural monuments) and k is the number of evaluated factors (in these calculations f2 = 20).
The significance of each parameter is evaluated using the Student’s t-test by comparing its values with the tabular value of ttabl at a given level of significance and degrees of freedom v = n-k, where n is the number of evaluated sites and k is the number of factors of historical and cultural assessment. If the actual value of the Student’s t-test is greater than the tabular value, then the model parameters (factors included in the model) are significant.
In addition to evaluating the model itself, an analysis of the remainders (the difference between the model and actual values of the area of protection zones) is carried out. In order to exclude a situation in which the model does not include factors that have a significant effect on the area of the protection zones, which leads to autocorrelation of remainders, it is necessary to calculate the Durbin–Watson model using Formula (4) [45]:
d = t = 2 n ( e t e t 1 ) 2 t = 1 n e t 2
where e t is the remainders of the equation of the dependence of the zone area on the factors of historical and cultural assessment.
The algorithm for detecting autocorrelation of remainders based on the Durbin–Watson model is as follows. The hypothesis H0, the absence of autocorrelation of remainders, is put forward. Alternative hypotheses H1 and H1 have positive or negative autocorrelation in the remainders. Further, using special tables, the critical values of the Durbin–Watson model, dt and du, are determined for a given number of observations N = 25 (number of sites), the number of independent variables of the model M = 4 (factors of historical and cultural assessment in models), and significance level α = 0.95. According to these values, the numerical interval [0.4] is divided into five segments [43].
If the observed value of the Durbin–Watson model is less than the critical value 4-du, that is dobs < 4-du, then the main hypothesis of the absence of first-order autocorrelation between the remainders of the regression model is accepted.
To determine the normality of the distribution of the sample of predicted values of the area of protection zones, the Kolmogorov–Smirnov test is used [44]. We test hypothesis H0: F1(x) = F2(x) so that the data is described by the same distribution function. To do this, it is necessary to find the largest deviation according to Formula (5):
λ = m a x x i | F 1 * ( x ) F 2 * ( x ) | n 1 n 2 n 1 + n 2
where n1, n2 are the frequencies for the predicted and actual values of the protection zone, respectively; n1*, n2* are the accumulated frequencies for the predicted and actual values of the area of protection zones of cultural heritage sites, respectively.
To conclude that the test criterion under consideration is similar between the predicted and actual values of the protection zone, it is necessary to compare the experimental value of the criterion with its critical value determined from a special table based on the significance level α = 0.05. As a null hypothesis, the statement that the compared groups differ insignificantly from each other in the level of assimilation is accepted. In this case, the null hypothesis shall be accepted if the observed value of the criterion does not exceed its critical value λemp < λtheor.
The sixth stage of this process is the analysis and interpretation of the coefficients and the type of the obtained models. At the last stage, conclusions were made about the differences between the lists of factors that affect different types of protection zones.
To interpret the area of the protection zone, the average coefficient of elasticity is calculated, which shows how much the percentage will change on average and the resulting factor, when the dependent factor changes by 1% (6):
E = f ( x ¯ ) x ¯ y ¯
where x ¯ , y ¯ are model values of the regressions and indicator [43,44].

3. Results

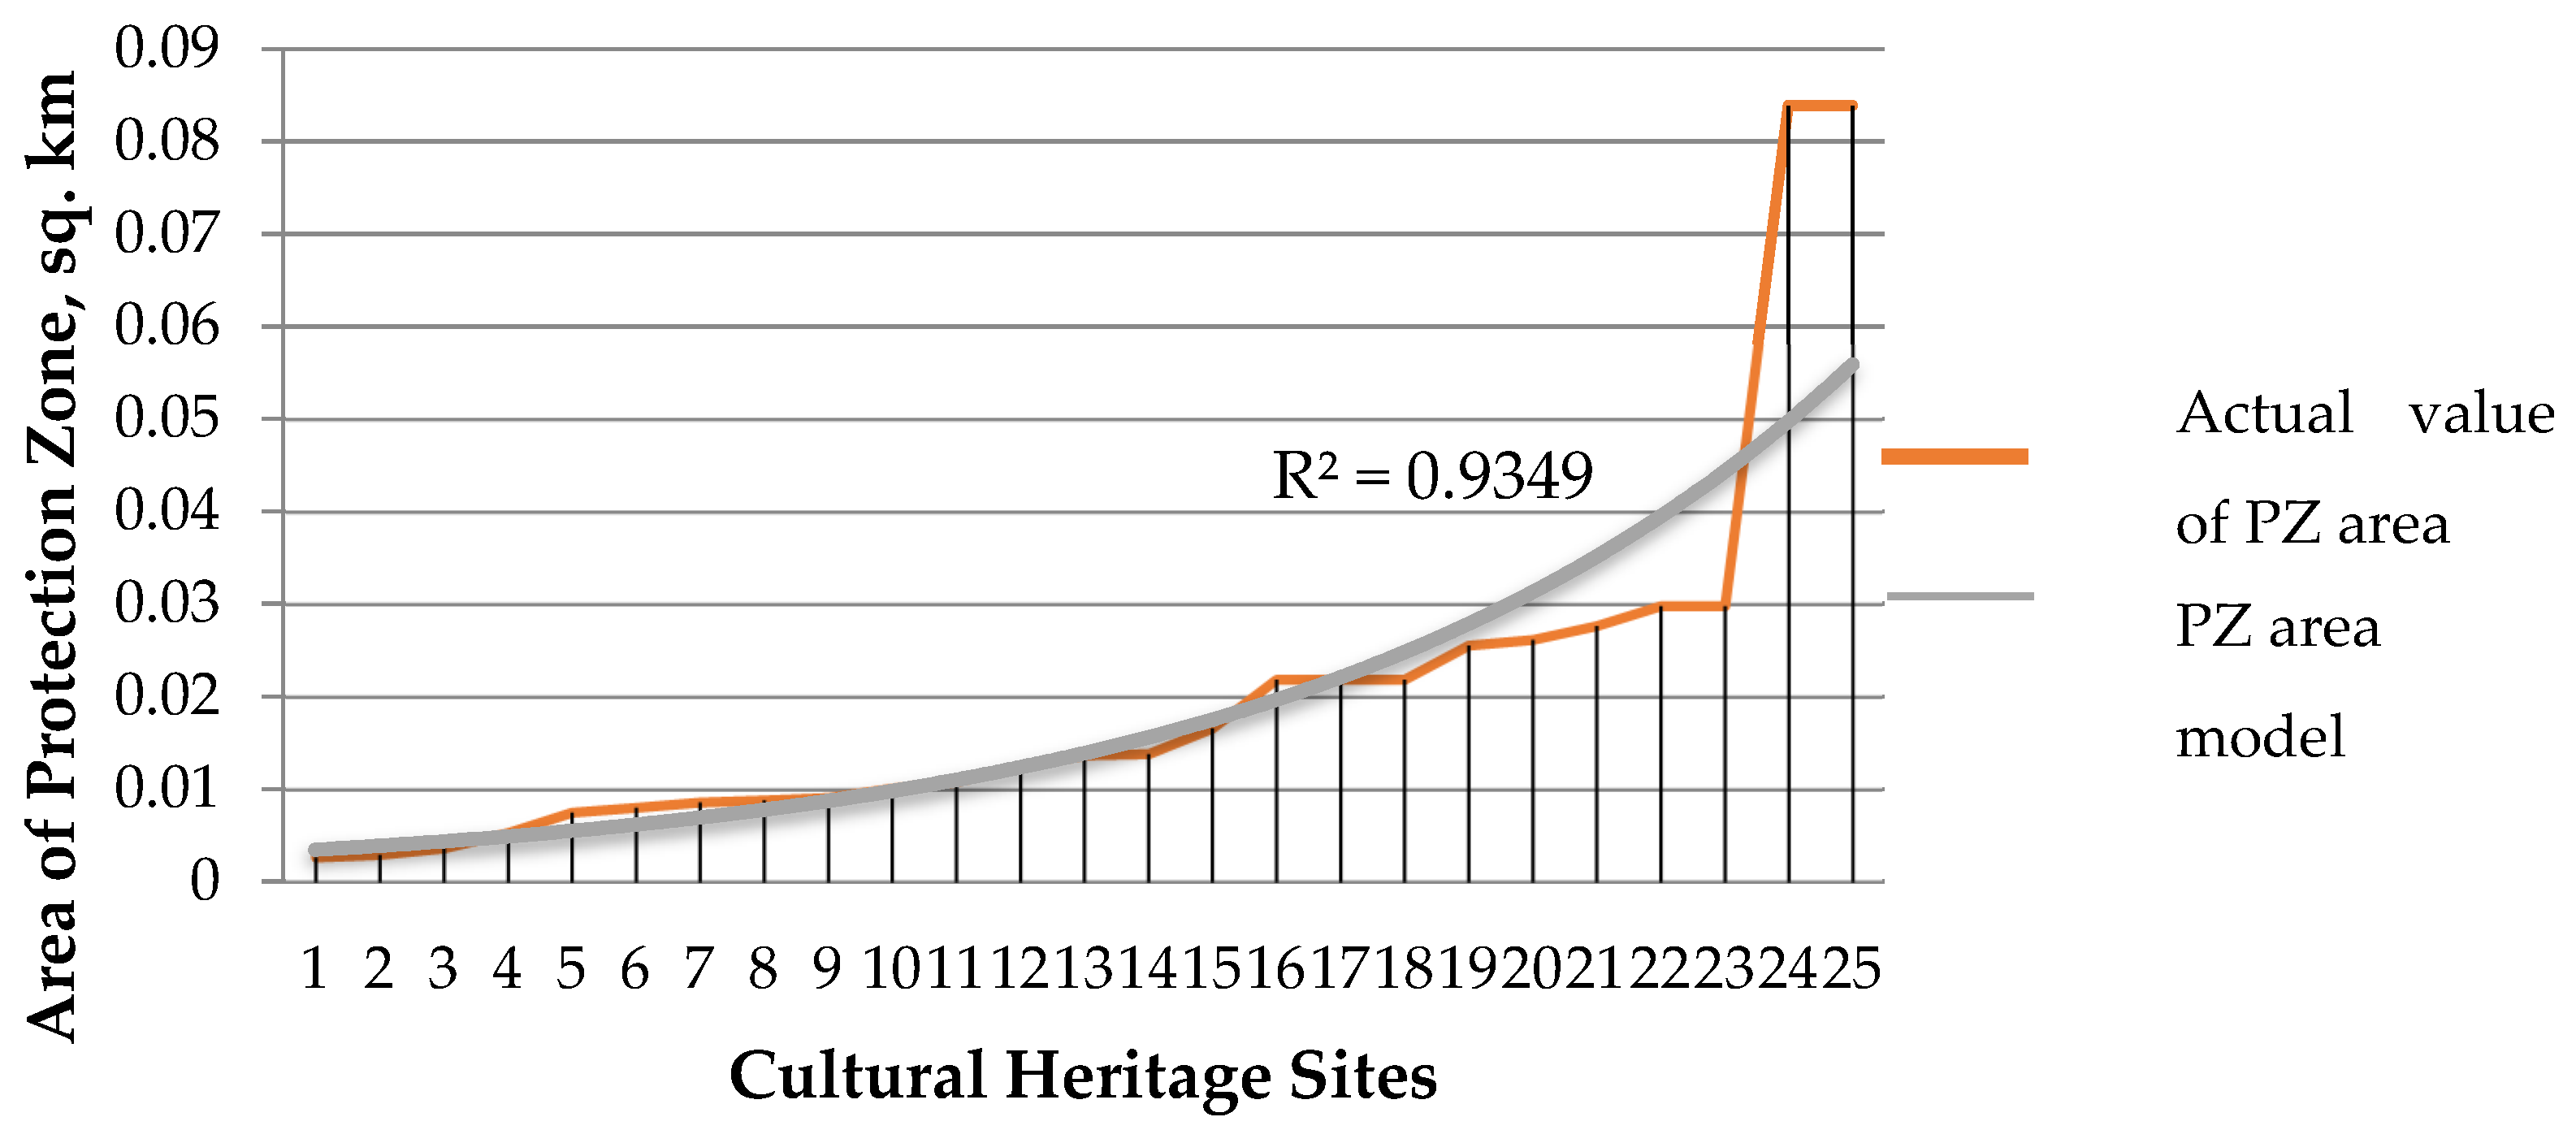
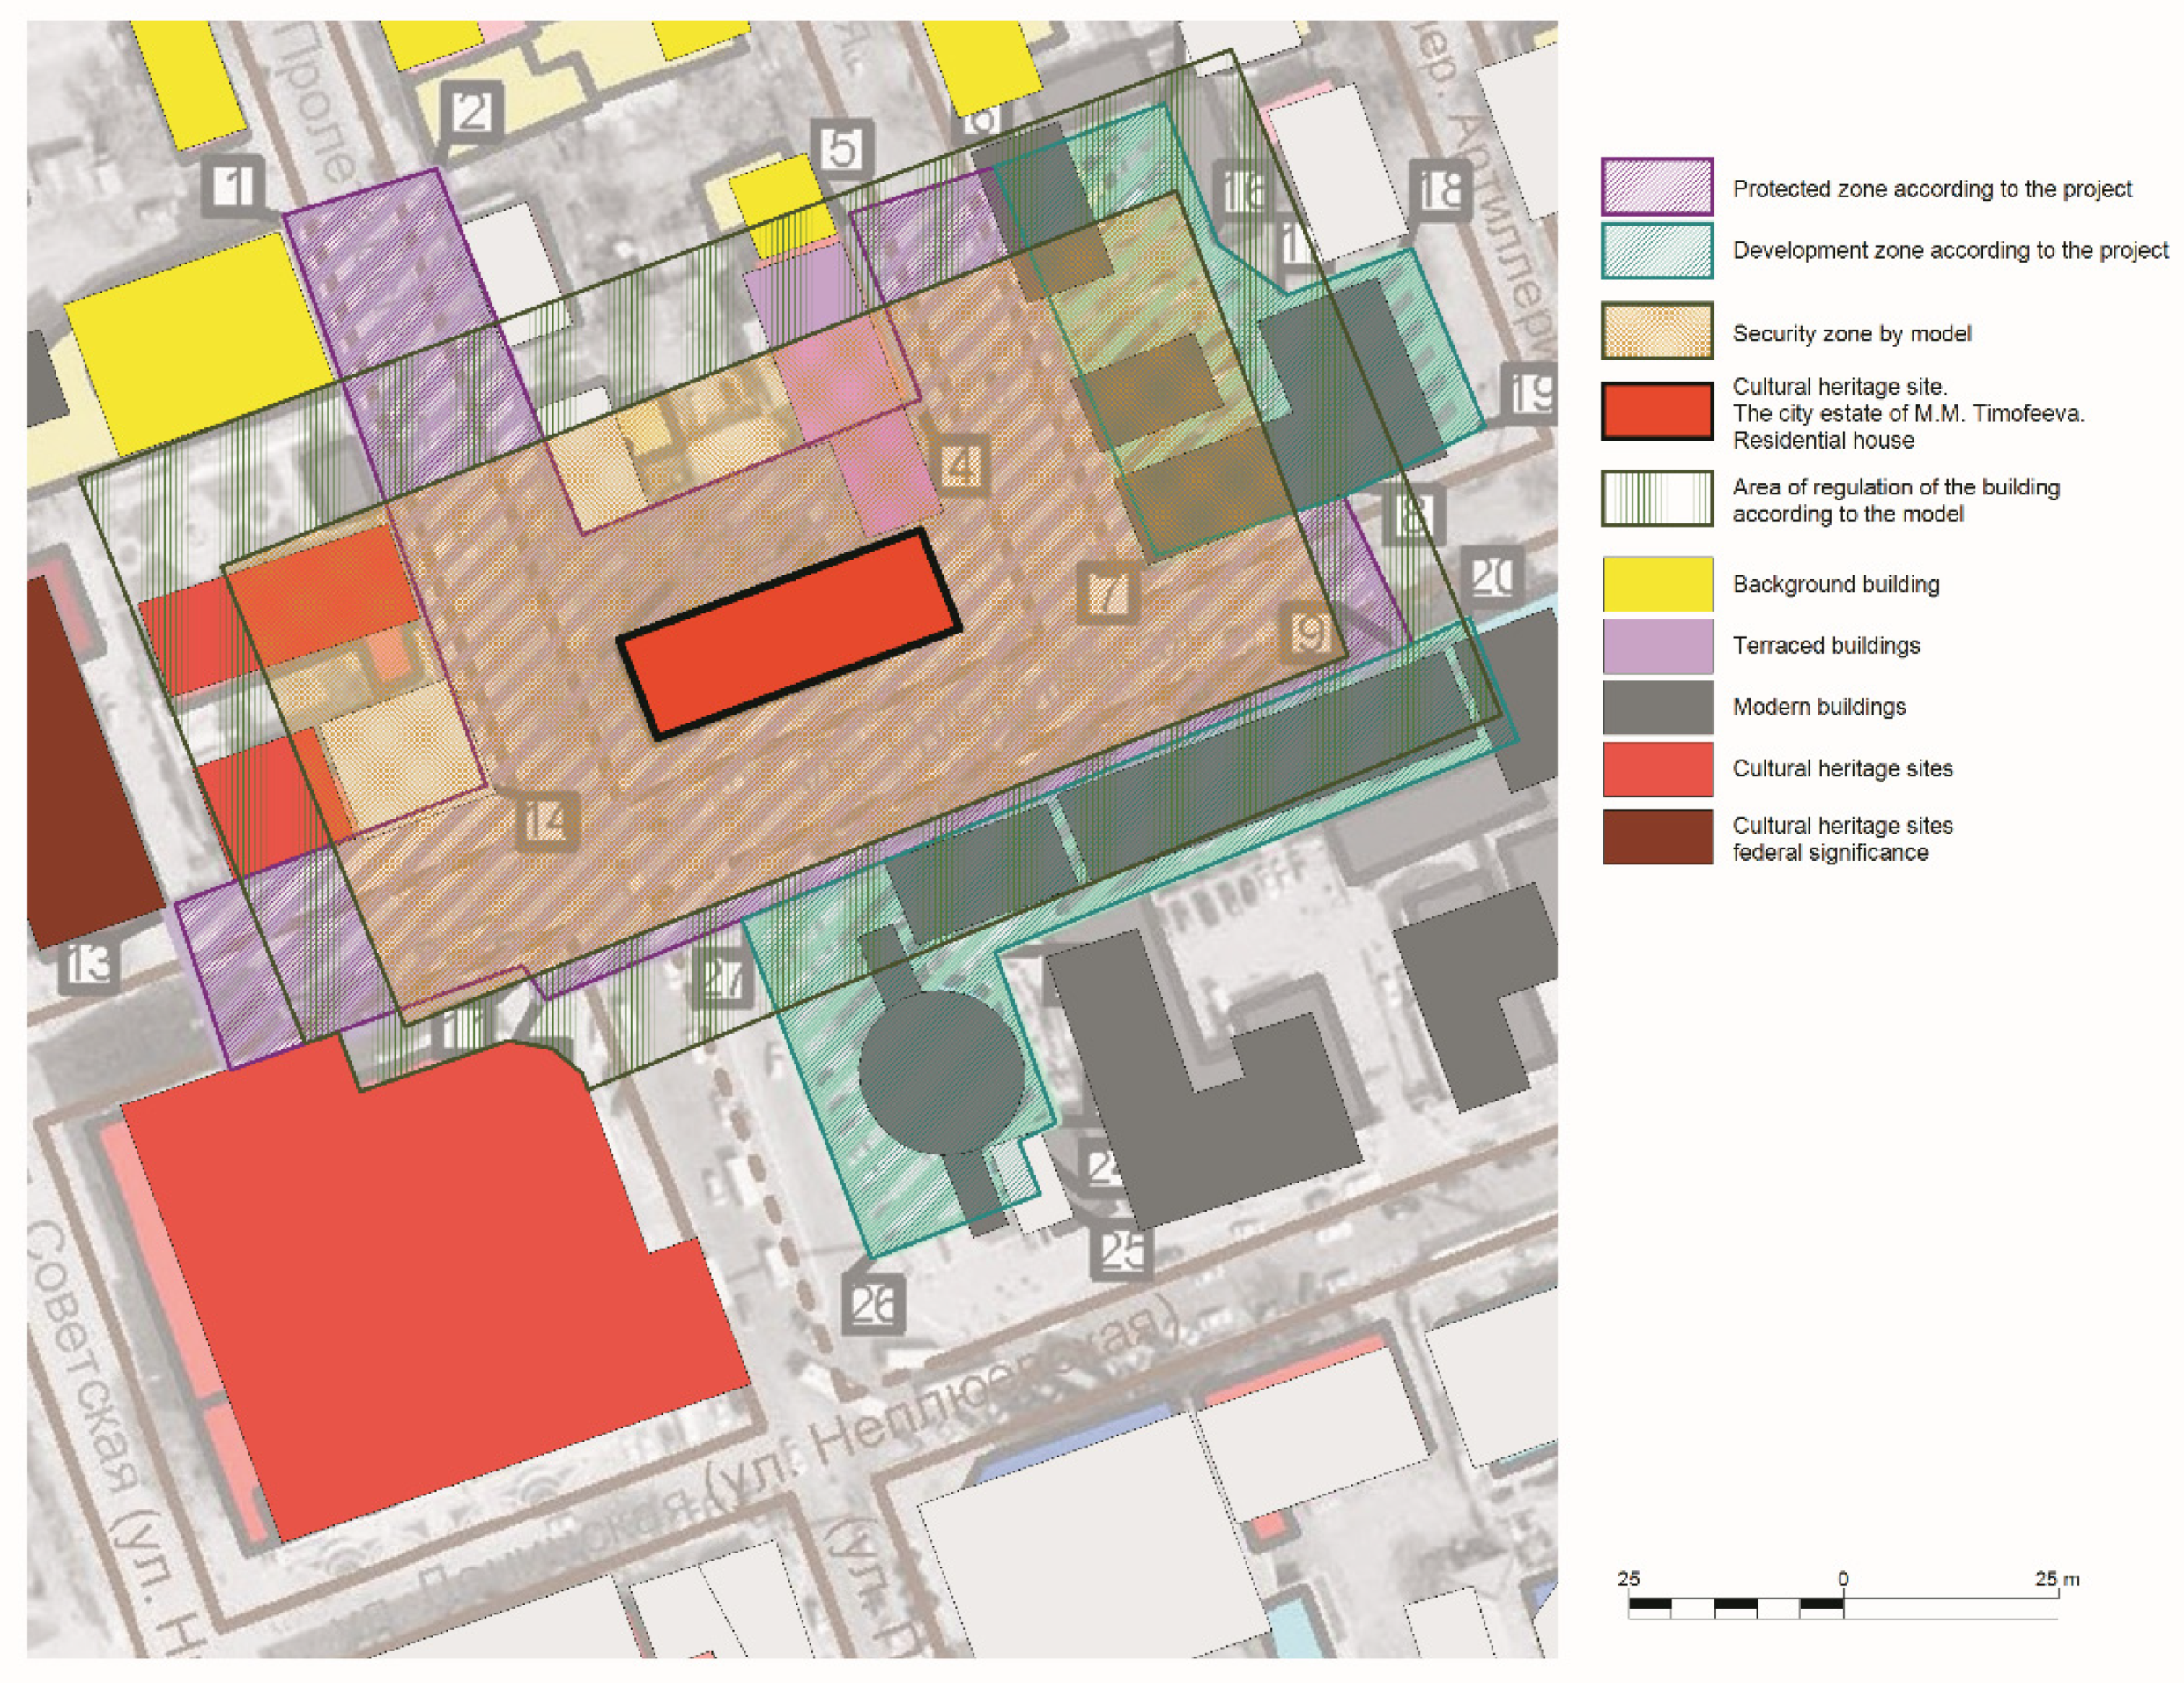
3.1. Model of the Size of the Protection Zone of a Cultural Heritage Site

The indicators characterizing the quality of the model of the Protection Zone (PZ) area, expressed by linear multiple regression, turned out to be unsatisfactory (Table 2).
By developing various types of models of the protection zone area and analyzing their characteristics (Figure 7), it was found that, in terms of indicators, the most optimal was the multiplicative function, as shown in Figure 8.
The complex multiplicative function of the security zone area model has the following form (7):
y = 1 558 317 ln x F 1 + 113 ln x F 3 0.73 x F 12 3 3.30 x F 13 2
where y is the model of the protection zone of the cultural heritage site, xF1 is the value of the urban factor, xF3 is the value of the historical factor, xF12 is the value of the educational factor, and xF13 is the value of the degree of uniqueness of the building and structures.
In order to estimate the parameters of the developed model by the least-squares method, this function was linearized by introducing the following substitutions (8) [38,43]:
y = 1 y ; x F 1 = ln x F 1 ; x F 3 = ln x F 3 ; x F 12 = x F 12 3 ; x F 13 = x F 13 2 ;
The parameters of the nonlinear regression model for the area of the security zone are presented in Table 3.
To interpret the simulation results, we will use the calculations of the elasticity coefficients. Elasticity coefficients show, by percentage, how much change the value of the area of the protection zone will occur with an increase in the value of the factor by 1% [41]. The calculated values of the elasticity coefficients are presented in Table 4.
The analysis of the results presented in Table 3 describes the negative current trend in the field of establishing boundaries of protection zones in Orenburg’s historical settlement of regional significance. The bottom line is that the higher the value indicators of the cultural heritage site, the smaller the established size of the protection zone. This phenomenon can be explained by the desire to reduce the area of land with stringent modes of restrictions on land use due to the presence of a cultural heritage site.

3.2. Model of the Size of DCZ&BACZ of a Cultural Heritage Site

To characterize the area of DCZ&BACZ for the cultural heritage site, a multiple linear regression model was built with criteria meeting the requirements of statistical characteristics. Its parameters are presented in Table 5.
Linear regression for the dependence of the DCZ&BACZ area of the cultural heritage site and estimated factors has the form (9):
y = 95,222 + 27243 x F 4 + 37,967 x F 7 51,977 x F 8 19,328 x F 9
where y is the DCZ&BACZ area, m2, xF4 is the value of the cultural factor, xF7 is the value of the protective factor, xF9 is the value of the construction and technical factor, xF2 is the value of the landscape and environmental factor, and xF8 is the value of the functional factor.
Analysis of the resulting model allows the interpretation as follows:
First, the coefficients at xF4, xF7 show an increase in the area of the DCZ&BACZ of the cultural heritage site by 37,967.35 m2 with an increase in the degree of the object’s influence on the public, cultural, and educational life of the city by one point;
Second, the coefficients at xF8, xF9 show a decrease in the area of the DCZ&BACZ of the cultural heritage site by 51,977.99 m2 and 19,328.88 m2, respectively, with an increase in the degree of adaptation of the object to modern conditions and with an increase in the uniqueness of technical construction by one point.
For the resulting models, certain limitations should be stipulated. Due to the fact that the development of historical cities of regional and federal significance differs due to the originally laid down historical characteristics, and considering that in cities of federal significance, as a rule, united protection zones are established, the developed models are applicable only for the historical city of Orenburg.
Analyzing the obtained models, it can be concluded that the dependences of the buffer zone areas and DCZ&BACZ on the assessment factors that are used in the process of historical and cultural assessment of lands have acceptable quality indicators and they can be objectively interpreted (Table 6).
The resulting models (7), (9) were tested on seven cultural heritage sites of regional significance for which no zones of protection of cultural heritage sites have been approved (Table 7).
The obtained values of the area of protection zones can be used to determine the configuration and dimensions when graphically superimposed around the site by uniform distribution around the site. This also considers the existing buildings and the historical and cultural value of the adjacent territory. It is proposed to distribute the areas of the zones along the rectangle shape’s perimeter from the boundaries of the site itself (Figure 9). In further studies, this method will be modified using the historical and cultural assessment of territories.

4. Discussion

The use of economic and mathematical methods to determine the boundaries of zones for the protection of cultural heritage objects plays a special role in ensuring the rational use of historical territories, since it mathematically assesses the spatial and qualitative characteristics of construction that can affect the object and its zone. A. Khamis and N.K. Kamarudin [45] confirm the advantage of multiple regression analysis in the land assessment process using traditional methods. S. Gnat [46] proved that even when working with small data sets, accurate evaluation results can be expected thanks to regression analysis algorithms.
The identification of qualitative factors affecting the historical environment and the establishment of protective zones is a complex and multistage process. In further studies, it is planned to apply the results to develop a methodology for historical and cultural assessment of a territory based on the use of fuzzy sets in combination with machine learning.
The study results correlate with the findings of M.B. Schlee [8] that historical background and spatial relationships influence the establishment of buffer zones.
In their study [47], A. Versaci and A. Cardici note that the protection zone of the monuments shall be 500 m from the boundaries of the site (experience of France). In contrast to this study, the proposed method and the developed models make it possible to approach each site individually, assessing its uniqueness and value.
T. Colleta [10] considers buffer zones as overlapping territories, the boundaries of which take development into account. This condition is also proposed to be observed in further developments. O. Martin and G. Piatti consider the buffer zone as the area around the site, the cadastral plot, and the level of protection. Therefore, it is very important to accurately determine its meaning and configuration [48]. K. Conradin and T. Hammer [49] propose, in addition to buffer zones, to allocate transition zones, which are less strict in nature, but contribute to the development of territories.
In addition, the obtained models of protected zones will be used to study the influence of the regimes of zones with special conditions for the use of territories on the value of real estate objects.

5. Conclusions

In modern conditions of transitioning to the sustainable development of territories, the issues of land tenure regulation, especially in historical cities, are becoming more and more relevant. Efficient and rational use of land as a limited resource is becoming a priority in the process of managing land and resource potential of a territory, while the most important problems of preserving immovable monuments as part of a system for sustainable development of territories are addressed with new solutions. One of these solutions is the use of mathematical and statistical methods for modeling the basic sizes of protection zones of cultural heritage sites, obtained from the data of real border projects using the city of Orenburg as an example.
Thus, according to the results of the study, we can conclude:
First, by means of mathematical modeling, the differentiation of historical and cultural evaluative factors for each type of protection zone of cultural heritage sites has been proved.
Second, the model for determining the area of DCZ&BACZ is characterized by a linear dependence, while the area of the protection zone is determined by a nonlinear multiplicative model.
Third, the obtained models of the dependence of historical and cultural evaluative factors and areas of the buffer zone, as well as DCZ&BACZ, are objectively interpreted and have satisfactory quality criteria.
The obtained modeling results can be used as a mathematical justification for determining the recommended (necessary and sufficient) sizes of zones for the protection of cultural heritage sites in the process of developing projects for the boundaries of such zones. The results of the research can be used to study the current state in the field of approving boundaries for protection zones, as well as in identifying the trends in developed zone designs, which improves the management of measured lands that contain cultural heritage sites. The obtained models can be useful in the process of carrying out the activities of scientific and design organizations, as well as bodies for the protection of cultural heritage sites in the city of Orenburg.

Author Contributions

E.B.—a significant contribution to the development of the concept of work, as well as critical revision of the content, editing and revision of the manuscript, interpretation of research results, and formulation of conclusions. I.D.—analysis and generalization of literature data, collection of initial data and mathematical modeling, work with graphic material, and tables. All authors have read and agreed to the published version of the manuscript.

Funding

The study was carried out at the expense of a subsidy for the fulfillment of the state task in the field of scientific activity for 2021 No.FSRW-2020-0014.

Institutional Review Board Statement

Not applicable.

Informed Consent Statement

Not applicable.

Data Availability Statement

There is no data available in public domains.

Conflicts of Interest

The authors declare no conflict of interest.

References

  1. Alexandrakis, G.; Manasakis, C.; Kampanis, N.A. Economic and Societal Impacts on Cultural Heritage Sites, Resulting from Natural Effects and Climate Change. Heritage 2019, 2, 279–305. [Google Scholar] [CrossRef] [Green Version]
  2. Kuznetsov, V.S.; Petrov, D.S. Assessing the environmental condition of minor rivers in urban areas. J. Ecol. Eng. 2017, 18, 110–114. [Google Scholar] [CrossRef]
  3. Khaikin, M.M. The field of subsoil use in the context of modern development of economic theory. J. Min. Inst. 2015, 213, 100–109. [Google Scholar]
  4. Chen, G.; Shi, J.; Xia, Y.; Furuya, K. The Sustainable Development of Urban Cultural Heritage Gardens Based on Tourists’ Perception: A Case Study of Tokyo’s Cultural Heritage Gardens. Sustainability 2020, 12, 6315. [Google Scholar] [CrossRef]
  5. Udeaja, C.; Trillo, C.; Awuah, K.G.B.; Makore, B.C.N.; Patel, D.A.; Mansuri, L.E.; Jha, K.N. Urban Heritage Conservation and Rapid Urbanization: Insights from Surat, India. Sustainability 2020, 12, 2172. [Google Scholar] [CrossRef] [Green Version]
  6. Lopes, A.S.; Macedo, D.V.; Brito, A.Y.S.; Furtado, V. Assessment of urban cultural-heritage protection zones using a co-visibility-analysis tool. Comput. Environ. Urban Syst. 2019, 76, 139–149. [Google Scholar] [CrossRef]
  7. Whitehand, J.W.R.; Gu, K. Urban conservation in China: Historical development, current practice and morphological approach. Town Plan. Rev. 2007, 78, 643–670. [Google Scholar] [CrossRef]
  8. Schlee, M.B. The role of buffer zones in Rio de Janeiro urban landscape protection. J. Cult. Herit. Manag. Sustain. Dev. 2017, 7, 381–406. [Google Scholar] [CrossRef]
  9. Roders, A.P.; Van Oers, R. Wedding cultural heritage and sustainable development: Three years after. J. Cult. Herit. Manag. Sustain. Dev. 2014, 4, 2–15. [Google Scholar] [CrossRef]
  10. ICOMOS International Commitee on Historic Towns and Villages. The Role of The Integrated Conservation of Cultural Heritage for a Creative, Resilient and Sustainable City: Acta of the ICOMOS-CIVVIH Symposium, Naples; Colletta, T., Ed.; FrancoAngeli: Milan, Italy, 2013; pp. 146–150. [Google Scholar]
  11. Hribar, M.; Bole, D.; Pipan, P. Sustainable Heritage Management: Social, Economic and Other Potentials of Culture in Local Development. Procedia Soc. Behav. Sci. 2015, 188, 103–110. [Google Scholar] [CrossRef] [Green Version]
  12. Varlamov, A.; Gvozdeva, O.; Zhdanova, R. Environmental requirements in land management of land use facilities. IOP Conf. Ser. Earth Environ. Sci. 2019, 350, 012059. [Google Scholar] [CrossRef] [Green Version]
  13. Tveit, M.S.; Ode Sang, Å.; Hagerhall, C.M. Scenic Beauty: Visual Landscape Assessment and Human Landscape Perception; Steg, L., de Groot, J., Eds.; Wiley & Sons: Hoboken, NJ, USA, 2018; pp. 45–54. [Google Scholar] [CrossRef]
  14. Li, H.-W.; Lui, W.-B. Sustainable reuse of derelict industrial area buildings—Case studies in Taiwan, Japan, and Germany. Int. J. Sustain. Build. Technol. Urban Dev. 2014, 5, 75–83. [Google Scholar] [CrossRef]
  15. Owley, J. Cultural heritage conservation easements: Heritage protection with property law tools. Land Use Policy 2015, 49, 177–182. [Google Scholar] [CrossRef]
  16. Surikova, A.M. Land legislation in the field of protection of cultural heritage: The experience of Russia, France and Germany. Agrar. Land Law 2020, 5, 90–93. [Google Scholar]
  17. Manea, G.; Matei, E.; Vijulie, I.; Tîrlă, L.; Cuculici, R.; Cocoş, O.; Tişcovschi, A. Arguments for Integrative Management of Protected Areas in the Cities—Case Study in Bucharest City. Procedia Environ. Sci. 2016, 32, 80–96. [Google Scholar] [CrossRef] [Green Version]
  18. Pecherskaya, E.P.; Dzhabborova, L.V.; Averina, L.V.; Firulina, I.I.; Ivankina, M.S.; Akopyan, D.A. Cultural heritage sites’ protected zones as a tool of urban environment development. Eurasia. J. BioSci. 2018, 12, 189–190. [Google Scholar]
  19. Knippschild, R.; Zöllter, C. Urban Regeneration between Cultural Heritage Preservation and Revitalization: Experiences with a Decision Support Tool in Eastern Germany. Land 2021, 10, 547. [Google Scholar] [CrossRef]
  20. Endo, Y.; Takamura, H. Evaluation of Life-Cycle Assessment Analysis: Application to Restoration Projects and New Construction in Alpine Climate, Japan. Sustainability 2021, 13, 3608. [Google Scholar] [CrossRef]
  21. Averina, L.V.; Myamina, I.S. Problems of Establishing Zones of Protection of Cultural Heritage Sites and Ways of Their Solution. Prop. Relat. Russ. Federation 2018, 4, 50–63. [Google Scholar]
  22. Tsareva, O.; Pshchelko, N.; Glazunov, V.; Yugov, A. Separation of Relative Deformations of Buildings from a General Displacement. Lect. Notes Civ. Eng. 2020, 70, 93–102. [Google Scholar] [CrossRef]
  23. Lapinskas, A.A.; Sodnombalova, T.G. The main provisions of the program “Digital Economy of the Russian Federation” and the prospects for its implementation. Econ. Yesterday Today Tomorrow 2020, 1, 645–652. [Google Scholar]
  24. Nedosekin, A.O.; Reishahrit, E.I.; Kozlovsky Nedosekin, A.N. Strategic Approach to Assessing the Economic Sustainability of Objects of the Mineral and Raw Materials Complex of Russia. J. Min. Inst. 2019, 1, 354–360. [Google Scholar] [CrossRef]
  25. Melnikov, N.N. Problems of correlation and interrelation between categorization of lands and zoning of territories in the system of legal regulators of land relations. Proc. Inst. State Law Russ. Acad. Sci. 2015, 1, 5–27. [Google Scholar]
  26. Kurashov, Y. Criteria for assessing cultural heritage sites: Cultural and historical aspect and legal decision. Acad. Bull. UralNIIproekt RAASN 2017, 4, 40–44. [Google Scholar]
  27. Trofimova, M.S. Protection zone and protective zone of a cultural heritage site in Russian legislation and a buffer zone in international law: On the question of the relationship between categories. Beneficium 2020, 3, 55–67. [Google Scholar]
  28. Bykova, E. Assessment of negative infrastructural externalities when determining the land value. J. Min. Inst. 2021, 247, 154–170. [Google Scholar] [CrossRef]
  29. Lepikhina, O.Y.; Pravdina, E.A. Variable accounting of pricing factors at land parcels cadastral valuation (on the example of Saint Petersburg). Bull. Tomsk Polytech. Univ. Geo Assets Eng. 2019, 330, 65–74. [Google Scholar] [CrossRef]
  30. Varlamov, A.A.; Kirillov, R.A. Formation of protection zones for a cultural heritage site of regional significance. Prop. Relat. Russ. Federation 2017, 1, 56–63. [Google Scholar]
  31. Bykowa, E.; Dyachkova, I.; Zasenko, V.; Monev, P. Substantiation of Factors for Assessing the Historical and Cultural Value of the Territories of Settlements Using Digital Technologies. In Global Challenges of Digital Transformation of Markets, 1st ed.; Barykin, S.E., de la Poza, E., Eds.; Nova Science Publishers: Hauppauge, NY, USA, 2021; p. 626. [Google Scholar]
  32. Cherepovitsyn, A.E.; Ilinova, A.A. Methods and tools of scenario planning in areas of natural resources management. Eur. Res. Stud. J. 2018, 21, 434–446. [Google Scholar]
  33. Romanchikov, A.Y.; Kovyazin, V.F.; Zhivotyagina, N.I.; Kitsenko, A.A.; Dang, T.L. Algorithm of mass cadastral assessment of forest land by taxation indicators of plantations. Bull. Tomsk Polytech. Univ. Georesour. Eng. 2020, 11, 108–116. [Google Scholar] [CrossRef]
  34. Semenov, V.P.; Mikhailov, Y.I. Problems and directions of development of quality management in the conditions of industrial raw materials economy. J. Min. Inst. 2017, 226, 497–502. [Google Scholar] [CrossRef]
  35. Antipov, I.; Antonov, A.; Jolshin, D.; Savchenok, A.; Tarasenko, A.; Yakovlev, D. Natural stone in the 14th–15th-Century secular buildings of the Novgorod Kremlin. J. Cult. Herit. 2021, 48, 312–318. [Google Scholar] [CrossRef]
  36. Pashkevich, M.A.; Bech, J.; Matveeva, V.A.; Alekseenko, A.V. Biogeochemical assessment of soils and plants in industrial, residential and recreational areas of Saint Petersburg. J. Min. Inst. 2020, 241, 125–130. [Google Scholar] [CrossRef]
  37. D’Amato, M. Supporting property valuation with automatic reconciliation. J. Eur. Real Estate Res. 2018, 331, 125–138. [Google Scholar] [CrossRef]
  38. Orlova, I.; Filonova, E. The choice of exogenous factors in the regression model with multi-collinear data. Int. J. Appl. Basic Res. 2015, 5, 108–116. [Google Scholar]
  39. Nazarov, K.S.; Valiev, D.S. Principles of land management in the EU and in Russia. Int. Econ. 2018, 7, 64–77. [Google Scholar]
  40. Lavrentiev, V.A.; Mamedov, A.M.O.; Blokhin, M.A. Improving the efficiency of forecasting the economic characteristics of insurance companies using the least squares method. Innov. Econ. Prospect. Dev. Improv. 2020, 2, 135–141. [Google Scholar]
  41. Danilov, A.; Pivovarova, I.; Krotova, S. Geostatistical Analysis Methods for Estimation of Environmental Data Homogeneity. Sci. World J. 2018, 1–7. [Google Scholar] [CrossRef] [Green Version]
  42. Rybkina, A.M.; Demidova, P.M.; Kiselev, V.A. Analysis of the Application of Deterministic Interpolation Methods for Land Cadastral Valuation of Low-Rise Residential Development of Localities. Int. J. Appl. Eng. Res. 2017, 12, 10834–10840. [Google Scholar]
  43. Kremer, N.S.; Putko, B.A. Econometrics, 1st ed.; UNITY-DANA: Moscow, Russia, 2002; pp. 150–181. [Google Scholar]
  44. Shetty, D.V.; Rao, B.P.; Prakash, C.; Vaibhava, S. Multiple regression analysis to predict the value of a residential building and to compare with the conventional method values. J. Phys. Conf. Ser. 2020, 1706, 012118. [Google Scholar] [CrossRef]
  45. Khamis, A.; Kamarudin, N.K. Comparative study on estimate house price using statistical and neural network model. Int. J. Sci. Technol. Res. 2014, 3, 126–131. [Google Scholar]
  46. Gnat, S. Property Mass Valuation on Small Markets. Land 2021, 10, 388. [Google Scholar] [CrossRef]
  47. Versaci, A.; Cardici, A. On the safeguarding of the sites and historic areas: A study on the evolution of the French legal system. In Best Practices in Heritage Conservation and Management. From the World to Pompeii. XII Forum Internazionale di Studi; Piscitelli, M., Ed.; La Scuola di Pitigora Editrice: Napoli, Italy, 2014; pp. 447–456. [Google Scholar]
  48. Martin, O.; Piatti, G. (Eds.) World Heritage and Buffer zone. In Proceedings of the International Expert Meeting on World Heritage and Buffer Zones, Davos, Switzerland, 11–14 March 2008. [Google Scholar]
  49. Conradin, K.; Hammer, T. Making the Most of World Natural Heritage—Linking Conservation and Sustainable Regional Development? Sustainability 2016, 8, 323. [Google Scholar] [CrossRef] [Green Version]
Figure 1. The number of cultural heritage sites in Russian historical settlements.
Land 10 01201 g001
Figure 2. The ratio of cultural heritage sites for which zones of protection of cultural heritage sites are established and sites without them in the European part of Russia.
Land 10 01201 g002
Figure 3. Location of Orenburg within Russia.
Land 10 01201 g003
Figure 4. Development plan of the historical center of Orenburg is the territory of the former Orenburg fortress.
Land 10 01201 g004
Figure 5. Stages of determining the mathematical form of the size of protection zones of cultural heritage sites.
Land 10 01201 g005
Figure 6. Factors of historical and cultural assessment of territories.
Land 10 01201 g006
Figure 7. Developing the model of the protection zone.
Land 10 01201 g007
Figure 8. Model plot of the size of the protection zone of cultural heritage sites in the example of Orenburg, km2.
Land 10 01201 g008
Figure 9. Designing the boundary of protection zones of the cultural heritage site “City estate of M.M. Timofeev Residential House,” located at 24 Pushkin str., Orenburg.
Land 10 01201 g009
Table 1. Scoring scale of urban planning factor.
Reference SiteScoreCharacteristicExamples in Orenburg
Architectural dominant, architectural accent 5Forms planning, compositional and historical environment in the immediate vicinity, closes the street perspectiveHussaini ensemble, descent to the Ural River, building of Orenburg State University
Valuable city-forming site4Positively affects the formation of the historical and cultural environment, maintains the rhythm of space, clearly characterizes the local features of the settlementTypical two-story estate development on 9th January Street
Common (background) site3The site of modern development, which preserves the historical and cultural environment, maintains the general view of the developmentBuilding of Orenburg State Pedagogical University
Harmonious site2The site of modern development fits into the urban environment, but violates the background development with individual elementsAdministrative building on Pushkin Street, modern development
Disharmonious site1Negatively affects the formation of the historical and cultural environment of the territory, creates discord in the environment, violates the architectural scene of the urban environment by its appearance (cladding, building facade style), height (number of stories), functions performed (garage or outbuilding near a valuable site)Long-term construction on Sovetskaya Street
Table 2. Quality indicators of the PZ area model.
Quality Criterion for the Developed ModelActual Value Critical ValueCondition of ComplianceConclusions
Determination coefficient R20.506Chadok scaleIndicator value <0.6; noticeable correlation.Not compliant.
Fisher’s coefficient F0.8693.072Ftabl > FobsThe quality condition Ftabl < Fobs is not met. The model is not in compliance.
Values of Student’s t-test for coefficients of factors
Urban planning xF10.5272.08ttabl < tobsNot significant. The actual value of the t-criterion is less than the table value.
Landscape and environmentalxF20.512
Historical and memorialxF3−0.791
CulturalxF40.991
Emotional and artisticxF50.516
EconomicxF6−0.768
ProtectionxF7−0.791
FunctionalxF80.620
Construction and technicalxF91.108
Presence of landscape gardening and recreation areas in the nearby territoryxF10−0.201
Uniqueness of the natural landscape and hydrologyxF110.877
Possession of educational, patriotic, spiritual, and aesthetic valuexF120.854
Degree of uniqueness of the technical construction of a structure, the latest building materials and technologies, constructive solutionxF13−1.449
State of preservation of the objectxF140.527
Analysis of residuals
Durbin–Watson criterion DWCannot be calculated for more than 9 factors.
Breusch–Godfrey testr = 0.003 T = 0.007,
tcr = 1.71
tcr > TThe correlation coefficient is insignificant. The autocorrelation of residuals is present.
Kolmogorov–Smirnov criterion0.989ƛ0.05 = 1.36 ƛobs < ƛcritThe residuals are distributed normally.
Table 3. Quality indicators of the security zone area model.
Quality Criterion for the Developed ModelActual ValueCritical ValueCondition of ComplianceConclusions
Determination coefficient R20.710Chadok scaleR2 > 0.7; high correlation.The condition is met. The model sufficiently describes the initial data.
Fisher’s coefficient F12.2123.072Ftabl < FobsThe condition is met.
The regression equation is significant.
Values of the Student’s t-criterion for the coefficients of the security zone area model
Urban planning−4.4562.078ttabl < tobsCompliant. Equation coefficients are significant.
Historical3.139
Possession of educational, patriotic, spiritual, and aesthetic value−2.989
Degree of uniqueness of the technical construction of a structure, the latest building materials and technologies, constructive solution−2.307
Analysis of residuals
Durbin–Watson criterion1.412dL = 1.04
dU = 1.77
dL < d < dUThe condition is met. There is no autocorrelation between the residuals.
Kolmogorov–Smirnov criterion0.596ƛ0.05 = 1.36 ƛobs < ƛ crit The residuals are distributed normally.
Table 4. Elasticity coefficients of a function.
FactorThe Value of the Coefficient of Elasticity EInterpretation
Urban factor −4.531The area of the protection zone decreases by 4.53%, with an increase in the importance of the object in the urban planning environment (from a discordant object to an urban planning dominant) by 1%.
Historical factor0.960The area of the protection zone increases by 0.96%, with an increase in the historical value of the object by 1%.
Factor “Possession of educational, patriotic, spiritual, and aesthetic value”−0.010The area of the protection zone decreases by 0.01% with an increase in the value of the educational and spiritual value of the object by 1%.
Factor “The degree of uniqueness of the technical construction of a structure, the latest building materials and technologies, a constructive solution”−0.333The area of the protection zone is reduced by 0.33%, with an increase in the degree of uniqueness of technical construction and design solutions by 1%.
Table 5. Elasticity coefficients of a function.
Quality Criterion for the Developed ModelActual Value Critical ValueCondition of ComplianceConclusions
Determination coefficient R20.64Chadok scaleR2 > 0.6. Noticeable correlation.Compliant. The model sufficiently describes the initial data.
Fisher’s coefficient F8.9053.072Ftabl < FobsCompliant.
Regression equation is significant.
Values of Student’s t-criterion for the coefficients of the DCZ model
Cultural factor2.6432.080ttabl < tobsThe condition is met. Equation coefficients are significant.
Protection factor 2.235
Functional factor −4.661
Factor “Uniqueness of natural landscape and hydrology”−2.489
Analysis of residuals
Durbin–Watson criterion DW1.470dL = 1.04
dU = 1.77
(table of critical values)
dL < d < dUThe condition is met. There is no autocorrelation between the residuals.
Kolmogorov–Smirnov criterion0.506ƛ0.05 = 1.36 ƛobs < ƛcrit The residuals are distributed normally.
Table 6. Differentiation of the factors of historical and cultural assessment of lands in the process of establishing the area of protection zones for cultural heritage sites, depending on the type of zone.
FactorCharacteristics of the Urban EnvironmentProtection TerritoryDCZ&BACZ
CulturalCharacteristics of the cultural and social orientation of the buildingO
ProtectionProtection categoryO
Construction and technicalAssigning the object to architectural styleO
Landscape and environmentalCharacteristics of the natural landscape in the context of the urban planning structureO
FunctionalThe degree of adaptation in modern conditionsO
Degree of uniqueness of the technical construction of a structure, the latest building materials and technologies, constructive solutionThe peculiarity of the height, width of spans, underground deepening, structures for their time of creationO
Educational valueTourist interest in the object, its patriotic and educational valueO
Urban planningCharacteristics of the planning, compositional-spatial, scale structureO
Historical and memorialCharacteristics of the memorial and event layerO
The symbol ✓ means that the factor is included in the model and affects the size of the zone, and the symbol O means that the factor is not included in the model and does not affect the establishment of the boundaries of this zone type.
Table 7. Application of the protection zone and development and economic activity control zones model on test sites.
Cultural Heritage SiteArea of the Zone Calculated by the Models, Sq. M.
Protection ZoneDevelopment and Economic Activity Control Zones
Tenement house5720.03031.8
City estate of M.M. Timofeev
Residential House
7640.73031.8
Typical example of urban development; modern3269.63031.8
Public garden near the House of Soviets7874.110,946.9
House of Soviets. An example of Soviet architecture of the 1930s 33,619.118,862.0
House of the merchant
E.V. Mazovaya
4446.610,256.5
Residential city estate; brick style4446.610,946.9
Publisher’s Note: MDPI stays neutral with regard to jurisdictional claims in published maps and institutional affiliations.

