Article

How Different Are Population Movements between Weekdays and Weekends: A Complex-Network-Based Analysis on 36 Major Chinese Cities

1
School of Resource and Environmental Sciences, Wuhan University, Wuhan 430072, China
2
Key Laboratory of Urban Land Resources Monitoring and Simulation, Ministry of Natural Resources, Shenzhen 518060, China
3
Technology Innovation Center of Territory & Spatial Big Data, MNR & Research Institute for Smart Cities, School of Architecture and Urban Planning, Shenzhen University, Shenzhen 518060, China
4
Research Institute for Smart Cities, Shenzhen University, Shenzhen 518000, China
*
Author to whom correspondence should be addressed.
Land 2021, 10(11), 1160; https://doi.org/10.3390/land10111160
Submission received: 26 September 2021 / Revised: 26 October 2021 / Accepted: 28 October 2021 / Published: 29 October 2021
(This article belongs to the Section Urban Contexts and Urban-Rural Interactions)

Abstract

:
With the rapid development of Information and Communications Technology (ICT) and transportation infrastructure, the flows of people between cities have become the cornerstone of shaping regional integration. Although research studies about the movement of people have aroused widespread interest in academia, research about the temporal and spatial dynamics of daily mobility between cities is sparse, which is called the temporal heterogeneity of mobility between cities. This research aims to study the temporal and spatial changes (Heterogeneity) of population mobility between cities, using big data obtained through China Unicom, in terms of mapping the spatial network of population mobility and complex network analysis, from which the following findings emerge: (1) On weekends, the gap between cities in the number of floating population flow and the capacity of transferring population has become smaller, indicating that there is better coordination between cities on weekends. (2) There are huge differences in population flow between cities, which reflects the imbalance of urban development, population is more concentrated in cities with higher level of development. (3) The heterogeneity of population flow between cities at weekdays and weekends is closely related to the city’s hierarchy, which can help us study the hierarchical structure of China’s cities from a dynamic perspective. The paper emphasizes the importance of researching heterogeneity issues, clarifies the difference between the heterogeneity of weekdays and weekends and the heterogeneity involved in previous population research fields in terms of population flow and deficiencies in research.

1. Introduction

Since the reform and opening up in 1978, population mobility between cities is one of the largest and most influential geographical processes in China [1,2]. Population mobility [3] is considered as the re-allocation of production factors in space; the mobility of population in a specific space promotes the reaggregation and diffusion of social and economic factors, thus reshaping patterns of population distribution [4]. The spatial patterns of population movements reflect the relationship between cities and constitutes important traffic demands between cities [5,6,7]. For a country with a large land area, such as China, analyzing the pattern of population mobility is of great significance for understanding economic and social development.
Traditional human mobility/population flow research has been conducted primarily based on static data, such as census data or statistical yearbooks, which are unable to dynamically capture the spatial patterns of rapid mobility and urban development in real time and thus cannot directly and accurately reflect the directions and patterns of population flow. Many scholars have researched population mobility based on big data with location information, which has the benefit of high accuracy and large sample size [8]. Among them, Gariazzo and Pelliccioni analyzed the spatial characteristic and patterns of human movement [9], and Lee et al. compared urban characteristics using mobile phone data [10]. That means, research on human mobility rarely pays attention to the temporal heterogeneity of human movement. In other words, different travel behaviors tend to occur in different periods and are linked with spatial-temporal changes, leading to the geographical diversity of mobility between cities. Investigating spatial and temporal patterns is one of the foundations to understand mobility [11]. Population mobility occurring at different times may represent different spatial structures. For example, population movements during the weekday, weekend, and national holidays reflect different patterns of population movement and may exhibit different dynamic characteristics and patterns of movement. To put it another way, the geographical distribution of population movement between cities is greatly affected by the time dimension of migration, while the role of time variation has been neglected in previous studies. Studies about temporal heterogeneity of population mobility may focus more on specific holidays, such as the Spring Festival (the large-scale population movement before and after the Spring Festival in China has formed the phenomenon of social behavior with remarkable regularity, high concentration and uniformity during the Spring Festival) and the ‘Golden Week’ of May [12,13]. There has been little research on the heterogeneity of population movements governing the weekday and weekend.
In this study, mobile phone signaling big data from China Unicom, one of China’s three major operators, were used to investigate the temporal and spatial characteristics and heterogeneity of population flow during weekdays and weekends in China. Such big data have some apparent advantages compared with other data sources, First, the data is relatively comprehensive, including population mobility at large scale. Second, the data has strong continuity, and its accuracy can reach the personal level. Therefore, the results of data analysis are more reliable.
In addition, when studying the characteristics of population flow between cities, we often regard cities as network nodes and use the population flow between two cities as the edge weight of network nodes. Therefore, complex network theory can be used to study such data [3,14], and it can accurately represent the relationship between network nodes from different angles, evaluate the results of network nodes,. and provide sufficient technical support for a quantitative analysis of population mobility.
This paper aims to explore temporal heterogeneity by comparing the difference in human mobility patterns between weekday and weekend. To this end, we obtained the population daily mobility data between 36 cities and more than 300 prefecture-level cities in China during the weekday and weekend from the big data of China Unicom, and we applied network analysis methods to conduct this study. The significance of this paper lies in the following aspects: First, we use big data of location instead of traditional static statistics to ensure the timeliness of the data. Second, we examined the hierarchical structure of Chinese cities from the perspective of population flow through two centrality indicators: Degree and Betweenness. In addition, we observe the 20% of cities accommodate nearly 80% of population flows from the Pareto distribution of two metrics. Third, this paper indicates the disproportionate ratio of city’s centrality was more striking on weekends than on weekdays. Fourth, the metric of network diversity was adopted to examine the extent of imbalanced population flows between cities, and the heterogeneity of urban network diversity on weekdays and weekends is closely related to the city’s hierarchy, which can help us study the hierarchical structure of Chinese cities from a dynamic perspective. For a more comprehensive investigation of the heterogeneous population, we compared the weekday-weekend differences using the above-mentioned centrality metrics derived from the population mobility network. The followed contents organized as follows: Section 2 focusing on the complex network analysis method and explains the selection of data and indicators; Section 3 studies the spatial characteristics and differences of human mobility of 36 cities on weekdays and weekends; the conclusion and discussion will be drawn out in the fourth and fifth parts.

2. Data and Methods

2.1. Data

According to the data from the Telecommunications industry, released by the Ministry of Industry and Information Technology, as of the end of 2018, the total number of mobile phone users nationwide reached 1.57 billion, with an average of 1.12 mobile phone cards per capita. Second, mobile phone data is real-time and more continuously record the temporal and spatial changes of residents’ activities. Whether it is active or passive behavior, it will leave a record in the operator’s network. Third, the mobile phone data collection cost is low, and it is easy to collect data continuously for multiple days. after long-term observation and analysis, we can dig out the general characteristics and activity patterns of residents’ multi-day behavior. Fourth, the respondent cannot intervene in the real-time collection of mobile phones signaling data, and the data is more objective and effective. LBS services are currently provided by current large-scale Internet companies in China, such as Baidu, Tencent, Amap, and others. The data used in this study comes from China Unicom, one of the three major operators. Its main features are: (1) It provides the records of 36 major cities with prefecture-level cities as the main unit and moving in and out daily, (2) and it identifies data on population movement based on 3 single modes of transportation: road, rail, air, or the combination of 3 modes. It should be noted that China Unicom provides an absolute number of inter-city traffic, not a relative value.
China Unicom phone signaling big data collection period is 8 weeks in total, excluding the Spring Festival and November weekends, and one usual week is selected every two months; the data are as follows: 8–14 January 2018, 15–21 February 2018, 2–8 April 2018, 20–26 June 2018, 4–10 August 2018, 3–9 September 2018, 1–7 October 2018, 10–16 December 2018. China Unicom phone signaling big data is obtained through data cleaning and sample expansion. Compared with other data sources (Statistical data, data from internet companies and other operators), the correlation coefficient is 0.9, indicating that the data has strong availability and can reflect the overall characteristics of population flow in China. After collecting, cleaning, and processing, we obtain the average daily population flow data of 36 major cities on weekdays and weekends, but the Taiwan Province, Hong Kong Special Administrative Region, and Macao Special Administrative Region were not included because of the lack of data.
We consider each city as a network node, and, if OD records exist between cities, these two cities are in “Connected” state, and their population flows are regarded as the weights of connected edges. Based on the above data, this paper constructs population mobility network between 36 major cities and 298 cities. The analysis finds that the average daily population flow in 36 major cities during weekends increases by 28.5% compared with the total weekdays (Table 1), and mainly shows the characteristics of the core city as the hub to the surrounding cities.

2.2. Methods

Starting with Watts and Strongatzs study of small-world networks and Barabasi and Albert’s study of scale-free networks [3,14], complex networks have been studied in various fields, such as biological networks [15], social relations networks [16], aviation networks [17], economic fields [18], etc. Distinct from simple or regular network, complex networks often times exhibit a great heterogeneity regarding their centrality metrics, such as degree and betweenness [19,20]. Such a heterogeneity can be well-gauged by Parentian statistics, or power law distribution in particular. In this study, we make use of the built population flow network and calculate three metrics, i.e., degree, betweenness, and diversity, to assess how important of each node is in the network. Next, we conduct the power law examination on those metrics. The comparison between power law metrics on weekdays and weekends help us explore the temporal characteristics of China’s urban population mobility network.

2.2.1. Metrics for the Network

(1)
Degree centrality
In order to reveal the centrality of cities in the network, degree centrality indicators are selected in this paper. Degree centrality indicates the absolute strength of city in the network; the larger its value, the higher the absolute strength of the city in network [21]. In weighted networks, traditional method of calculating the degree centrality CD(i) of node i is defined as:
C D ( i ) = j V w i j
where V is the set of nodes in a network, and w i j is the weight of the edge from node i to node j.
(2)
Betweenness centrality
Betweenness centrality is a structural location indicator that can measure the influence and control of a city in interactions with other cities in the population mobility network. The betweenness of inference is used to measure the frequency of the shortest path of a certain node in the network, which is also called the betweenness centrality [22]. City-node acts as a bridge connecting other node cities. Objects with higher intermediate properties are more important in the network and have better controllability to other nodes. The betweenness centrality B i of city i is given by:
B i = s , t v δ s t ( s , t | i ) δ ( s , t )
where δ ( s , t ) is the number of shortest paths between city-node pair ( s , t ), and δ s t ( s , t | i ) is the number of all shortest paths passing city-node i.
(3)
Network Diversity
An important aspect of the mobility of a city is the diversification of the city and the destination of people [23]. Nathan Eagle et al. used Shannon entropy to quantify the topological diversity of networks and measure the social and spatial diversity of communication ties in personal social networks [24]. This paper builds on this to apply it to population mobility and evaluate the diversity of cities in population mobility network. Network Diversity D(i)’s calculation formulas are shown in Formula (4):
p i j = V i j j = 1 k V i j
D ( i ) = j = 1 n p i j log ( p o p i j ) log ( n )
where n is the number of cities connected to city i, and p o p i j is the proportion of population flow between i and j. V i j is the size of population flow between city i and j, and it is normalized by the log of the number of cities n has visited. Network diversity scores is high when a city’s population migration between other cities is more even.

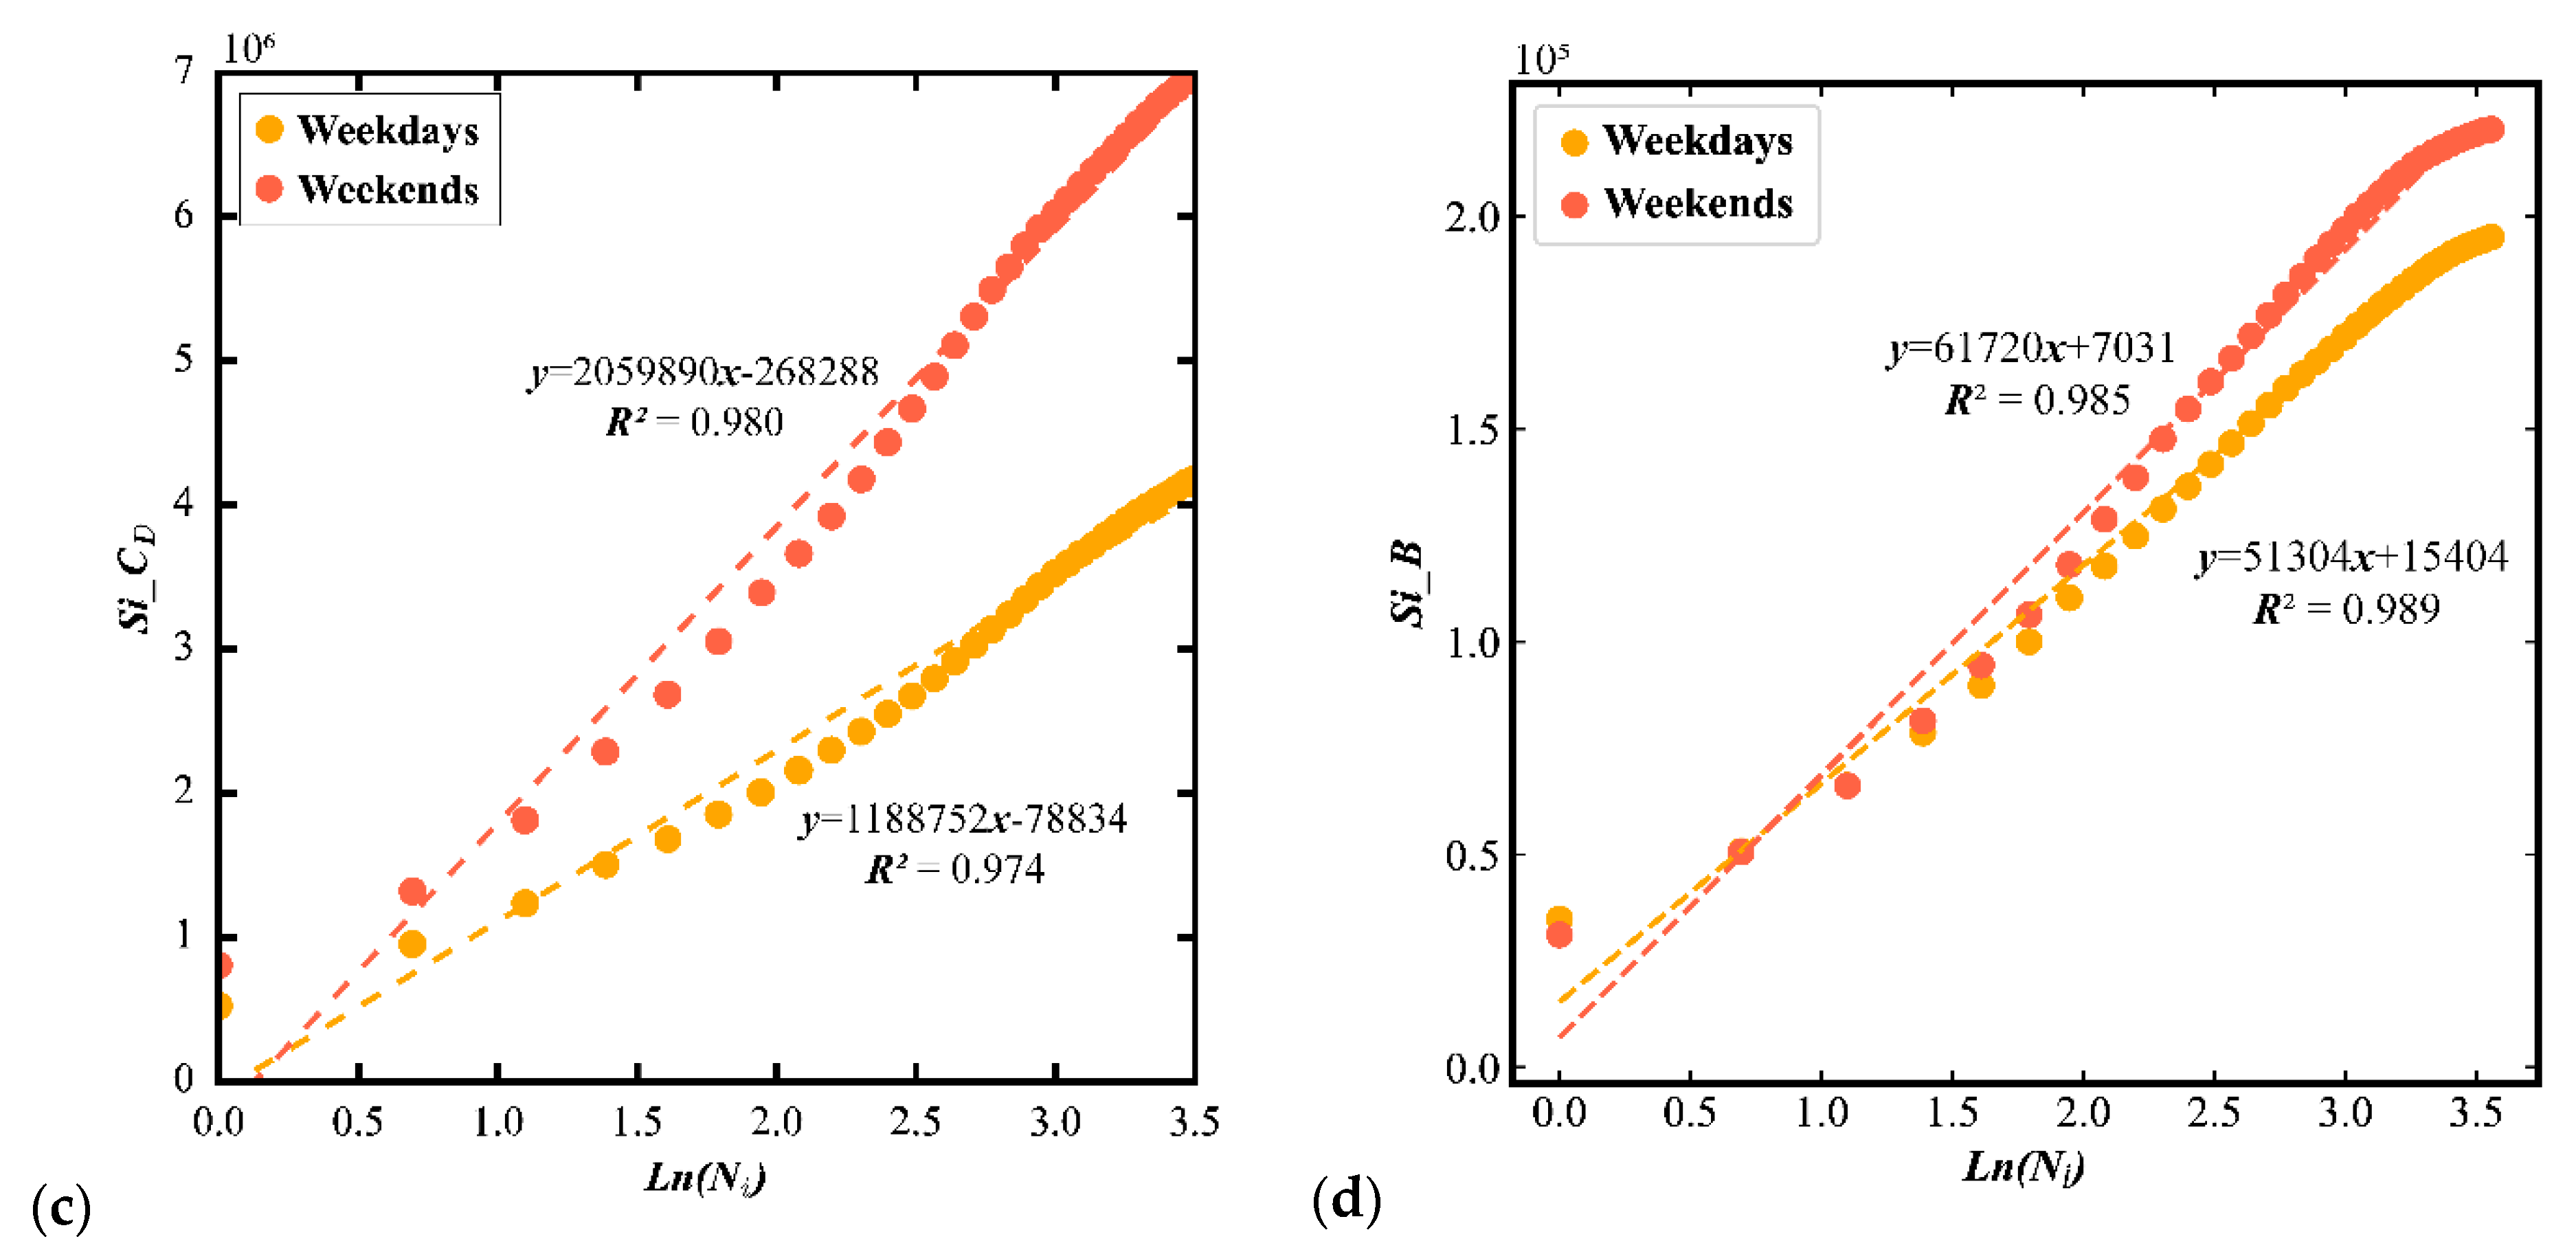
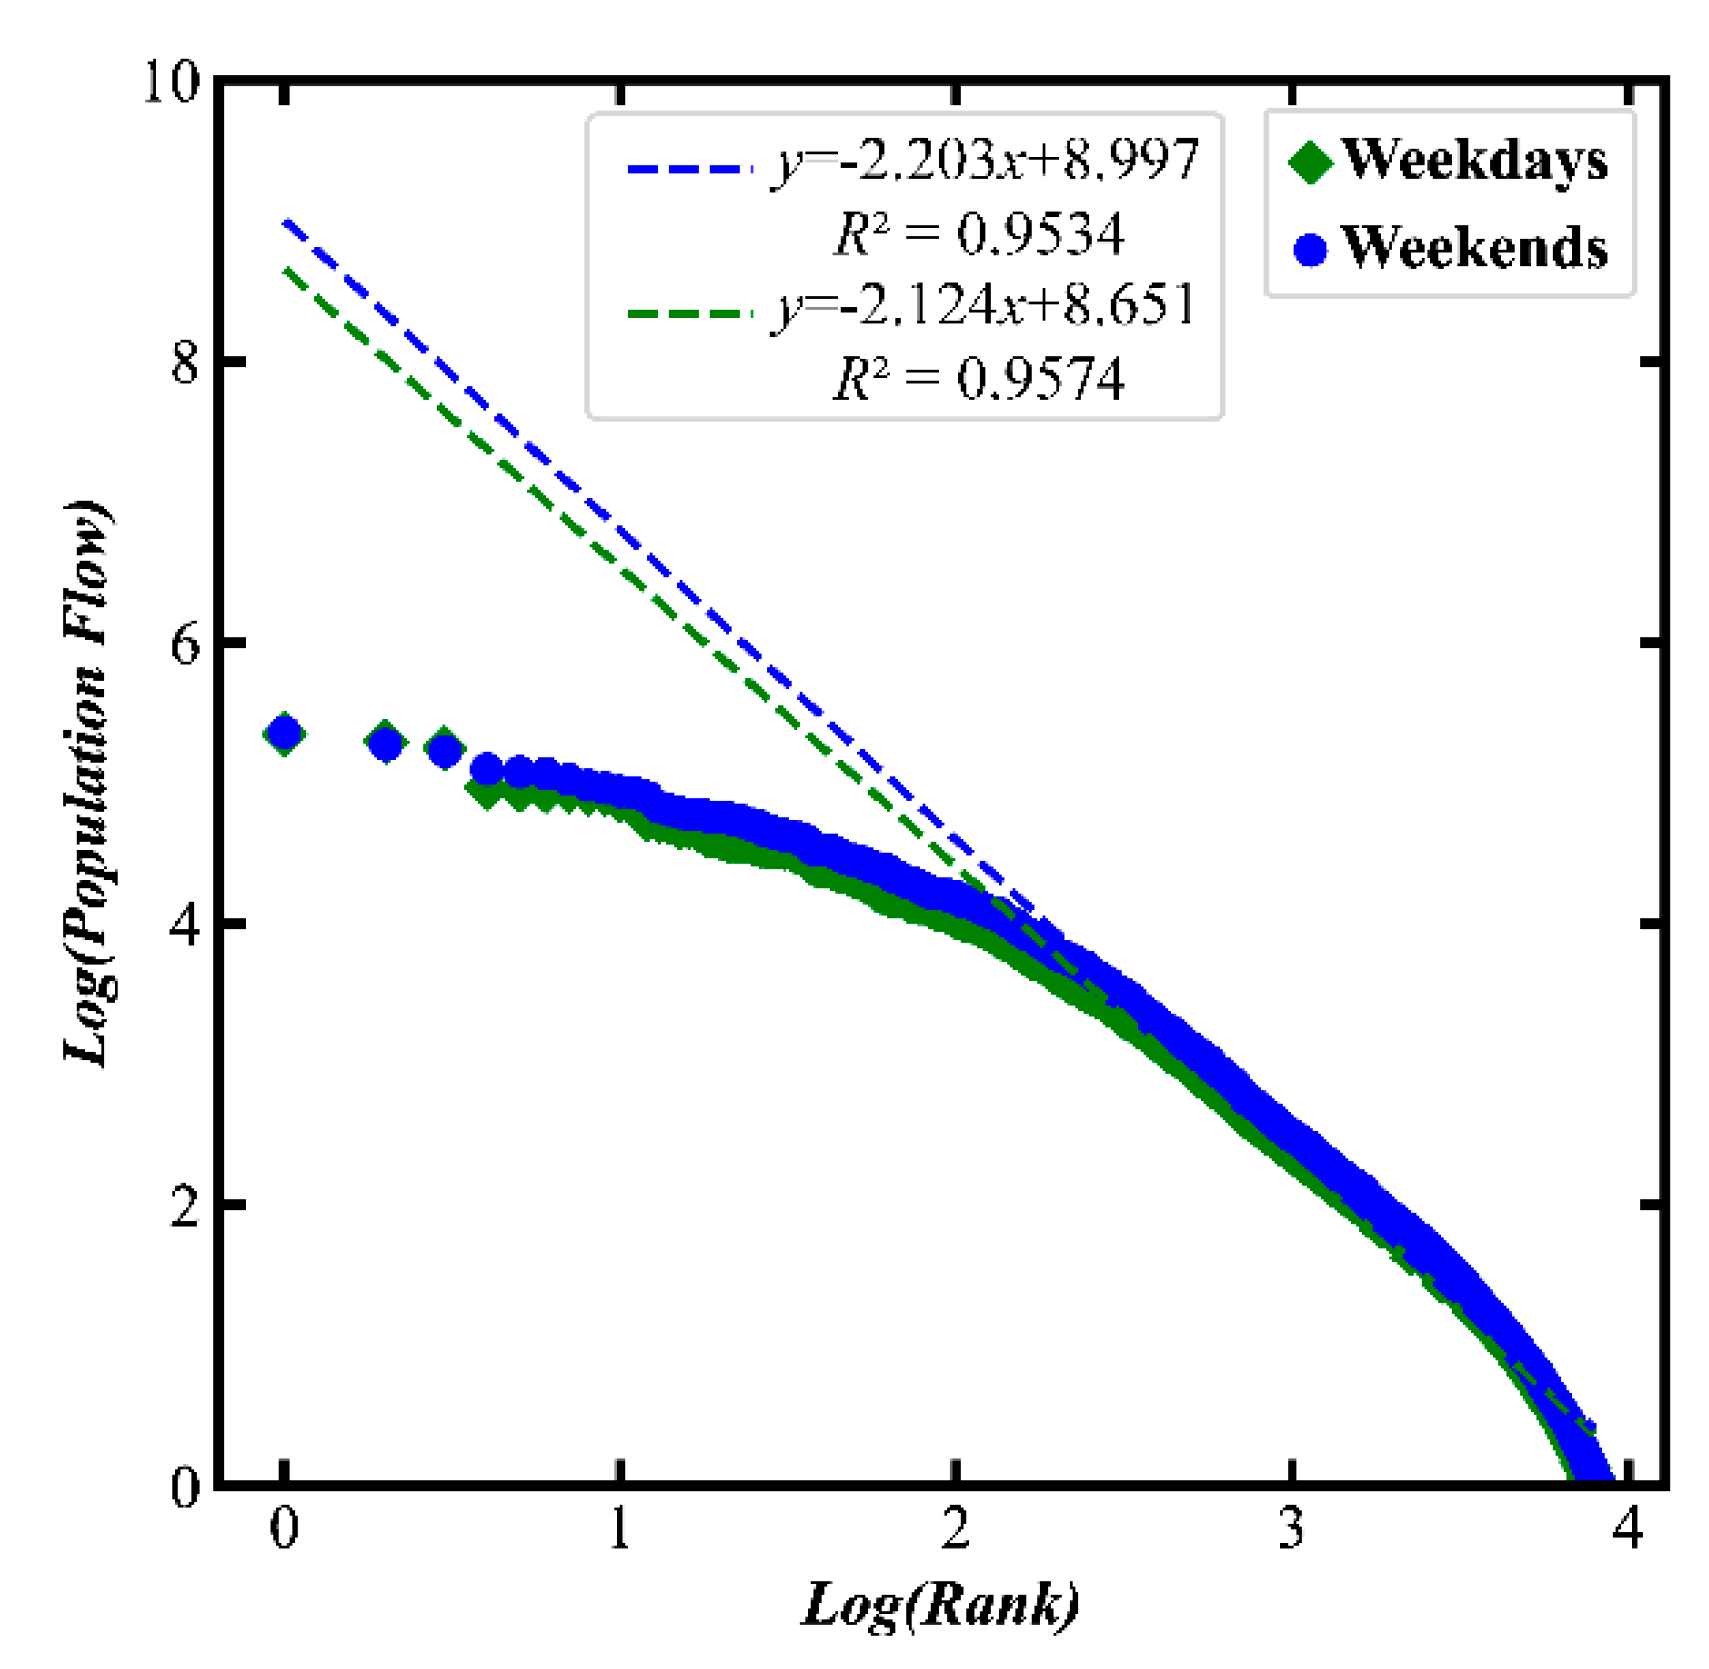
2.2.2. Power Law Examination of City-Related Metrics

City-related statistics often exhibit a power-law distribution. A power law distribution denotes the probabilities of a value (Y) being proportional to some power of a quantity (X). To examine a power law, one can simply take logarithm scale on both axes to check if the distribution appears as a straight line. Note that the distribution line after taking logarithms of real-world data is often not entirely straight, but they still hold long-tailed characteristics.
The most prominent example of power-law-distributed city-related statistics is city size. Prior studies have shown that, in many countries, city size is reciprocal to its rank, namely the Zipf’s law [25,26,27]. The power law exponent of a Zipf distribution is equal to 1. For instance, if we rank all cities from the largest to the smallest (rank-size model), the size of the largest city is 1, then the second largest is ½, the third largest is 1/3, and so on. Such a statistical regularity can be formulated as:
P i = P 1 × R i 1
where P i denotes the size of ith city, and R i is the ith rank of that city.
However, although Zipf’s law can be detected across many different countries or regions, it is hard to spot the statistical difference of city sizes from one country/region to another. In other words, the exponents being Zipf distribution only deviate slightly from 1, leading to little meaningful comparison from a statistical perspective. In order to formulate a more nuanced understanding between network metrics on weekdays and weekends, this study borrowed the idea of a rank cumulative size model [28], stated by the following equation:
S i = β × L n ( N i ) + S 1 ,
where Si denotes the summed value of city sizes from 1st rank to ith rank, and β is the exponent of accumulated city sizes at ith rank. This way, β characterizes the growth of city sizes and, thereby, becomes more sensitive than the exponent of the rank-size counterpart. The higher the value of β, the smaller the relative gap in city sizes between cities.
Power law also refers to the Pareto distribution. As is well-known, within a Pareto distribution, there are always many small values while very few larges, of which the imbalanced ratio between smalls and larges is often termed as the 80/20 rule or Pareto Principle [29,30]. Therefore, we can derive the inherent hierarchy of cities upon the 80/20 partition (Figure 1). To do this, we recursively classify the average daily population flow between cities: first level accounts for 80% of the total population mobility, second level is to occupy 80% of the total amount of the remaining 20% population flow network, and the process continues until no data is left.

3. Results

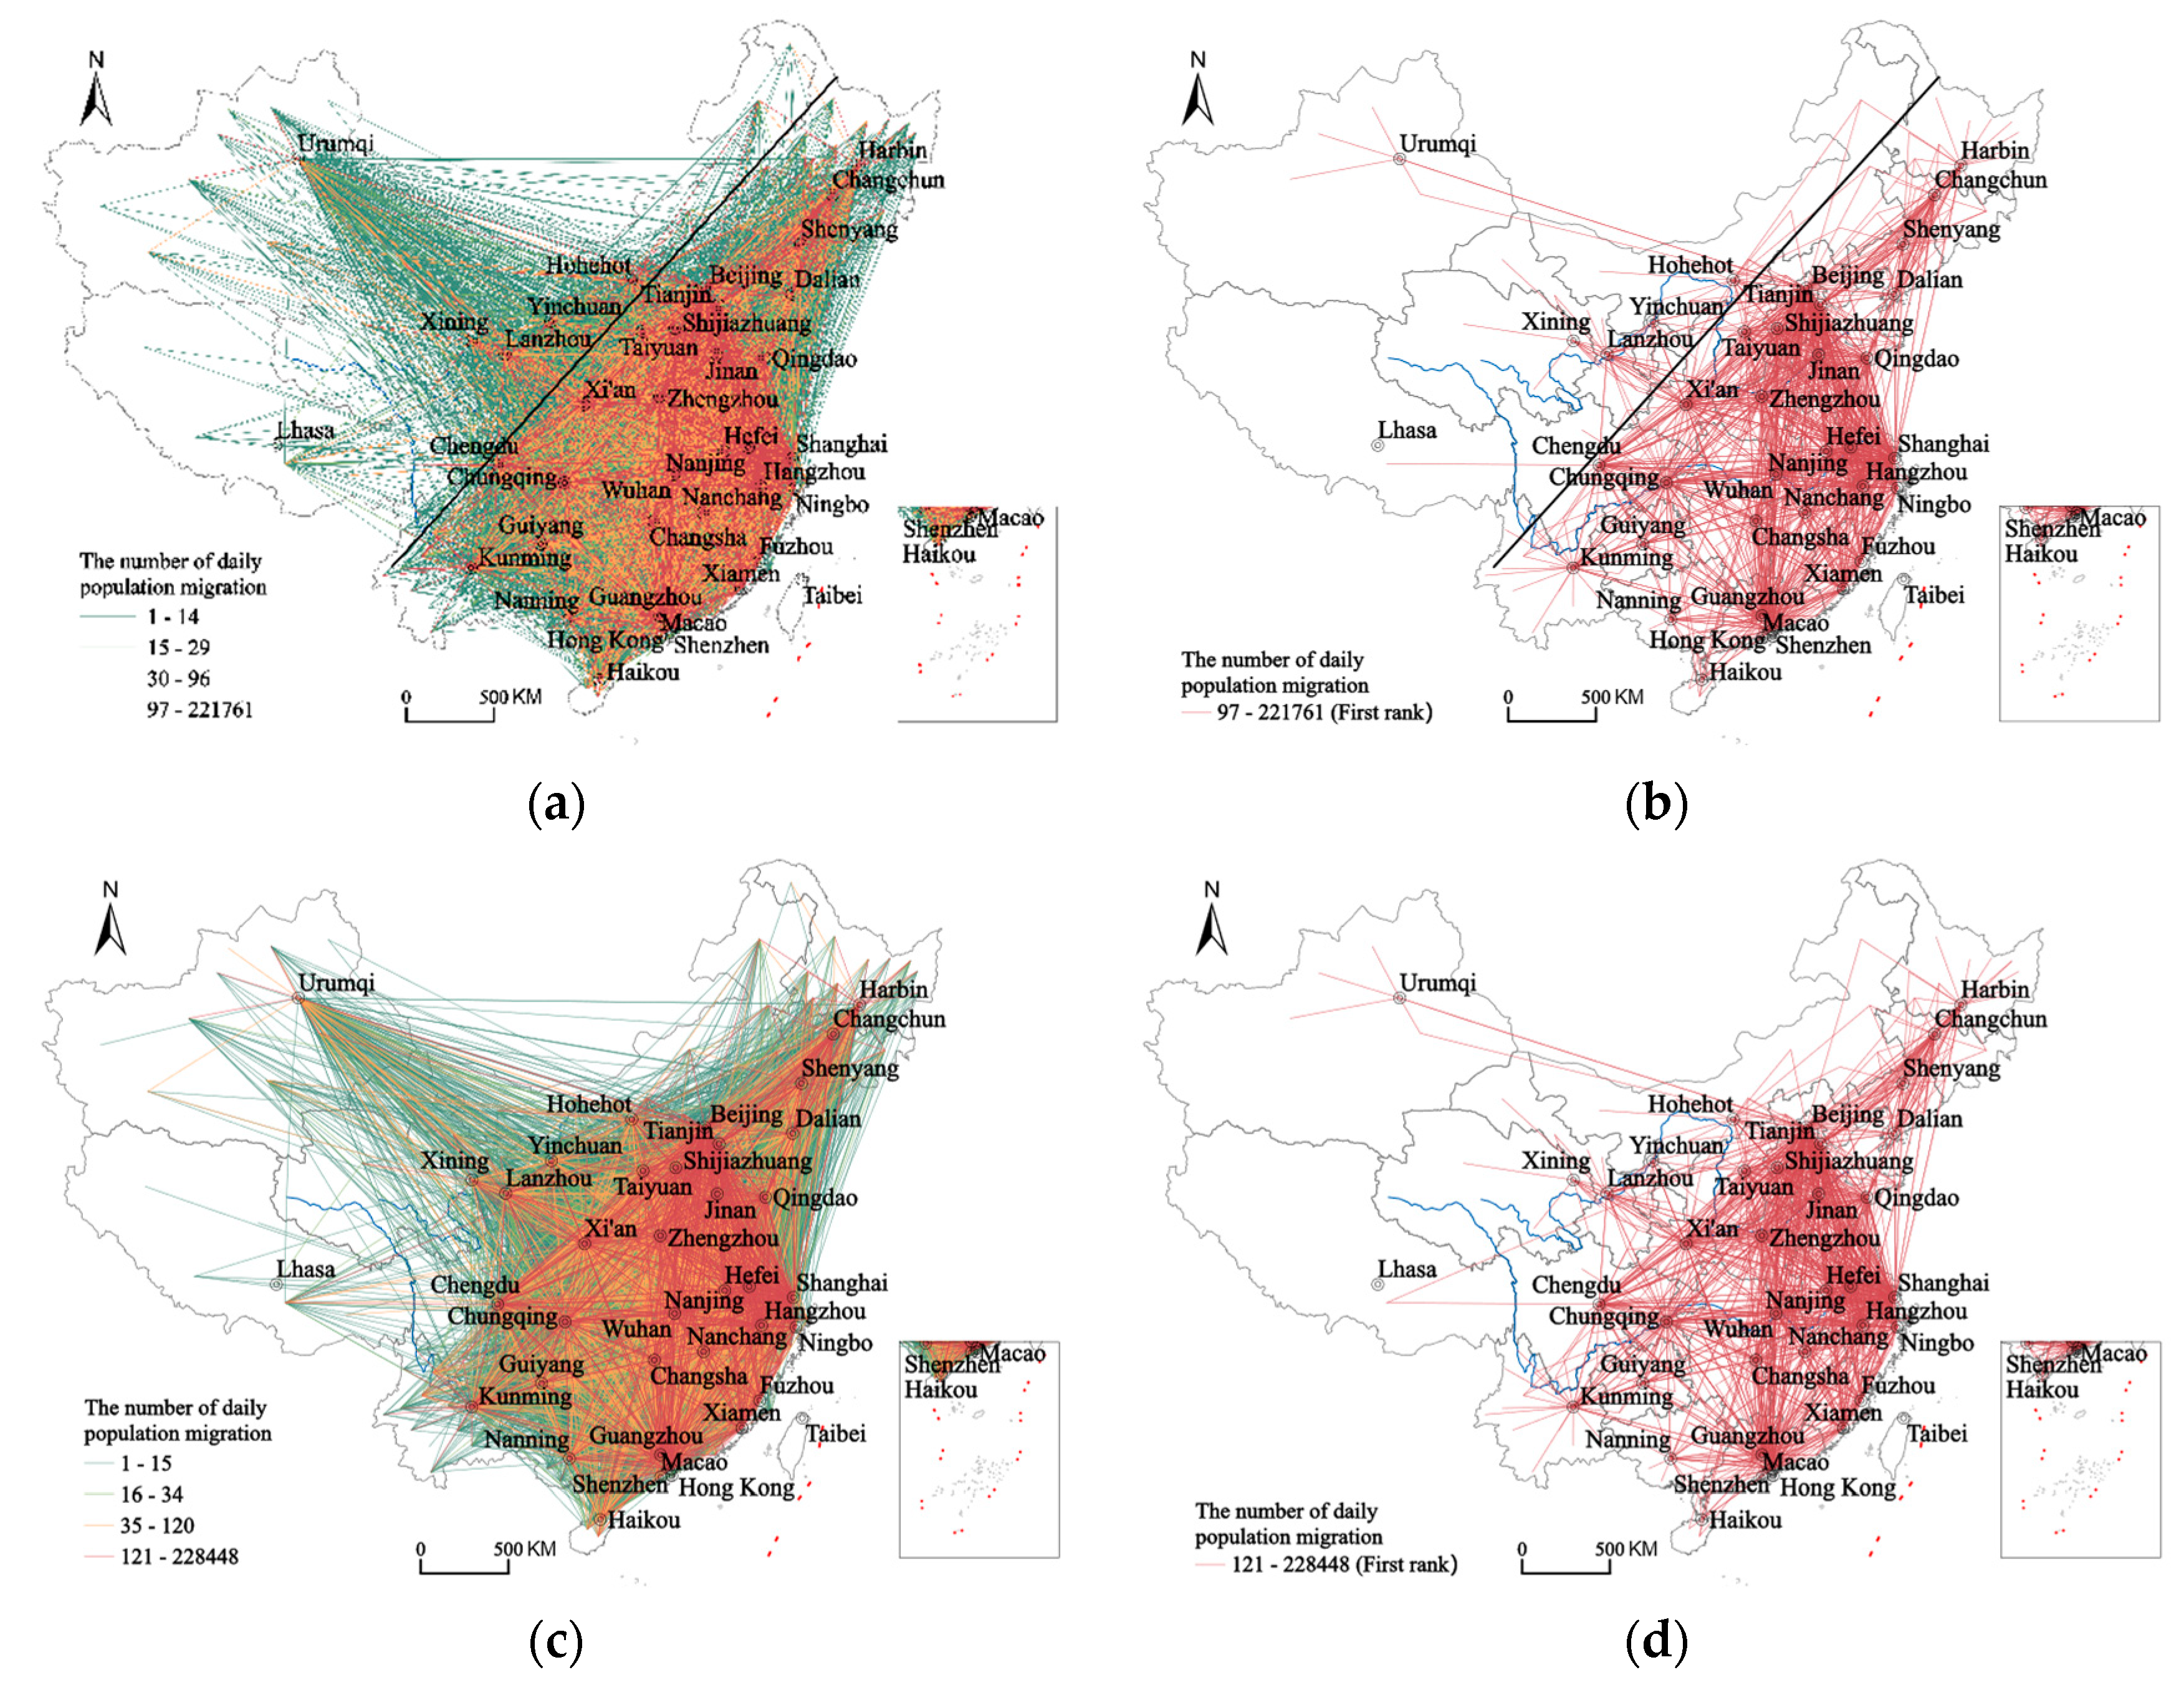
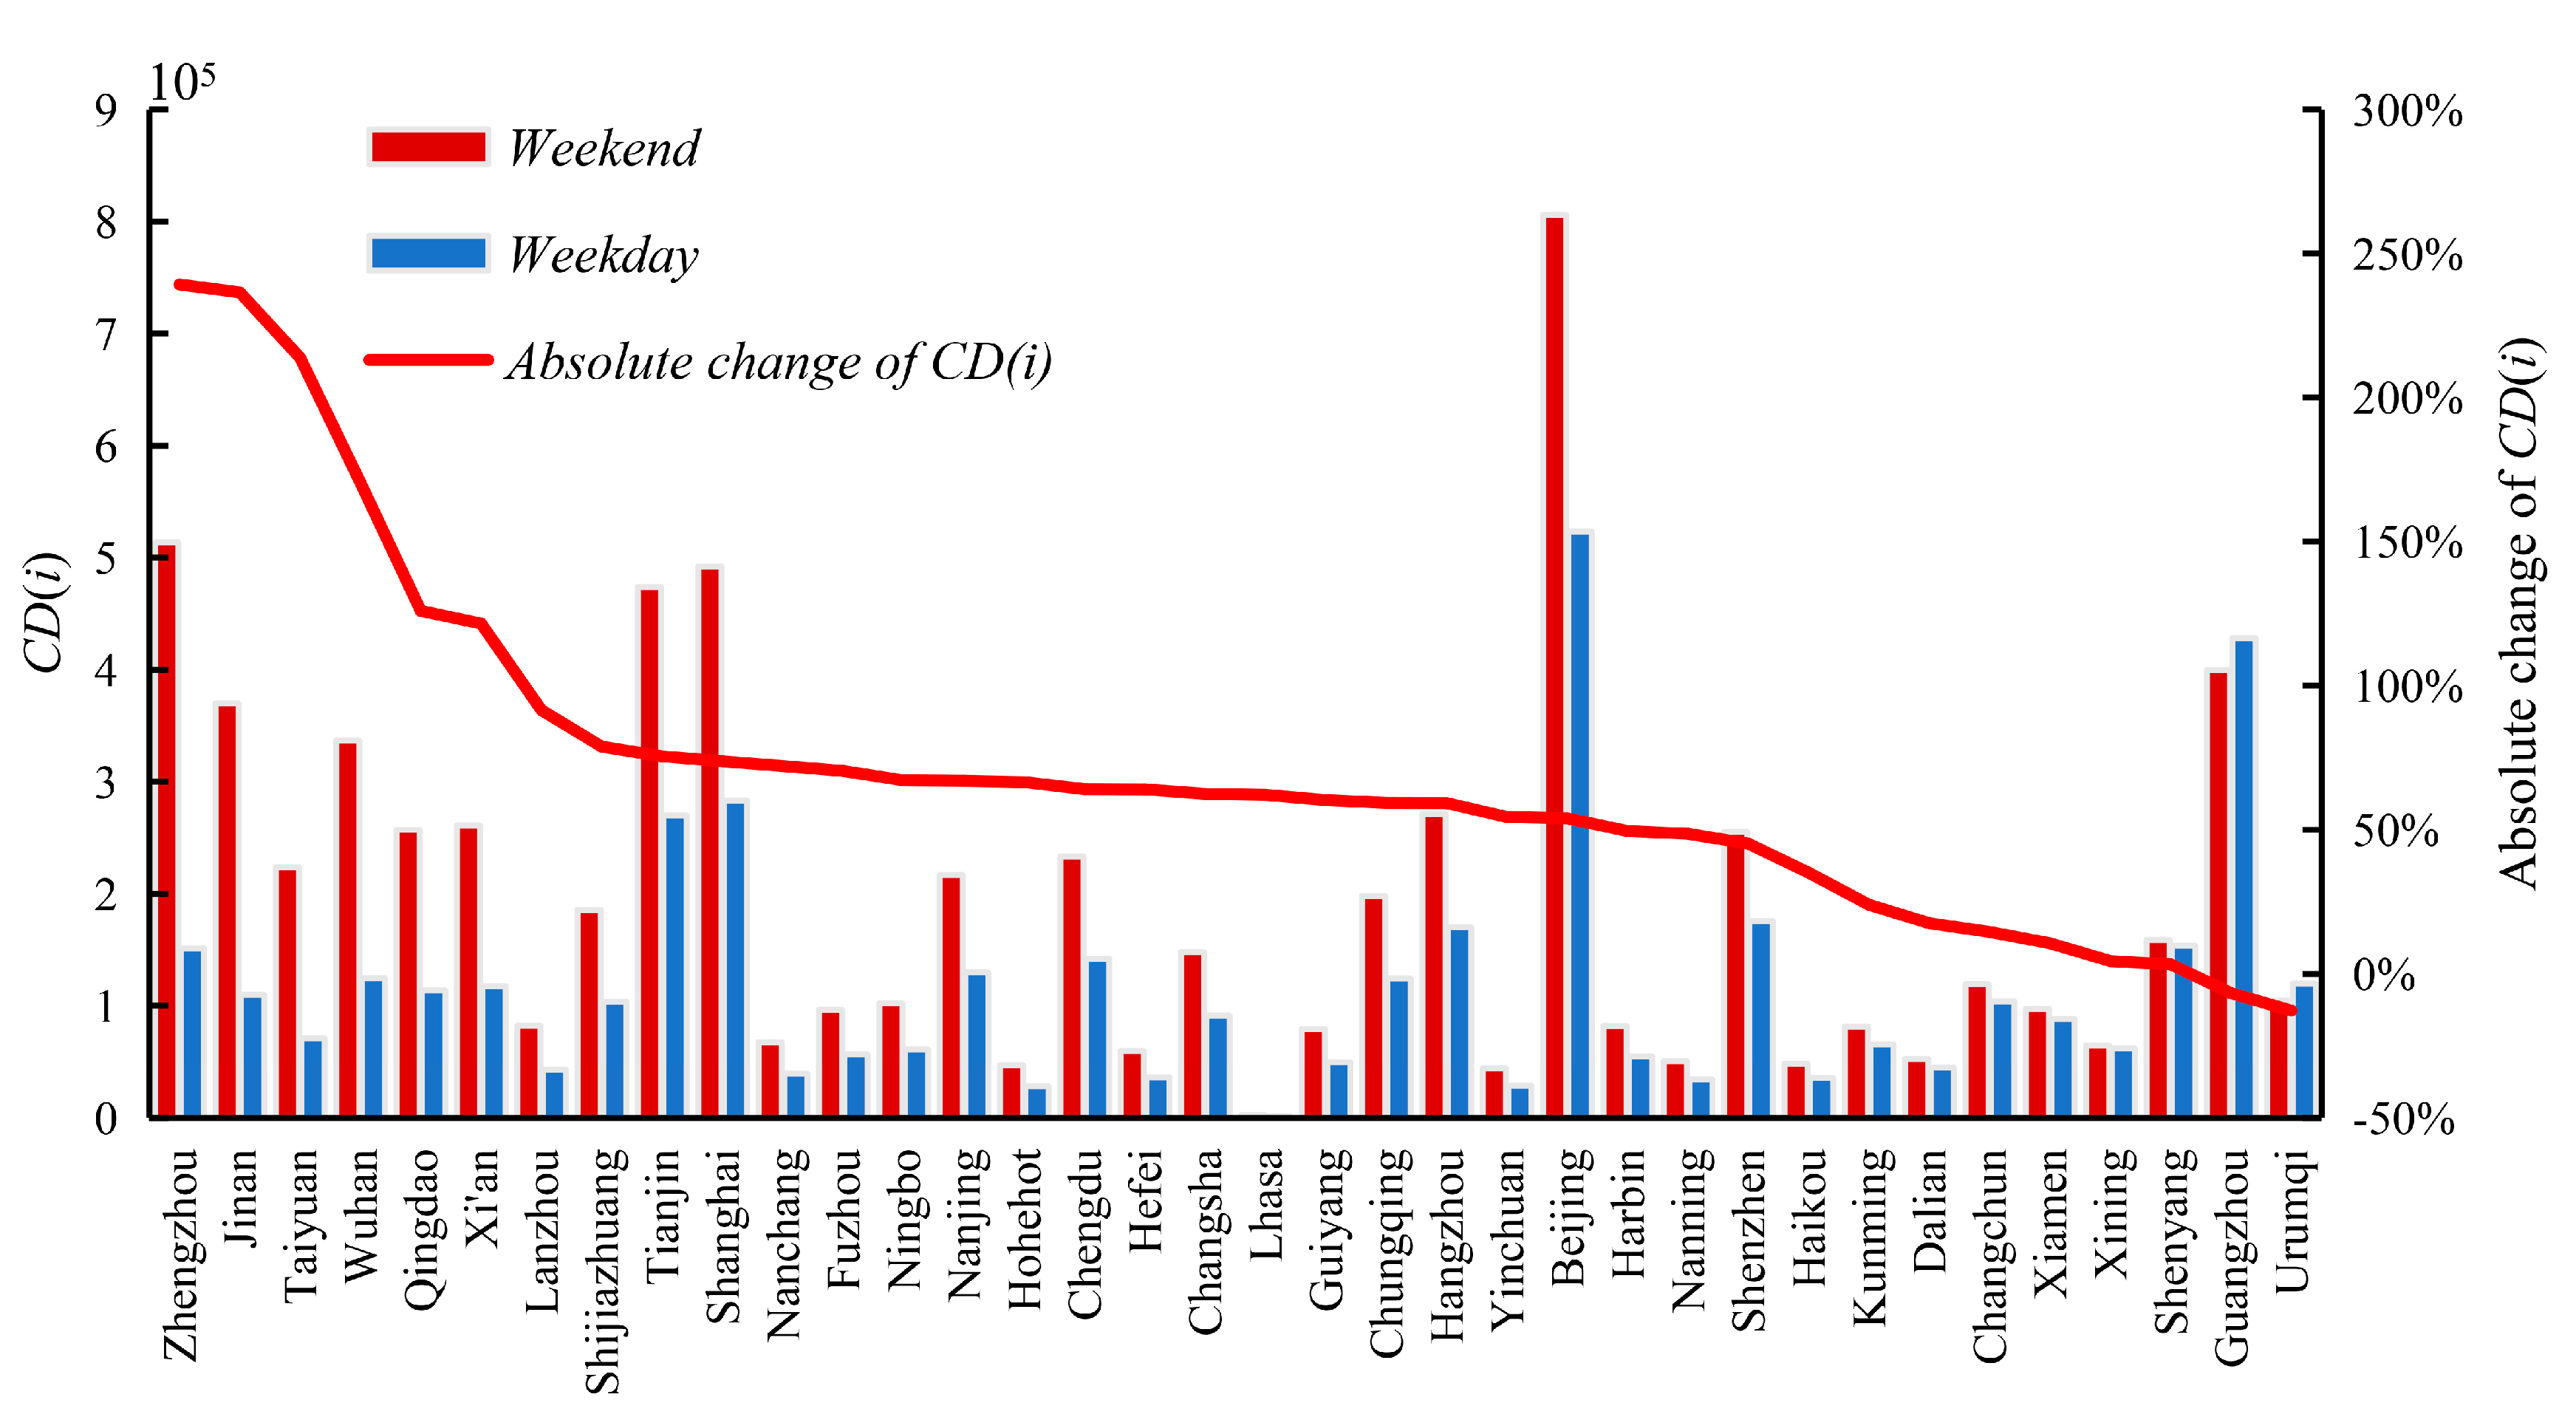
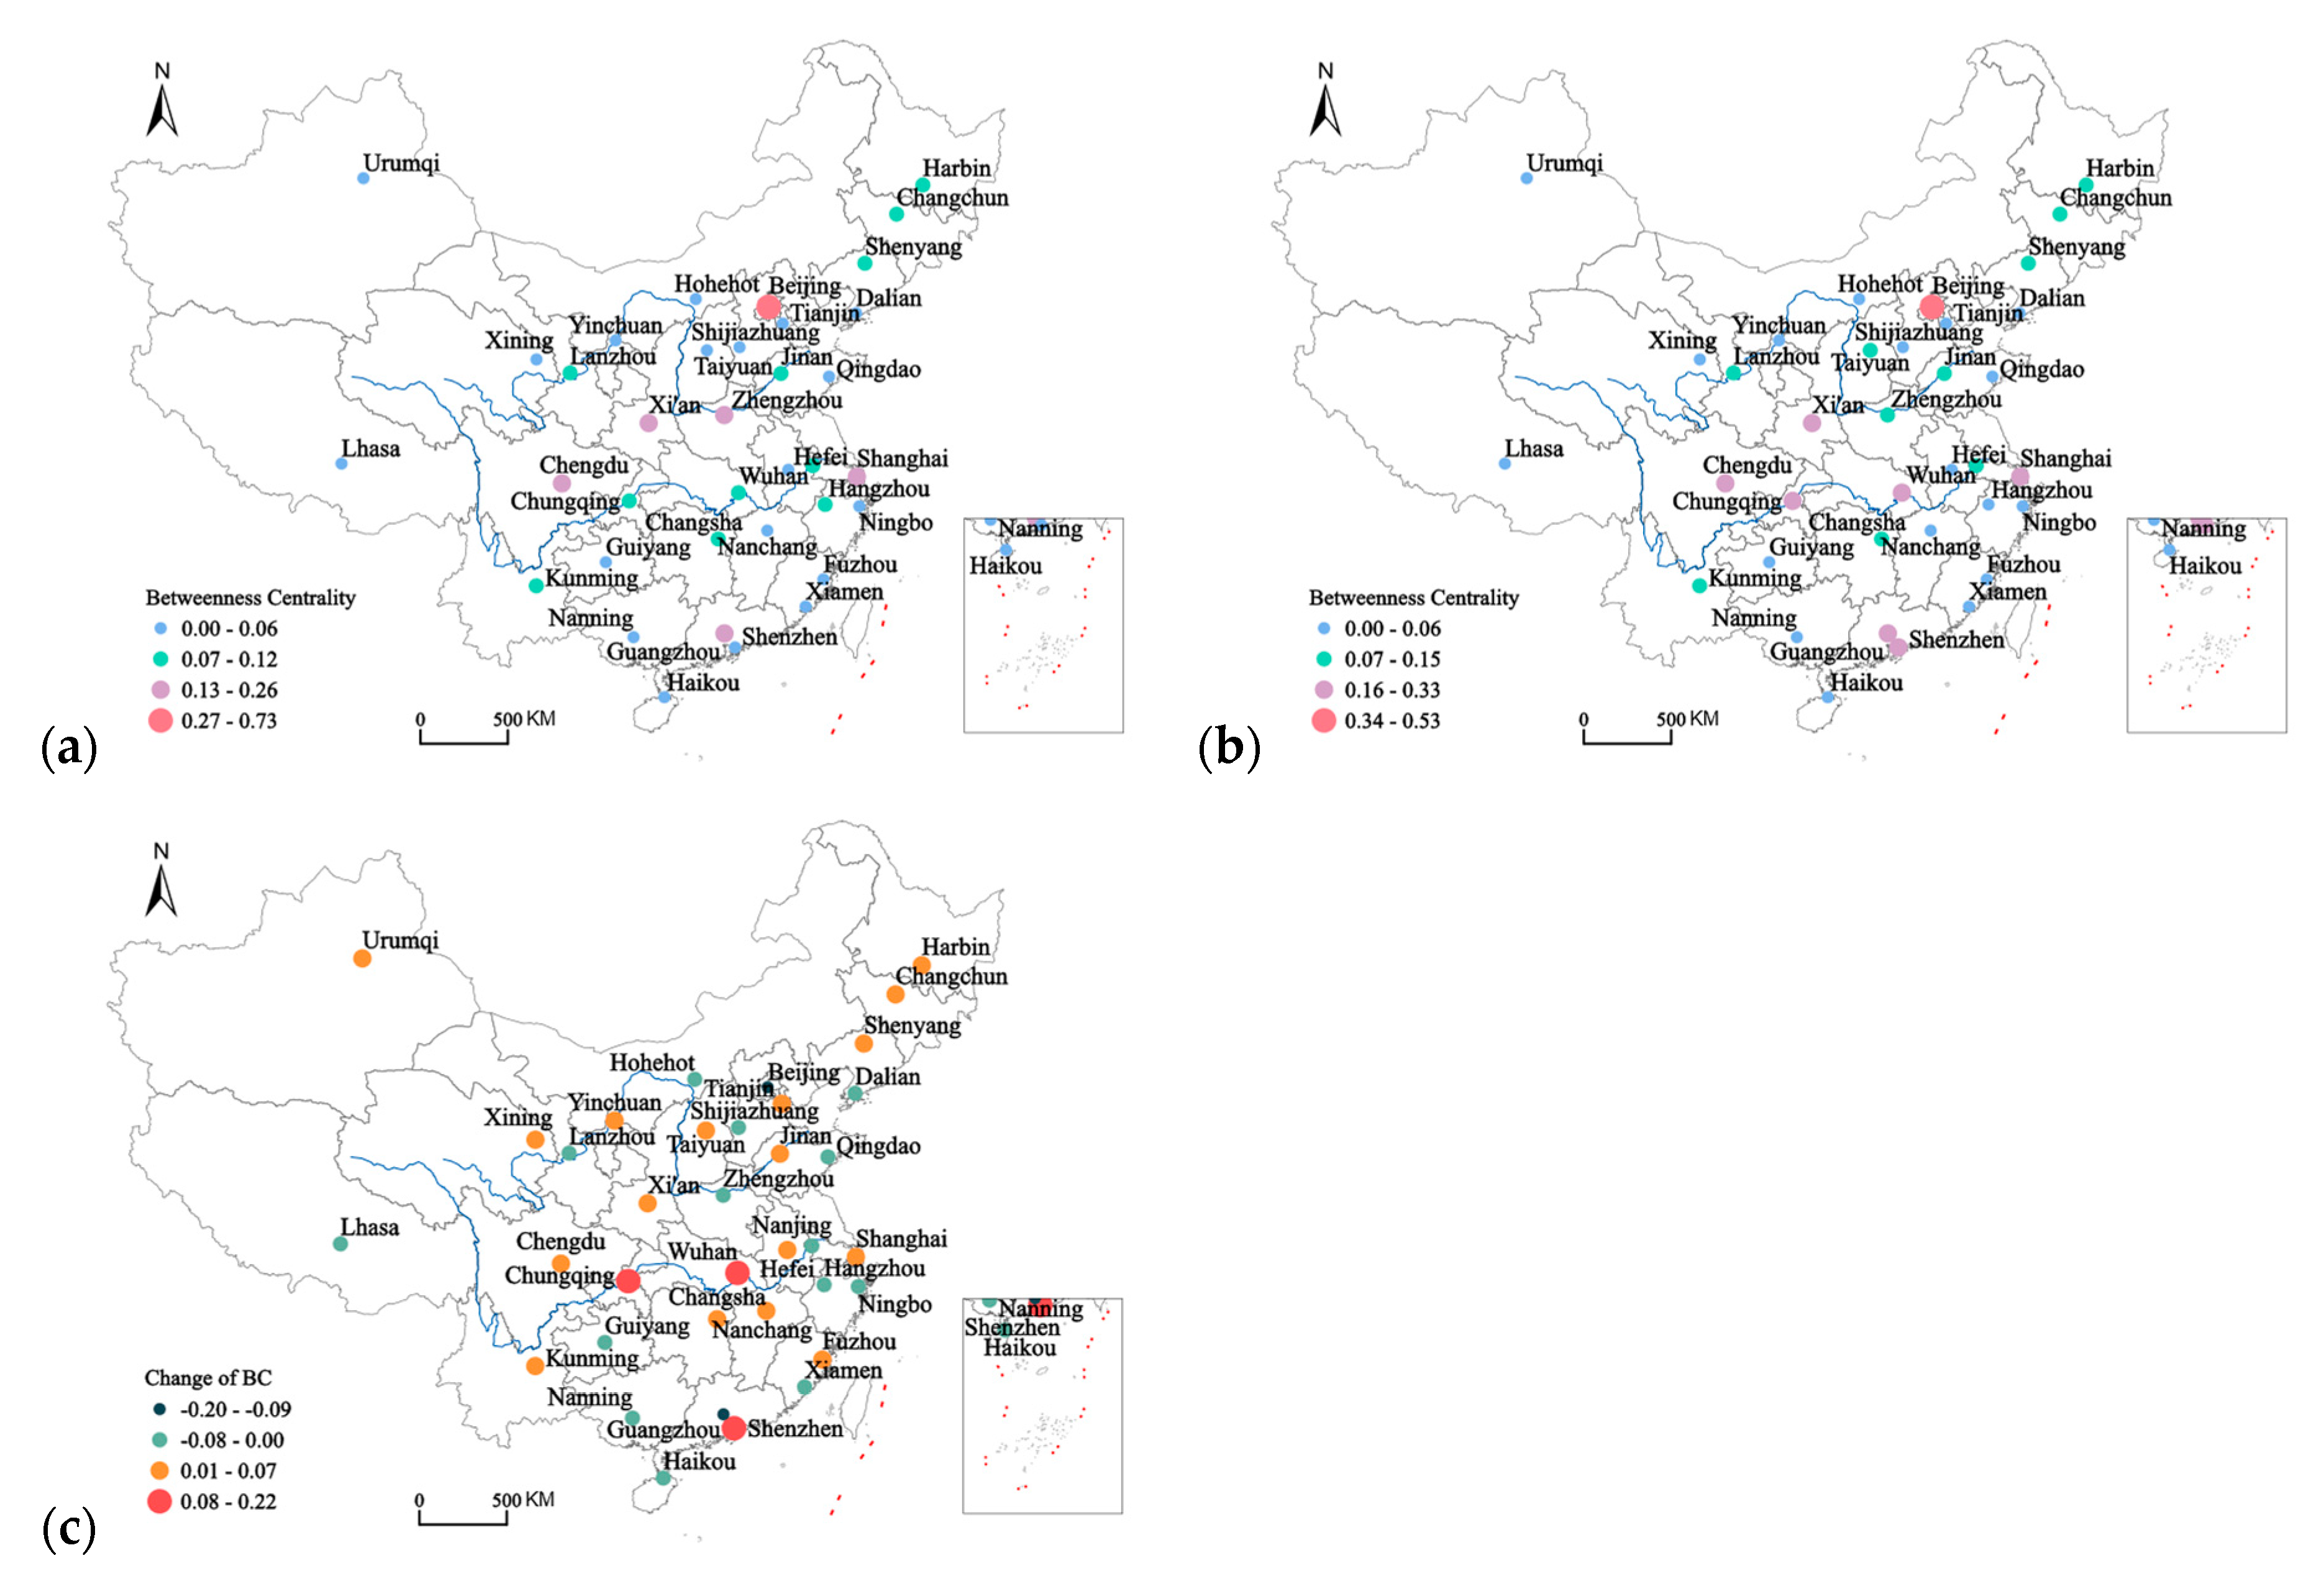
3.1. Structural Properties of the 36 Cities on Weekdays and Weekends

Overall, the population flow network exhibits a very heterogenous pattern. If we look at cities on the two sides of Hu huanyong Line (internationally, the Hu line is an imaginary line that divides the area of China into two roughly equal parts with contrasting population densities), as Figure 1 shows, the amount of the flows distributed quite unevenly from west to east. For network analysis, we started by calculating the degree of daily national population flow network on weekdays and weekends. The average weighted degrees were 13,756 and 18,076 on weekdays and weekends, respectively, and the number of cities connected between the two different periods is almost the same, indicating that there is more population flow on weekends than weekdays. Population flow networks on weekdays and weekends are shown in Figure 1, and general spatial characteristics can be obtained. The networks of weekdays and weekends had a similar spatial characteristic, this is, 80% of the population flow is mainly concentrated in the east of Hu huanyong Line (Figure 1b,d). Compared with the traditional natural break point method (McMaster, 1997), the 20/80 classification can better reflect the hierarchical structure and imbalance of population flow. Figure 2 presents a more in-depth investigation for the degree variation on weekdays and weekends. Compared with workdays, CD(i) of Lhasa, Guangzhou decreased significantly, while CD(i) of other cities increased significantly, transportation hub cities and tourist cities, such as Zhengzhou, Jinan, Taiyuan, Wuhan, and Qingdao, have increased the most.
Next, we computed the betweenness centrality of each city to assess how big a role it plays as a bridge at the national level. As shown in Figure 3, we used the natural break method to classify the betweenness metrics of city-nodes. Comparing them on weekdays and weekends, we found that betweenness and degree show a positive correlation. Namely, cities with high betweenness centrality tend to have a high degree, too. Spatially, they were concentrated in the diamond-shaped region formed by Beijing, Shanghai, Guangzhou, Shenzhen, and Chengdu. By contrast, the betweenness centrality of Lhasa is 0 on both weekdays and weekends, indicating that Lhasa, probably due to its marginal geographical position, has little chance to become a hub for flows between cities.
In addition, we mapped the change of betweenness centrality of 36 cities from weekdays to weekends and found that betweenness centrality of 19 cities, whose tourism are highly developed, were increased. However, there were 15 cities with a decreased betweenness centrality, most of which were coastal cities or located in the southwestern area. It should be noted that two ‘First-Tier’ cities (First-tier cities are metropolises important to China’s political, economic, and social activities, and have leading roles [31]; (Appendix A, Table A1), Beijing and Shenzhen, were also with decreased betweenness centralities but meantime with increased CD(i) (Figure 2), indicating that its population flow was mainly from its neighboring cities in weekends. More interestingly, Wuhan was ranked 4th regarding the absolute change of CD and 1st in betweenness centrality from weekdays to weekends (Figure 2 and Figure 3). This confirmed the central hub role of Wuhan played in the population flow network at the country level. It could be further conjectured that, if the Covid-19 outbreak had occurred during weekends, the pandemic situation would be more severe than had it occurred during weekdays, which is also consistent with the conclusions of other studies [32].
We further examined the statistical distribution of both metrics for major 36 cities. As Figure 4 shows, we found that they were Power-law-distributed, with R square values were above 0.6, indicating that the constructed networks were scale-free. Moreover, the exponent value of each plot was close to 1, in which the value was slightly smaller than 1 for degrees, while slightly larger than 1 for betweennesses. These power law fitting metrics strongly suggested the Zipfs behavior of population flow among cities. We also made a comparison of the power law distributions of network metrics between weekdays and weekends. As a result, the exponent values appeared to have no much differences (around 1; Figure 4). In this case, we compared the exponents of the rank cumulative size model ( β ) to check the differences from the perspective of their cumulative growth. It appears that β values for both network metrics on weekends were considerably larger than those in weekdays, wherein β value for degree in weekends was even nearly twice that in weekdays. This result implies the disproportionate ratio of the city’s centrality was more striking on weekends than on weekdays.

3.2. The Diversity of the Population Flows across 36 Cities

The heterogeneity of population flow network can also be seen from the angle of city-city connection, namely edges of the built network. In this study, each weighted edge reflects the strength of flow between each pair of cities. We conducted the power law detection again on the number of flows on each edge. From the log-log plot in Figure 5, it can be observed that flows between cities, both in weekdays and weekends, followed power law distribution with the exponents 2.12 and 2.20, respectively, indicating an unbalanced movement pattern between cities; that is, the majority of human movements concentrated on only a few cities. Moreover, the smaller the exponent of power law distribution is, the more obvious the thick tail shows.
With the unbalance movements in terms of the amount of flow between cities, it was intriguing to measure the diversity score for each city. The diversity score of each city, hereby, quantifies how different the movement flows associated with this city. As the score is rooted from Shannon entropy, the smaller the absolute value (ranges in [0,1]) is, the higher diversity the scope implies. High diversity score refers to the amount that flows distribute more unevenly from this city to other cities. For visualization purposes, we used 1- diversity to show the results in order to make sure that values increase from lower left to upper right. Figure 6 shows the correlation of network diversity of the above-mentioned major cities for weekdays and weekends (except Lhasa). Individual cities were plotted with their diversity scores on weekdays (X-axis) and weekends (Y-axis), respectively. Overall, the correlation between diversity scores on weekdays and weekends was not linear but best-fitted using a second-order polynomial function with a R2 square value of 0.64, from which we split the fitting curve at the tangent point into two subsets: a positive linear correlation (with R2 square value 0.83) and a negative one (0.48).
We further divided the plot into four quadrants (i.e., upper right, upper left, lower right, and lower left) for clearer description of the results, by centering on the point with mean values of diversity values along two axes. It is very interesting to note that the mean value for either weekdays or weekends identifies the unbalanced ratio of the diversity scores (e.g., about 30/70 on weekends and 40/60 on weekdays) rather than balanced ones (e.g., 50/50). The more unbalanced division of the flow diversity on weekends is also in line with the result in Figure 3, wherein the slope of the cumulative growth for city structural properties is steeper on weekends than the one on weekdays. To be specific on the results in four quadrants, cities in the upper right quadrant were both diverse in their in/out flows on weekdays and weekends, including the Chin’s four “First-Tier” cities (Beijing, Shanghai, Guangzhou, and Shenzhen) and highly-developed “New First-Tier” cities, such as Xi’an and Chengdu; cities in the upper left quadrant were with above-average diversity on weekends but below-average diversity on weekdays, and all of them were well-developed New First -tier cities in China; only a few cities were located in the lower right quadrant, implying relatively high diversity on weekdays but low on weekends. Urumqi and Haikou, almost in the lower right corner of the plot, are also near the northwestern and southeastern periphery of mainland China; cities in the lower left quadrant were with low levels of diversity on both weekdays and weekends and were mostly from the less-developed Western China. In sum, the correlation of the diverse measures of flows between cities on weekdays and weekends has the potential for classifying the importance of cities, as such a quadrant division explicitly reflects the relationship between the hierarchy of Chinese administrative cities and the pattern of their population flows.

4. Discussion

Human mobility reflects, to a large degree, the social-economic development of a region or country. In this study, we focus on the heterogenous people movements from city to city based on the mobile big data and employ complex-network modeling on the movement flows. The heterogeneity of the network is then measured from the lens of its nodes (cities) and edges (movement flows between cities), respectively. The obtained results have presented, both visually and statistically, that both aspects of the population movements in China hold a great heterogeneity on either weekdays or weekends. In this section, we add further discussion on the findings.
By comparing the heterogenous movements between weekdays and weekends, this study set a clear distinction from traditional studies that mainly based on the measurement of difference depends on the comparison of data to explore the driving factors of this difference, and focused on holidays, such as the Spring Festival [31,33]. However, based on the network diversity index, this paper describes the overall characteristics of urban population mobility and explores the differences between weekday and weekend population mobility. It not only highlights the differences of the movement flows from one single city to other cities but also emphasizes the relationship between population mobility and urban hierarchy, which is helpful to open up new research approaches and enrich relevant researches.
Heterogeneity in this study also refers to the unbalanced spatial distribution of movement flows. From the above analysis, it can be seen that the population flow is more concentrated in the east and tends to be in developed cities. The Hu huanyong line still controls the intercity population flow, and the central status of western provincial capitals is far lower than that of eastern cities, which is consistent with the study of Wei et al. [34]. Moreover, linking to the differences of the unbalance movements on weekdays and weekends, this study has the following implications.
The weekend has a huge impact on population mobility [35]. The ranking-cumulative scale model shows that the β value of CD(i) and Betweenness centrality increase on weekends, which means that the relative gap between the scale of cities population flow and the transfer capacity is smaller, and the ability of coordinated development among cities is stronger.
The reason why the population flow varies greatly from one city to another could also be related to the city’s own development. To date, the status quos of current developments of China’s cities, even in those selected 36 major cities, are with great disparity. The driving factors on the amount of population flow coming in/out a city includes not only its geographical distance to other cities but also its own economic development decision, its surrounding tourism resources and others, such as traffic status [33,34]. Because of the data limitation, it is impossible to define the travel mode of the daily population flow. This warrants the further study by incorporating the influence of the road, railway, and air on the population flow in China.
This paper concludes that the characteristics and heterogeneity of population flow during weekdays and weekends. From the diversity of cities, we find that the correlation of the diverse measures of flows between cities on weekdays and weekends has the potential for classifying the importance of cities, and it can be seen that the diverse measures of China’s First-Tier cities is high on weekdays and weekends. In addition, some New First -Tier cities (such as Chengdu, Xi’an) have similar characteristics and show great development potential, and those cities may be prioritized during the development process of China’s urbanization.
Ultimately, there are still some deficiencies in this study. Although the data of China Unicom comes from hundreds of millions of samples, it still has some defects, such as bias and poor accuracy, and most of the travel routes may be disassembled to determine the complete travel routes of users. In addition, in order to protect the privacy of users, the data will not show the social attributes (occupation, gender, age) of the floating population, so its purpose and duration of stay are not known. The dynamic mechanism driving the change of population mobility during weekends may be related to the functional orientation of cities and the travel demand of people; due to the limitation of the length of this paper, we do not have an in-depth discussion on this, which will be further supplemented in the future.

5. Conclusions

Population flow between cities is an important aspect of urban system research, and an important carrier for the flow of various elements in the urban network. This paper uses the big data of China Unicom to establish the population flow network and studies the difference and heterogeneity of population flow in 36 major cities on weekdays and weekends from the perspectives of nodes and edges of the complex network, drawing the following conclusions.
First, China’s population flow network is generally highly imbalanced, and the spatial distribution pattern of population flow is “Dense in the east and Sparse in the west”. The population flow is more concentrated in the east, especially in cities with higher level of development; Cities with high centrality are mainly concentrated in the east and coastal areas, and the centrality of western cities is much lower than eastern cities. In addition, there are huge differences in population flow between cities, and this difference reflects the imbalance of urban development. It is speculated that this difference may continue to run through China’s rapid urbanization development process.
Secondly, the heterogeneity of urban network diversity on weekdays and weekends is closely related to the city’s hierarchy, which can help us study the hierarchical structure of Chinese cities from a dynamic perspective. In addition, based on the diversity of urban networks, we find that urban population flow meets the first law of geography, and the population flows more frequently with surrounding cities, showing spatial agglomeration and forming local subsystems easily. Therefore, a highly centralized city can provide greater development space and opportunities for the surrounding cities and can promote the surrounding areas by promoting the development of the city.

Author Contributions

Conceptualization, C.Z. and D.M.; methodology, C.Z. and D.M.; software, C.Z.; validation, M.L.; formal analysis, C.Z. and D.M.; resources, M.L. and R.G.; data curation, M.L.; writing—original draft preparation, C.Z.; writing—review and editing, C.Z. and D.M.; visualization, C.Z.; supervision, R.G.; project administration, R.G.; funding acquisition, M.L. and D.M. All authors have read and agreed to the published version of the manuscript.

Funding

This research was founded by the National Nature Science Foundation of China (Grant No. 42001180), Humanity and Social Science Youth foundation of Ministry of Education of China (Grant No. 19YJCZH081), Open Fund of Key Laboratory of Urban Land Resources Monitoring and Simulation, Ministry of Natural Resources (Grant No. KF-2020-05-013). Shenzhen Basic Research Project (Grant No. 202008141151142001).

Data Availability Statement

Not applicable.

Conflicts of Interest

The authors declare no conflict of interest.

Appendix A

Table A1. Ranking of cities’ business attractiveness in China 2020.
RankCity
First-tier citiesBeijing, Shanghai, Guangzhou, Shenzhen
Beijing, Shanghai, Guangzhou, Shenzhen
New First-tier citiesChangsha, Chengdu, Tianjin, Shenyang, Wuhan, Xi’an, Qingdao, Chungqing, Nanjing, Hangzhou, Zhengzhou, Hefei
Second-tier citiesLanzhou, Jinan, Guiyang, Xiamen, Nanning, Kunming, Taiyuan, Shijiazhuang, Ningbo, Harbin, Nanchang, Dalian, Fuzhou, Changchun
Third-Tier CityYinchuan, Haikou, Hohehot, Urumqi
Fourth-Tier CityXining

References

  1. Yu, Z.; Lin, L. Continuity and change in the transition from the first to the second generation of migrants in China: Insights from a survey in Fujian. Habitat Int. 2014, 42, 147–154. [Google Scholar]
  2. Li, Q.; Chang, X.; Shaw, S.-l.; Yan, K.; Yue, Y.; Chen, B. Characteristics of micro-blog inter-city social interactions in China: Characteristics of micro-blog inter-city social interactions in China. J. Shenzhen Univ. Sci. Eng. 2013, 30, 441–449. [Google Scholar] [CrossRef]
  3. Barabási, A.-L.; Albert, R. Emergence of Scaling in Random Networks. Science 1999, 286, 509–512. [Google Scholar] [CrossRef] [PubMed] [Green Version]
  4. de Haas, H. Migration and Development: A Theoretical Perspective. Int. Migr. Rev. 2010, 44, 227–264. [Google Scholar] [CrossRef] [PubMed] [Green Version]
  5. Shumway, J.M.; Otterstrom, S.M. Spatial Patterns of Migration and Income Change in the Mountain West: The Dominance of Service-Based, Amenity-Rich Counties. Prof. Geogr. 2001, 53, 492–502. [Google Scholar] [CrossRef]
  6. Zhang, W.; Chong, Z.; Li, X.; Nie, G. Spatial patterns and determinant factors of population flow networks in China: Analysis on Tencent Location Big Data. Cities 2020, 99, 102640. [Google Scholar] [CrossRef]
  7. González, M.C.; Hidalgo, C.A.; Barabási, A.-L. Understanding individual human mobility patterns. Nature 2008, 453, 779–782. [Google Scholar] [CrossRef]
  8. Bengtsson, L.; Gaudart, J.; Lu, X.; Moore, S.; Wetter, E.; Sallah, K.; Rebaudet, S.; Piarroux, R. Using Mobile Phone Data to Predict the Spatial Spread of Cholera. Sci. Rep. 2015, 5, 8923. [Google Scholar] [CrossRef]
  9. Gariazzo, C.; Pelliccioni, A. A Multi-City Urban Population Mobility Study Using Mobile Phone Traffic Data. Appl. Spat. Anal. Policy 2019, 12, 753–771. [Google Scholar] [CrossRef]
  10. Lee, K.-S.; You, S.Y.; Eom, J.K.; Song, J.; Min, J.H. Urban spatiotemporal analysis using mobile phone data: Case study of medium- and large-sized Korean cities. Habitat Int. 2018, 73, 6–15. [Google Scholar] [CrossRef]
  11. Yang, X.; Zhao, Z.; Lu, S. Exploring Spatial-Temporal Patterns of Urban Human Mobility Hotspots. Sustainability 2016, 8, 674. [Google Scholar] [CrossRef] [Green Version]
  12. Li, J.; Ye, Q.; Deng, X.; Liu, Y.; Liu, Y. Spatial-Temporal Analysis on Spring Festival Travel Rush in China Based on Multi-source Big Data. Sustainability 2016, 8, 1184. [Google Scholar] [CrossRef] [Green Version]
  13. Cui, C.; Wu, X.; Liu, L.; Zhang, W. The spatial-temporal dynamics of daily intercity mobility in the Yangtze River Delta: An analysis using big data. Habitat Int. 2020, 106, 102174. [Google Scholar] [CrossRef]
  14. Watts, D.J.; Strogatz, S.H. Collective dynamics of ’small-world’ networks. Nature 1998, 393, 440–442. [Google Scholar] [CrossRef]
  15. Bu, D.; Zhao, Y.; Cai, L.; Xue, H.; Zhu, X.; Lu, H.; Zhang, J.; Sun, S.; Ling, L.; Zhang, N.; et al. Topological structure analysis of the protein-protein interaction network in budding yeast. Nucleic Acids Res. 2003, 31, 2443–2450. [Google Scholar] [CrossRef] [PubMed] [Green Version]
  16. Watts, D.J.; Dodds, P.S.; Newman, M.E.J. Identity and Search in Social Networks. Science 2002, 296, 1302–1305. [Google Scholar] [CrossRef] [PubMed] [Green Version]
  17. Taylor, P.J.; Derudder, B.; Witlox, F. Comparing Airline Passenger Destinations with Global Service Connectivities: A Worldwide Empirical Study of 214 Cities. Urban Geogr. 2007, 28, 232–248. [Google Scholar] [CrossRef]
  18. Jackson, M.O. Social and Economic Networks; Princeton University Press: Princeton, NJ, USA, 2010; p. 648. [Google Scholar]
  19. Estrada, E. Quantifying network heterogeneity. Phys. Rev. E 2010, 82, 066102. [Google Scholar] [CrossRef] [PubMed] [Green Version]
  20. Lee, J.K.; Choi, J.; Kim, C.; Kim, Y. Social Media, Network Heterogeneity, and Opinion Polarization. J. Commun. 2014, 64, 702–722. [Google Scholar] [CrossRef]
  21. Xiaolong, R.; Linyuan, L. Review of ranking nodes in complex networks. Chin. Sci. Bull. 2014, 59, 1175–1197. [Google Scholar]
  22. Strano, E.; Shai, S.; Dobson, S.A.; Barthelemy, M. Multiplex networks in metropolitan areas: Generic features and local effects. J. R. Soc. Interface 2015, 12, 20150651. [Google Scholar] [CrossRef] [PubMed] [Green Version]
  23. Bonato, P.; Cintia, P.; Fabbri, F.; Fadda, D.; Giannotti, F.; Lopalco, P.L.; Mazzilli, S.; Nanni, M.; Pappalardo, L.; Pedreschi, D.; et al. Mobile phone data analytics against the COVID-19 epidemics in Italy: Flow diversity and local job markets during the national lockdown. arXiv 2020, arXiv:2004.11278. [Google Scholar]
  24. Eagle, N.; Macy, M.; Claxton, R. Network Diversity and Economic Development. Science 2010, 328, 1029–1031. [Google Scholar] [CrossRef] [PubMed]
  25. Jiang, B.; Jia, T. Zipf’s law for all the natural cities in the United States: A geospatial perspective. Int. J. Geogr. Inf. Sci. 2011, 25, 1269–1281. [Google Scholar] [CrossRef]
  26. Jiang, B.; Yin, J.; Liu, Q. Zipf’s law for all the natural cities around the world. Int. J. Geogr. Inf. Sci. 2015, 29, 498–522. [Google Scholar] [CrossRef]
  27. Jiang, B.; Miao, Y. The Evolution of Natural Cities from the Perspective of Location-Based Social Media. Prof. Geogr. 2015, 67, 295–306. [Google Scholar] [CrossRef] [Green Version]
  28. Hao, Z.D.Y. A New Method for Analyzing the Size Structure of Urban System: Rank Cumulative Size Model. Sci. Geogr. Sin. 2017, 37, 825–832. [Google Scholar]
  29. Sanders, R. The pareto principle: Its use and abuse. J. Serv. Mark. 1987, 1, 37–40. [Google Scholar] [CrossRef]
  30. Dunford, R.; Su, Q.; Tamang, E. The Pareto Principle; University of Plymouth: Plymouth, UK, 2014. [Google Scholar]
  31. Xu, J.; Li, A.; Li, D.; Liu, Y.; Du, Y.; Pei, T.; Ma, T.; Zhou, C. Difference of urban development in China from the perspective of passenger transport around Spring Festival. Appl. Geogr. 2017, 87, 85–96. [Google Scholar] [CrossRef]
  32. Liu, J.; Hao, J.; Sun, Y.; Shi, Z. Network analysis of population flow among major cities and its influence on COVID-19 transmission in China. Cities 2021, 112, 103138. [Google Scholar] [CrossRef] [PubMed]
  33. Wang, L.; Xue, C. Spatio-temporal characteristics and influencing factors of urban floating population in China from 2011 to 2015. Chin. J. Popul. Resour. Environ. 2019, 17, 359–373. [Google Scholar] [CrossRef]
  34. Wei, Y.; Xiu, C.; Liu, Z.; Chen, W. Spatial pattern of city network in transitional China based on the population flows in ‘Chunyun’period. Sci. Geogr. Sin. 2016, 36, 1654–1660. [Google Scholar]
  35. Li, T.; Wang, J.; Huang, J.; Gao, X. Exploring temporal heterogeneity in an intercity travel network: A comparative study between weekdays and holidays in China. J. Geogr. Sci. 2020, 30, 1943–1962. [Google Scholar] [CrossRef]
Figure 1. Map of population flow network between weekdays and weekends at the country level. (a) Weekdays; (b) Weekdays (First Rank); (c) Weekends; (d) Weekends (First Rank).
Land 10 01160 g001
Figure 2. CD(i) of Cities and its absolute changes between weekdays and weekends.
Land 10 01160 g002
Figure 3. Betweenness centrality of 36 cities on (a) Weekdays and (b) Weekends, and (c).The change of betweenness centrality from weekdays to weekends.
Land 10 01160 g003
Figure 4. The log-log plots of node degree and betweenness centrality for weekdays and weekends in the forms of rank-size and rank-cumulative-size. (a) CD(i) in the forms of rank-size; (b) Betweenness in the forms of rank-size; (c) CD(i) in the forms of rank-cumulative-size, (d) Betweenness centrality in the forms of rank-cumulative-size.
Land 10 01160 g004aLand 10 01160 g004b
Figure 5. Scatter plot of the Rank-Population Flow on weekdays and weekends.
Land 10 01160 g005
Figure 6. Diversity scores on weekdays versus weekends for major cities based on population flow network.
Land 10 01160 g006
Table 1. Descriptive statistics of population flow network at weekdays and weekends.
PeriodsNumbers of NodesTotal Flow ValueAverageMaximumMinimum
Weekdays33751071915352217611
Weekends33765630266872284481
Publisher’s Note: MDPI stays neutral with regard to jurisdictional claims in published maps and institutional affiliations.

