Abstract
Climate change is expected to lead to changes to the amount, frequency, intensity, and timing of precipitation and subsequent water supply and its availability to plants in mountain regions worldwide. This is likely to affect plant growth and physiological performance, with subsequent effects to the functioning of many important high-elevation ecosystems. We conducted a quantitative systematic review and meta-analysis of the effects of altered water supply on plants from high elevation ecosystems. We found a clear negative response of plants to decreases in water supply (mean Hedges’ g = −0.75, 95% confidence intervals: −1.09 to −0.41), and a neutral response to increases in water supply (mean Hedges’ g = 0.10, 95% confidence intervals: 0.43 to 0.62). Responses to decreases in water supply appear to be related to the magnitude of change in water supply, plant growth form, and to the measured response attribute. Changes to precipitation and water supply are likely to have important consequences for plant growth in high elevation ecosystems, with vegetation change more likely be triggered by reductions than increases in growing season precipitation. High elevation ecosystems that experience future reductions in growing-season precipitation are likely to exhibit plant responses such as reduced growth and higher allocation of carbohydrates to roots.
Keywords:
alpine; mountains; climate change; experimental manipulations; PRISMA; precipitation; drought; vegetation 1. Introduction
Along with temperature, water availability is one of the most important abiotic factors determining the fundamental niche of plant species. In high elevation ecosystems, steep changes in aspect, slope, and soil depth greatly affect the soil water that is available to plants [1,2]. Plants vary in their traits associated with water use strategies such as specific leaf area (SLA), rooting depth, and the ability to endure very low water supply [3]. Over soil moisture gradients, this gives rise to distinct communities from wet meadows to xeric slopes across relatively short spatial scales [1,4]. Variation in plant water status can also affect plant susceptibility to temperature extremes; a key factor limiting plant growth and productivity in high mountain ecosystems [5]. Water-limited plants may be able to withstand lower temperatures and avoid lethal ice formation within cells [6]. Conversely, well-watered plants may have better capacity to mitigate heat stress via transpiration [7]. Variation in response to altered precipitation patterns will likely have important consequences for productivity [8] and susceptibility to other environmental stressors [9].
Ongoing climate change is having profound effects on precipitation and subsequent water supply and availability in high elevation ecosystems. In many mountain ecosystems, annual precipitation is expected to increase [10,11,12,13] which is likely to be brought about by more frequent and more intense precipitation events, with associated changes in seasonality [12,14]. In contrast, in other mountain areas, summer precipitation is projected to decline [12] with increases to the length and magnitude of drought events [14]. Simultaneously, earlier melting and evaporation of snow, driven by increasing spring temperatures, may also contribute to severe drying over the summer months [15,16,17], even if precipitation sums do not indicate changes in overall average precipitation. Changes to soil water availability are likely to alter key physiological processes in plants and may exacerbate the effects of other climate factors that are changing simultaneously, such as warmer [18] or more extreme temperatures [7,19], increased CO2 and nitrogen deposition [20]. Altered soil water availability may also affect productivity and community stability in high mountain ecosystems [21] which may have consequences for a range of ecosystem functions including carbon storage, nutrient cycling, and water regulation [15]. In addition, altered soil water availability may have important consequences for plant responses to disturbance events, such as fire [22] and grazing [23].
Our current understanding of the responses of high elevation plants to changes in water availability may be inferred from various approaches. These include direct observations of vegetation change correlated with historical changes in precipitation regimes [24], occurrence of plant functional traits relating to water use among biomes [25], via transplant experiments using individual plants or communities across environmental gradients [26,27], or by observing plant community responses to disturbance events such as drought [28]. These kinds of approaches take advantage of interannual or site variation in soil moisture but risk confounding changes with other factors that are likely to covary across space and time such as temperature. Experimental manipulations carried out in the field, glasshouse or laboratory can alter single or multiple environmental conditions to causally link changes in water supply with plant responses, providing an important tool for understanding the physiological mechanisms underpinning plant responses to altered moisture regimes. Experiments that manipulate water supply typically aim to either induce or ease water-limitation among target plants in relation to a control group, while in other studies, the seasonality of precipitation is varied, without altering the cumulative total of water inputs. While the aims and duration of experiments vary, basic measurements of plant growth (e.g., biomass, leaf number, plant height), and physiological performance (rate of photosynthesis, functioning of photosystem II) are often reported. Hence, combined results from precipitation modification studies can lead to meaningful insights regarding the responses of high-elevation plants to changing moisture regimes.
Here, we undertake a quantitative systematic review and meta-analysis to synthesize the current knowledge on plant responses to altered water availability in high-elevation ecosystems, and to examine plant responses to increases and decreases in water supply. For the purposes of this study, a high-elevation plant or community are those belonging to high mountain, high elevation, alpine, sub-alpine, or montane environments. We focus on high elevation plants as they are considered among the most vulnerable to climate change, as high elevation species show high rates of endemism compared to lowland plants which can occupy broader latitudinal belts [16].
In this systematic review and meta-analysis, we synthesize the literature regarding high elevation plant response to modified water supply. Specifically, we ask
- Do growth forms vary in their response to altered water supply?
- Is the nature of the response consistent across experimental settings?
- Do mature and immature life history stages respond differently to altered water supply?
- How do the responses of measured attributes vary in relation to altered water supply?
- Are plant responses related to the magnitude change in water supply?
Overall, we expect varying responses among plant growth forms to both increases and decreases in water supply. Forbs and graminoids, which tend to access water from relatively shallow soils compared to woody taxa, are expected to show stronger responses to decreased water supply, and stronger responses are expected in immature than mature plants.
2. Materials and Methods
2.1. Systematic Review
We focussed our literature search on published research that generated empirical data on the responses of high elevation plants globally, to changes in water supply and water availability. We searched three major electronic databases—ProQuest, Web of Science, and Scopus on 27 May 2019, of peer-reviewed primary literature using combinations of search terms relating to plants and precipitation. The literature search was conducted for English language articles only. No constraints were put on year of publication.
Search String Used in Systematic Literature Review
(alpine OR “sub alpine” OR “high mountain*” OR “high elevation*” OR alps OR montane) AND (plant* OR shrub* OR grass* OR herb* OR forb* OR graminoid* OR vegetation) AND (drought* OR irrigation OR “water restrict*” OR “soil moisture” OR moisture OR rainfall OR water supply OR water OR “water deficit*” OR drier OR dry*) AND (experiment* OR manipulat* OR shelter OR “rain out” OR treatment).
We also used the reference lists of relevant articles to look for additional articles that matched our search criteria. Our search returned 5570 articles. After screening titles and abstracts, we found 270 articles to be appropriate for inclusion in the systematic review. This was reduced to 129 articles after examining the full texts of each study (Supplementary Materials, Figure S1). Consequently, a second search of the same electronic databases was conducted on 25 March 2021 for primary literature published since the original search, using the same search string. This search returned 390 studies, of which 22 were included in the systematic review.
As our review was focussed on high-elevation mountains specifically, we did not include “tundra”, “Arctic”, or “Antarctic” search terms. We did not originally intend to include tree species in our review, hence the terms “forest” and “treeline” were not used. However, the search string returned several articles which focussed on treeline, subalpine and montane tree species and these were included, if they also satisfied our other criteria.
For the purposes of this study, we define the term “article” as a peer-reviewed scientific journal article, and a “study” is nested within an article. For example, an article will comprise multiple studies if it includes multiple precipitation treatment conditions or sites. In situ studies commonly use precipitation differences to describe treatment conditions, while laboratory or glasshouse experiments typically use differences in volumetric soil moisture, or watering frequency. We use the term “water supply” to broadly encompass all the terms relating to water available to plants.
To ensure that we only included articles in the review specifically related to the responses of plants of high elevation ecosystems to changes in water supply, we used two levels of screening. At the first level of screening, we read titles and abstracts, excluding articles that did not satisfy at least two of the following criteria: (1) a focus on plants; (2) a focus on high elevation, montane or alpine environments; and (3) a measure of plant response to either an increase or decrease in water supply. Full text pdf format files were obtained for all the articles that passed the first level of screening. At the second level of screening, we read entire articles, excluding those that did not include any of the following: original research focussed on responses of plants to changes in water supply or water availability, or those that contained empirical data, provided statistical analyses of data, or had been entirely published in English. We did not include review and meta-analysis articles, book chapters, government reports or grey literature. At each level of screening, we recorded the number of articles identified and the number of studies included and excluded according to the Preferred Reporting Items for Systematic Reviews and Meta-Analyses (PRISMA) Statement [29].
2.2. Meta-Analysis
The meta-analysis focussed on a subset of the studies included in the systematic review that imposed an experimental change to water supply (increase or decrease) in relation to a control group. For in situ experiments, control groups were typically defined as plants or plots receiving ambient water levels while in ex situ experiments, control groups were defined as plants receiving unlimiting water. We excluded articles that altered the timing of precipitation, amount of snow accumulation, as well as articles which utilised natural environmental conditions including natural climatic events or soil moisture gradients due to the lack of clear control groups.
We focussed on studies that reported changes in physiological performance, growth, and abundance indices to changes in water supply and water availability. These response variables included photosynthetic rate, quantum yield of PSII (Fv/Fm), above-ground biomass, below-ground biomass, root:shoot ratio, heat resistance, freezing resistance, species richness, and percent cover. For studies that included freezing resistance, the sign of the effect sizes was reversed to aid interpretation, such that a decrease in freezing resistance would return a negative result and an increase would return a positive result. For simplicity, we categorised “growth rate”, “height”, “number of leaves” and “above-ground dry weight” all as “above-ground biomass”.
For inclusion in our meta-analysis, studies had to have provided sufficient information to derive means, standard deviations, and sample sizes. These summary statistics were either taken directly from tables reported in Results or Supplementary Materials, or extracted from figures using the metaDigitise package [30] in R. Studies that did not provide sufficient data to calculate effect sizes (e.g., reported model co-efficients and standard errors, not means and standard deviations or standard errors) were excluded from the meta-analysis. To reduce complications from interacting abiotic factors, only the data relating solely to changes in water supply were included in the meta-analysis. Studies that investigated additional biotic factors including grazing, trampling, and plant competition were included in the meta-analysis when it was clear that those biotic conditions were likely to occur at the sites investigated in the study (e.g., grazing is likely to occur at a study site in some seasons/years). We allocated studies to magnitude groups based on irrigation inputs described in the methods. For the precipitation increase dataset, when it was not possible to calculate percentage difference between treatment and control groups, studies were described as applying a “supplemental” irrigation treatment magnitude.
In in situ studies, plants or plots receiving ambient precipitation were treated as control groups and compared to plants or plots receiving either a reduction or increase in ambient precipitation levels. In ex situ studies, plants receiving low-stress, well-watered conditions were treated as control groups and compared to treatment groups that received reduced water supply. Sample sizes typically corresponded to the number of individuals, or number of plots used in the data analysis for each response variable reported. If repeated measurements were provided for a given site or species (e.g., above-ground biomass measured across multiple years), we averaged data to calculate pooled means and standard deviations.
We used the “escalc” function in the metafor package [31] in R to calculate standardized mean differences (Hedges’ g) [32] between treatment and control. This summary measure controls for bias in studies with small sample sizes by adjusting for variation in study effort. Negative values indicate a negative response to water supply modification (e.g., reduced biomass in plots with decreased water supply), whereas positive values indicate a positive response to modifications in water supply.
We split studies into those that increased and those that decreased precipitation relative to controls and performed separate analyses on each dataset. We used multilevel models to analyse variation in effect sizes, with the metafor package. We included random effect terms for species, family, article identity and study identity (studies nested within articles) to account for non-independence between effect sizes from the same species, family, article and studies within articles. We fitted seven models containing different combinations of article, species, taxonomic family and study identity and ranked these models using Akaike’s Information Criterion (AIC) to identify the appropriate random effect structure. We assessed whether broad taxonomic patterns were present in the data by fitting a model with family as the explanatory variable. For each model, we considered predictor variables significant when the 95% confidence intervals did not overlap zero.
Study Heterogeneity and Publication Bias
To test for the level of variation between study effect sizes in each meta-analysis (separate water supply increase and decrease datasets), and to interpret whether the variance was due to heterogeneity between studies or due to sampling error, we calculated a Q heterogeneity test (I2) using metafor. Higher I2 values indicate that a higher proportion of the total variance between effect sizes can be attributed to heterogeneity between studies, rather than to chance [33]. To test for publication bias in our datasets, we used two different methods. Firstly, we constructed funnel plots and inspected them visually for asymmetry; and secondly, we conducted Egger’s regression tests for funnel plot asymmetry. Funnel plots display effect size estimates of individual studies and their corresponding precision. In the absence of publication bias (that significant results are more likely to be published than non-significant results), studies with high precision will be plotted near the average, and studies with low precision will be scattered either side of the average to resemble an inverted funnel shape [34]. Funnel plot asymmetry provides an indication that significant results are more likely published than non-significant results [34].
3. Results
3.1. Systematic Review
Our systematic review produced 147 articles investigating changes to water supply and/or water availability in high mountain plant species, with a sharp increasing trend of publications per year since 2000 (Figure 1). Studies included in the systematic review were carried out in 19 countries; however, the majority of these occurred in Europe, Asia and North America (41%, 34% and 18%, respectively) with Oceania and South America representing 4% each (Figure 1). The most represented plant families investigated amongst these studies were Poaceae (19%), followed by studies investigating plant communities (13%), Pinaceae (12%), Asteraceae (11%), and Fabaceae (9%), with 33 additional plant families representing the remaining 36%.
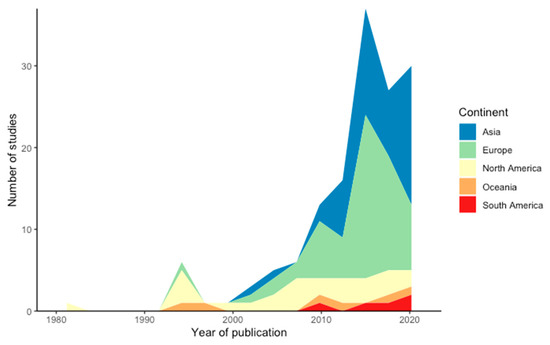
Figure 1.
Number of studies in the systematic review dataset (n = 147) published per continent, per year. Different coloured bands are cumulative within years and are stacked: thicker colour bands represent more cumulative publications for that continent in a given year.
The majority of studies (81%) focussed on individual species rather than plant communities (12%). Overall, seeds, immature and mature plants from 262 species across 40 families were assessed in studies that measured plant response to changes in water supply.
Studies mainly concentrated on decreases in water supply (60%), as opposed to increases in water supply (38%), while few compared natural conditions (e.g., wet versus dry sites or years) (2%) (Figure 2). Mostly, articles focussed on experimentally manipulating water supply in a single direction (either an increase or decrease), though a total of 20 articles (out of 147 included in the systematic review) applied both increases and decreases to water supply compared to controls. Water supply reduction studies were equally carried out in situ or within controlled environments (e.g., growth chambers) (41% each), while water supply increase studies were overwhelmingly carried out in situ (91%) (Figure 2).
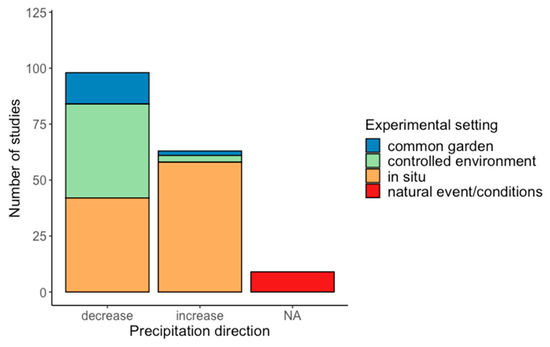
Figure 2.
The direction of precipitation treatments included in the systematic review, grouped by experimental setting.
Water supply reduction studies were typically carried out between 1–6 months (50%) and 1–3 years (22%) (Figure 3), whereas the most common duration in studies that increased water supply was 1–3 years (64%) followed by 1–6 months (24%) (Figure 4). Water supply reduction studies focussed mostly on mature plants (63%), with immature and seed life stages comprising 33% and 4%, respectively (Figure 3). In contrast, most water supply increase studies were focussed on mature plants (91%), with immature life stages (9%) less represented (Figure 4).
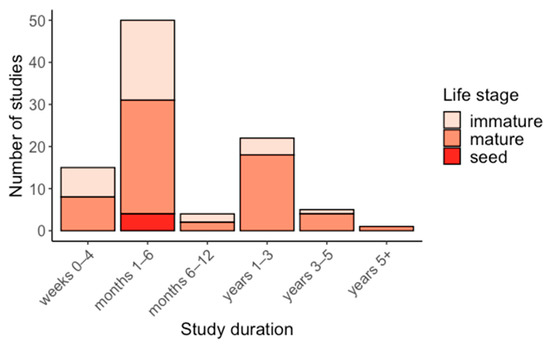
Figure 3.
Duration of water supply reduction studies, grouped by life stage.
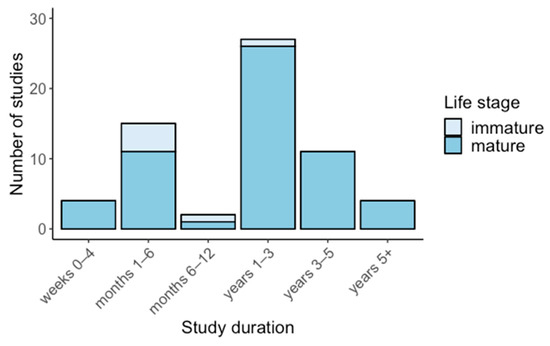
Figure 4.
Duration of water supply increase studies, grouped by life stage.
3.2. Meta-Analysis
For the meta-analysis, we analysed 647 effect sizes, of which 491 involved water supply decreases and 156 involved water supply increases. For the water supply decrease dataset, the best global model had “species” and “study” nested within “article” as random effects (Supplementary Materials, Table S1). The best global model for our water supply increase dataset included “species” and “article” as random effects (Supplementary Materials, Table S2).
Sites from articles included in the meta-analysis were located predominantly in the northern hemisphere including Europe, North America, and Asia (Figure 5) across a range of climate groups, though most were concentrated within temperate and arid climates.
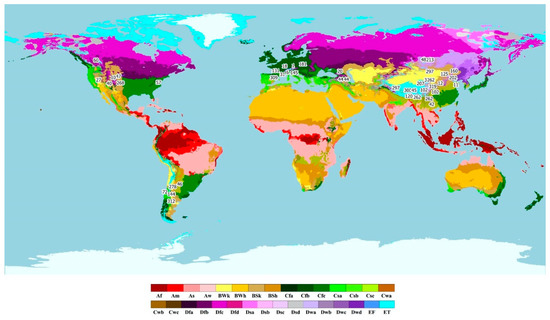
Figure 5.
Köppen–Geiger climate map showing study site locations from articles included in the meta-analysis. Numbers correspond to article numbers. Colour scale refers to Köppen–Geiger climate classification criteria (Main climates: A: equatorial, B: arid, C: warm temperature, D: snow, E: polar; Precipitation: W: desert, S: steppe, f: fully humid, s: summer dry, w: winter dry, m: monsoonal; Temperature: h: hot arid, k: cold arid, a: hot summer, b: warm summer, c: cool summer, d: extremely continental, F: polar frost, T: polar tundra).
3.2.1. Modification of Water Supply In Situ
Typically, in situ studies employed rainout shelters to apply water supply reduction treatments (n = 20). These structures consisted of a transparent roof situated above vegetation plots to exclude varying amounts of natural precipitation, with control plots receiving ambient precipitation. Studies that increased water supply to plants in situ typically did this by applying water manually (n = 16), through irrigation systems (n = 4), or passively using proportional collection funnels (n = 3). In addition, some studies that compared both increases and decreases in precipitation to ambient controls collected the rain excluded by rainout shelters and redistributed to plots to create a water surplus treatment (n = 9).
3.2.2. Modification of Water Supply Ex Situ
Typically, ex situ studies conducted in controlled environments used plants that were well-watered as control groups. This was achieved either by using high watering frequencies, or by maintaining a predetermined high level of volumetric soil moisture or field capacity. These were typically compared to plants which were watered less frequently (n = 3), with less water (n = 2), were not watered at all (dry down) (n = 8) or were maintained at a predetermined lower level of volumetric soil moisture (n = 1) or field capacity (n = 5). Studies conducted in common gardens used rainout shelters (n = 3) and the dry down method (1) in water supply decrease treatments, and compared well-watered plants to lower levels of volumetric soil moisture (n = 2) and field capacity (n = 2) in water supply increase treatments.
3.2.3. Water Supply Decreases
For the reductions in water supply dataset, the mean effect size (Hedges’ g) was −0.75 (95% CI: −1.09 to −0.41), thereby demonstrating an overall negative effect on plant responses (Figure 6; Supplementary Materials Table S3). Under a decrease in water supply, trees (Hedges’ g: −1.22, 95% CI: −1.91 to −0.53), graminoids (Hedges’ g: −0.73, 95% CI: −1.19 to −0.27), forbs (Hedges’ g: −0.51, 95% CI: −0.96 to −0.07) and communities (Hedges’ g: −0.71, 95% CI: −1.21 to −0.22) had similar negative effect sizes and CIs that overlapped each other (Figure 6), while shrubs (Hedges’ g: −0.66, 95% CI: −1.38 to 0.06) and legumes (Hedges’ g: −0.20, 95% CI: −0.78 to 0.38) had weakly negative effect sizes. There were similarly strong negative effects amongst immature (Hedges’ g: −0.80, 95% CI: −1.28 to −0.33) and mature (Hedges’ g: −0.70, 95% CI: −1.19 to −0.22) life stages, with CIs that overlapped each other. Experiments conducted in situ (Hedges’ g: −0.72, 95% CI: −1.34, −0.11) and in controlled environments (Hedges’ g: −0.85, 95% CI: −1.34, −0.36) had significantly negative effect sizes with overlapping CIs, and those conducted in common gardens were weakly negative (Hedges’ g: −0.56, 95% CI: −1.31 to 0.19).
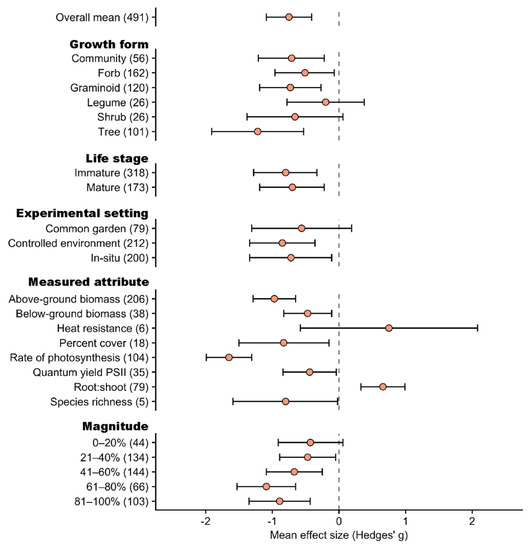
Figure 6.
Mean effect sizes (Hedges’ g) and 95% confidence intervals for the effect of reductions to water supply on high elevation plants according to growth form, life stage, experimental setting, response variable measured, and treatment magnitude. Sample sizes for each predictor variable are represented in parentheses.
All measured response attributes had negative mean effect sizes except for root:shoot ratio which was positive (Hedges’ g: 0.66, 95% CI: 0.33 to 0.99), and heat resistance which was weakly positive (Figure 6). Rate of photosynthesis had the strongest negative response (Hedges’ g: −1.65, 95% CI: −1.99 to −1.31), followed by above-ground biomass, percent cover, species richness, below-ground biomass and quantum yield PSII, all with CIs not overlapping zero (Figure 6). The CIs overlapped for most response variables, although the rate of photosynthesis and root:shoot ratio had the most negative and positive mean responses, respectively (Figure 6).
Studies that reduced water supply by a magnitude of 0–20% showed a weakly negative response with CIs that overlapped zero (Hedges’ g: −0.43, 95% CI: −0.91 to 0.06) (Figure 6). In comparison, studies that reduced water supply by 21% or more all showed strong negative responses, with CIs that overlapped each other. Studies with magnitudes of 61–80% had the strongest negative response (Hedges’ g: −0.109, 95% CI: −1.53 to −0.65), followed by those that decreased by 81–100% magnitude, 41–60% magnitude, and 21–40% magnitude (Figure 6).
3.2.4. Water Supply Increases
The mean effect size (Hedges’ g) for the increases in water supply dataset was 0.10 (95% CI: −0.43 to 0.62) indicating essentially neutral plant responses (Figure 7; Supplementary Materials Table S4). Under an increase in water supply, only graminoid (Hedges’ g: 0.18, 95% CI: −0.45 to 0.81) and tree (Hedges’ g: 0.34, 95% CI: −1.13 to 1.82) growth forms showed positive responses, though both CIs overlapped zero (Figure 7). Studies that investigated communities, forbs, or legumes all showed essentially neutral responses. In contrast, shrubs showed weak negative response (Hedges’ g: −0.53, 95% CI: −1.39 to 0.33), though this is likely driven by freezing resistance being the main response variable measured in shrubs (60%) which showed a strong negative response (Hedges’ g: −1.45, 95% CI: −2.57 to −0.33). Other response variables including above-ground biomass, below-ground biomass, percent cover, rate of photosynthesis, quantum yield PSII, and species richness all showed weak positive responses, with CIs overlapping zero (Figure 7).
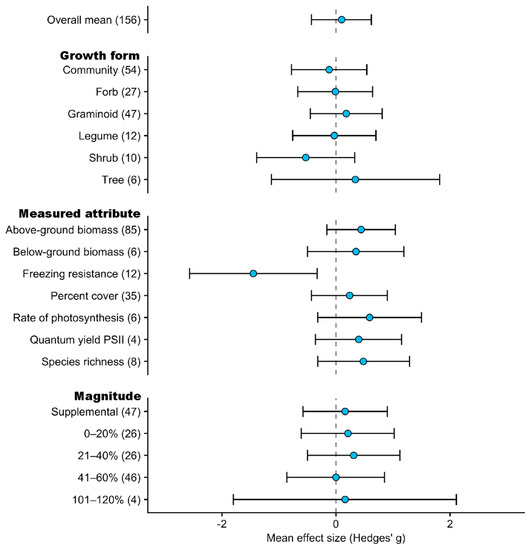
Figure 7.
Mean effect sizes (Hedges’ g) and 95% confidence intervals for the effect of increases to water supply on high elevation plants according to growth form, response variable measured, and treatment magnitude. Sample sizes for each predictor variable are represented in parentheses. Only predictor variables with sample sizes equal to or greater than 4 are shown.
Studies that increased water supply by supplemental watering, or experimentally increased water supply by magnitudes between 0–20%, 21–40% and 101–120% all showed weakly positive responses, with overlapping CIs which also overlapped zero (Figure 7). Studies that increased water supply by a magnitude of 41–60% showed an essentially neutral response (Hedges’ g: 0.00, 95% CI: −0.58 to 0.90).
3.3. Publication Bias and Heterogeneity
We detected evidence of publication bias amongst the studies reporting reductions in water supply, but not those reporting increases in water supply (Supplementary Materials, Figure S2). Egger’s tests confirmed funnel plot trends, for the water supply increase data set (z = 1.0111, p ≥ 0.05), and for the water supply decrease dataset (z = −9.2470, p < 0.0001). While we detected and removed outliers from the water supply decrease dataset, the Egger’s test was still significant (z = −22.5508, p ≤ 0.0001), suggesting a strong signal of publication bias in the decrease in water supply dataset, which indicates a tendency for more negative results to be published than positive ones.
The heterogeneity test returned an I2 value of 81% for the water supply decrease dataset, and an I2 value of 72% for the water supply increase dataset. These values indicate moderate to substantial heterogeneity, which justifies the inclusion of moderators to explain the variation in our datasets.
4. Discussion
We aimed to determine how plants of high-elevation environments respond to varying water supply. From our meta-analysis, it is evident that reductions in water supply are largely met with negative plant responses, while increases to water supply stimulate some positive, although weaker plant responses. We found the strength of responses to altered water supply among differing life forms/plant groups such as graminoids, trees, legumes, shrubs, and forbs, to be highly variable. The number of studies that measure plant responses to changing water supply in high elevation and high mountain ecosystems is rapidly increasing, though a strong geographic bias towards the northern hemisphere remains. In addition, there appears to be an over-representation of mature plant responses compared to those from early life history stages which are considered critical in the maintenance of plant populations, and especially vulnerable to the effects of a changing climate [35,36].
4.1. Decreases in Water Supply
We predicted that, overall, negative responses of high elevation plants to decreases in water supply were likely, given that all plants slow their growth in response to declining water potentials in their leaves [37,38]. Negative responses among high-elevation plants were evident when water supply was reduced by at least 21% and generally became stronger with increasing magnitude. However, the strength of response to decreases in water supply also appears to be associated in part with plant growth form. Woody and herbaceous plants differ fundamentally in root architecture (rooting depth and lateral spread) [39]. Herbaceous taxa concentrate a high proportion of their root biomass in the upper parts of the soil [39] and are generally considered to be more prone to episodic soil water shortages [4]. Our data support this effect, with graminoids and forbs showing strong negative responses to decreasing water supply, while shrubs showed only weak negative responses. During periods of drought, root biomass in herbaceous species has been shown to quickly decrease as a result of mortality, and the inhibition of root production [40]. By comparison, woody plants tend to be deeper rooting and are considered less susceptible to fluctuations in near-surface water availability [39]. It should be noted, however, that the grasses which comprise the majority of our graminoid dataset are typically soft-leaved, C3 species and are not representative of Poaceae in all high elevation ecosystems. While high elevation C4 grasses are rare, they will likely exhibit higher drought tolerance than typical cool-season C3 grasses [41]. Indeed, alpine plants from mountains which experience summer droughts are considered to have elevated desiccation tolerance [6]. Similarly, giant rosettes from high tropical mountains may also withstand long periods of soil drought due to their capacity to store water in well-developed pith [42].
Contrary to assumptions based on maximum rooting depth, the treeline and sub-alpine trees amongst the studies in this dataset showed strong negative responses to decreased water supply. Similarly, immature plants, considered more vulnerable to unfavourable conditions [36], showed similar responses to mature plants. Generalisations regarding “deep” and “shallow” rooting responses to drought, may be less applicable in high elevation ecosystems. At high elevations, soils can be very shallow and plants typically have shallower roots with higher root densities in the upper, warmer soil layers [43]. Shallow roots, which are highly sensitive to water fluctuations, show almost equally fast turnover rates among herbaceous and woody plants [44], and can show similarly negative responses to reductions in precipitation [40].
4.2. Increases in Water Supply
Most growth forms showed neutral responses to increases in water supply, with graminoids and trees showing weakly positive responses. A meta-analysis of field experiments in the Arctic also found largely insignificant responses to increases in precipitation among most plant functional groups [45]. In contrast, Wu et al. [46] found high sensitivities among both woody and herbaceous plants to increased precipitation, and that cold-climate ecosystems were more responsive than warm-climate ones. Additional precipitation during the growing season can ease moisture limitations and stimulate plant growth [46]. We expected the strength of plant responses to reflect water supply magnitude; however, there was no discernible pattern amongst magnitude groups. This may indicate that the plants under ambient precipitation or soil moisture conditions were not experiencing water limitations. With increasing annual precipitation, plant productivity becomes less sensitive to inter-annual variability in precipitation [47]; therefore, low sensitivity may simply reflect a higher proportion of plants from mesic sites in our dataset. Indeed, while comprising high levels of taxonomic diversity [48,49] there is a notable paucity of studies in the literature and within our dataset, from mountain regions with Mediterranean or tropical climates. Extrapolation of plant responses from our meta-analysis to these regions must be conducted with caution. Given summer drought is the main abiotic factor constraining plant establishment in Mediterranean-type ecosystems [50], increases in water supply may trigger responses that contrast significantly with mesic-climate mountains. Alternatively, the outcomes of plant responses to water supply increase may reflect experimental design. All studies focussing on precipitation increases were conducted in situ where increased precipitation was typically applied to experimental plots using sprinklers [51,52] or by diverting rainfall from passive rainout shelters [53]. Studies rarely reported soil moisture at varying depths, yet these methods of water application potentially only recharge the surface soil layers. Consequently, taxa with deep roots may not be able to exploit small additions of supplemental watering typical of these types of field experiments, compared to shallow-rooted taxa.
4.3. Plant Growth, Biomass Accumulation and Plastic Responses
Plant growth over the active growing season, measured as increases in above-ground biomass, is clearly sensitive to water availability in high elevation plants, with significant responses to decreases in water supply. The most effective allocation of biomass to above-ground and below-ground tissue depends on resource availability [54], hence plasticity in the partitioning of carbohydrates can facilitate adjustments to changing environmental conditions [55,56,57]. For instance, the allocation to root growth was enhanced when drought-tolerant Anisodus tanguticus was placed under water stress [56]. Higher resource investments in root compared to shoot biomass reduces the detrimental effects of water limitations as a large root network improves a plant’s ability to access to water and nutrients [58], and reduced investment in above-ground biomass reduces the evaporative demand to the plant [59]. By comparison, crown density significantly increased in fast-growing Pinus sylvestris when water supply was increased [60]. It is considered more likely, however, that fast-growing species can alter morphological traits such as biomass allocation more rapidly than slow growing and stress-tolerant species [61]. By comparison, plants prone to seasonal water-shortages can maintain robust physiological functioning even though they show low plasticity in water-related morphological traits [62,63,64]. Indeed, while morphological plasticity is a strategy that may help plants cope with changing soil water availability, plants may use alternative strategies to adjust to varying water availability.
It is often assumed that slow-growing species should exhibit greater physiological plasticity than morphological plasticity as it is considered a less expensive alternative to plants [63,65,66]. Reversible physiological adjustments (acclimations) to varying water supply are likely common among inherently slow growing high elevation plants [67]. Indeed, photosystem II performance and rate of photosynthesis were highly sensitive to reductions in water supply. Some plants have the capacity to rapidly facilitate stomatal closure and reduce photosynthesis rates in response to the declining water potential of their leaves [38]. Conservative responses to water limitations can occur relatively quickly in wild plants. These may depend upon several physiological factors such as hydraulic conductivity, growth and photosynthetic rates, and water use efficiencies [68]. For example, when watering ceased, net photosynthetic rate and gas exchange decreased significantly within a matter of days in high elevation grass species [69]. Thermal tolerance also appears to respond to varying water supply, with a reduction in plant tolerance to freezing observed when water supply was increased. This reaction is possibly linked to a de-acclimation response typically associated with increasing temperatures and photoperiod during the onset of the growing season [70]. However, despite showing similarly fast gas exchange responses to water stress, populations of several grass species survived longer if they had smaller leaves [69]. Indeed, traits such as smaller leaves and greater water use efficiency are selected for in dry conditions as they reduce water loss during periods of low water availability [71]. Physiological trait plasticity may provide an advantage to high elevation plants during periodic fluctuations in soil moisture, though it may not confer a fitness advantage where long, dry periods prevail.
4.4. Effects of Altered Water Supply on Community Composition
While short-term experiments are useful in providing a snap-shot of plant species responses to either increases or decreases in soil moisture, longer-term experiments (5+ years) conducted in situ can provide insight into responses at the community-level. Shifts in community composition, particularly long-term fluctuations in abundance, are likely to arise with ongoing changes to precipitation and water supply. Abundance of rarer or infrequent species may increase due to the relaxation of water limitations [72], or decrease through intensified interspecies competition and susceptibility to water limitations [26]. Plant responses to altered climate factors can be largely idiosyncratic [73], and may vary depending on the combinations of climate factors that are changing. While we did not include studies in our meta-analysis that combined additional abiotic factors with changes to precipitation, it is important to note that complex interactions between abiotic and biotic factors exist that are well known to affect overall plant responses. Altered precipitation had a stronger effect on community biomass in the Tibetan Plateau when warming was simultaneously applied [18]. Indeed, plant responses to altered water availability may be amplified by other climatic and abiotic factors that are changing, such as increased CO2 [74] and increased nitrogen through atmospheric deposition [75]. In some instances, nitrogen availability may ameliorate the effects of drought [76], which could partly explain the weak response amongst N-fixing legumes to decreased water supply in our dataset. Plant growth enhanced by increased precipitation may also be counterbalanced by subsequent increases in herbivory [77], or through increases in concurrent environmental stressors such as UV-B radiation [78]. Alternatively, multiple resource limitations can co-limit the growth or survival of seedlings, or amplify the susceptibility of plants to environmental stressors such as drought [79]. Interactive effects must be more routinely included into studies to account for this complexity.
5. Conclusions
Overall, results from our meta-analysis suggest that high elevation plants show variable responses to water supply, which is projected to change with ongoing climate change. High elevation plants included in our study tended to show stronger responses to water reductions than to water increases, contrasting with previous meta-analyses across terrestrial ecosystems [46]. This likely indicates that water is not a strong limiting factor for high elevation plants and communities included in our dataset, though it is important to note that our dataset is strongly mesic and northern hemisphere biased. Plant responses are likely to differ in plants from mountainous regions with a Mediterranean-type climate (characterised by hot and dry summers) which were underrepresented in our study. Different responses to varying water availability among plant functional groups may lead to changes in the cover and abundance of certain plant groups or species, with flow-on effects for the structure and functioning of high mountain plant communities. Plant responses may also be compounded or offset by simultaneous rising temperatures, and the increasing intensity and frequency of extreme events such as heatwaves, droughts, and fires. Physiological and morphological plant responses to varying water supply inform us about the mechanisms behind plant responses to the climate drivers that are changing. It is increasingly important, however, that experiments are applied under realistic settings which represent forecasted precipitation scenarios including changes to the frequency, magnitude, and timing of precipitation, combined with interactions with other drivers of global change. Current understanding of the effects of altered water supply on plants from high elevation ecosystems is limited to predominantly northern-hemisphere mesic mountains. Despite being exceptionally biodiverse, mountains with Mediterranean and tropical climates are severely underrepresented within the literature, and future research should aim to balance this bias.
Supplementary Materials
The following are available online at https://www.mdpi.com/article/10.3390/land10111150/s1, Figure S1: PRISMA diagram showing the literature search and exclusion process using the search terms above. Numbers in parentheses indicate the number of articles included or excluded at each step, Figure S2: Funnel plots for datasets used in the null model of the water supply decrease (a) and increase (b) datasets. The x-axis shows observed outcome of effect size (Hedges’ g) and the y-axis shows the standard error. Note, outliers with observed outcomes <−54 have been removed from the decrease dataset funnel plot. Table S1. Model selection table of Multivariate Meta-analysis models explaining variation in Hedges’ g in the water supply decrease dataset, their Δ Akaike Information Criterion. Table S2. Model selection table of Multivariate Meta-analysis models explaining variation in Hedges’ g in the water supply increase dataset, their Δ Akaike Information Criterion. Table S3. Estimates of Hedges’ g for each moderator variable within the water supply decrease dataset. Table S4. Estimates of Hedges’ g for each moderator variable within the water supply increase dataset.
Author Contributions
Conceptualization, E.S. and S.V.; methodology, E.S. and S.V.; formal analysis, E.S.; data curation, E.S.; writing—original draft preparation, E.S.; writing—review and editing, S.V.; supervision, S.V.; project administration, E.S. and S.V.; funding acquisition, S.V. All authors have read and agreed to the published version of the manuscript.
Funding
This research received no external funding. EES was supported by a Deakin University Post-Graduate Research Scholarship.
Institutional Review Board Statement
Not applicable.
Informed Consent Statement
Not applicable.
Data Availability Statement
Data are made available through the Dryad Digital Repository (https://doi.org/10.5061/dryad.t4b8gtj2z).
Acknowledgments
We thank Chloe Sato, Eilysh Thompson and Billy Geary for their methodological and statistical advice, and John Morgan, Tricia Wevill and Zac Walker for comments and technical advice that improved the manuscript. We acknowledge and thank the researchers that collected the data and conducted the research that this systematic review and meta-analysis was based on. We thank the two anonymous reviewers who provided comments to improve the manuscript.
Conflicts of Interest
The authors declare no conflict of interest. The funders had no role in the design of the study; in the collection, analyses, or interpretation of data; in the writing of the manuscript, or in the decision to publish the results.
References
- Badano, E.I.; Cavieres, L.A.; Molina-Montenegro, M.A.; Quiroz, C.L. Slope aspect influences plant association patterns in the Mediterranean matorral of central Chile. J. Arid Environ. 2005, 62, 93–108. [Google Scholar] [CrossRef]
- Pérez-Ramos, I.M.; Roumet, C.; Cruz, P.; Blanchard, A.; Autran, P.; Garnier, E. Evidence for a “plant community economics spectrum” driven by nutrient and water limitations in a Mediterranean rangeland of southern France. J. Ecol. 2012, 100, 1315–1327. [Google Scholar] [CrossRef] [Green Version]
- Baastrup-Spohr, L.; Sand-Jensen, K.; Nicolajsen, S.V.; Bruun, H.H. From soaking wet to bone dry: Predicting plant community composition along a steep hydrological gradient. J. Veg. Sci. 2015, 26, 619–630. [Google Scholar] [CrossRef]
- Oberbauer, S.F.; Billings, W.D. International Association for Ecology Drought Tolerance and Water Use by Plants along an Alpine Topographic Gradient. Oecologia 1981, 50, 325–331. [Google Scholar] [CrossRef] [PubMed]
- Larcher, W.; Kainmüller, C.; Wagner, J. Survival types of high mountain plants under extreme temperatures. Flora-Morphol. Distrib. Funct. Ecol. Plants 2010, 205, 3–18. [Google Scholar] [CrossRef]
- Sierra-Almeida, A.; Reyes-Bahamonde, C.; Cavieres, L.A. Drought increases the freezing resistance of high-elevation plants of the Central Chilean Andes. Oecologia 2016, 181, 1011–1023. [Google Scholar] [CrossRef]
- De Boeck, H.J.; Bassin, S.; Verlinden, M.; Zeiter, M.; Hiltbrunner, E. Simulated heat waves affected alpine grassland only in combination with drought. New Phytol. 2016, 209, 531–541. [Google Scholar] [CrossRef]
- Osakabe, Y.; Osakabe, K.; Shinozaki, K.; Tran, L.S.P. Response of plants to water stress. Front. Plant Sci. 2014, 5, 1–8. [Google Scholar] [CrossRef] [Green Version]
- Buchner, O.; Stoll, M.; Karadar, M.; Kranner, I.; Neuner, G. Application of heat stress in situ demonstrates a protective role of irradiation on photosynthetic performance in alpine plants. Plant Cell Environ. 2015, 38, 812–826. [Google Scholar] [CrossRef] [Green Version]
- Faggian, P. Climate Change Projections for Mediterranean Region with Focus over Alpine Region and Italy. J. Environ. Sci. Eng. B 2015, 4, 482–500. [Google Scholar] [CrossRef]
- Hao, Z.; Ju, Q.; Jiang, W.; Zhu, C. Characteristics and scenarios projection of climate change on the tibetan plateau. Sci. World J. 2013, 2013, 129793. [Google Scholar] [CrossRef] [Green Version]
- Hock, R.; Rasul, G.; Adler, C.; Cáceres, B.; Gruber, S.; Hirabayashi, Y.; Jackson, M.; Kääb, A.; Kang, S.; Kutuzov, S.; et al. High Mountain Areas. In IPCC Special Report on the Ocean and Cryosphere in a Changing Climate; Pörtner, H.-O., Roberts, D.C., Masson-Delmotte, V., Zhai, P., Tignor, M., Poloczanska, E., Mintenbeck, K., Alegría, A., Nicolai, M., Okem, A., et al., Eds.; IPCC: Geneva, Switzerland, 2019; in press. [Google Scholar]
- Theobald, A.; McGowan, H.; Speirs, J. Trends in synoptic circulation and precipitation in the Snowy Mountains region, Australia, in the period 1958–2012. Atmos. Res. 2016, 169, 434–448. [Google Scholar] [CrossRef] [Green Version]
- IPCC. Climate Change 2021: The Physical Science Basis. Contribution of Working Group I to the Sixth Assessment Report of the Intergovernmental Panel on Climate Change; Masson-Delmotte, V., Zhai, P., Pirani, A., Connors, S.L., Péan, C., Berger, S., Caud, N., Chen, Y., Goldfarb, L., Gomis, M.I., et al., Eds.; Cambridge University Press: Cambridge, UK, 2021; in press. [Google Scholar]
- Arnold, C.; Ghezzehei, T.A.; Berhe, A.A. Early spring, Severe frost events, and drought induce rapid carbon loss in high elevation meadows. PLoS ONE 2014, 9, e106058. [Google Scholar] [CrossRef]
- Beniston, M. Climatic Change in Mountain Regions: A Review of Possible Impacts. Clim. Var. Chang. High Elev. Reg. Past Present Future 2003, 15, 5–31. [Google Scholar] [CrossRef] [Green Version]
- Conner, L.G.; Gill, R.A.; Belnap, J. Soil moisture response to experimentally altered snowmelt timing is mediated by soil, vegetation, and regional climate patterns. Ecohydrology 2016, 9, 1006–1016. [Google Scholar] [CrossRef]
- Ma, Z.; Liu, H.; Mi, Z.; Zhang, Z.; Wang, Y.; Xu, W.; Jiang, L.; He, J.-S. Climate warming reduces the temporal stability of plant community biomass production. Nat. Commun. 2017, 8, 1–7. [Google Scholar] [CrossRef] [PubMed]
- Balfagón, D.; Zandalinas, S.I.; Mittler, R.; Gómez-Cadenas, A. High temperatures modify plant responses to abiotic stress conditions. Physiol. Plant. 2020, 170, 335–344. [Google Scholar] [CrossRef]
- Zavaleta, E.S.; Shaw, M.R.; Chiariello, N.R.; Thomas, B.D.; Cleland, E.E.; Field, C.B.; Mooney, H.A. Grassland responses to three years of elevated temperature, CO 2, precipitation, and N deposition. Ecol. Monogr. 2003, 73, 585–604. [Google Scholar] [CrossRef] [Green Version]
- Jentsch, A.; Kreyling, J.; Elmer, M.; Gellesch, E.; Glaser, B.; Grant, K.; Hein, R.; Lara, M.; Mirzae, H.; Nadler, S.E.; et al. Climate extremes initiate ecosystem-regulating functions while maintaining productivity. J. Ecol. 2011, 99, 689–702. [Google Scholar] [CrossRef]
- Moser, B.; Temperli, C.; Schneiter, G.; Wohlgemuth, T. Potential shift in tree species composition after interaction of fire and drought in the Central Alps. Eur. J. For. Res. 2010, 129, 625–633. [Google Scholar] [CrossRef]
- Zhang, T.; Xu, M.; Zhang, Y.; Zhao, T.; An, T.; Li, Y.; Sun, Y.; Chen, N.; Zhao, T.; Zhu, J.; et al. Grazing-induced increases in soil moisture maintain higher productivity during droughts in alpine meadows on the Tibetan Plateau. Agric. For. Meteorol. 2019, 269, 249–256. [Google Scholar] [CrossRef]
- Xu, M.; Zhang, T.; Zhang, Y.; Chen, N.; Zhu, J.; He, Y.; Zhao, T.; Yu, G. Drought limits alpine meadow productivity in northern Tibet. Agric. For. Meteorol. 2021, 303, 108371. [Google Scholar] [CrossRef]
- Jackson, R.B.; Canadell, J.; Ehleringer, J.R.; Mooney, H.A.; Sala, O.E.; Schulze, E.D. A global analysis of root distributions for terrestrial biomes. Oecologia 1996, 108, 389–411. [Google Scholar] [CrossRef] [PubMed]
- Berauer, B.J.; Wilfahrt, P.A.; Arfin-Khan, M.A.S.; Eibes, P.; Von Heßberg, A.; Ingrisch, J.; Schloter, M.; Schuchardt, M.A.; Jentsch, A. Low resistance of montane and alpine grasslands to abrupt changes in temperature and precipitation regimes. Arctic, Antarct. Arct. Antarct. Alp. Res. 2019, 51, 215–231. [Google Scholar] [CrossRef]
- Debinski, D.M.; Wickham, H.; Kindscher, K.; Caruthers, J.C.; Germino, M. Montane meadow change during drought varies with background hydrologic regime and plant functional group. Ecology 2010, 91, 1672–1681. [Google Scholar] [CrossRef] [PubMed]
- Scherrer, P.; Pickering, C.M. Recovery of Alpine Vegetation from Grazing and Drought: Data from Long-term Photoquadrats in Kosciuszko National Park, Australia. Arct. Antarct. Alp. Res. 2006, 37, 574–584. [Google Scholar] [CrossRef] [Green Version]
- Moher, D.; Liberati, A.; Tetzlaff, J.; Altman, D.G. Preferred reporting items for systematic reviews and meta-analyses: The PRISMA statement David Moher and colleagues introduce PRISMA, an update of the QUOROM guidelines for reporting systematic reviews and meta-analyses. BMJ 2009, 339, b2535. [Google Scholar] [CrossRef] [Green Version]
- Pick, J.L.; Nakagawa, S.; Noble, D.W.A. Reproducible, flexible and high-throughput data extraction from primary literature: The metaDigitise r package. Methods Ecol. Evol. 2019, 10, 426–431. [Google Scholar] [CrossRef] [Green Version]
- Viechtbauer, W. Conducting meta-analyses in R with the metafor. J. Stat. Softw. 2010, 36, 1–48. [Google Scholar] [CrossRef] [Green Version]
- Hedges, L.V.; Gurevitch, J.; Curtis, P.S. The Meta-Analysis of Response Ratios in Experimental Ecology. Ecology 1999, 80, 1150. [Google Scholar] [CrossRef]
- Higgins, J.P.T.; Thompson, S.G. Quantifying heterogeneity in a meta-analysis. Stat. Med. 2002, 21, 1539–1558. [Google Scholar] [CrossRef]
- Nakagawa, S.; Santos, E.S.A. Methodological issues and advances in biological meta-analysis. Evol. Ecol. 2012, 26, 1253–1274. [Google Scholar] [CrossRef]
- Fernández-Pascual, E.; Carta, A.; Mondoni, A.; Cavieres, L.A.; Rosbakh, S.; Venn, S.; Satyanti, A.; Guja, L.; Briceño, V.; Vandelook, F.; et al. The seed germination spectrum of alpine plants: A global meta-analysis. New Phytol. 2021, 229, 3573–3586. [Google Scholar] [CrossRef]
- Vázquez-Ramirez, J.; Venn, S.E. Seeds and Seedlings in a Changing World: A Systematic Review and Meta-Analysis from High Altitude and High Latitude Ecosystems. Plants 2021, 10, 768. [Google Scholar] [CrossRef]
- Bond, B.J.; Kavanagh, K.L. Stomatal behavior of four woody species in relation to leaf-specific hydraulic conductance and threshold water potential. Tree Physiol. 1999, 19, 503–510. [Google Scholar] [CrossRef] [PubMed]
- Passioura, J.B. Soil conditions and plant growth. Plant Cell Environ. 2002, 25, 311–318. [Google Scholar] [CrossRef]
- Canadell, J.; Jackson, R.B.; Ehleringer, J.R.; Mooney, H.A.; Sala, O.E.; Schulze, E.D. Maximum rooting depth of vegetation types at the global scale. Oecologia 1996, 108, 583–595. [Google Scholar] [CrossRef] [PubMed]
- Wang, P.; Huang, K.; Hu, S. Distinct fine-root responses to precipitation changes in herbaceous and woody plants: A meta-analysis. New Phytol. 2020, 225, 1491–1499. [Google Scholar] [CrossRef]
- Tieszen, L.L.; Senyimba, M.M.; Imbamba, S.K.; Troughton, J.H. The distribution of C3 and C4 grasses and carbon isotope discrimination along an altitudinal and moisture gradient in Kenya. Oecologia 1979, 37, 337–350. [Google Scholar] [CrossRef]
- Rada, F.; Azócar, A.; García-Núñez, C. Plant functional diversity in tropical Andean páramos. Plant Ecol. Divers. 2019, 12, 539–553. [Google Scholar] [CrossRef]
- Lichtenegger, E. Root Distribution in Some Alpine Plants. In Plant Root Systems and Natural Vegetation. Acta Phytogeographica Suecica; Persson, H., Baitulin, I.O., Eds.; Opulus Press AB: Uppsala, Sweden, 1996; pp. 76–82. [Google Scholar]
- Sun, K.; McCormack, M.L.; Li, L.; Ma, Z.; Guo, D. Fast-cycling unit of root turnover in perennial herbaceous plants in a cold temperate ecosystem. Sci. Rep. 2016, 6, 1–11. [Google Scholar] [CrossRef] [PubMed] [Green Version]
- Dormann, C.F.; Woodin, S.J. Climate change in the Arctic: Using plant functional types in a meta-analysis of field experiments. Funct. Ecol. 2002, 16, 4–17. [Google Scholar] [CrossRef]
- Wu, Z.; Dijkstra, P.; Koch, G.W.; Peñuelas, J.; Hungate, B.A. Responses of terrestrial ecosystems to temperature and precipitation change: A meta-analysis of experimental manipulation. Glob. Chang. Biol. 2011, 17, 927–942. [Google Scholar] [CrossRef] [Green Version]
- Huxman, T.E.; Smith, M.D.; Fay, P.A.; Knapp, A.K.; Shaw, M.R.; Lolk, M.E.; Smith, S.D.; Tissue, D.T.; Zak, J.C.; Weltzin, J.F.; et al. Convergence across biomes to a common rain-use efficiency. Nature 2004, 429, 651–654. [Google Scholar] [CrossRef] [PubMed]
- Körner, C. Alpine Plant Life: Functional Plant Ecology of High Mountain Ecosystems; Springer: Berlin/Heidelberg, Germany, 2003. [Google Scholar]
- Pauli, H.; Gottfried, M.; Dullinger, S.; Abdaladze, O.; Luis, J.; Alonso, B.; Coldea, G.; Dick, J.; Erschbamer, B.; Calzado, R.; et al. Recent Plant Diversity Changes on Europe’s Mountain Summits. Science 2012, 336, 353–355. [Google Scholar] [CrossRef] [PubMed] [Green Version]
- Castro, J.; Zamora, R.; Hódar, J.A.; Gómez, J.M. Seedling establishment of a boreal tree species (Pinus sylvestris) at its southernmost distribution limit: Consequences of being in a marginal Mediterranean habitat. J. Ecol. 2004, 92, 266–277. [Google Scholar] [CrossRef]
- Andrey, A.; Humbert, J.Y.; Pernollet, C.; Arlettaz, R. Experimental evidence for the immediate impact of fertilization and irrigation upon the plant and invertebrate communities of mountain grasslands. Ecol. Evol. 2014, 4, 2610–2623. [Google Scholar] [CrossRef] [Green Version]
- Lessard-Therrien, M.; Humbert, J.Y.; Arlettaz, R. Experiment-based recommendations for biodiversity-friendly management of mountain hay meadows. Appl. Veg. Sci. 2017, 20, 352–362. [Google Scholar] [CrossRef]
- Kohli, M.; Mijiddorj, T.N.; Suryawanshi, K.R.; Mishra, C.; Boldgiv, B.; Sankaran, M. Grazing and climate change have site-dependent interactive effects on vegetation in Asian montane rangelands. J. Appl. Ecol. 2021, 58, 539–549. [Google Scholar] [CrossRef]
- Poorter, H.; Sack, L. Pitfalls and possibilities in the analysis of biomass allocation patterns in plants. Front. Plant Sci. 2012, 3, 1–10. [Google Scholar] [CrossRef] [Green Version]
- Hodge, A. The plastic plant: Root responses to heterogeneous supplies of nutrients. New Phytol. 2004, 162, 9–24. [Google Scholar] [CrossRef]
- Meng, L.H.; Yang, J.; Guo, W.; Tian, B.; Chen, G.J.; Yang, Y.P.; Duan, Y.W. Differentiation in drought tolerance mirrors the geographic distributions of alpine plants on the Qinghai-Tibet Plateau and adjacent highlands. Sci. Rep. 2017, 7, 1–8. [Google Scholar] [CrossRef] [PubMed] [Green Version]
- Richter, S.; Kipfer, T.; Wohlgemuth, T.; Guerrero, C.C.; Ghazoul, J.; Moser, B. Phenotypic plasticity facilitates resistance to climate change in a highly variable environment. Oecologia 2012, 169, 269–279. [Google Scholar] [CrossRef] [PubMed]
- Poorter, H.A.; Nagel, O. The role of biomass allocation in the growth response of plants to different levels of light, CO2, nutrients and water: A quantitative review. Funct. Plant Biol. 2000, 27, 1191. [Google Scholar] [CrossRef] [Green Version]
- Mencuccini, M. The ecological significance of long-distance water transport: Short-term regulation, long-term acclimation and the hydraulic costs of stature across plant life forms. Plant Cell Environ. 2003, 26, 163–182. [Google Scholar] [CrossRef]
- Brunner, I.; Graf Pannatier, E.; Frey, B.; Rigling, A.; Landolt, W.; Zimmermann, S.; Dobbertin, M. Morphological and physiological responses of Scots pine fine roots to water supply in a dry climatic region in Switzerland. Tree Physiol. 2009, 29, 541–550. [Google Scholar] [CrossRef] [Green Version]
- Van de Vijver, C.A.D.M.; Boot, R.G.A.; Poorter, H.; Lambers, H. Fast-growing species from a fertile habitat and an inherently. Oecologia 1993, 96, 548–554. [Google Scholar] [CrossRef] [PubMed]
- Li, H.; Li, X.; Zhou, X. Trait means predict performance under water limitation better than plasticity for seedlings of Poaceae species on the eastern Tibetan Plateau. Ecol. Evol. 2020, 10, 2944–2955. [Google Scholar] [CrossRef]
- Molina-Montenegro, M.A.; Quiroz, C.L.; Torres-Díaz, C.; Atala, C. Functional differences in response to drought in the invasive Taraxacum officinale from native and introduced alpine habitat ranges. Plant Ecol. Divers. 2011, 4, 37–44. [Google Scholar] [CrossRef]
- Quiroz, C.L.; Choler, P.; Baptist, F.; González-Teuber, M.; Molina-Montenegro, M.A.; Cavieres, L.A. Alpine dandelions originated in the native and introduced range differ in their responses to environmental constraints. Ecol. Res. 2009, 24, 175–183. [Google Scholar] [CrossRef]
- Chin, A.R.O.; Sillett, S.C. Phenotypic plasticity of leaves enhances water-stress tolerance and promotes hydraulic conductivity in a tall conifer. Am. J. Bot. 2016, 103, 796–807. [Google Scholar] [CrossRef] [PubMed] [Green Version]
- Geange, S.R.; Briceño, V.F.; Aitken, N.C.; Ramirez-Valiente, J.A.; Holloway-Phillips, M.-M.; Nicotra, A.B. Phenotypic plasticity and water availability: Responses of alpine herb species along an elevation gradient. Clim. Chang. Responses 2017, 4, 1–12. [Google Scholar] [CrossRef] [Green Version]
- Atkin, O.K.; Lambers, H. The Causes of Inherently Slow Growth in Alpine Plants: An Analysis Based on the Underlying Carbon Economies of Alpine and Lowland Poa Species. Funct. Ecol. 1996, 10, 698–707. [Google Scholar] [CrossRef]
- Giorio, P.; Sorrentino, G.; D’Andria, R. Stomatal behaviour, leaf water status and photosynthetic response in field-grown olive trees under water deficit. Environ. Exp. Bot. 1999, 42, 95–104. [Google Scholar] [CrossRef]
- Zhang, H.; DeWald, L.E.; Kolb, T.E.; Koepke, D.E. Genetic Variation in Ecophysiological and Survival Responses to Drought in Two Native Grasses: Koeleria macrantha and Elymus elymoides. West. N. Am. Nat. 2011, 71, 25–32. [Google Scholar] [CrossRef]
- Neuner, G. Frost resistance in alpine woody plants. Front. Plant Sci. 2014, 5, 654. [Google Scholar] [CrossRef] [Green Version]
- Dudley, L.S.; Arroyo, M.T.K.; Fernández-Murillo, M.P. Physiological and fitness response of flowers to temperature and water augmentation in a high Andean geophyte. Environ. Exp. Bot. 2018, 150, 1–8. [Google Scholar] [CrossRef]
- Abrams, P.A. Monotonic or Unimodal Diversity-Productivity Gradients: What Does Competition Theory Predict? Ecology 1995, 76, 2019–2027. [Google Scholar] [CrossRef]
- Loranger, H.; Zotz, G.; Bader, M.Y. Early establishment of trees at the alpine treeline: Idiosyncratic species responses to temperature-moisture interactions. AoB Plants 2016, 8, plw053. [Google Scholar] [CrossRef] [Green Version]
- Franks, P.J.; Adams, M.A.; Amthor, J.S.; Barbour, M.M.; Berry, J.A.; Ellsworth, D.S.; Farquhar, G.D.; Ghannoum, O.; Lloyd, J.; McDowell, N.; et al. Sensitivity of plants to changing atmospheric CO2 concentration: From the geological past to the next century. New Phytol. 2013, 197, 1077–1094. [Google Scholar] [CrossRef]
- Zhao, Q.; Guo, J.; Shu, M.; Wang, P.; Hu, S. Impacts of drought and nitrogen enrichment on leaf nutrient resorption and root nutrient allocation in four Tibetan plant species. Sci. Total Environ. 2020, 723, 138106. [Google Scholar] [CrossRef]
- Fusaro, L.; Salvatori, E.; Manes, F. Effects of nitrogen deposition, drought and their interaction, on functional and structural traits of Fraxinus ornus L. and Quercus ilex L. Plant Biosyst. Int. J. Deal. All Asp. Plant Biol. 2017, 151, 174–189. [Google Scholar] [CrossRef]
- Wei, H.; Zhao, J.; Luo, T. The effect of pika grazing on Stipa purpurea is amplified by warming but alleviated by increased precipitation in an alpine grassland. Plant Ecol. 2019, 220, 371–381. [Google Scholar] [CrossRef]
- Phoenix, G.K.; Gwynn-Jones, D.; Callaghan, T.V.; Sleep, D.; Lee, J.A. Effects of global change on a sub-arctic heath: Effects of enhanced UV-B radiation and increased summer precipitation. J. Ecol. 2001, 89, 256–267. [Google Scholar] [CrossRef]
- Bachofen, C.; Wohlgemuth, T.; Moser, B. Biomass partitioning in a future dry and CO2 enriched climate: Shading aggravates drought effects in Scots pine but not European black pine seedlings. J. Appl. Ecol. 2019, 56, 866–879. [Google Scholar] [CrossRef] [Green Version]
Publisher’s Note: MDPI stays neutral with regard to jurisdictional claims in published maps and institutional affiliations. |
© 2021 by the authors. Licensee MDPI, Basel, Switzerland. This article is an open access article distributed under the terms and conditions of the Creative Commons Attribution (CC BY) license (https://creativecommons.org/licenses/by/4.0/).