
Exploring Spatiotemporal Variation of Carbon Storage Driven by Land Use Policy in the Yangtze River Delta Region


Abstract
:1. Introduction
2. Material and Methods
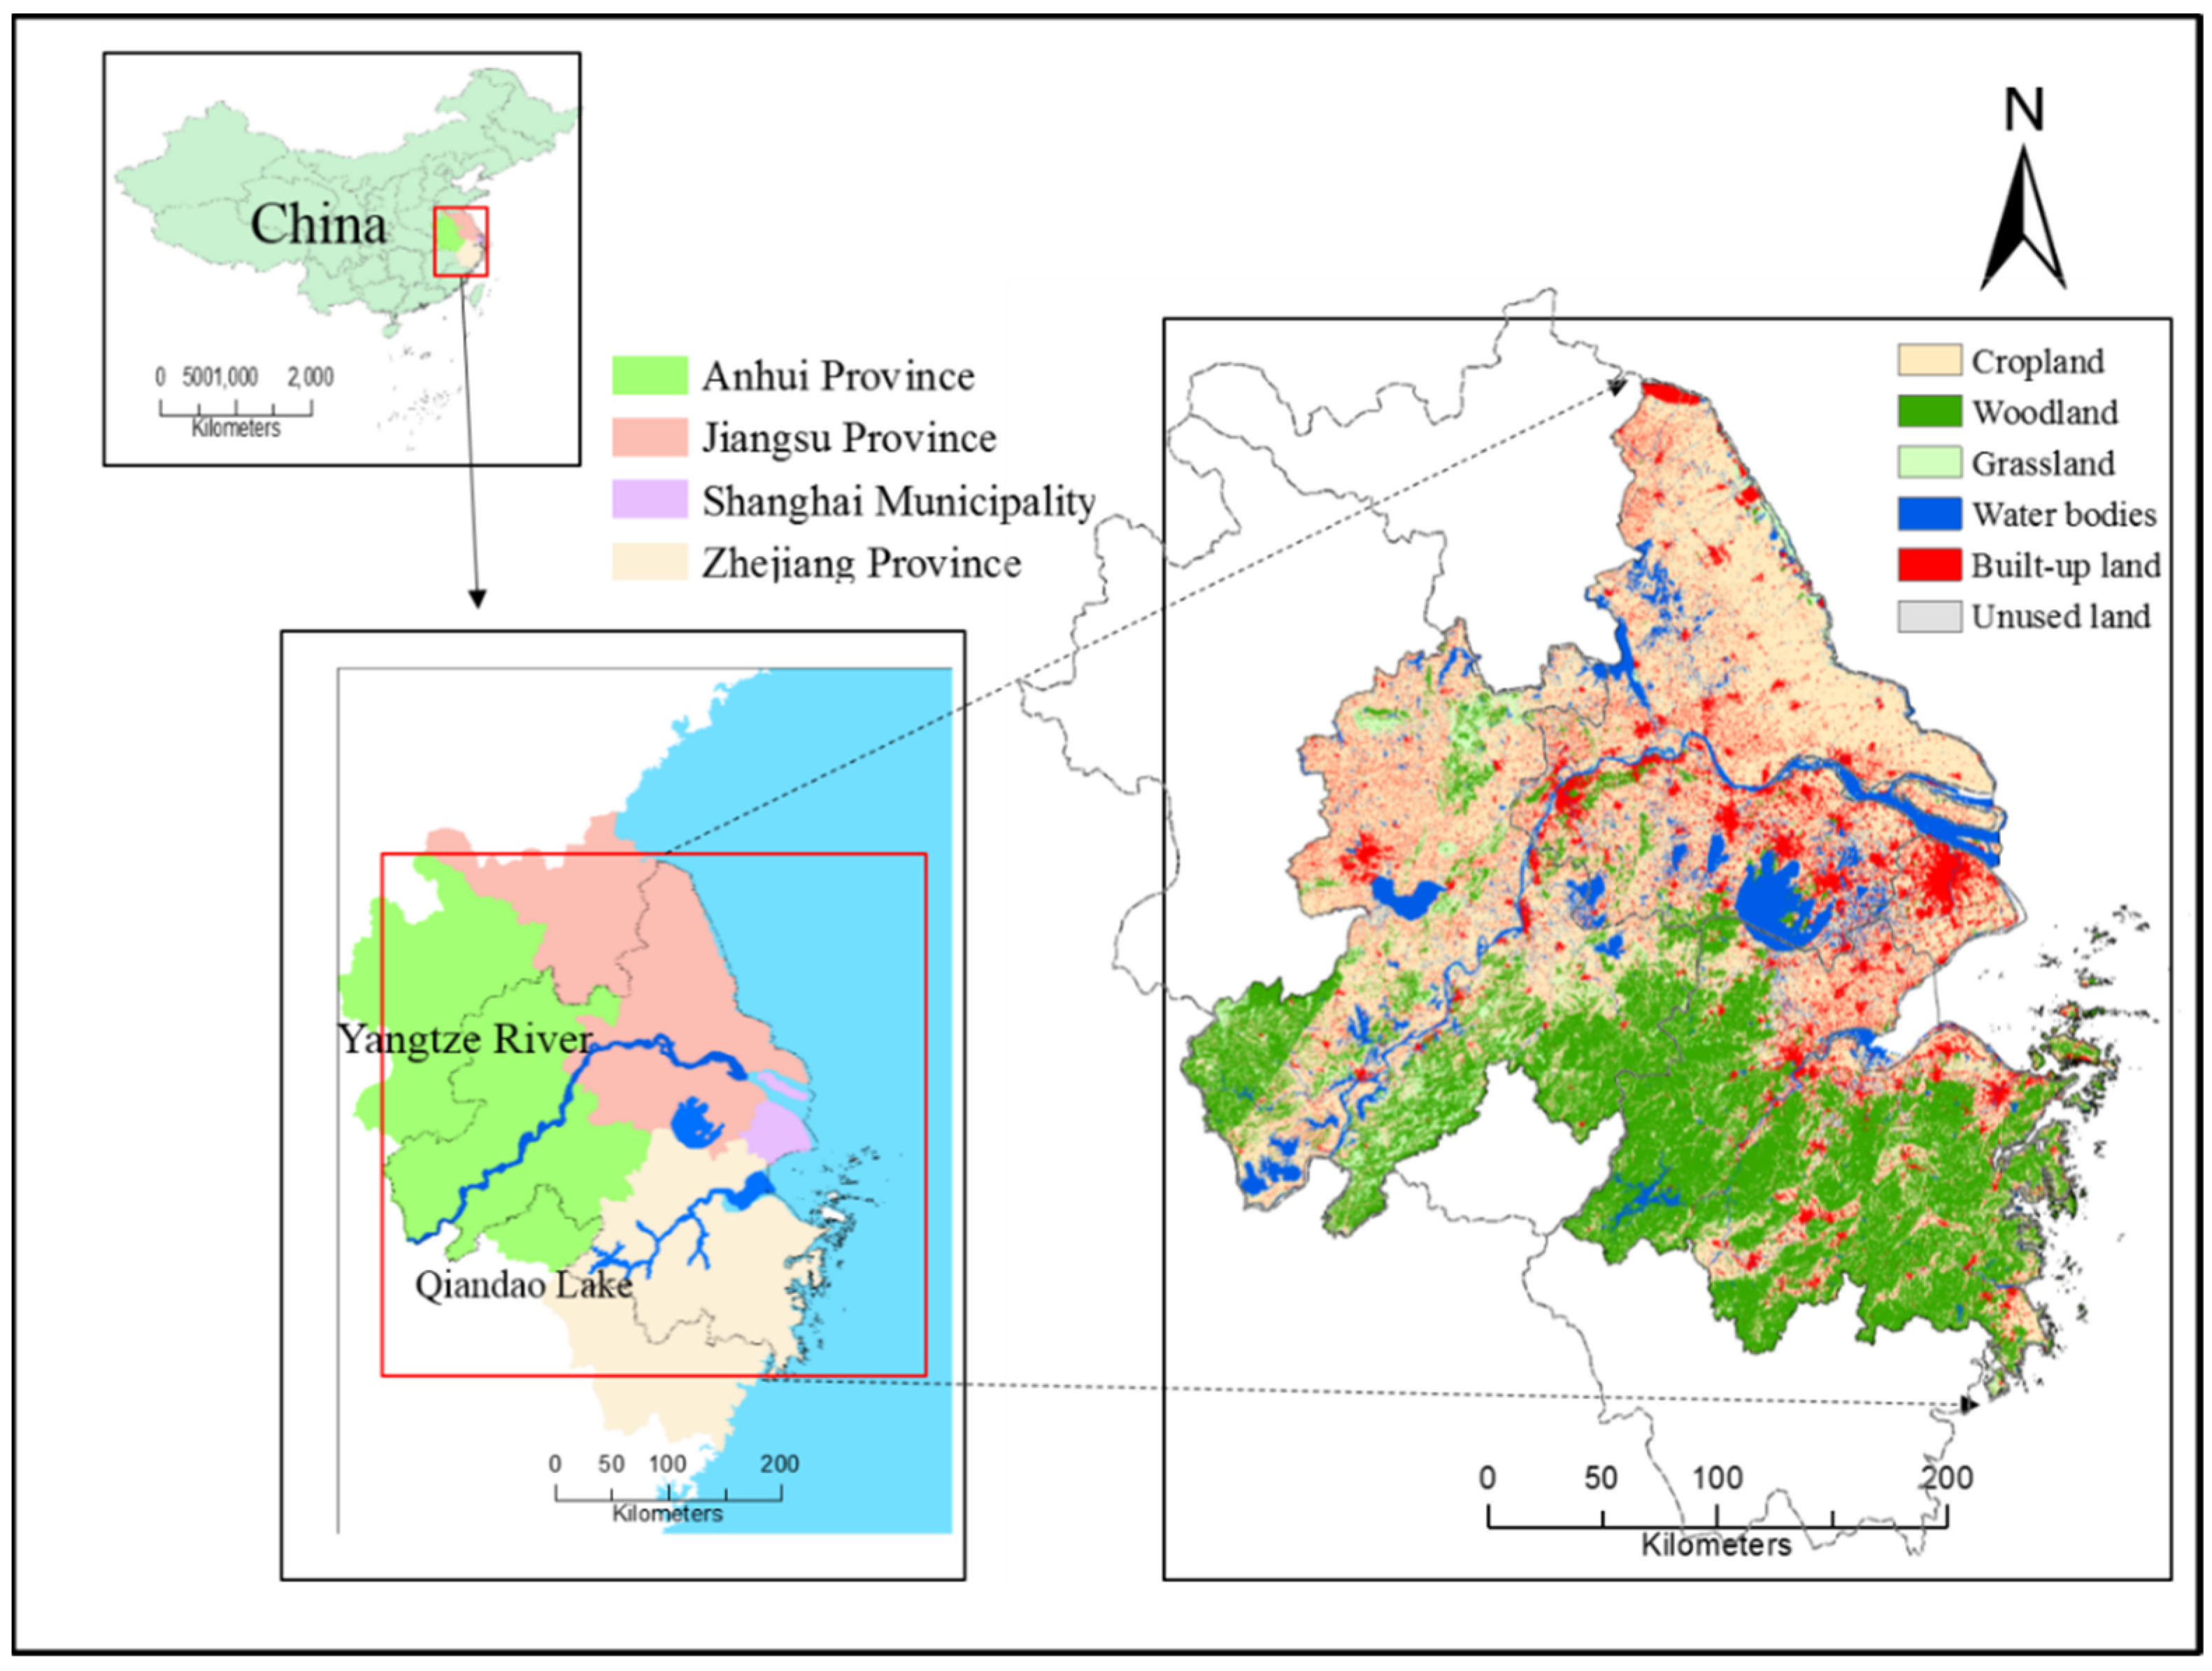
2.1. Study Area
2.2. Land Use and Land Cover
2.3. Carbon Storage and Sequestration
3. Results
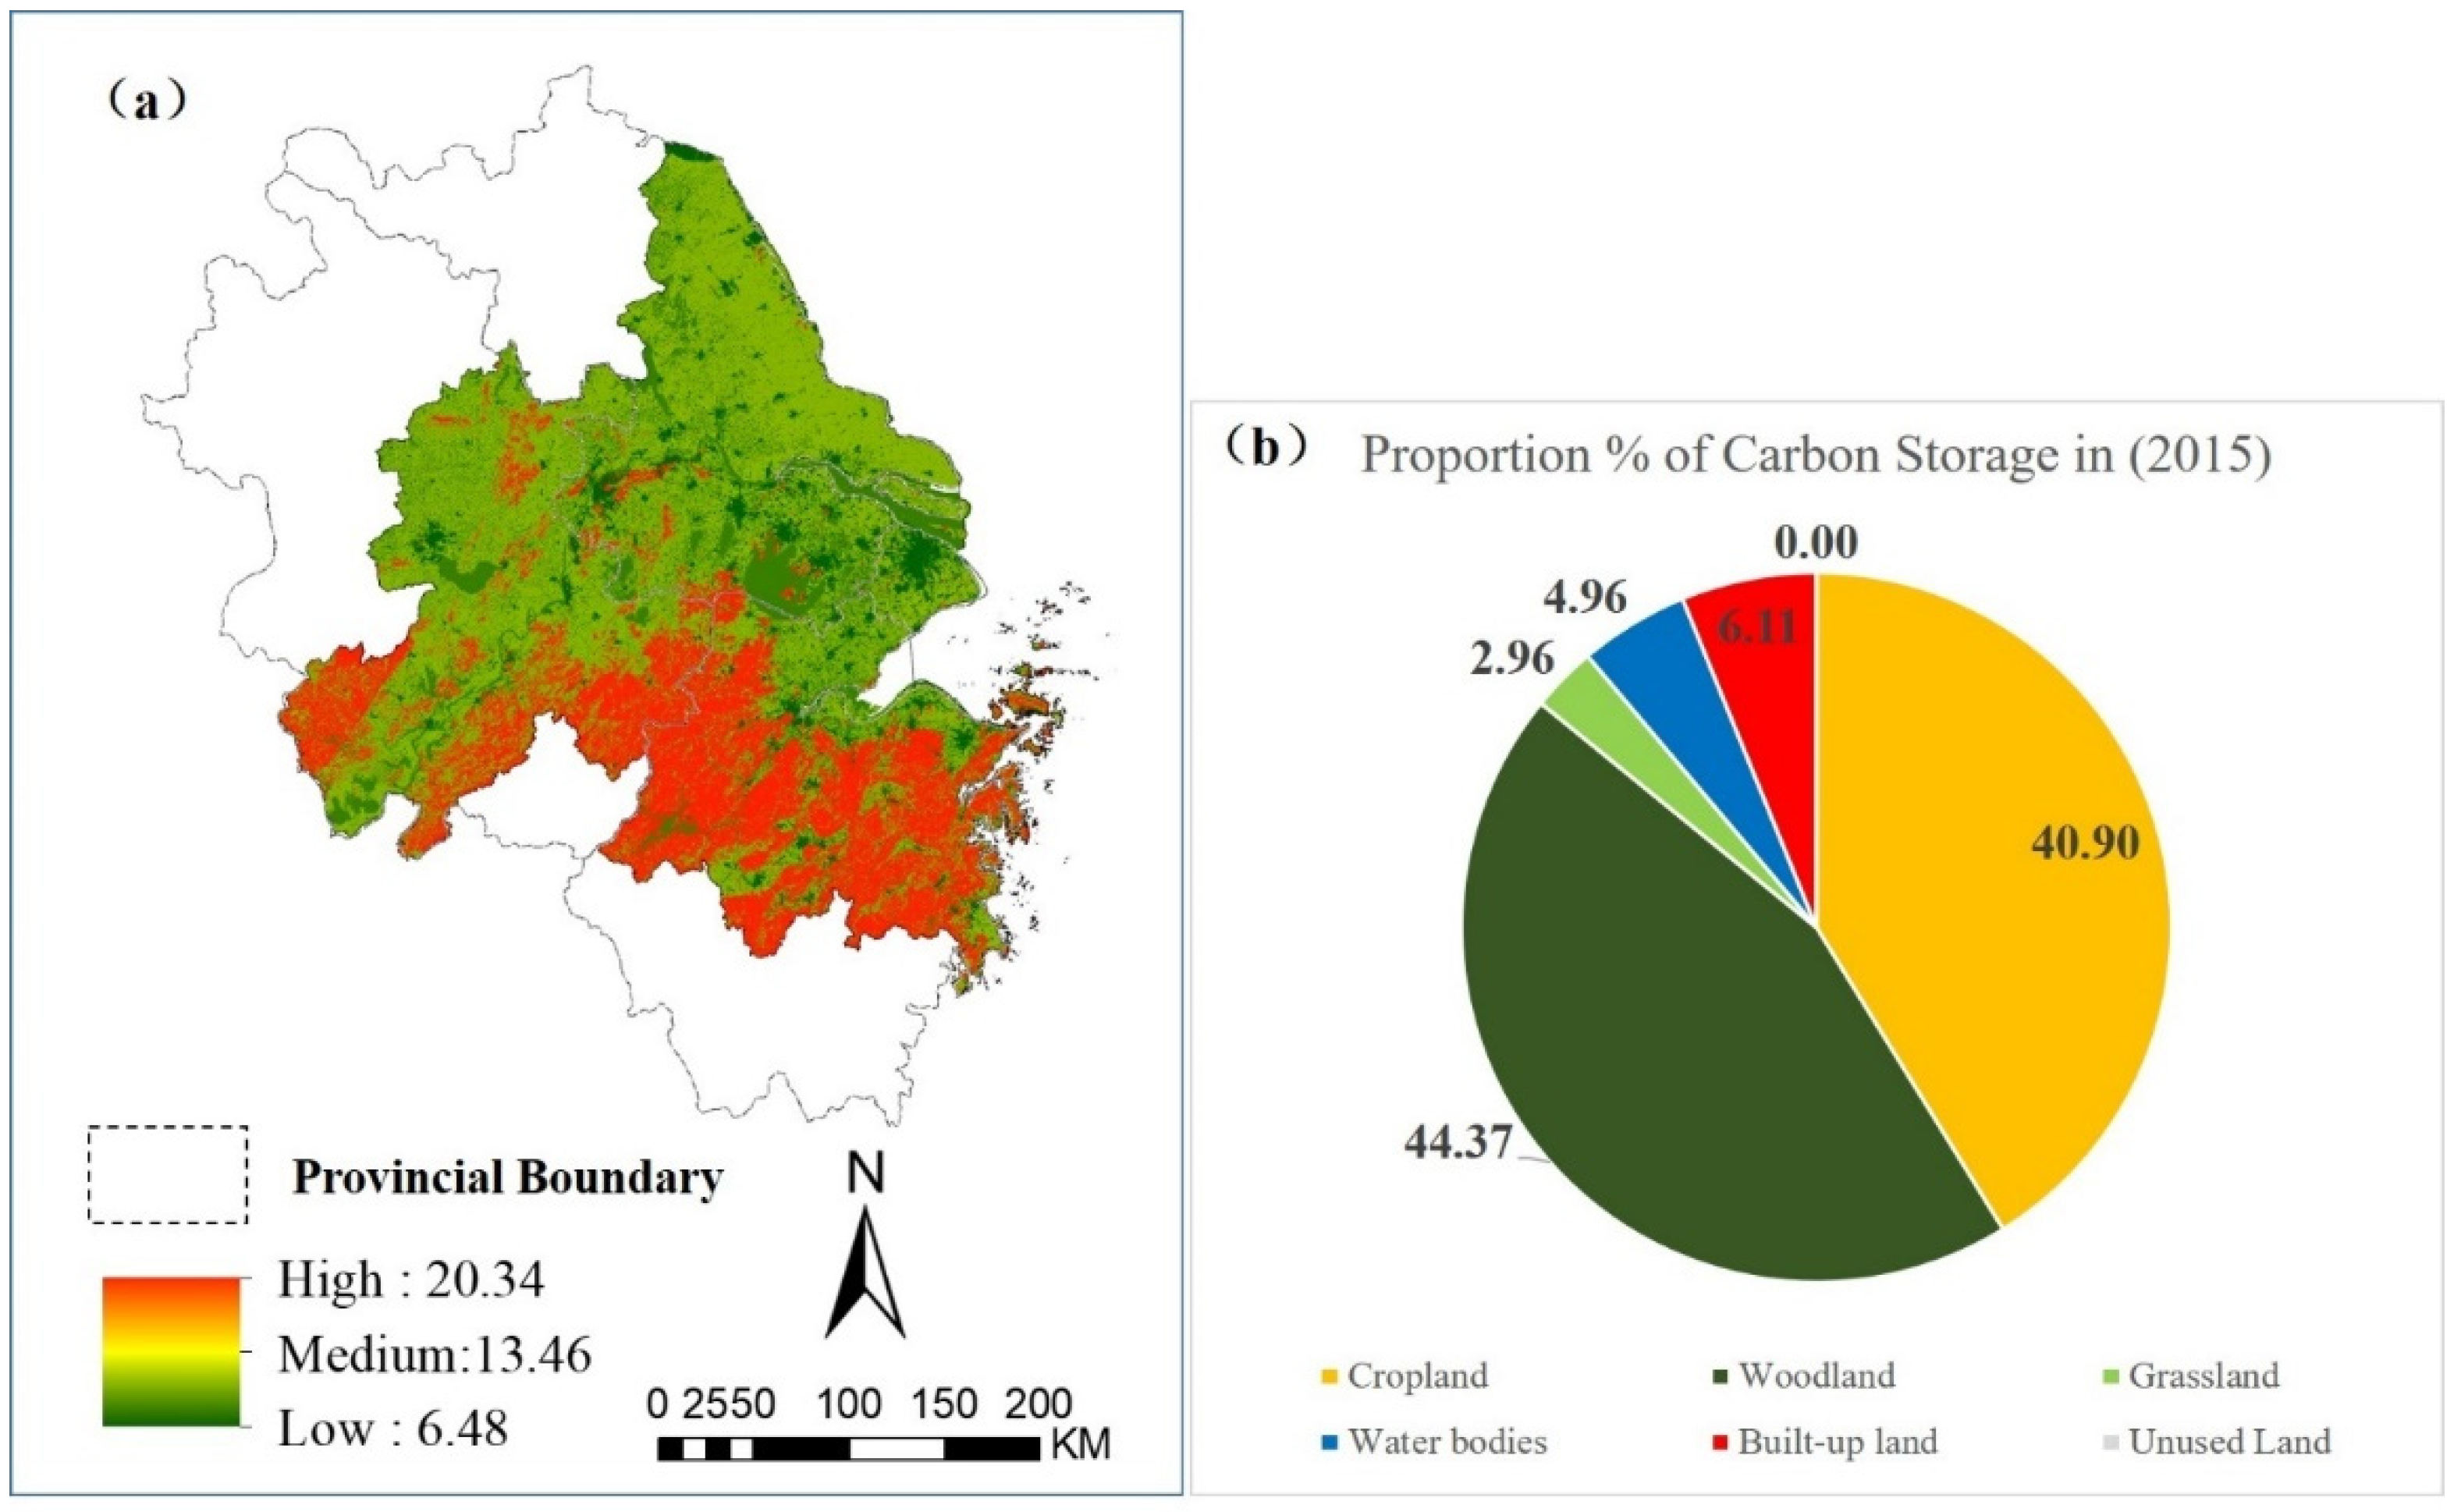
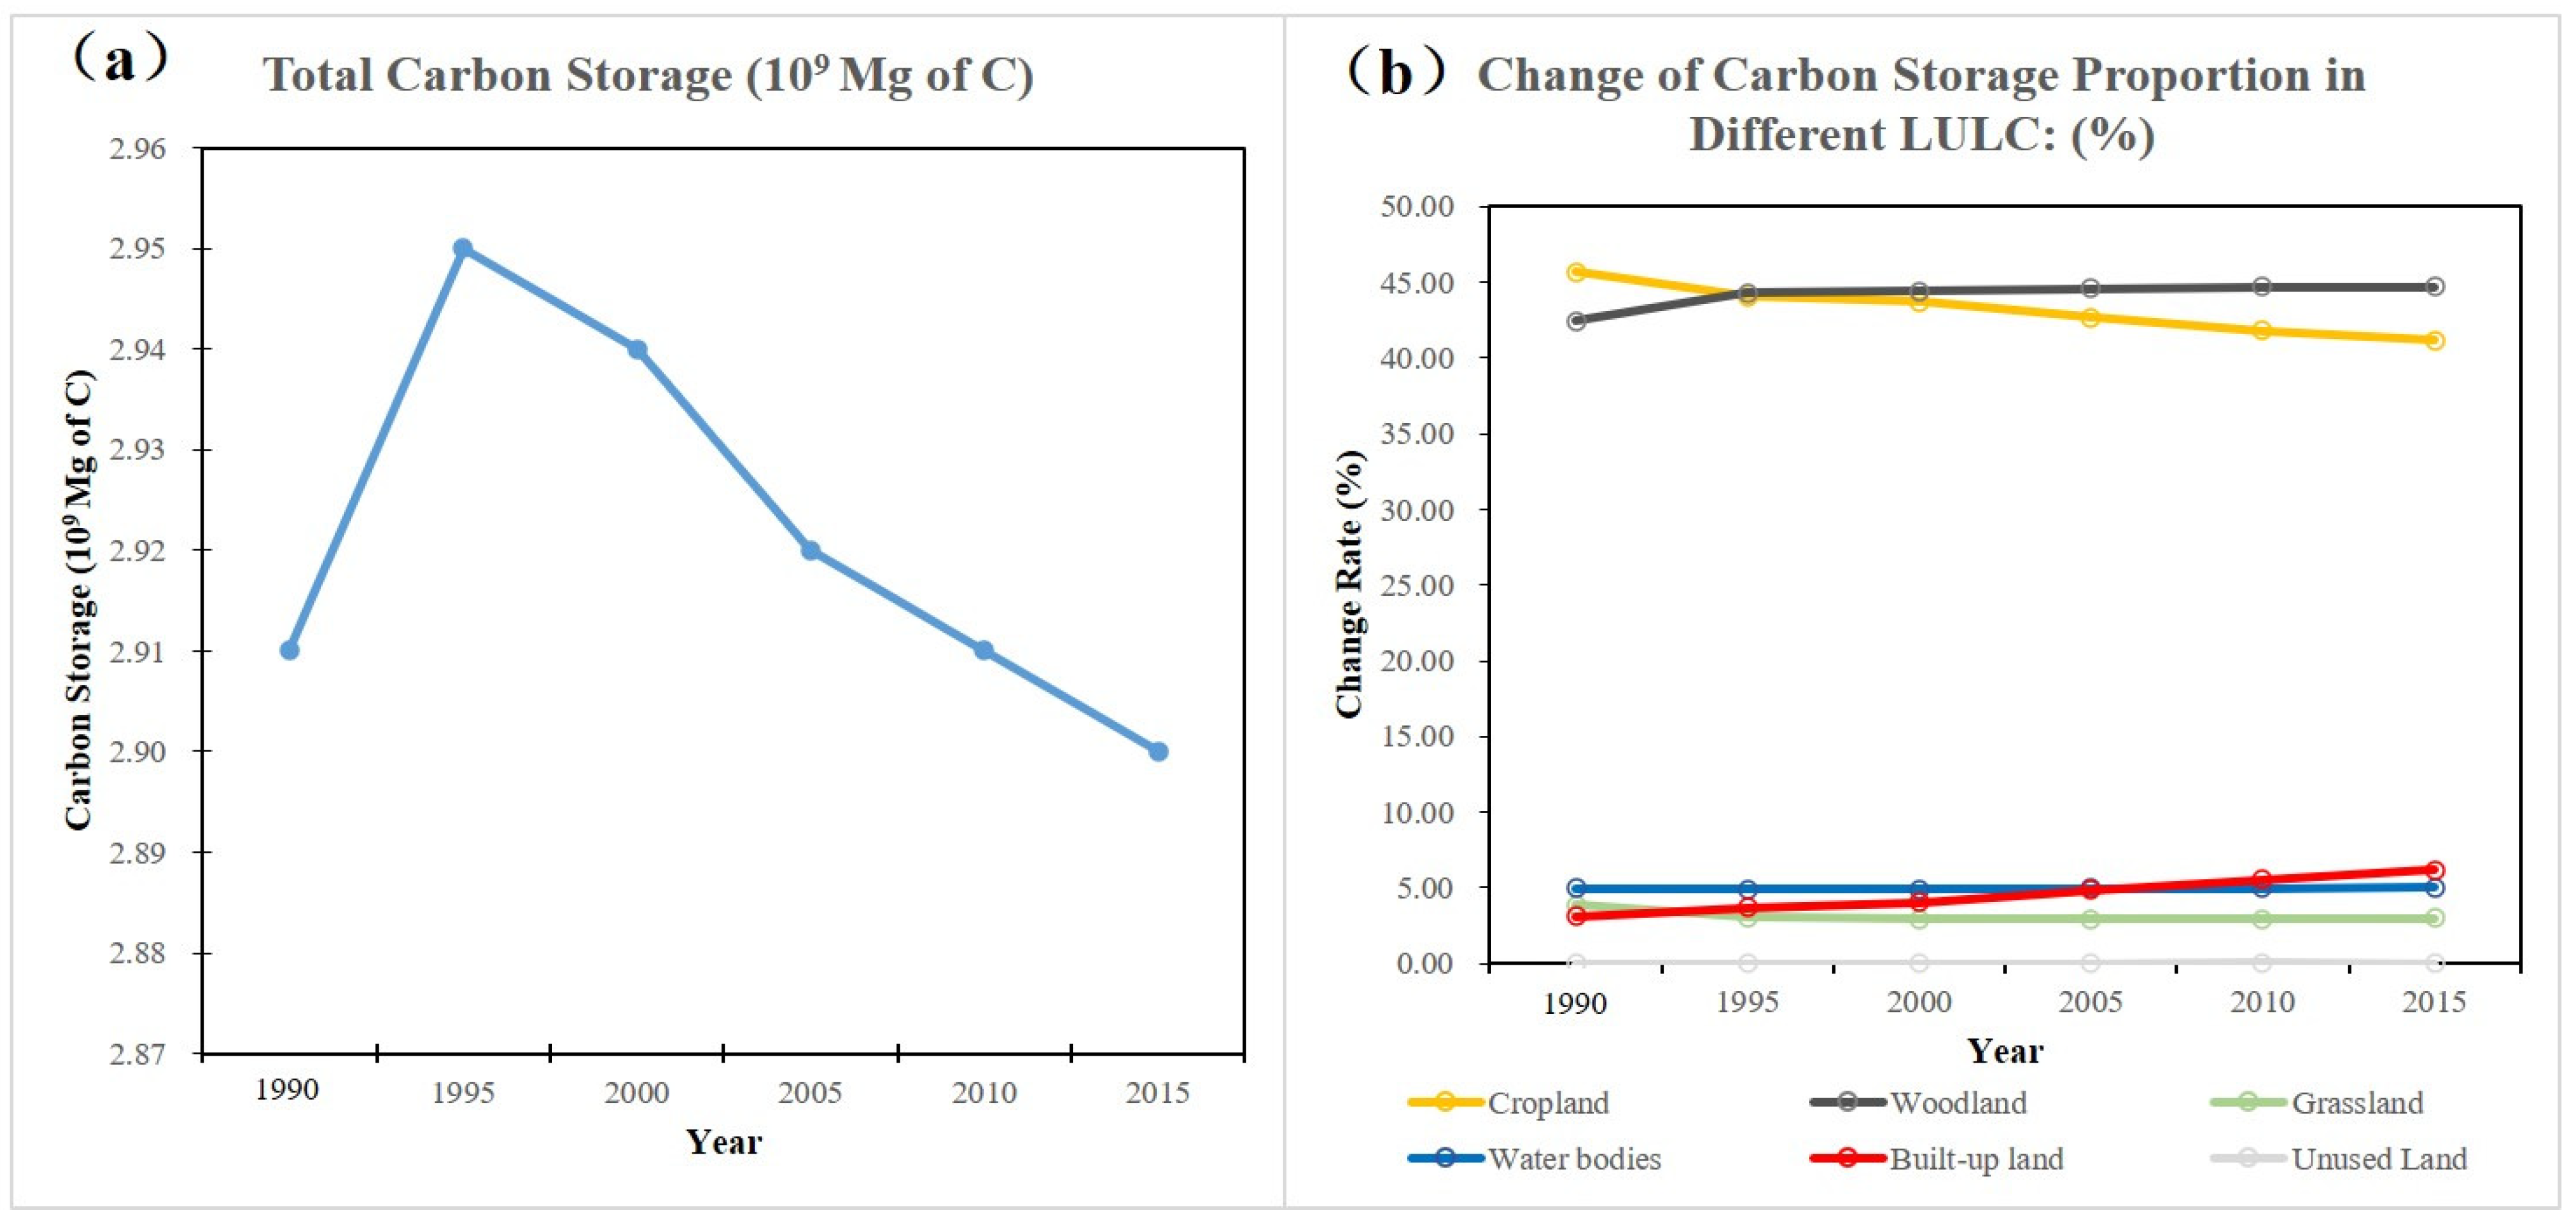
3.1. Status Quo of Carbon Storage and Carbon Sink
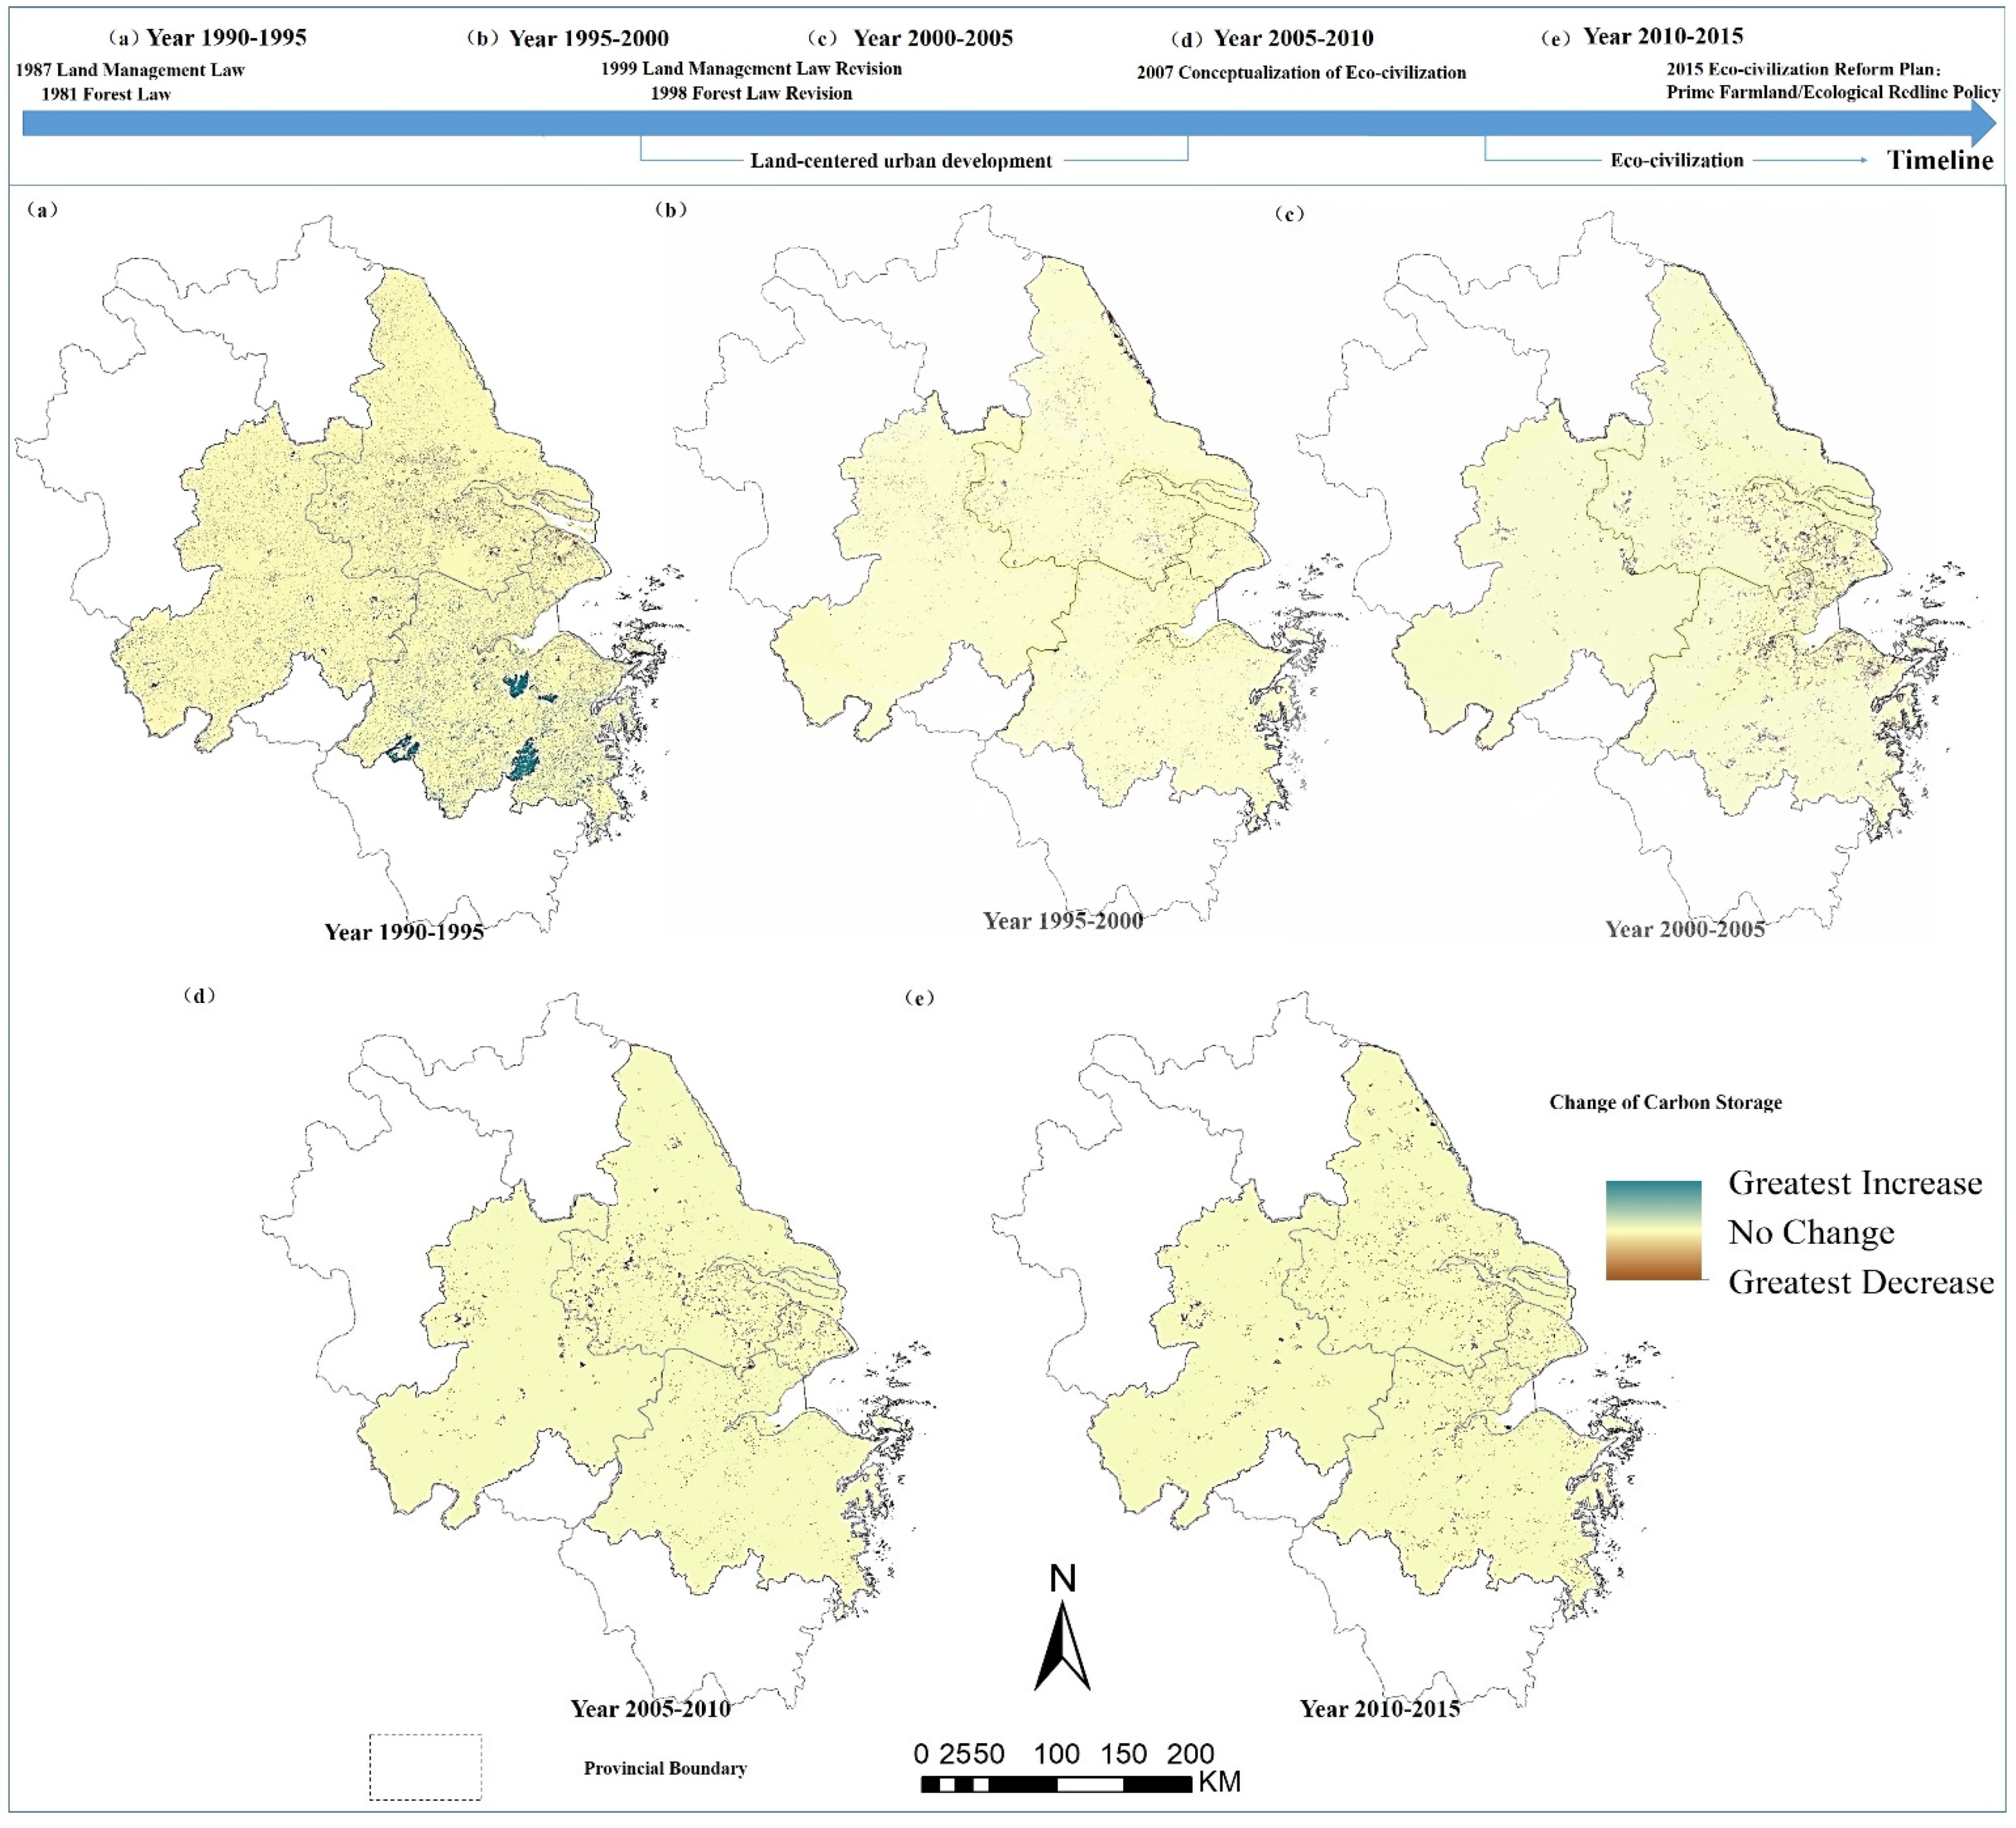
3.2. Spatiotemporal Dynamics of Carbon Storage and Sequestration
3.3. Land Use Policy Influences on LULC and Spatiotemporal Pattern of Carbon Storage
4. Discussion
5. Conclusions
Author Contributions
Funding
Institutional Review Board Statement
Informed Consent Statement
Data Availability Statement
Acknowledgments
Conflicts of Interest
References
- Han, J.; Meng, X.; Zhou, X.; Yi, B.; Liu, M.; Xiang, W.-N. A long-term analysis of urbanization process, landscape change, and carbon sources and sinks: A case study in China’s Yangtze River Delta region. J. Clean. Prod. 2017, 141, 1040–1050. [Google Scholar] [CrossRef]
- Xu, X.; Tan, Y.; Chen, S.; Yang, G. Changing patterns and determinants of natural capital in the Yangtze River Delta of China 2000–2010. Sci. Total Environ. 2014, 466, 326–337. [Google Scholar]
- Li, C.; Zhao, J.; Nguyen Xuan, T.; Xi, Y. Assessment of the Effects of Urban Expansion on Terrestrial Carbon Storage: A Case Study in Xuzhou City, China. Sustainability 2018, 10, 647. [Google Scholar] [CrossRef] [Green Version]
- He, C.; Zhang, D.; Huang, Q.; Zhao, Y. Assessing the potential impacts of urban expansion on regional carbon storage by linking the LUSD-urban and InVEST models. Environ. Model. Softw. 2016, 75, 44–58. [Google Scholar] [CrossRef]
- Nelson, E.; Sander, H.; Hawthorne, P.; Conte, M.; Ennaanay, D.; Wolny, S.; Manson, S.; Polasky, S. Projecting Global Land-Use Change and Its Effect on Ecosystem Service Provision and Biodiversity with Simple Models. PLoS ONE 2010, 5, e14327. [Google Scholar] [CrossRef] [PubMed] [Green Version]
- Xu, Z.; Fan, W.; Wei, H.; Zhang, P.; Ren, J.; Gao, Z.; Ulgiati, S.; Kong, W.; Dong, X. Evaluation and simulation of the impact of land use change on ecosystem services based on a carbon flow model: A case study of the Manas River Basin of Xinjiang, China. Sci. Total Environ. 2019, 652, 117–133. [Google Scholar] [CrossRef] [PubMed]
- Deng, X.; Li, Z.; Gibson, J. A review on trade-off analysis of ecosystem services for sustainable land-use management. J. Geogr. Sci. 2016, 26, 953–968. [Google Scholar] [CrossRef] [Green Version]
- Zhang, F.; Zhan, J.; Zhang, Q.; Yao, L.; Liu, W. Impacts of land use/cover change on terrestrial carbon stocks in Uganda. Phys. Chem. Earth 2017, 101, 195–203. [Google Scholar] [CrossRef]
- Chen, D.; Deng, X.; Jin, G.; Samie, A.; Li, Z. Land-use-change induced dynamics of carbon stocks of the terrestrial ecosystem in Pakistan. Phys. Chem. Earth 2017, 101, 13–20. [Google Scholar] [CrossRef]
- Wang, J.; Zhou, W.; Pickett, S.T.A.; Yu, W.; Li, W. A multiscale analysis of urbanization effects on ecosystem services supply in an urban megaregion. Sci. Total Environ. 2019, 662, 824–833. [Google Scholar] [CrossRef]
- Zhang, Z.; Peng, J.; Xu, Z.; Wang, X.; Meersmans, J. Ecosystem services supply and demand response to urbanization: A case study of the Pearl River Delta, China. Ecosyst. Serv. 2021, 49, 101274. [Google Scholar] [CrossRef]
- Gao, J.; Wang, L. Embedding spatiotemporal changes in carbon storage into urban agglomeration ecosystem management—A case study of the Yangtze River Delta, China. J. Clean. Prod. 2019, 237, 117764. [Google Scholar] [CrossRef]
- Lai, L.; Huang, X.; Yang, H.; Chuai, X.; Zhang, M.; Zhong, T.; Chen, Z.; Chen, Y.; Wang, X.; Thompson, J.R. Carbon emissions from land-use change and management in China between 1990 and 2010. Sci. Adv. 2016, 2, e1601063. [Google Scholar] [CrossRef] [Green Version]
- Xiang, H.; Jia, M.; Wang, Z.; Li, L.; Mao, D.; Zhang, D.; Cui, G.; Zhu, W. Impacts of Land Cover Changes on Ecosystem Carbon Stocks Over the Transboundary Tumen River Basin in Northeast Asia. Chin. Geogr. Sci. 2018, 28, 973–985. [Google Scholar] [CrossRef] [Green Version]
- Li, Z.; Zhong, J.; Sun, Z.; Yang, W. Spatial Pattern of Carbon Sequestration and Urban Sustainability: Analysis of Land-Use and Carbon Emission in Guang’an, China. Sustainability 2017, 9, 1951. [Google Scholar] [CrossRef] [Green Version]
- Islam, M.; Deb, G.P.; Rahman, M. Forest fragmentation reduced carbon storage in a moist tropical forest in Bangladesh: Implications for policy development. Land Use Policy 2017, 65, 15–25. [Google Scholar] [CrossRef]
- Leh, M.D.K.; Matlock, M.D.; Cummings, E.C.; Nalley, L.L. Quantifying and mapping multiple ecosystem services change in West Africa. Agric. Ecosyst. Environ. 2013, 165, 6–18. [Google Scholar] [CrossRef]
- Polasky, S.; Nelson, E.; Pennington, D.; Johnson, K.A. The Impact of Land-Use Change on Ecosystem Services, Biodiversity and Returns to Landowners: A Case Study in the State of Minnesota. Environ. Resour. Econ. 2011, 48, 219–242. [Google Scholar] [CrossRef]
- Cai, W.; Gibbs, D.; Zhang, L.; Ferrier, G.; Cai, Y. Identifying hotspots and management of critical ecosystem services in rapidly urbanizing Yangtze River Delta Region, China. J. Environ. Manag. 2017, 191, 258–267. [Google Scholar] [CrossRef]
- Haas, J.; Ban, Y. Urban growth and environmental impacts in Jing-Jin-Ji, the Yangtze, River Delta and the Pearl River Delta. Int. J. Appl. Earth Obs. Geoinf. 2014, 30, 42–55. [Google Scholar] [CrossRef]
- Dong, X.; You, M.; Wang, Q. Demarcating method of prime farmland based on land evaluation. Trans. Chin. Soc. Agric. Eng. 2011, 27, 336–339. [Google Scholar]
- Liu, Y.; Fang, F.; Li, Y. Key issues of land use in China and implications for policy making. Land Use Policy 2014, 40, 6–12. [Google Scholar] [CrossRef]
- Qian, F.; Wang, Q.; Bian, Z.; Dong, X. Discussion about the permanent basic farmland planning and protection. Chin. J. Agric. Resour. Reg. Plan. 2013, 34, 22–27. [Google Scholar]
- Bai, Y.; Wong, C.P.; Jiang, B.; Hughes, A.C.; Wang, M.; Wang, Q. Developing China’s Ecological Redline Policy using ecosystem services assessments for land use planning. Nat. Commun. 2018, 9, 3034. [Google Scholar]
- DPYRDUA. Development Plan of Yangtze River Delta Urban Agglomeration (2016–2030). China’s State Council and the National Development and Reform Commission (NDRC). 2016. Available online: https://Wenk.Baidu.Com/View/539ab63a4afe04a1b171dea8.Html (accessed on 6 June 2019).
- Hamel, P.; Chaplin-Kramer, R.; Sim, S.; Mueller, C. A new approach to modeling the sediment retention service (InVEST 3.0): Case study of the Cape Fear catchment, North Carolina, USA. Sci. Total Environ. 2015, 524, 166–177. [Google Scholar] [CrossRef]
- Liang, Y.; Liu, L.; Huang, J. Integrating the SD-CLUE-S and InVEST models into assessment of oasis carbon storage in northwestern China. PLoS ONE 2017, 12, e0172494. [Google Scholar] [CrossRef]
- Jiang, W.; Deng, Y.; Tang, Z.; Lei, X.; Chen, Z. Modelling the potential impacts of urban ecosystem changes on carbon storage under different scenarios by linking the CLUE-S and the InVEST models. Ecol. Model. 2017, 345, 30–40. [Google Scholar] [CrossRef]
- Rashidi, K.; Stadelmann, M.; Patt, A. Valuing co-benefits to make low-carbon investments in cities bankable: The case of waste and transportation projects. Sustain. Cities Soc. 2017, 34, 69–78. [Google Scholar] [CrossRef]
- Sun, X.; Lu, Z.; Li, F.; Crittenden, J.C. Analyzing spatio-temporal changes and trade-offs to support the supply of multiple ecosystem services in Beijing, China. Ecol. Indic. 2018, 94, 117–129. [Google Scholar] [CrossRef]
- Zhang, D.; Huang, Q.; He, C.; Wu, J. Impacts of urban expansion on ecosystem services in the Beijing-Tianjin-Hebei urban agglomeration, China: A scenario analysis based on the Shared Socioeconomic Pathways. Resour. Conserv. Recycl. 2017, 125, 115–130. [Google Scholar] [CrossRef]
- Guo, Z.; Hu, H.; Li, P.; Li, N.; Fang, J. Spatio-temporal changes in biomass carbon sinks in China’s forests from 1977 to 2008. Sci. China-Life Sci. 2013, 56, 661–671. [Google Scholar] [CrossRef] [Green Version]
- Fang, J.; Yang, Y.; Ma, W.; Mohammat, A.; Shen, H. Ecosystem carbon stocks and their changes in China’s grasslands. Sci. China-Life Sci. 2010, 53, 757–765. [Google Scholar] [CrossRef]
- Liu, J.; Wang, C.; Chen, J.; Liu, M.; Zhuang, D. Storages of Soil Organic Carbon and Nitrogen and Land Use Changes in China: 1990–2000. Acta Geogr. Sin. 2004, 59, 483–496. [Google Scholar]
- Wang, L.; Wong, C.; Duan, X. Urban growth and spatial restructuring patterns: The case of Yangtze River Delta Region, China. Environ. Plan. B Plan. Des. 2016, 43, 515–539. [Google Scholar] [CrossRef]
- Yu, W.; Zhou, W. Spatial pattern of urban change in two Chinese megaregions: Contrasting responses to national policy and economic mode. Sci. Total Environ. 2018, 634, 1362–1371. [Google Scholar] [CrossRef] [PubMed]
- Wang, Z.; Fang, C.; Zhang, X. Spatial expansion and potential of construction land use in the Yangtze River Delta. J. Geogr. Sci. 2015, 25, 851–864. [Google Scholar] [CrossRef] [Green Version]
- Tian, G.; Jiang, J.; Yang, Z.; Zhang, Y. The urban growth, size distribution and spatio-temporal dynamic pattern of the Yangtze River Delta megalopolitan region, China. Ecol. Model. 2011, 222, 865–878. [Google Scholar] [CrossRef]
- Cai, W.; Zhu, Q.; Chen, M.; Cai, Y. Spatiotemporal Change and the Natural–Human Driving Processes of a Megacity’s Coastal Blue Carbon Storage. Int. J. Environ. Res. Public Health 2021, 18, 8879. [Google Scholar] [CrossRef] [PubMed]


| LULC | Woodland | Grassland | Surface Waters | Cropland | Built-Up Land | Undeveloped Land |
|---|---|---|---|---|---|---|
| above | 26.9 | 17.7 | 8.2 | 15.8 | 1.2 | 11.3 |
| below | 59.2 | 44.2 | 39.5 | 40.3 | 27.6 | 32.4 |
| soil | 122.3 | 49.9 | 40.6 | 54.2 | 43.2 | 53.8 |
| dead | 17.6 | 1 | 0 | 5 | 0 | 0 |
| density | 226 | 112.8 | 88.3 | 115.3 | 72 | 97.5 |
| Land Cover. | Cropland | Woodland | Grassland | Water Bodies | Built-Up Land | Unused Land | Total |
|---|---|---|---|---|---|---|---|
| Cropland | 108,718.05 | 2125.24 | 148.48 | 630.60 | 3617.00 | 2.84 | 115,242.21 |
| Woodland | 1310.42 | 52,732.62 | 447.53 | 65.69 | 67.19 | 4.50 | 54,627.96 |
| Grassland | 240.79 | 2,432.13 | 7243.86 | 53.38 | 15.00 | 0.45 | 9985.61 |
| Water bodies | 572.39 | 79.03 | 39.03 | 15,537.09 | 50.20 | 0.25 | 16,277.99 |
| Built-up land | 1258.34 | 66.23 | 8.73 | 42.18 | 11,276.71 | 0.26 | 12,652.44 |
| Unused land | 1.46 | 22.07 | 1.17 | 0.14 | 0.20 | 23.62 | 48.66 |
| Total | 112,101.46 | 57,457.32 | 7888.79 | 16,329.08 | 15,026.30 | 31.92 | 208,834.87 |
| Land Cover | Cropland | Woodland | Grassland | Water Bodies | Built-Up Land | Unused Land | Total |
|---|---|---|---|---|---|---|---|
| Cropland | 110,634.80 | 10.03 | 1.50 | 316.45 | 1178.13 | 0.98 | 112,141.89 |
| Woodland | 25.24 | 57,304.73 | 108.34 | 4.86 | 59.61 | 4.24 | 57,507.03 |
| Grassland | 95.45 | 115.57 | 7521.78 | 103.45 | 81.44 | 0.03 | 7917.71 |
| Water bodies | 25.34 | 0.55 | 4.58 | 17,550.05 | 18.83 | 0.00 | 17,599.35 |
| Built-up land | 24.00 | 0.99 | 0.10 | 2.04 | 15,015.07 | 0.01 | 15,042.22 |
| Unused land | 0.04 | 1.37 | 0.00 | 1.24 | 0.11 | 29.48 | 32.23 |
| Total | 110,804.86 | 57,433.26 | 7636.30 | 17,978.08 | 16,353.19 | 34.73 | 210,240.42 |
| Land Cover | Cropland | Woodland | Grassland | Water Bodies | Built-Up Land | Unused Land | Total |
|---|---|---|---|---|---|---|---|
| Cropland | 107,058.77 | 50.95 | 1.74 | 628.00 | 3064.35 | 0.77 | 110,804.57 |
| Woodland | 65.98 | 57,147.48 | 35.84 | 23.27 | 158.72 | 1.74 | 57,433.04 |
| Grassland | 44.46 | 25.95 | 7513.26 | 31.58 | 19.44 | 1.53 | 7636.22 |
| Water bodies | 209.69 | 8.24 | 17.31 | 17,645.56 | 97.00 | 0.00 | 17,977.81 |
| Built-up land | 36.10 | 2.06 | 0.07 | 10.90 | 16,304.02 | 0.01 | 16,353.15 |
| Unused land | 0.00 | 0.19 | 0.00 | 0.00 | 2.68 | 31.85 | 34.73 |
| Total | 107,414.99 | 57,234.86 | 7568.23 | 18,339.32 | 19,646.20 | 35.90 | 210,239.51 |
| Land Cover | Cropland | Woodland | Grassland | Water Bodies | Built-Up Land | Unused Land | Total |
|---|---|---|---|---|---|---|---|
| Cropland | 104,793.56 | 26.98 | 3.42 | 118.24 | 2472.85 | 0.01 | 107,415.06 |
| Woodland | 5.98 | 57,094.63 | 24.69 | 2.69 | 106.68 | 0.38 | 57,235.05 |
| Grassland | 0.44 | 0.71 | 7537.49 | 16.06 | 13.56 | 0.00 | 7568.26 |
| Water bodies | 10.36 | 0.64 | 1.02 | 18,271.06 | 56.56 | 0.00 | 18,339.64 |
| Built-up land | 18.57 | 1.15 | 0.05 | 2.35 | 19,624.25 | 0.00 | 19,646.37 |
| Unused land | 0.01 | 0.09 | 0.29 | 0.01 | 0.42 | 35.09 | 35.90 |
| Total | 104,828.92 | 57,124.20 | 7566.95 | 18,410.41 | 22,274.31 | 35.48 | 210,240.28 |
| Land Cover | Cropland | Woodland | Grassland | Water Bodies | Built-Up Land | Unused Land | Total |
|---|---|---|---|---|---|---|---|
| Cropland | 102,566.66 | 6.02 | 18.63 | 107.20 | 2119.65 | 10.64 | 104,828.80 |
| Woodland | 7.25 | 56,901.69 | 14.53 | 4.34 | 194.10 | 1.97 | 57,123.89 |
| Grassland | 28.06 | 0.52 | 7461.13 | 39.60 | 36.69 | 0.83 | 7566.84 |
| Water bodies | 89.32 | 0.51 | 93.86 | 18,061.99 | 152.49 | 12.08 | 18,410.24 |
| Built-up land | 128.49 | 2.82 | 18.09 | 17.72 | 22,105.87 | 1.35 | 22,274.35 |
| Unused land | 0.03 | 0.01 | 0.01 | 0.64 | 0.28 | 34.52 | 35.48 |
| Total | 102,819.82 | 56,911.57 | 7606.25 | 18,231.49 | 24,609.08 | 61.39 | 210,239.59 |
Publisher’s Note: MDPI stays neutral with regard to jurisdictional claims in published maps and institutional affiliations. |
© 2021 by the authors. Licensee MDPI, Basel, Switzerland. This article is an open access article distributed under the terms and conditions of the Creative Commons Attribution (CC BY) license (https://creativecommons.org/licenses/by/4.0/).
Share and Cite
Cai, W.; Peng, W. Exploring Spatiotemporal Variation of Carbon Storage Driven by Land Use Policy in the Yangtze River Delta Region. Land 2021, 10, 1120. https://doi.org/10.3390/land10111120
Cai W, Peng W. Exploring Spatiotemporal Variation of Carbon Storage Driven by Land Use Policy in the Yangtze River Delta Region. Land. 2021; 10(11):1120. https://doi.org/10.3390/land10111120
Chicago/Turabian StyleCai, Wenbo, and Wanting Peng. 2021. "Exploring Spatiotemporal Variation of Carbon Storage Driven by Land Use Policy in the Yangtze River Delta Region" Land 10, no. 11: 1120. https://doi.org/10.3390/land10111120
APA StyleCai, W., & Peng, W. (2021). Exploring Spatiotemporal Variation of Carbon Storage Driven by Land Use Policy in the Yangtze River Delta Region. Land, 10(11), 1120. https://doi.org/10.3390/land10111120