
Assessment and Estimation of the Spatial and Temporal Evolution of Landscape Patterns and Their Impact on Habitat Quality in Nanchang, China

Abstract
:1. Introduction
2. Materials and Methods
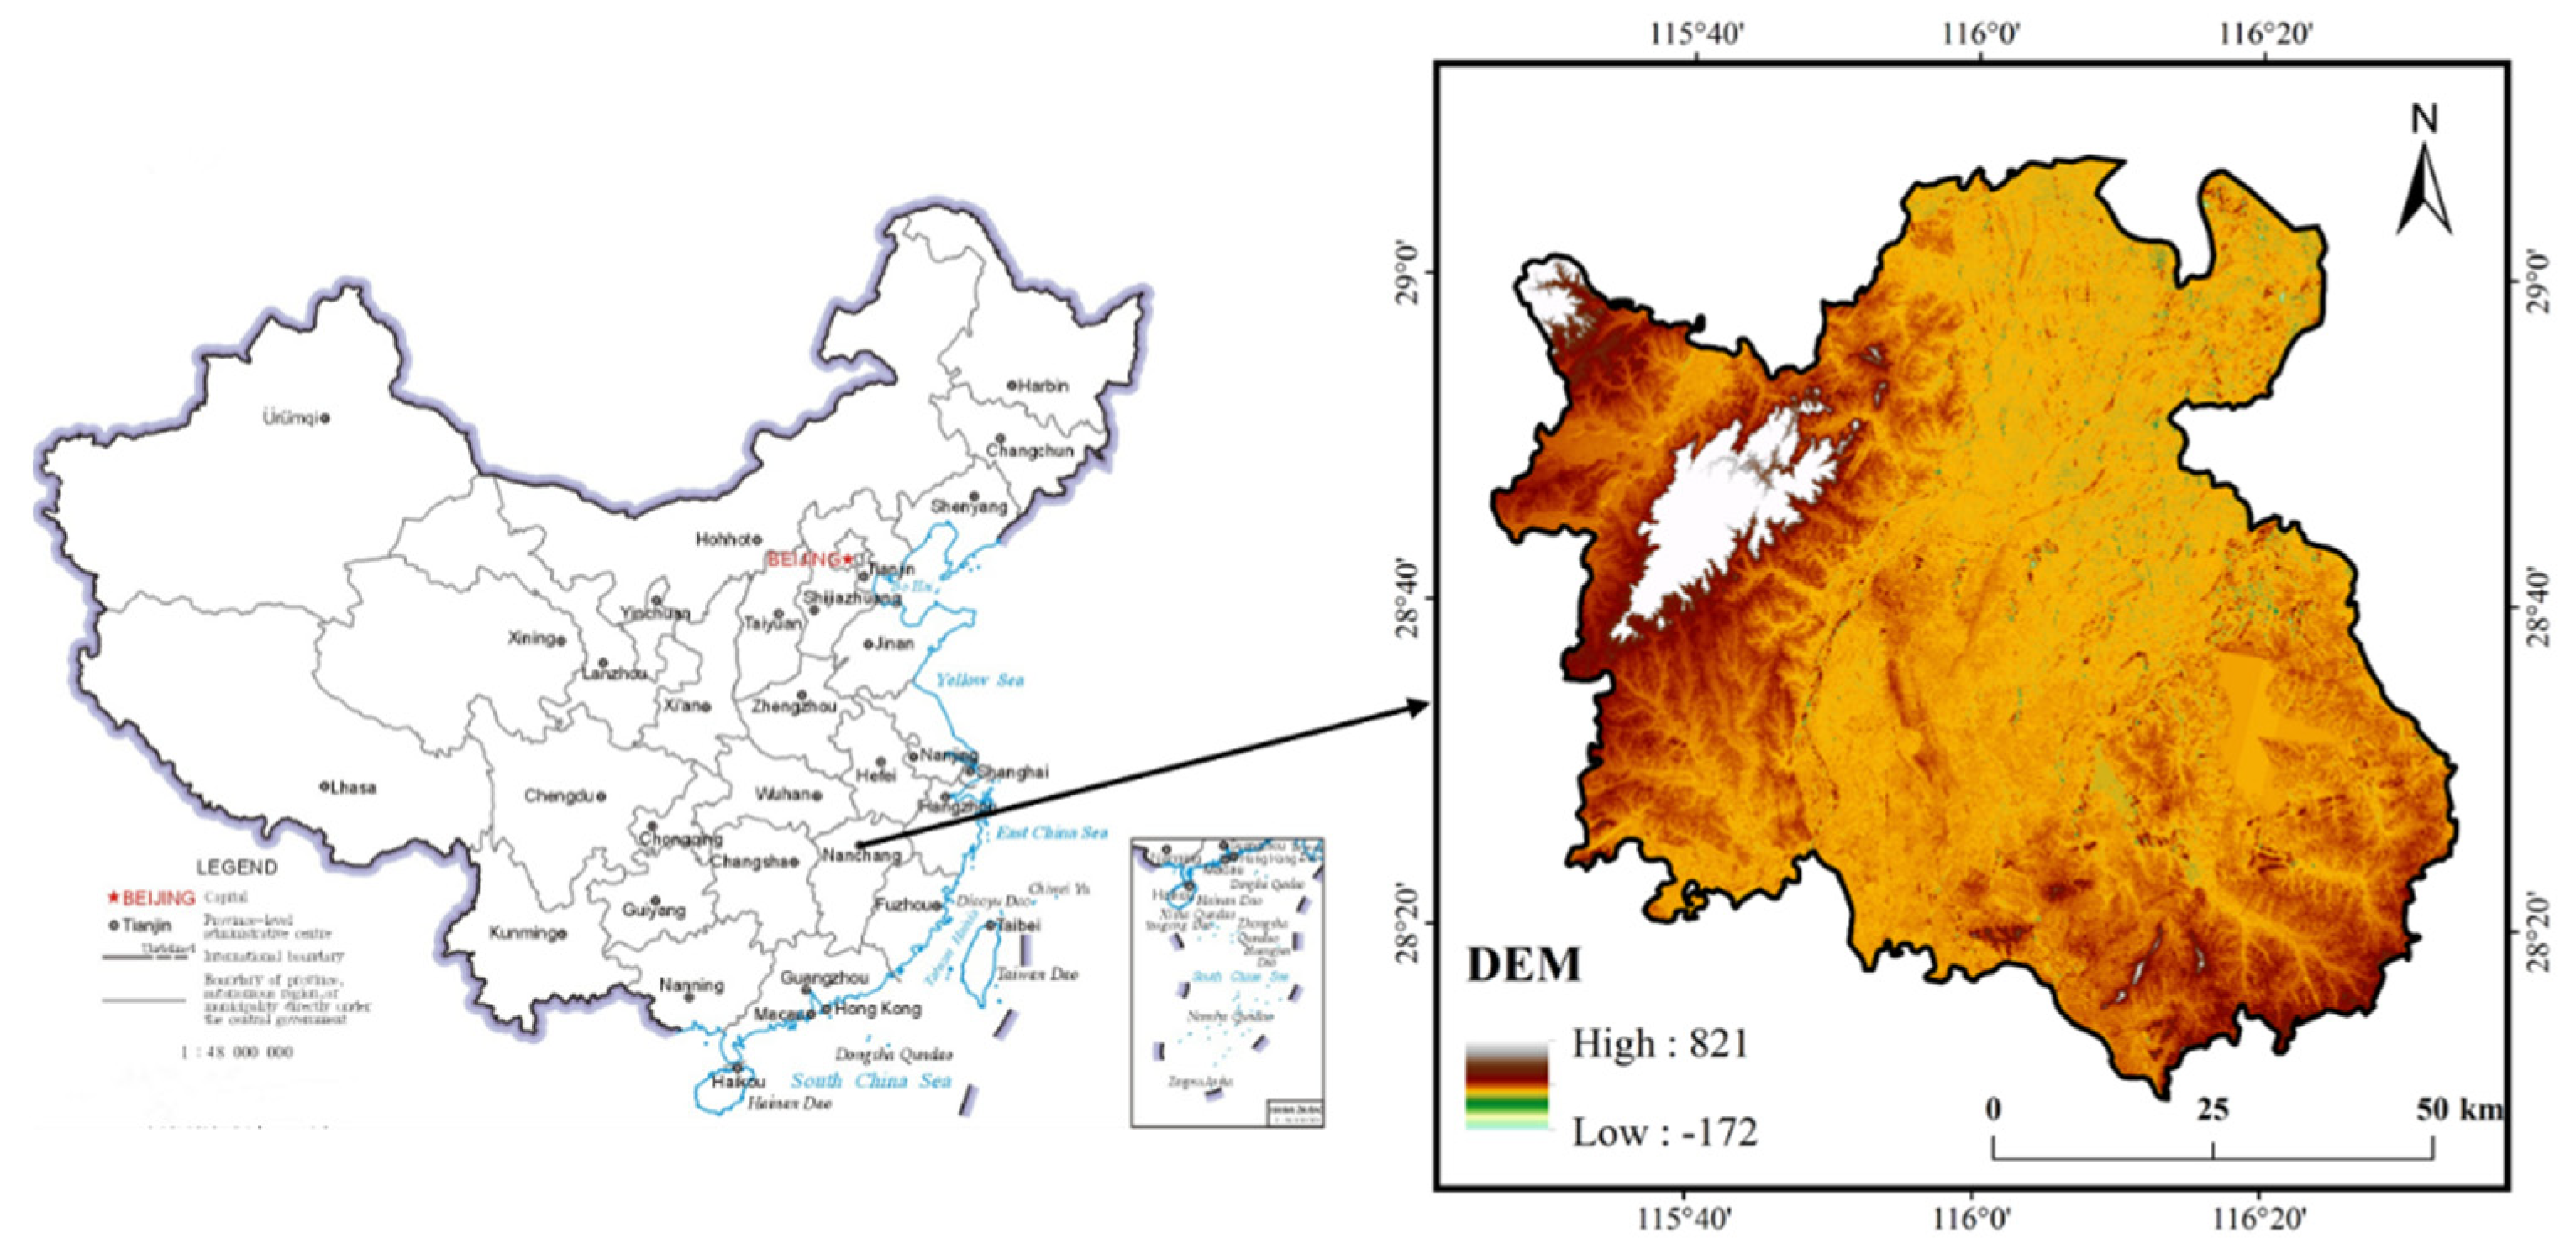
2.1. Study Area
2.2. Data Sources and Processing
2.3. Methodology
2.3.1. CA-Markov Model
2.3.2. FLUS Model
2.3.3. Establishment of Habitat Evaluative Indicators
- (1)
- Habitat Degradation Index
- (2)
- Habitat Rarity Index
- (3)
- Habitat Quality Index
- (4)
- Parameter requirement analysis of the InVEST model
3. Results
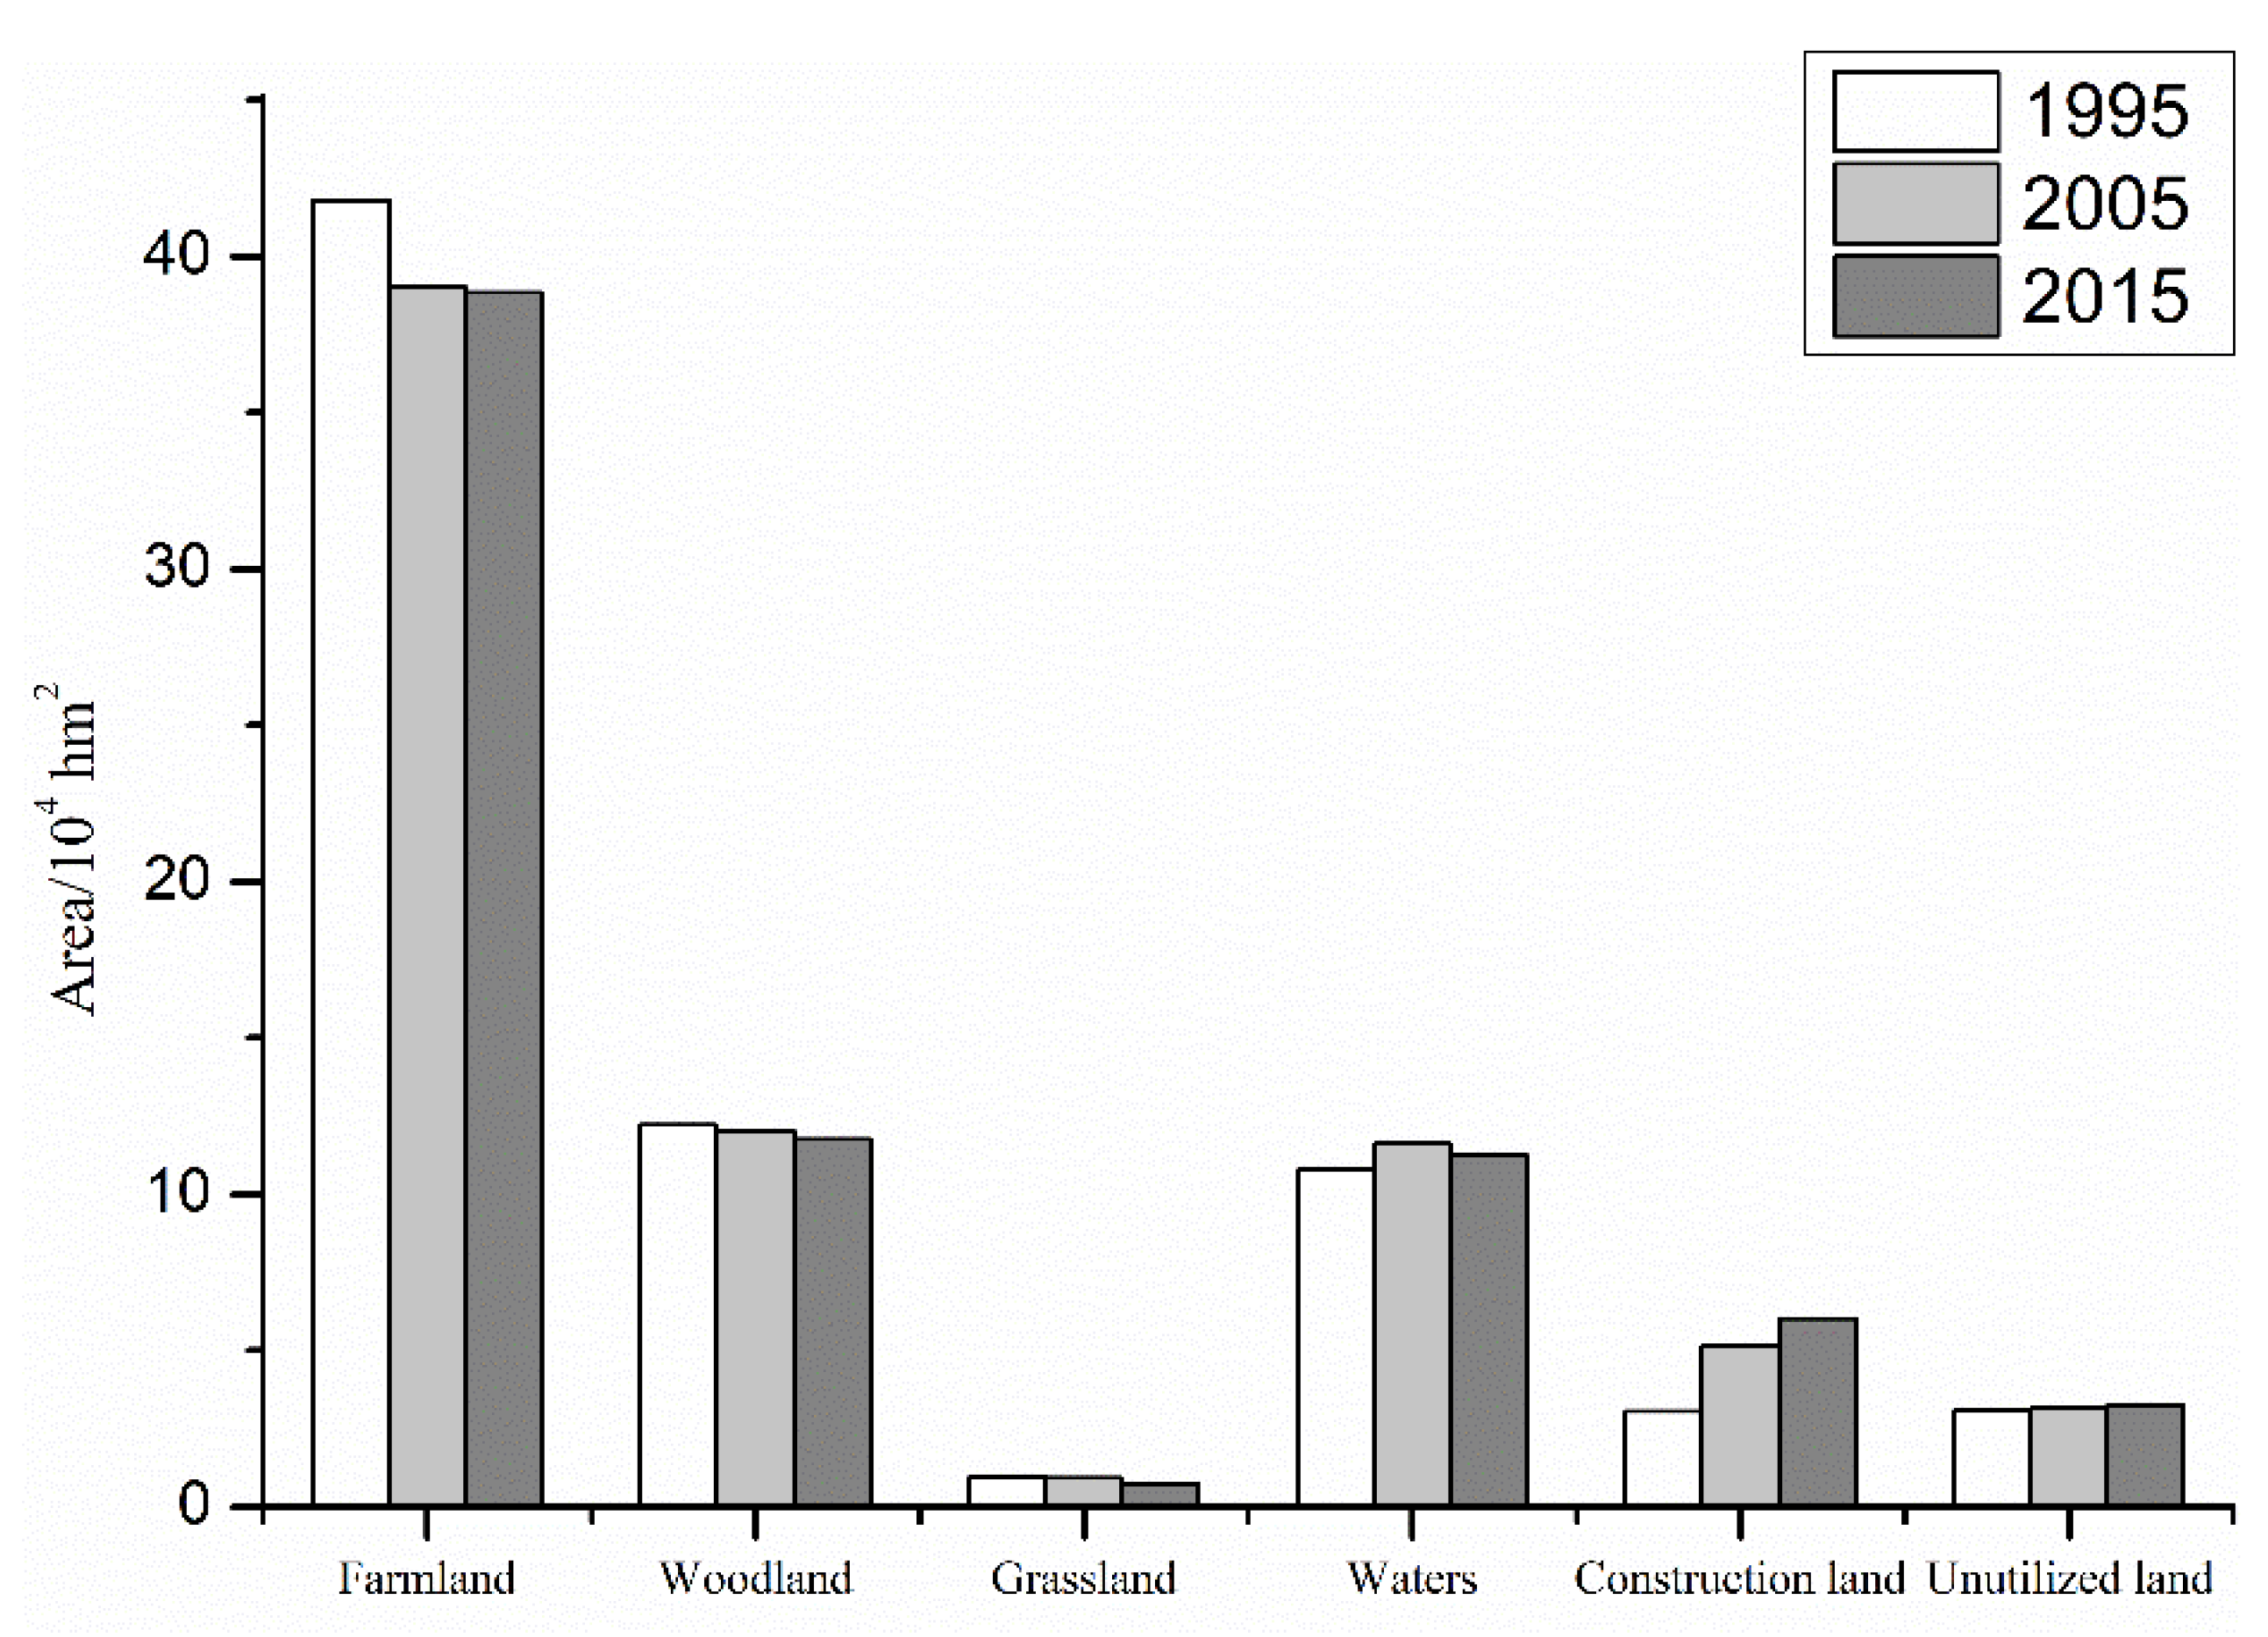
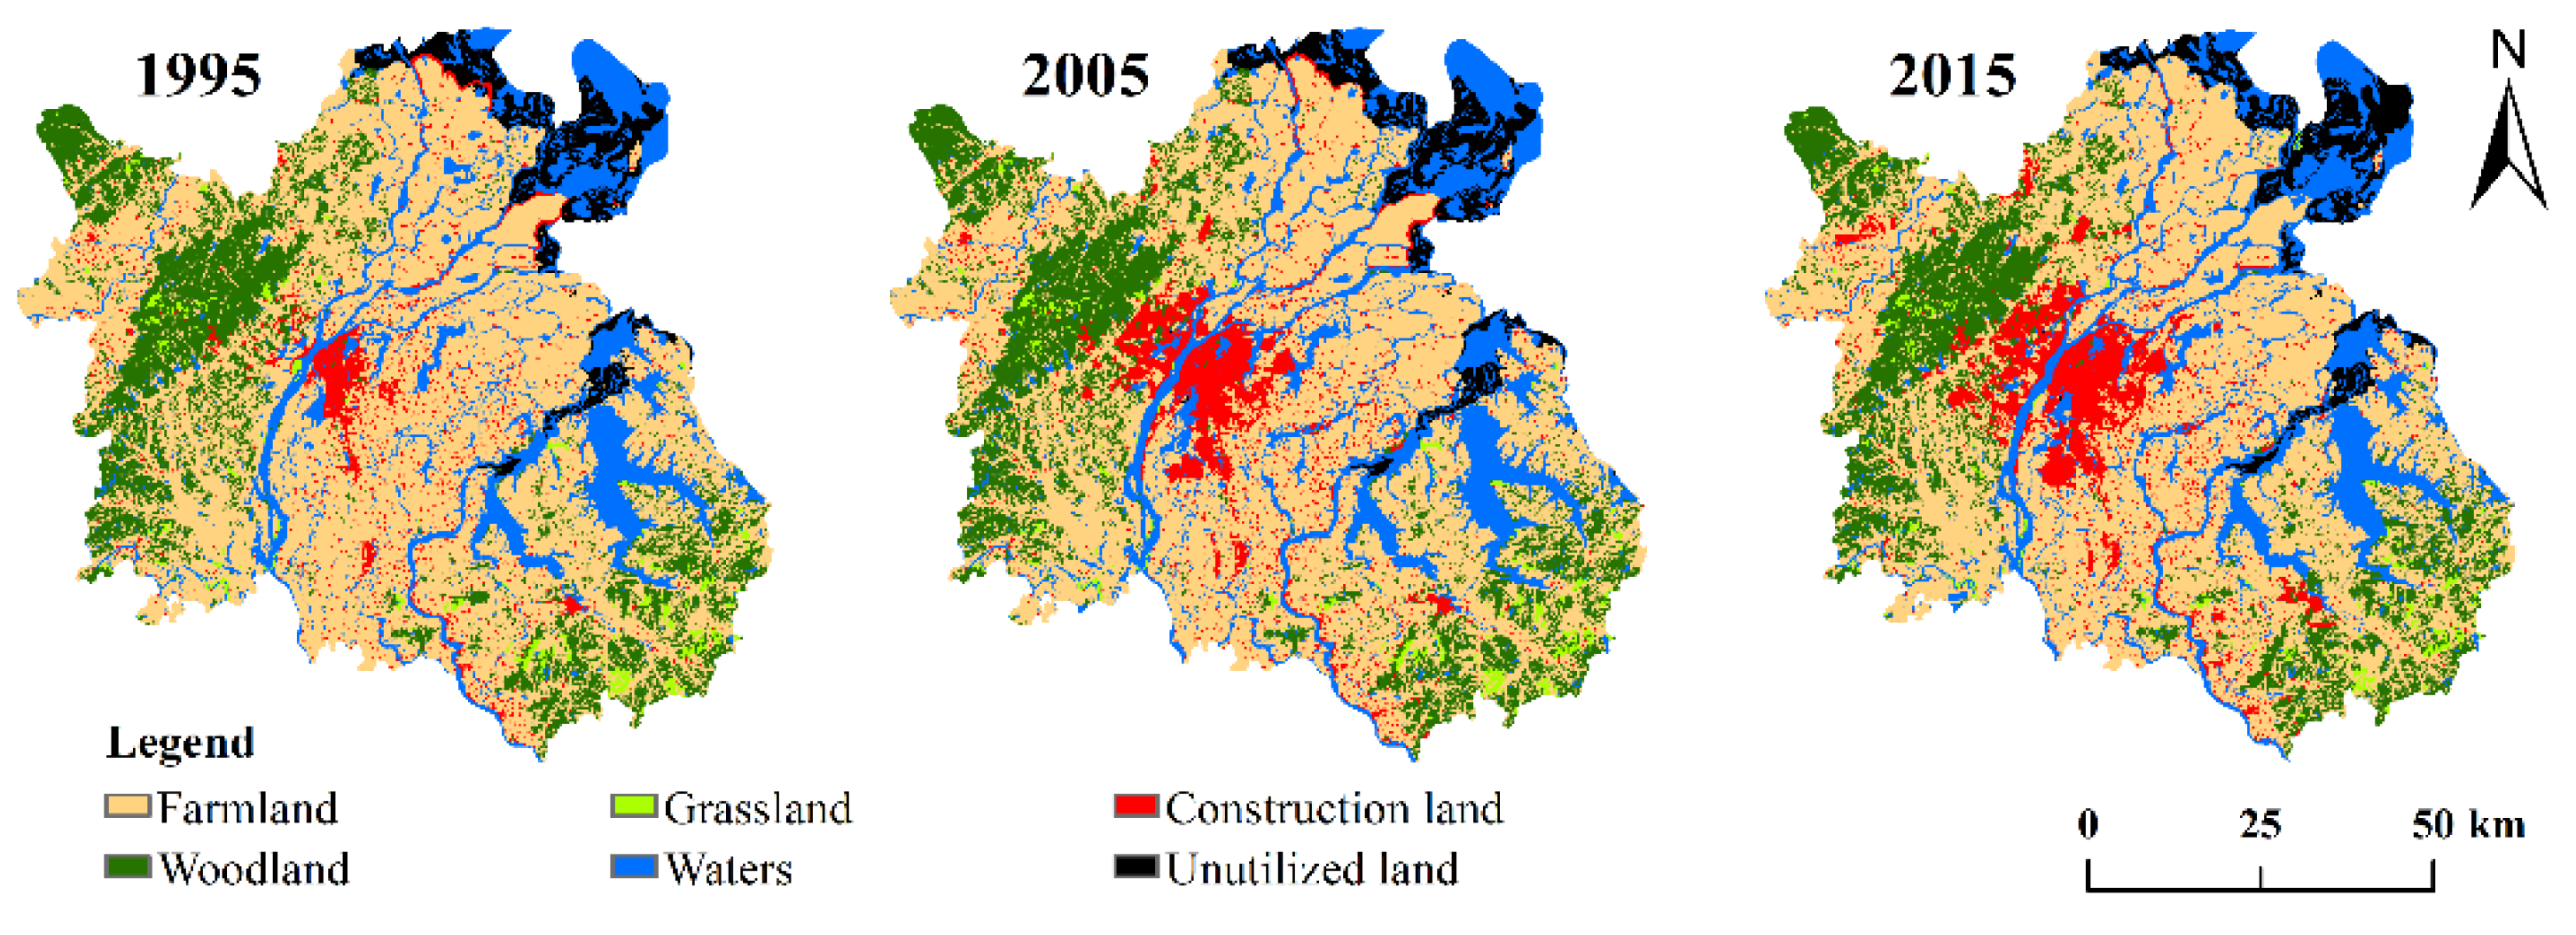
3.1. Land Use and Its Transfer Changes in the Study Area
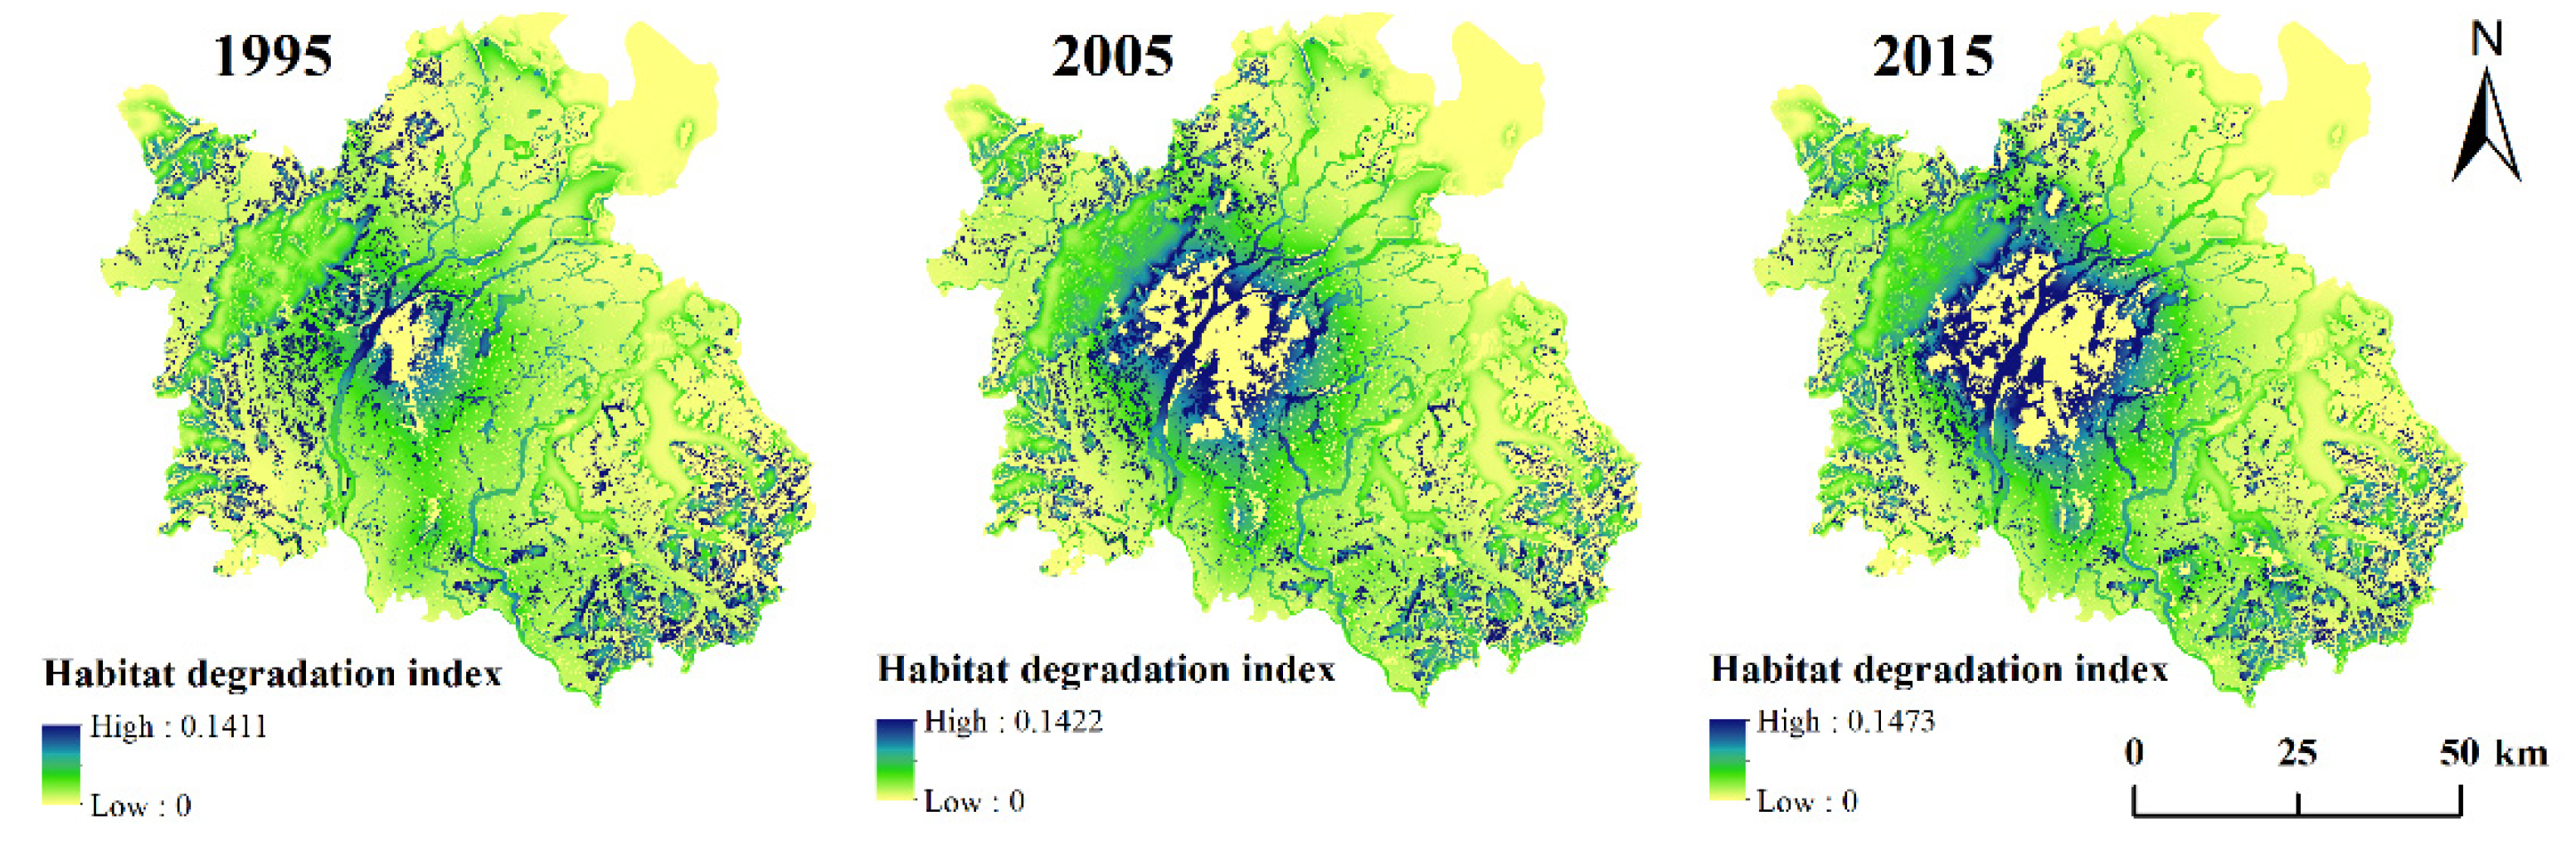
3.2. Analysis of Habitat Degradation
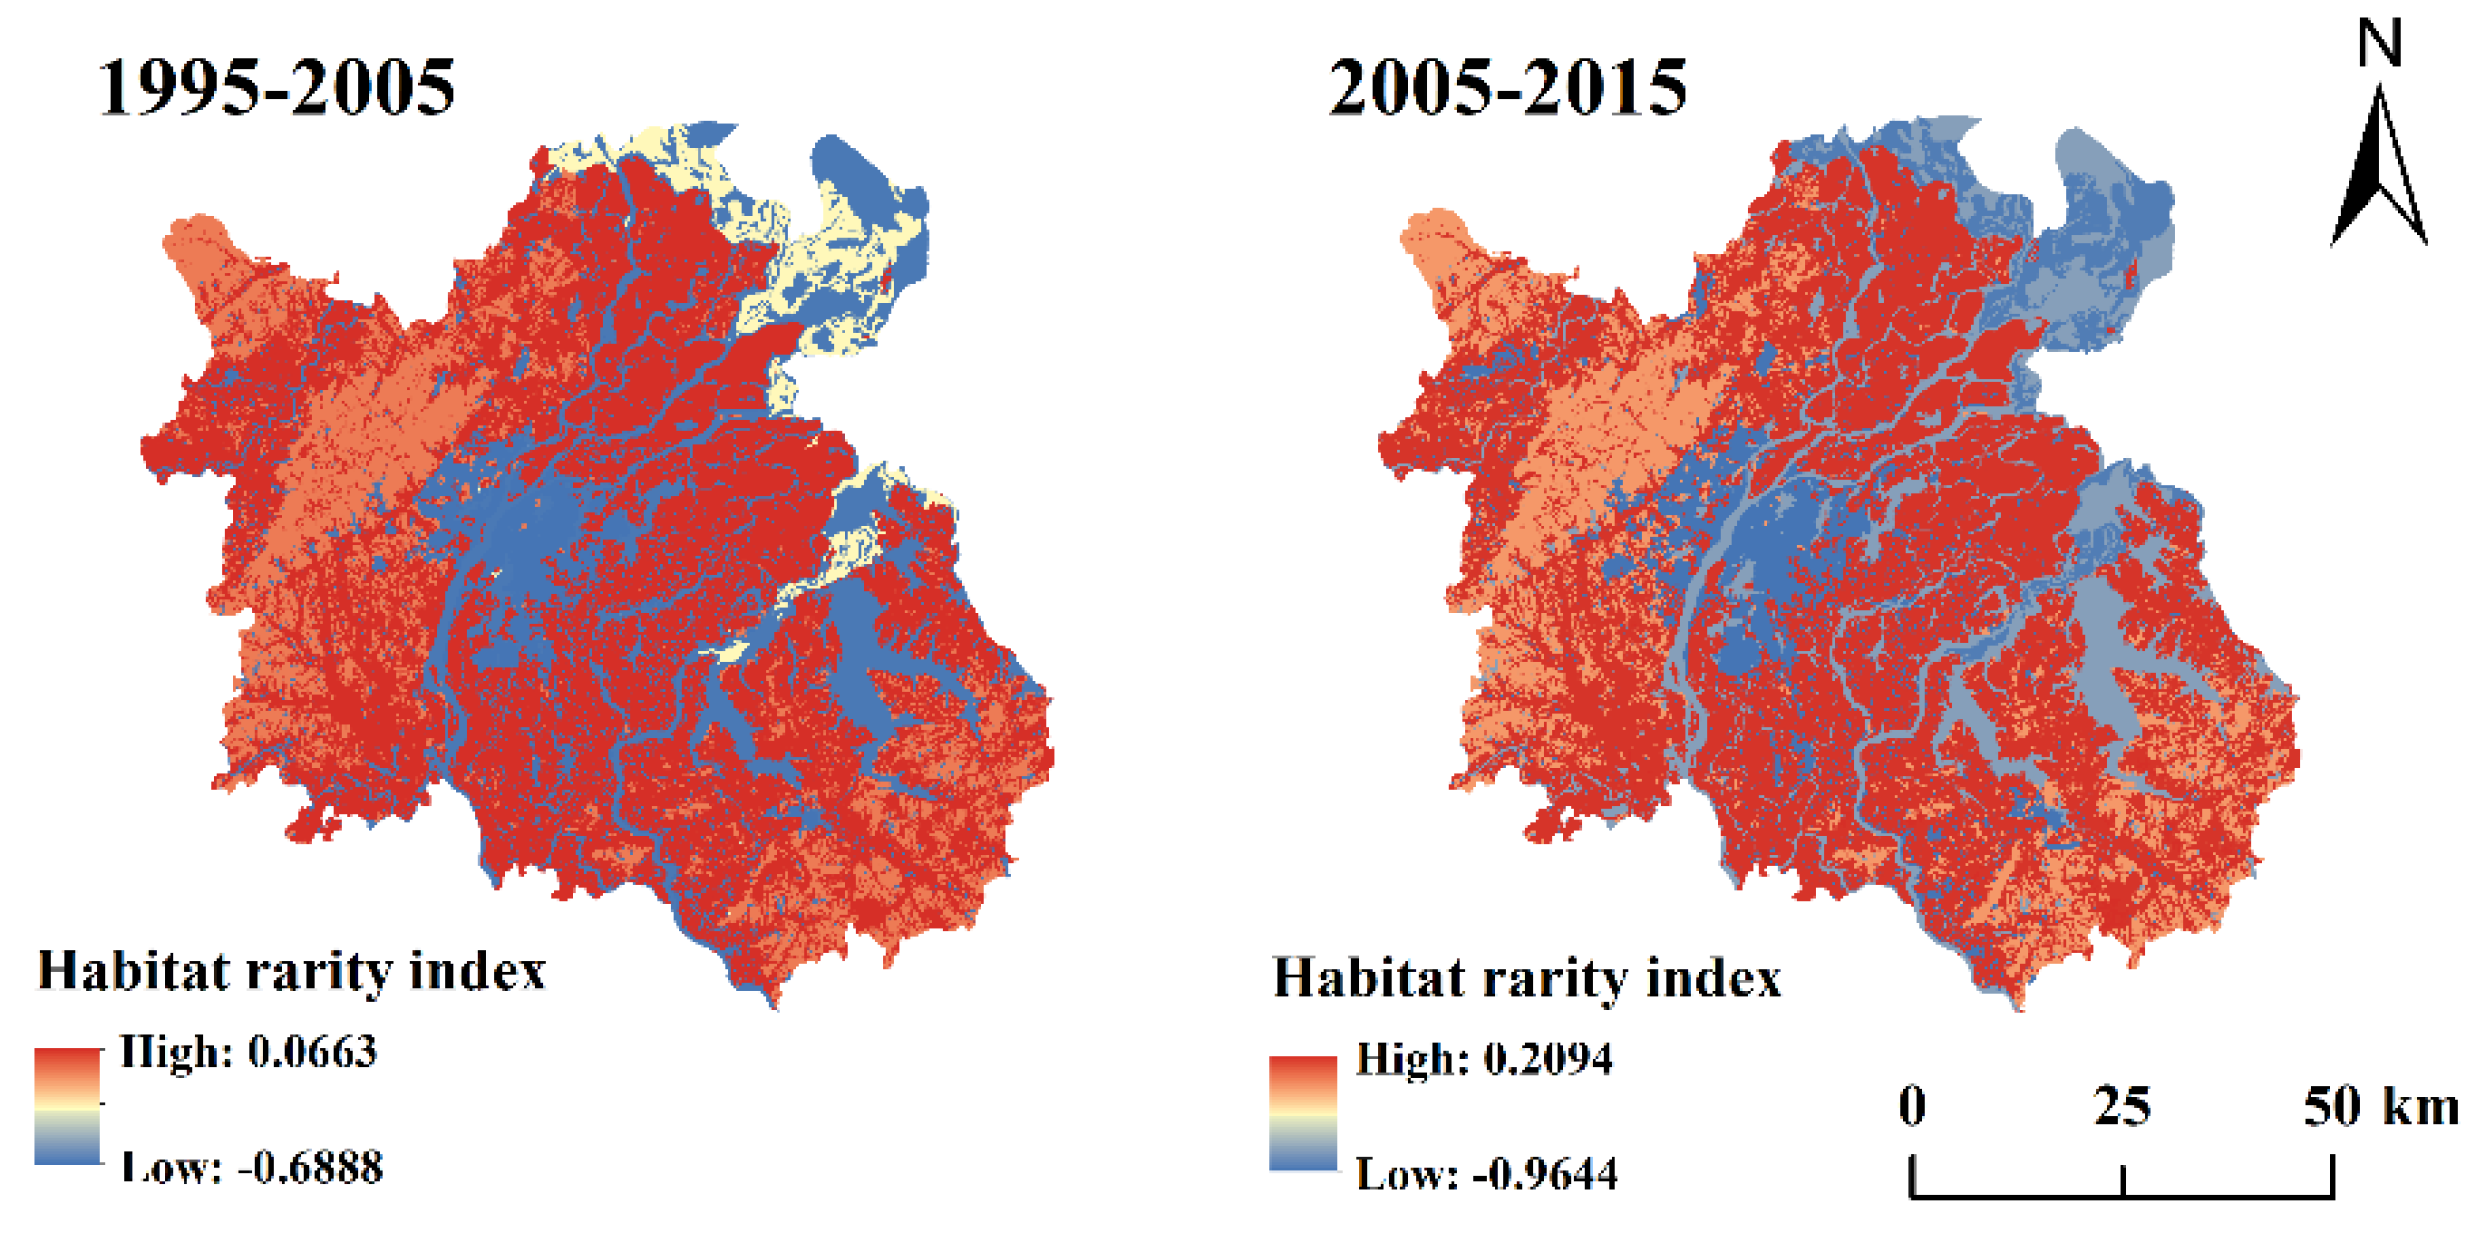
3.3. Analysis of Habitat Rarity
3.4. Analysis of Habitat Quality
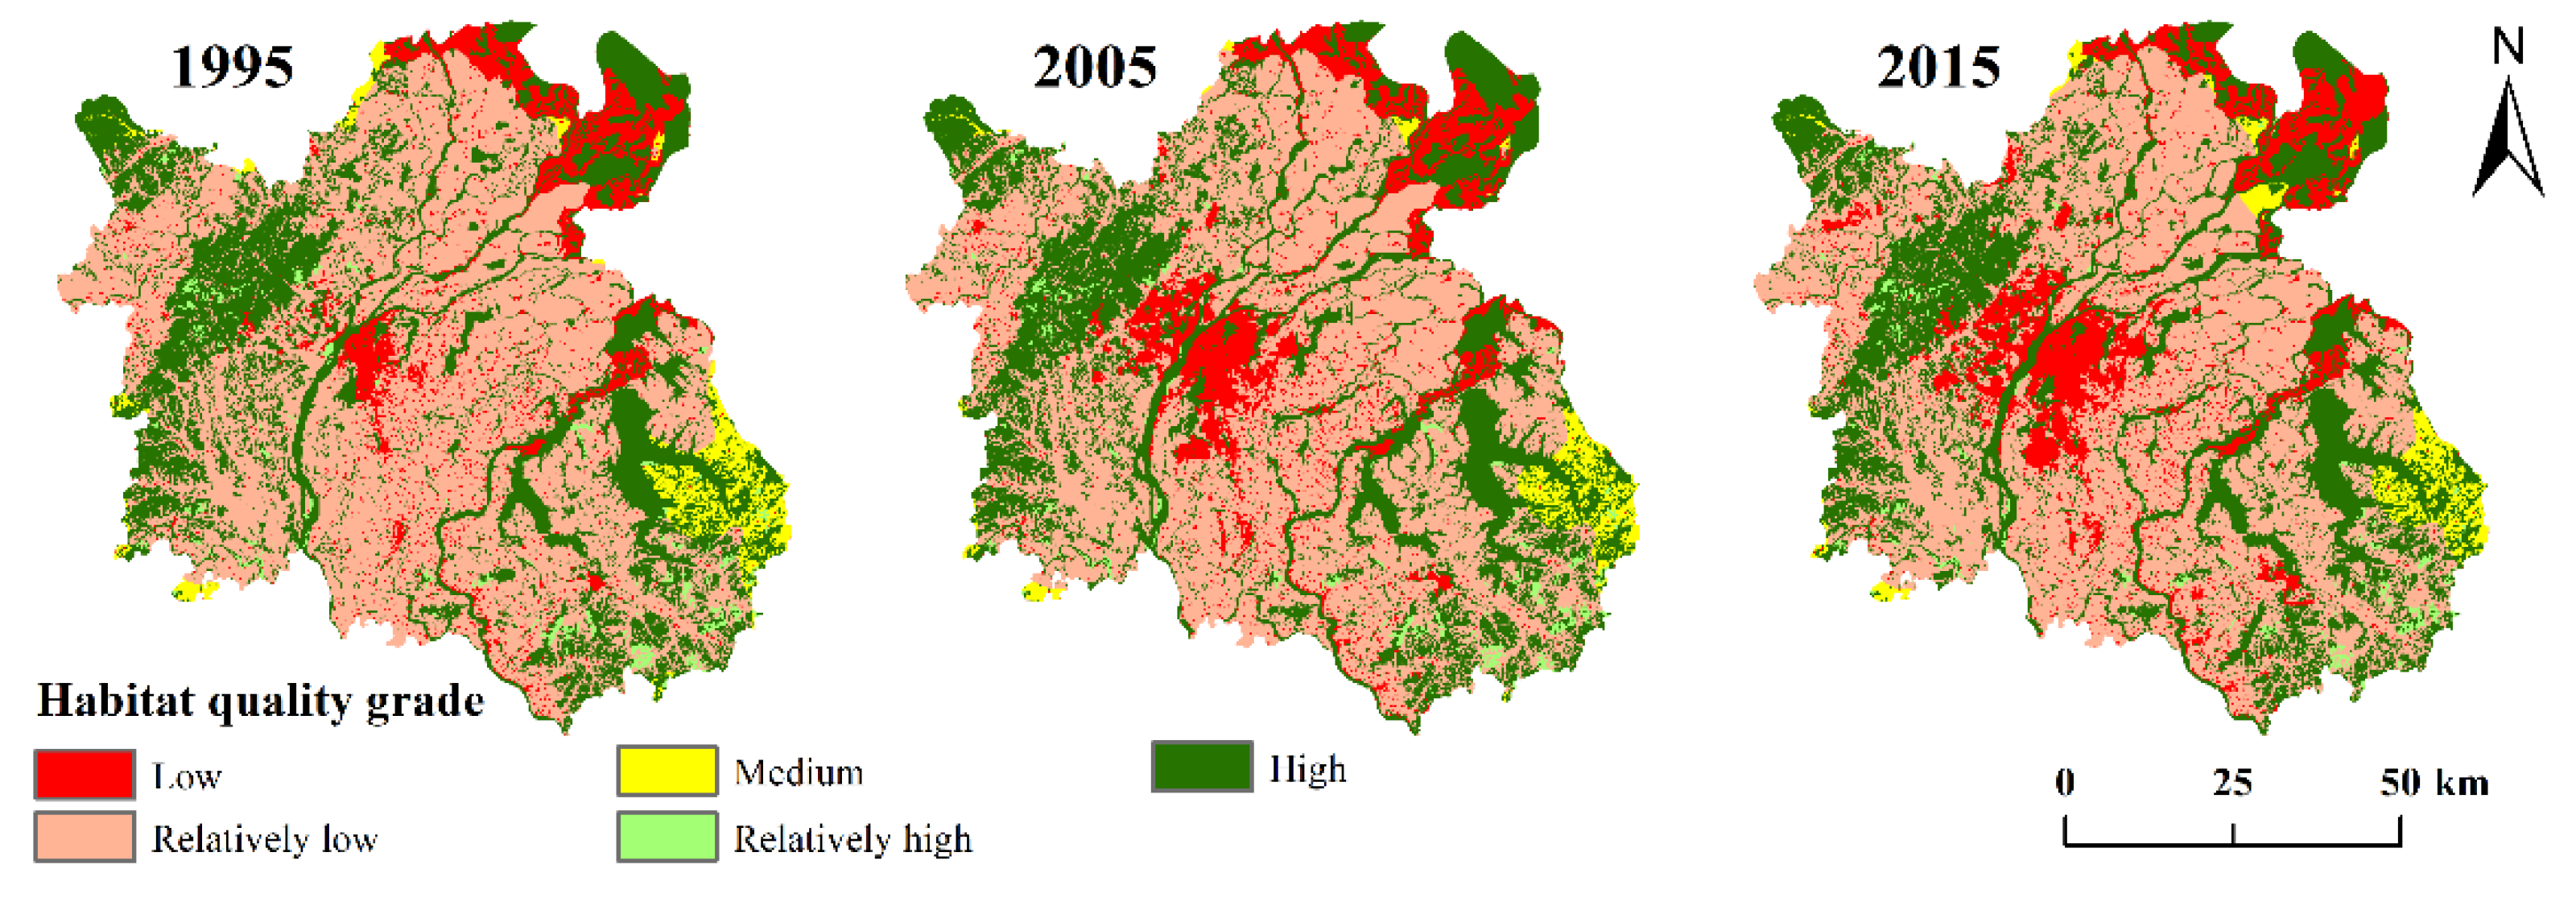
- In terms of temporal change, the proportion of low-grade habitats has been increasing over 20 years, while the proportion of relatively low-grade habitats has been decreasing over 20 years; however, both types of habitat have changed more in the last 10 years than in the first 10 years. The proportion of medium-grade habitats decreased significantly and then increased slightly, showing an overall decreasing trend. The proportion of relatively high-grade habitat also showed a decreasing trend. The proportion of high-grade habitat experienced a slight fluctuation of increasing and then decreasing, with no significant overall change. The above changes represent a process of transition from relatively high-grade, middle-grade and relatively low-grade habitats to low-grade habitats, and the habitat quality is in the process of being degraded. Finally, the degradation was more serious in the first 10 years than in the last 10 years.
- In terms of spatial pattern, the change in the spatial pattern in Nanchang had a certain amount of regularity. The area with high habitat quality accounted for a small proportion and was mainly distributed in Meiling in northwestern Nanchang, Poyang Lake in the northeast, and Junshan Lake and Qinglan Lake in the southeast. The famous Meiling National Forest Park is located in Meiling, and this zone is mainly woodland, rich in biodiversity, with little human activity and a high degree of ecological protection; thus, the habitat quality of this zone is high. Poyang Lake, Junshan Lake and Qinglan Lake have the ecological function of maintaining the biodiversity of the wetland landscape and replenishing groundwater. The habitat quality in this area is also relatively high under the protection of the local government. Areas of low habitat quality were mainly located in the Honggutan, East Lake, West Lake and Qingshan Lake districts on both sides of the Ganjiang River in central Nanchang, which are the central urban areas of Nanchang; these areas have rapid economic development, commercial development, rapid expansion of construction land, massive occupation of farmland resources and serious disturbances by human activities, resulting in poor habitat quality in this area. Areas of relatively low habitat quality were concentrated in most of the plain areas, where the land type is mainly farmland. These regions also have concentrations of rural settlements, and human activity is frequent; thus, ecological damage has occurred.
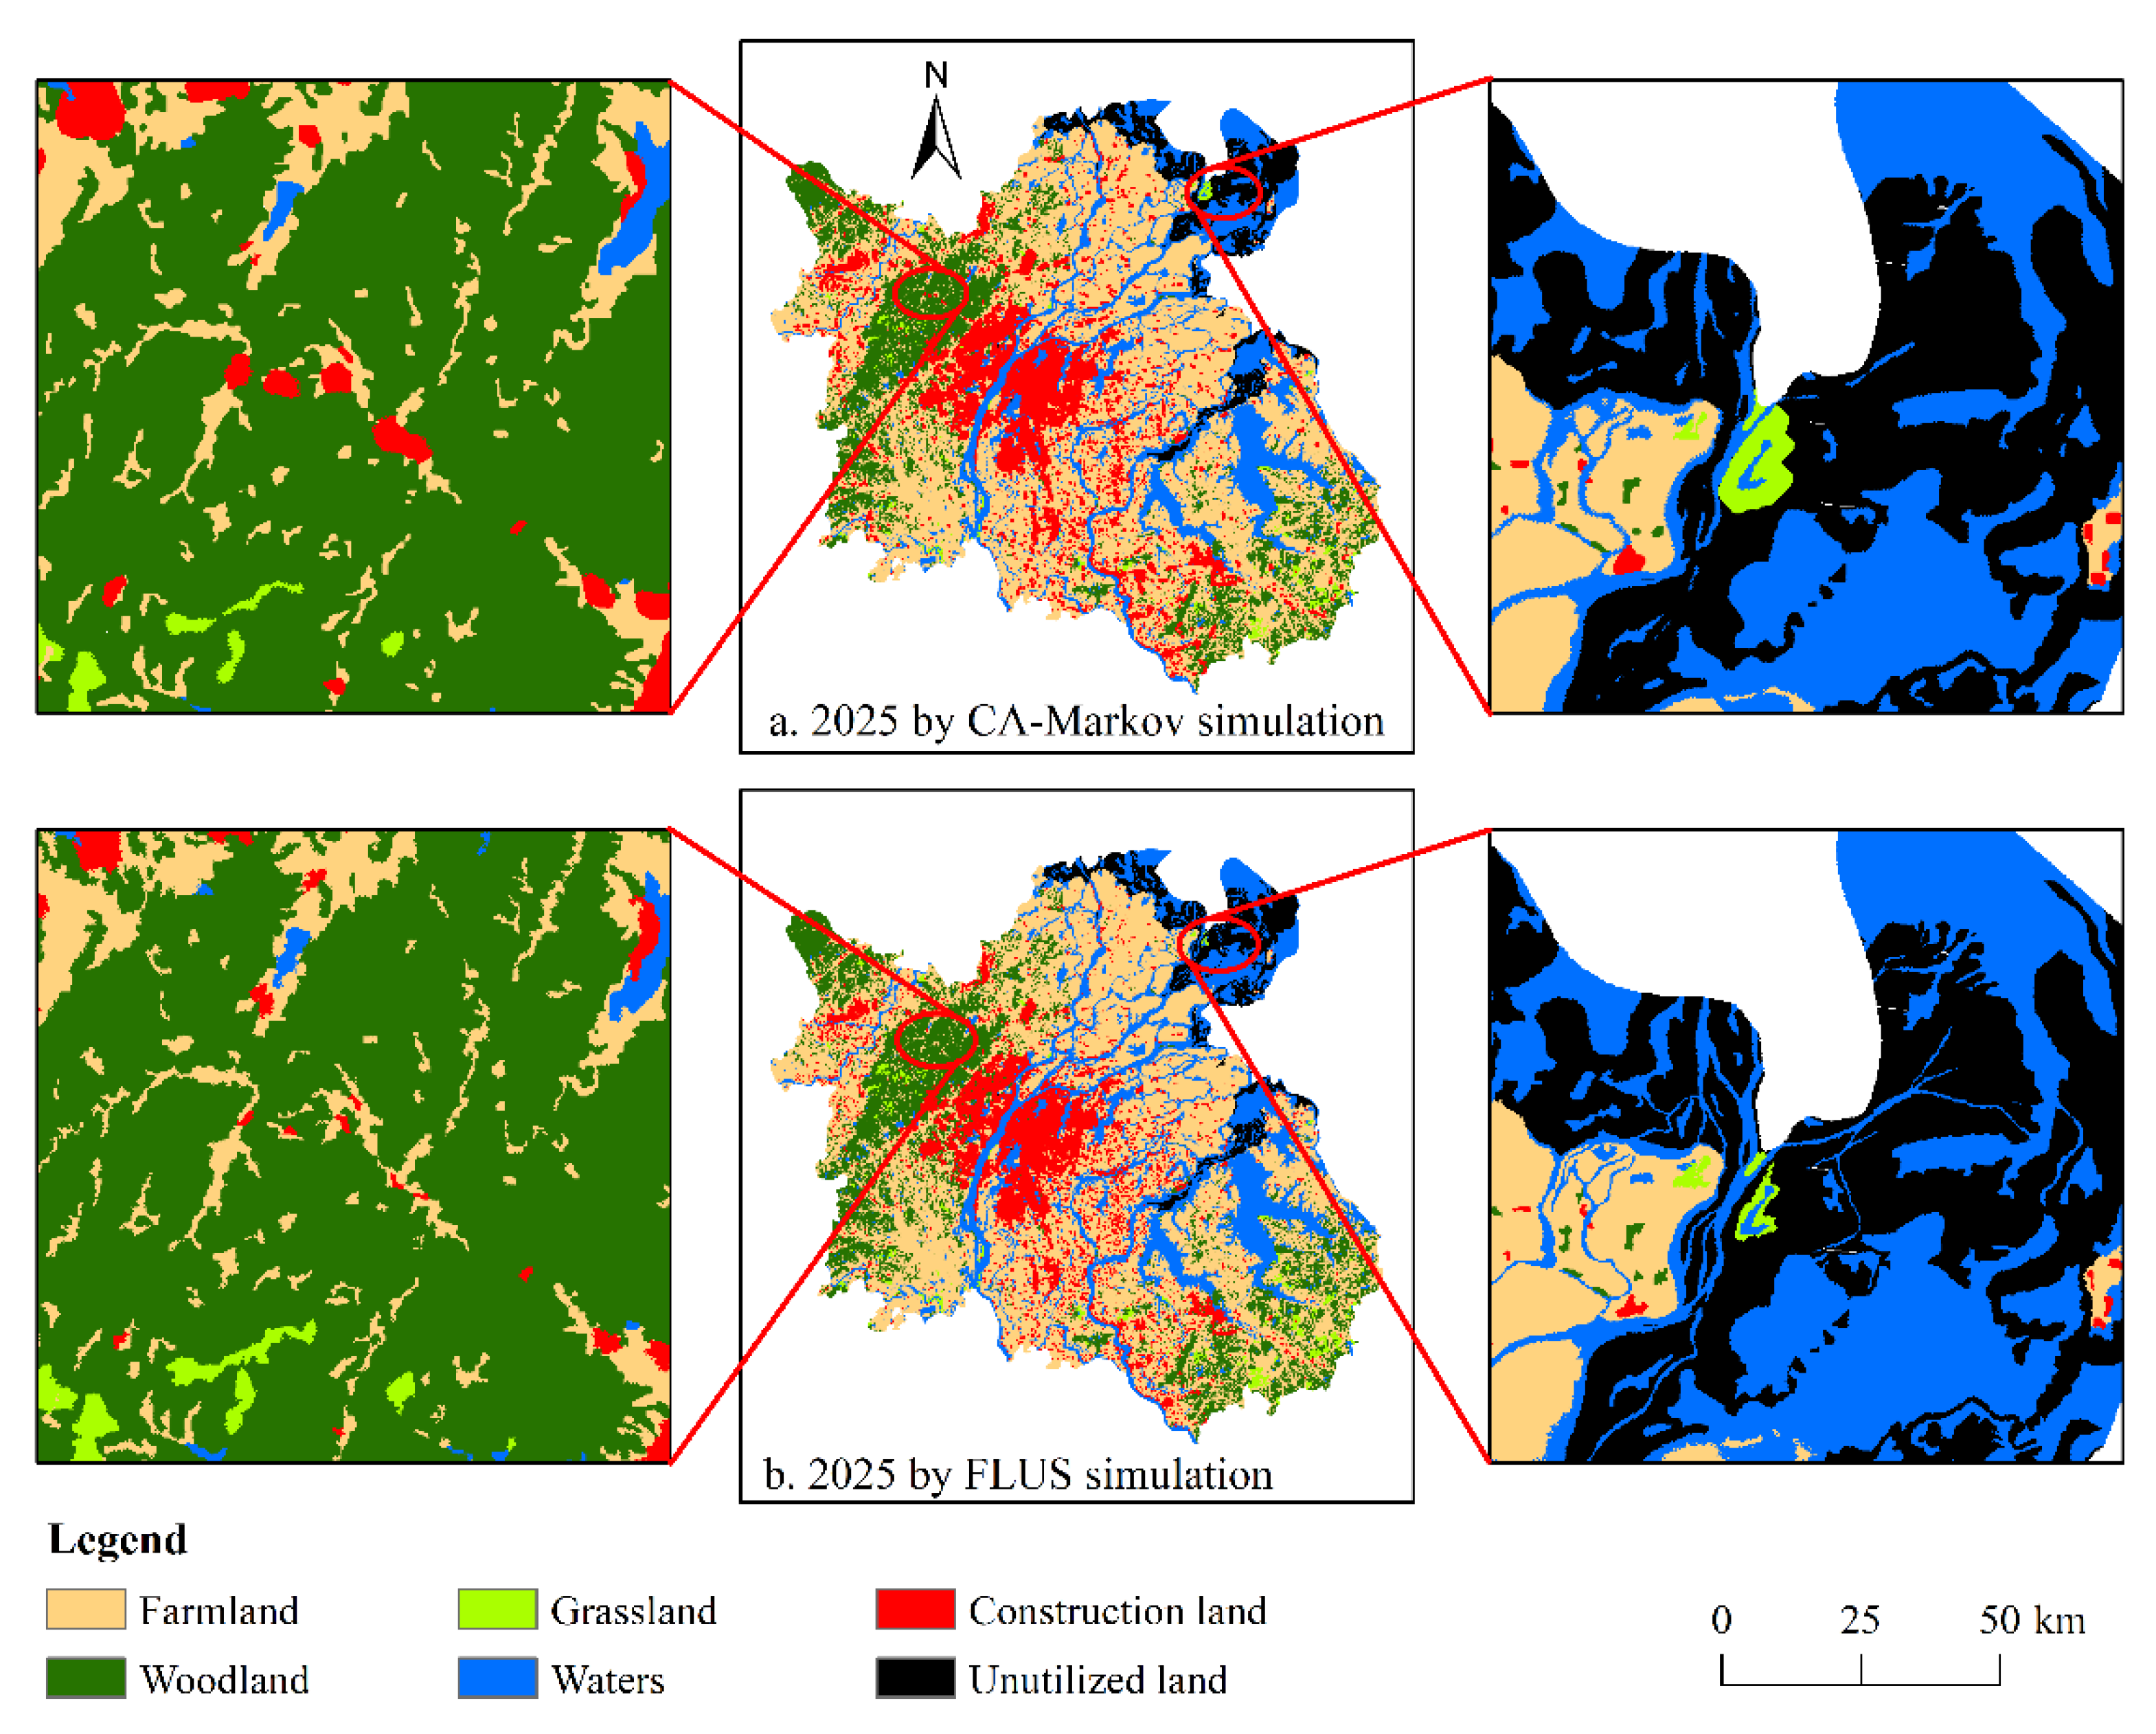
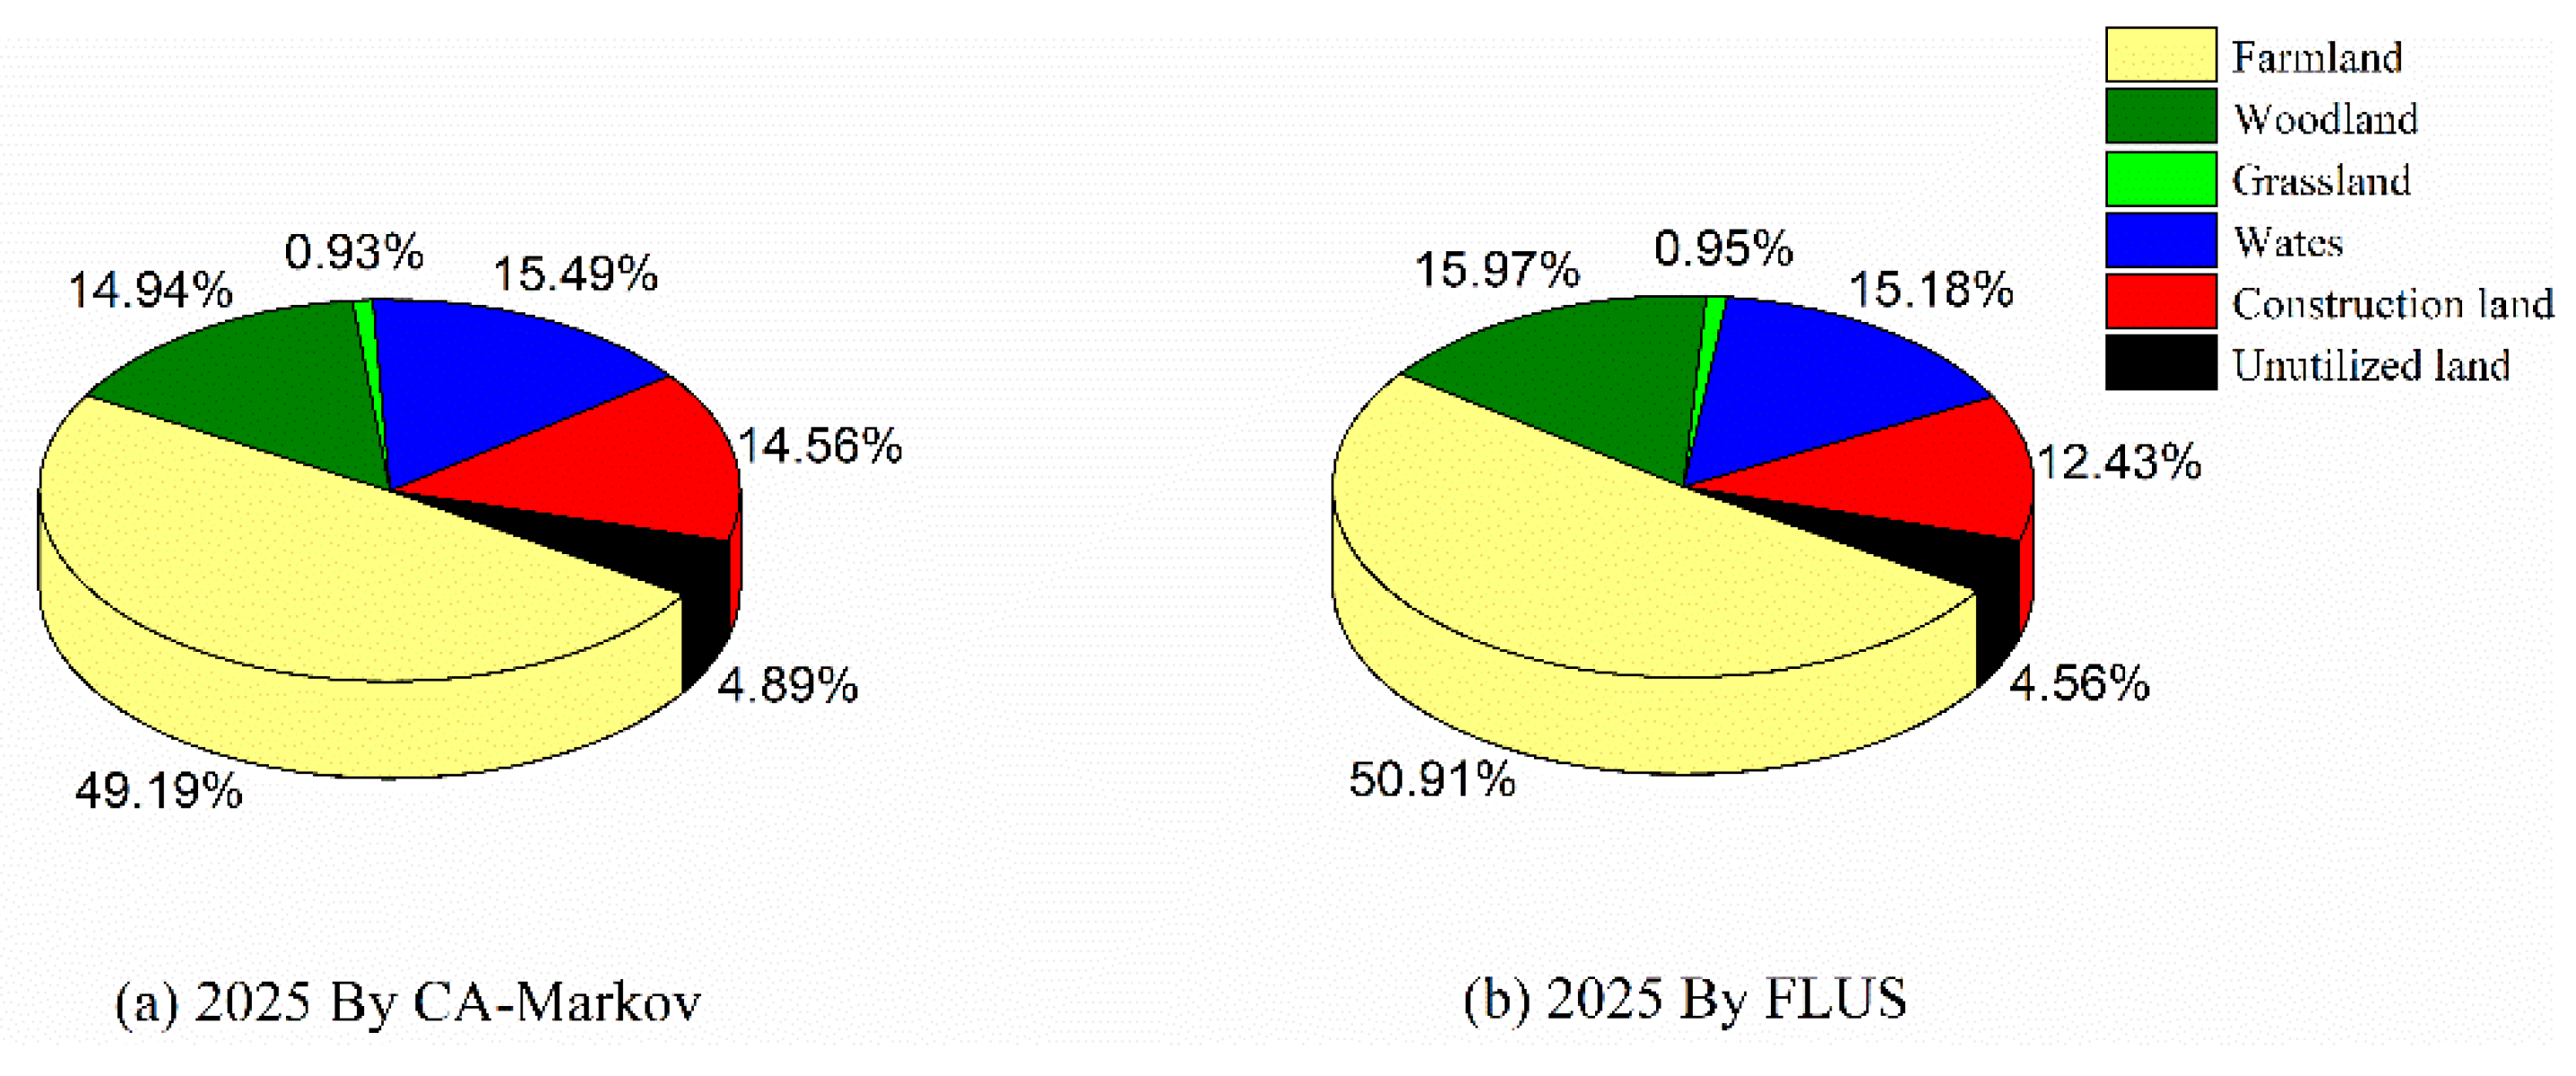
3.5. Comparison of Land Use Pattern Projections
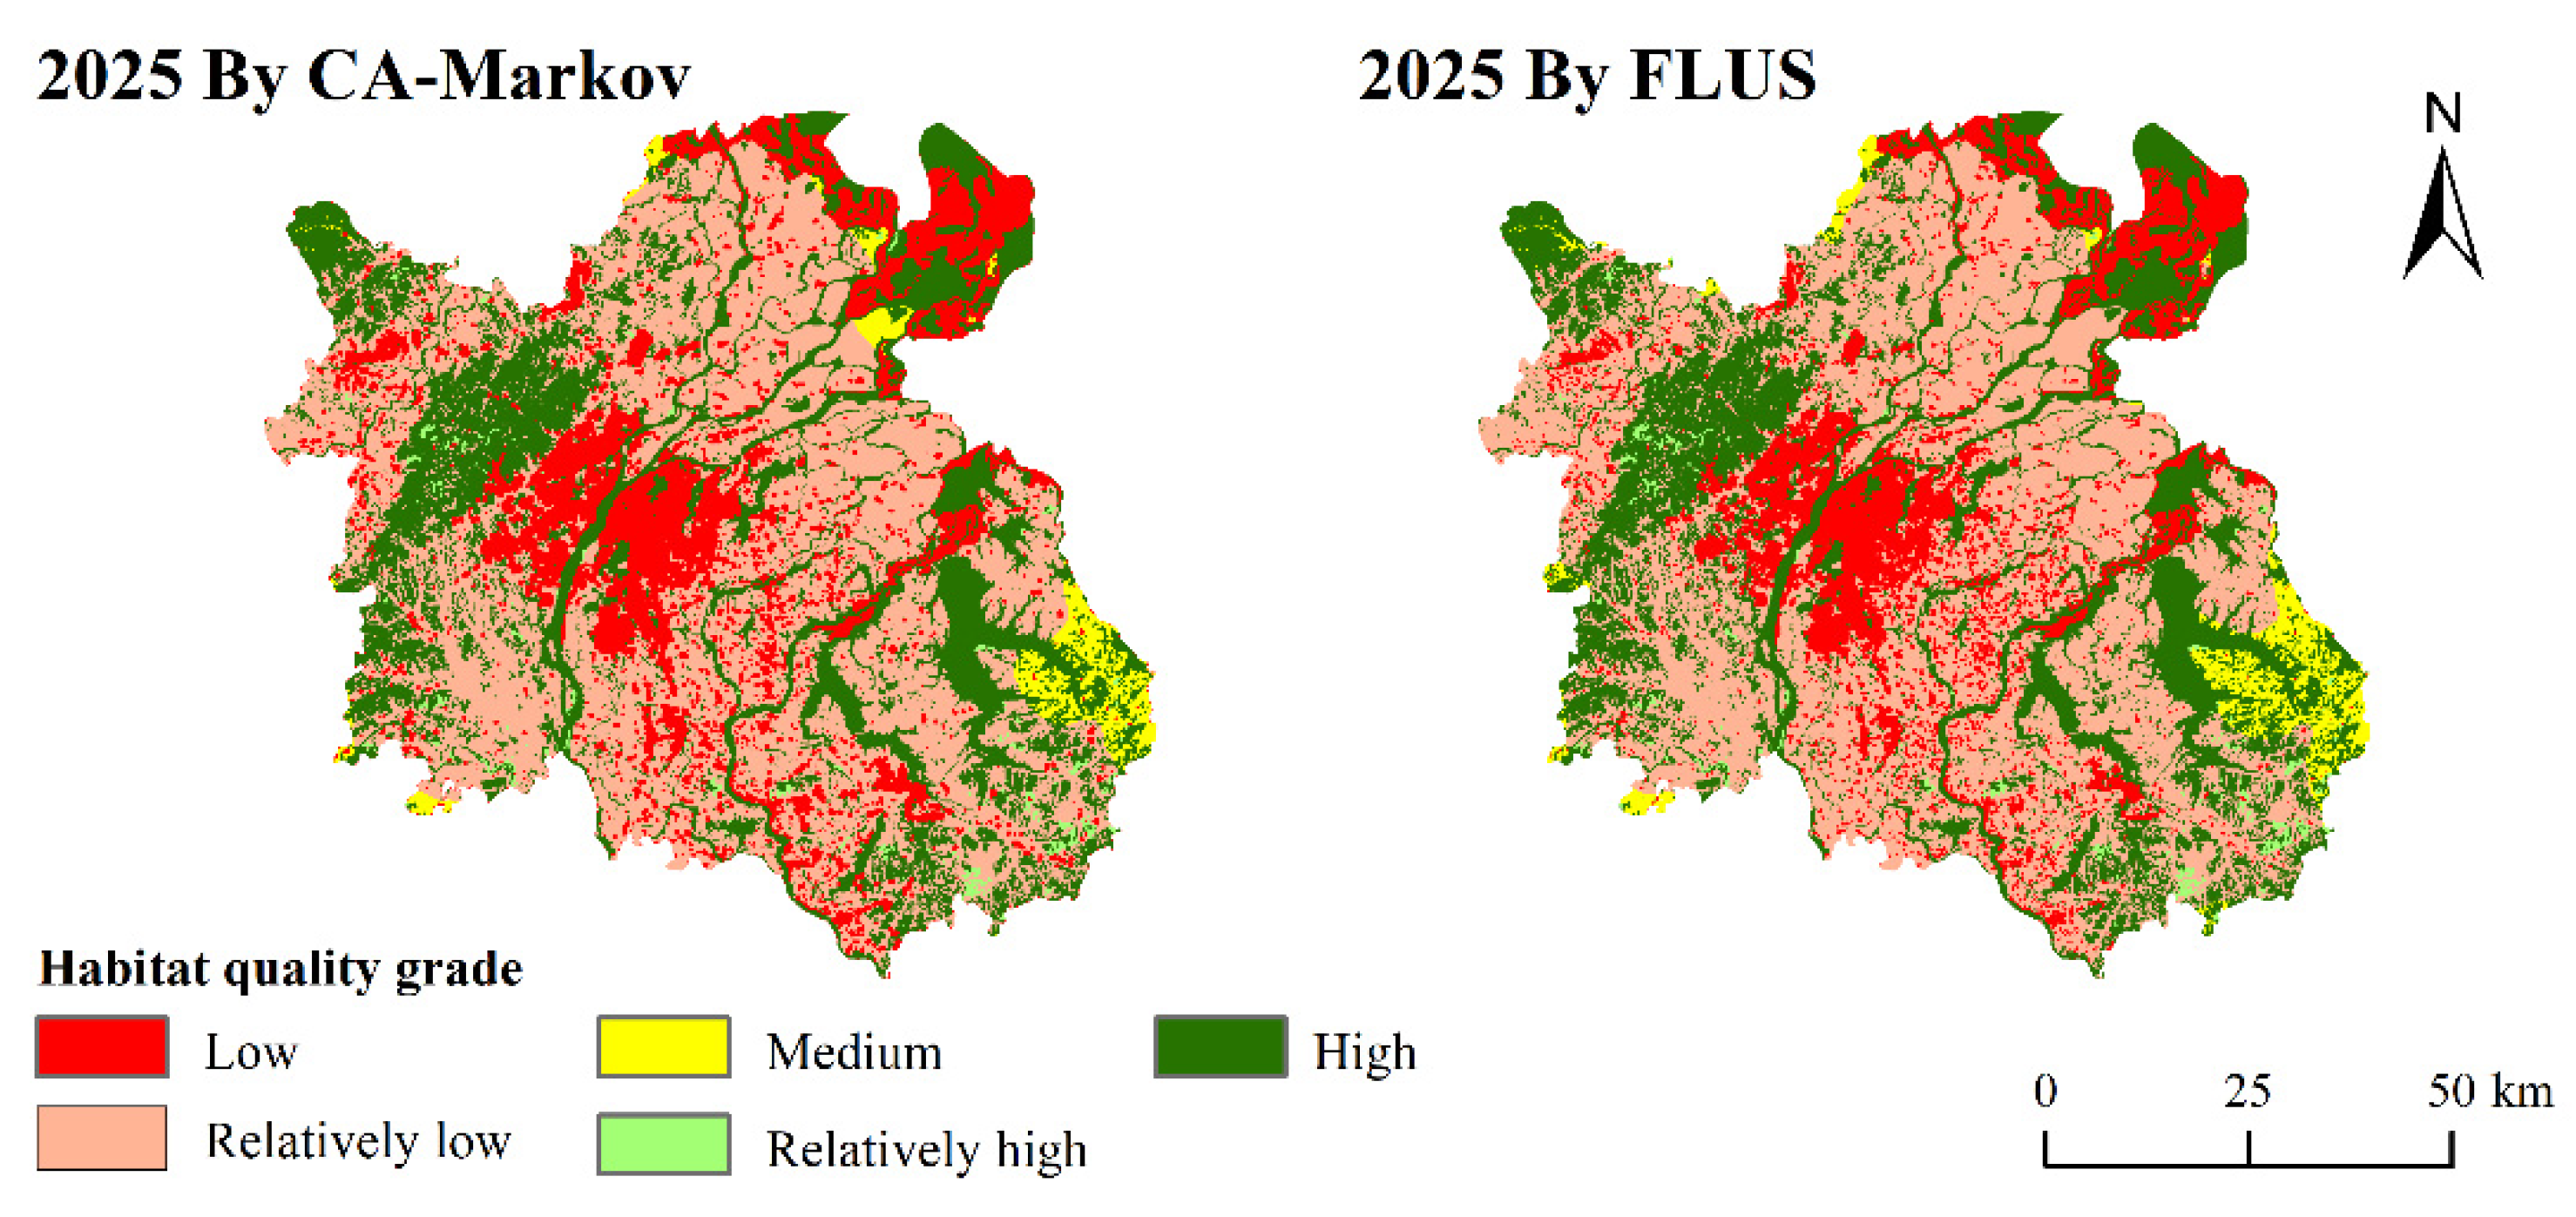
3.6. Prediction of Habitat Quality
4. Discussion
4.1. Analysis of the Causes of Changes in Habitat Quality
4.2. Comparison and Suitability Analysis of the CA-Markov and FLUS
4.3. Implications
5. Conclusions
Author Contributions
Funding
Data Availability Statement
Acknowledgments
Conflicts of Interest
References
- Lai, Y.; Jiang, L.; Xu, X. Exploring Spatio-Temporal Patterns of Urban Village Redevelopment: The Case of Shenzhen, China. Land 2021, 10, 976. [Google Scholar] [CrossRef]
- He, B.J.; Zhao, Z.Q.; Shen, L.D.; Wang, H.B.; Li, L.G. An approach to examining performances of cool/hot sources in mitigating/enhancing land surface temperature under different temperature backgrounds based on landsat 8 image. Sustain. Cities Soc. 2019, 44, 416–427. [Google Scholar] [CrossRef]
- Zhao, Z.Q.; He, B.J.; Li, L.G.; Wang, H.B.; Darko, A. Profile and concentric zonal analysis of relationships between land use/land cover and land surface temperature: Case study of Shenyang, China. Energy Build. 2017, 155, 282–295. [Google Scholar] [CrossRef]
- Li, W.; Qi, J.; Huang, S.; Fu, W.; Zhong, L.; He, B. A pressure-state-response framework for the sustainability analysis of water national parks in China. Ecol. Indic. 2021, 131, 108127. [Google Scholar] [CrossRef]
- De Simone, S.; Sigura, M.; Boscutti, F. Patterns of biodiversity and habitat sensitivity in agricultural landscapes. J. Environ. Plan. Manag. 2017, 60, 1173–1192. [Google Scholar] [CrossRef]
- Terrado, M.; Sabater, S.; Chaplin-Kramer, B.; Mandle, L.; Ziv, G.; Acuña, V. Model development for the assessment of terrestrial and aquatic habitat quality in conservation planning. Sci. Total Environ. 2016, 540, 63–70. [Google Scholar] [CrossRef] [Green Version]
- Nelson, E.; Mendoza, G.; Regetz, J.; Polasky, S.; Tallis, H.; Cameron, D.R.; Chan, K.M.A.; Daily, G.C.; Goldstein, J.; Kareiva, P.M.; et al. Modeling multiple ecosystem services, biodiversity conservation, commodity production, and tradeoffs at landscape scales. Front. Ecol. Environ. 2009, 7, 4–11. [Google Scholar] [CrossRef]
- Leh, M.D.K.; Matlock, M.D.; Cummings, E.C.; Nalley, L.L. Quantifying and mapping multiple ecosystem services change in West Africa. Agric. Ecosyst. Environ. 2013, 165, 6–18. [Google Scholar] [CrossRef]
- Kovacs, K.; Polasky, S.; Nelson, E.; Keeler, B.L.; Pennington, D.; Plantinga, A.J.; Taff, S.J. Evaluating the Return in Ecosystem Services from Investment in Public Land Acquisitions. PLoS ONE 2013, 8, e62202. [Google Scholar] [CrossRef]
- Shaw, M.R.; Pendleton, L.; Cameron, D.R.; Morris, B.; Bachelet, D.; Klausmeyer, K.; MacKenzie, J.; Conklin, D.R.; Bratman, G.N.; Lenihan, J.; et al. The impact of climate change on California’s ecosystem services. Clim. Change 2011, 109, 465–484. [Google Scholar] [CrossRef] [Green Version]
- Tong, S.T.Y.; Sun, Y.; Ranatunga, T.; He, J.; Yang, Y.J. Predicting plausible impacts of sets of climate and land use change scenarios on water resources. Appl. Geogr. 2012, 32, 477–489. [Google Scholar] [CrossRef]
- Tang, F.; Fu, M.; Wang, L.; Zhang, P. Land-use change in Changli County, China: Predicting its spatio-temporal evolution in habitat quality. Ecol. Indic. 2020, 117, 106719. [Google Scholar] [CrossRef]
- El-Tantawi, A.M.; Bao, A.; Chang, C.; Liu, Y. Monitoring and predicting land use/cover changes in the Aksu-Tarim River Basin, Xinjiang-China (1990–2030). Environ. Monit. Assess. 2019, 191, 480. [Google Scholar] [CrossRef]
- Huang, D.; Huang, J.; Liu, T. Delimiting urban growth boundaries using the CLUE-S model with village administrative boundaries. Land Use Policy 2019, 82, 422–435. [Google Scholar] [CrossRef]
- Varga, O.G.; Pontius, R.G.; Singh, S.K.; Szabó, S. Intensity Analysis and the Figure of Merit’s components for assessment of a Cellular Automata—Markov simulation model. Ecol. Indic. 2019, 101, 933–942. [Google Scholar] [CrossRef]
- Riccioli, F.; El Asmar, T.; El Asmar, J.P.; Fratini, R. Use of cellular automata in the study of variables involved in land use changes: An application in the wine production sector. Environ. Monit. Assess. 2013, 185, 5361–5374. [Google Scholar] [CrossRef]
- Guan, D.; Gao, W.; Watari, K.; Fukahori, H. Land use change of Kitakyushu based on landscape ecology and Markov model. J. Geogr. Sci. 2008, 18, 455–468. [Google Scholar] [CrossRef]
- Li, X.; Chen, G.; Liu, X.; Liang, X.; Wang, S.; Chen, Y.; Pei, F.; Xu, X. A New Global Land-Use and Land-Cover Change Product at a 1-km Resolution for 2010 to 2100 Based on Human–Environment Interactions. Ann. Am. Assoc. Geogr. 2017, 107, 1040–1059. [Google Scholar] [CrossRef]
- Jenerette, G.D.; Wu, J. Analysis and simulation of land-use change in the central Arizona—Phoenix region, USA. Landsc. Ecol. 2001, 16, 611–626. [Google Scholar] [CrossRef]
- Nourqolipour, R.; Mohamed Shariff, A.R.B.; Balasundram, S.K.; Ahmad, N.B.; Sood, A.M.; Buyong, T.; Amiri, F. A GIS-based model to analyze the spatial and temporal development of oil palm land use in Kuala Langat district, Malaysia. Environ. Earth Sci. 2015, 73, 1687–1700. [Google Scholar] [CrossRef] [Green Version]
- Liang, X.; Liu, X.; Li, X.; Chen, Y.; Tian, H.; Yao, Y. Delineating multi-scenario urban growth boundaries with a CA-based FLUS model and morphological method. Landsc. Urban Plan. 2018, 177, 47–63. [Google Scholar] [CrossRef]
- Wang, X.; Ma, B.W.; Li, D.; Chen, K.; Yan, H. Multi-scenario simulation and prediction of ecological space in Hubei province based on FLUS model. J. Nat. Resour. 2020, 35, 230–242. [Google Scholar] [CrossRef]
- Azizi, A.; Malakmohamadi, B.; Jafari, H.R. Land use and land cover spatiotemporal dynamic pattern and predicting changes using integrated CA-markov model. Glob. J. Environ. Sci. Manag. 2016, 2, 223–234. [Google Scholar] [CrossRef]
- Ramezani, N.; Jafari, R. Land Use/Cover Change Detection in 2025 with CA-Markov Chain Model (case study: Esfarayen). Geogr. Res. 2014, 29, 87–101. [Google Scholar]
- Lin, W.; Sun, Y.; Nijhuis, S.; Wang, Z. Scenario-based flood risk assessment for urbanizing deltas using future land-use simulation (FLUS): Guangzhou Metropolitan Area as a case study. Sci. Total Environ. 2020, 739, 139899. [Google Scholar] [CrossRef] [PubMed]
- Sallustio, L.; De Toni, A.; Strollo, A.; Di Febbraro, M.; Gissi, E.; Casella, L.; Geneletti, D.; Munafò, M.; Vizzarri, M.; Marchetti, M. Assessing habitat quality in relation to the spatial distribution of protected areas in Italy. J. Environ. Manag. 2017, 201, 129–137. [Google Scholar] [CrossRef]
- Chu, L.; Zhang, X.R.; Wang, T.W.; Li, Z.X.; Cai, C.F. Spatial-temporal evolution and prediction of urban landscape pattern and habitat quality based on CA-Markov and InVEST model. Chin. J. Appl. Ecol. 2018, 29, 4106–4118. [Google Scholar] [CrossRef]
- He, J.; Huang, J.; Li, C. The evaluation for the impact of land use change on habitat quality: A joint contribution of cellular automata scenario simulation and habitat quality assessment model. Ecol. Model. 2017, 366, 58–67. [Google Scholar] [CrossRef]
- Van Hulst, R. On the dynamics of vegetation: Markov chains as models of succession. Vegetatio 1979, 40, 3–14. [Google Scholar] [CrossRef]
- Yang, X.; Zheng, X.Q.; Chen, R. A land use change model: Integrating landscape pattern indexes and Markov-CA. Ecol. Model. 2014, 283, 1–7. [Google Scholar] [CrossRef]
- Sang, L.; Zhang, C.; Yang, J.; Zhu, D.; Yun, W. Simulation of land use spatial pattern of towns and villages based on CA-Markov model. Math. Comput. Model. 2011, 54, 938–943. [Google Scholar] [CrossRef]
- Vaz, E.; Arsanjani, J.J. Predicting urban growth of the greater toronto area—Coupling a markov cellular automata with document meta-analysis. J. Environ. Inform. 2015, 25, 71–80. [Google Scholar] [CrossRef]
- Mondal, B.; Das, D.N.; Bhatta, B. Integrating cellular automata and Markov techniques to generate urban development potential surface: A study on Kolkata agglomeration. Geocarto Int. 2017, 32, 401–419. [Google Scholar] [CrossRef]
- Baqa, M.F.; Chen, F.; Lu, L.; Qureshi, S.; Tariq, A.; Wang, S.; Jing, L.; Hamza, S.; Li, Q. Monitoring and Modeling the Patterns and Trends of Urban Growth Using Urban Sprawl Matrix and CA-Markov Model: A Case Study of Karachi, Pakistan. Land 2021, 10, 700. [Google Scholar] [CrossRef]
- Guan, D.J.; Li, H.F.; Inohae, T.; Su, W.; Nagaie, T.; Hokao, K. Modeling urban land use change by the integration of cellular automaton and Markov model. Ecol. Model. 2011, 222, 3761–3772. [Google Scholar] [CrossRef]
- Kamusoko, C.; Gamba, J. Simulating urban growth using a random forest-cellular automata (RF-CA) model. ISPRS Int. J. Geo-Inf. 2015, 4, 447–470. [Google Scholar] [CrossRef]
- Wang, S.Q.; Zheng, X.Q.; Zang, X.B. Accuracy assessments of land use change simulation based on Markov-cellular automata model. Procedia Environ. Sci. 2012, 13, 1238–1245. [Google Scholar] [CrossRef] [Green Version]
- Ku, C.A. Incorporating spatial regression model into cellular automata for simulating land use change. Appl. Geogr. 2016, 69, 1–9. [Google Scholar] [CrossRef]
- Lin, Y.P.; Chu, H.J.; Wu, C.F.; Verburg, P.H. Predictive ability of logistic regression, auto-logistic regression and neural network models in empirical land-use change modeling—A case study. Int. J. Geogr. Inf. Sci. 2011, 25, 65–87. [Google Scholar] [CrossRef] [Green Version]
- Chen, Y.; Li, X.; Liu, X.; Ai, B.; Li, S. Capturing the varying effects of driving forces over time for the simulation of urban growth by using survival analysis and cellular automata. Landsc. Urban Plan. 2016, 152, 59–71. [Google Scholar] [CrossRef]
- Moreira, M.; Fonseca, C.; Vergílio, M.; Calado, H.; Gil, A. Spatial assessment of habitat conservation status in a Macaronesian island based on the InVEST model: A case study of Pico Island (Azores, Portugal). Land Use Policy 2018, 78, 637–649. [Google Scholar] [CrossRef]
- Xu, L.; Chen, S.S.; Xu, Y.; Li, G.; Su, W. Impacts of land-use change on habitat quality during 1985–2015 in the Taihu Lake Basin. Sustainability 2019, 11, 3513. [Google Scholar] [CrossRef] [Green Version]
- Li, F.; Wang, L.; Chen, Z.; Clarke, K.C.; Li, M.; Jiang, P. Extending the SLEUTH model to integrate habitat quality into urban growth simulation. J. Environ. Manag. 2018, 217, 486–498. [Google Scholar] [CrossRef] [PubMed] [Green Version]
- Sun, X.; Jiang, Z.; Liu, F.; Zhang, D. Monitoring spatio-temporal dynamics of habitat quality in Nansihu Lake basin, eastern China, from 1980 to 2015. Ecol. Indic. 2019, 102, 716–723. [Google Scholar] [CrossRef]
- Seabrook, L.; Mcalpine, C.; Rhodes, J.; Baxter, G.; Bradley, A.; Lunney, D. Determining range edges: Habitat quality, climate or climate extremes? Divers. Distrib. 2014, 20, 95–106. [Google Scholar] [CrossRef]
- Tallis, H.; Ricketts, T.; Nelson, E.; Ennaanay, D. InVEST 1.005 Beta Users Guide; The Natural Capital Project; Stanford University: Stanford, CA, USA, 2009. [Google Scholar]
- Pan, Y.; Ying, Z.; Li, H.; Liu, C.; Zhang, X.; Guan, B.; Liu, Y.; He, L.; Ge, G. Landscape Patterns and Their Changes of Poyang Lake Wetlands under Hydrological Process and Sand Mining Activities. Chin. J. Wetl. Sci. 2019, 17, 286–294. [Google Scholar] [CrossRef]
- Liu, C.; Wang, C. Spatio-temporal evolution characteristics of habitat quality in the Loess Hilly Region based on land use change: A case study in Yuzhong County. Shengtai Xuebao/Acta Ecol. Sin. 2018, 38, 7300–7311. [Google Scholar] [CrossRef]
- Zhu, C.; Zhang, X.; Zhou, M.; He, S.; Gan, M.; Yang, L.; Wang, K. Impacts of urbanization and landscape pattern on habitat quality using OLS and GWR models in Hangzhou, China. Ecol. Indic. 2020, 117, 106654. [Google Scholar] [CrossRef]
- Choi, Y.; Lim, C.H.; Chung, H.I.; Kim, Y.; Cho, H.J.; Hwang, J.; Kraxner, F.; Biging, G.S.; Lee, W.K.; Chon, J.; et al. Forest management can mitigate negative impacts of climate and land-use change on plant biodiversity: Insights from the Republic of Korea. Environ. Manag. 2021, 288, 112400. [Google Scholar] [CrossRef]
- Chape, S.; Harrison, J.; Spalding, M.; Lysenko, I. Measuring the extent and effectiveness of protected areas as an indicator for meeting global biodiversity targets. Philos. Trans. R. Soc. B Biol. Sci. 2005, 360, 443–455. [Google Scholar] [CrossRef] [Green Version]
- Dutta, S.; Dutta, I.; Das, A.; Guchhait, S.K. Quantification and mapping of fragmented forest landscape in dry deciduous forest of Burdwan Forest Division, West Bengal, India. Trees For. People 2020, 2, 100012. [Google Scholar] [CrossRef]
- Gu, X.; Long, A.; Liu, G.; Yu, J.; Wang, H.; Yang, Y.; Zhang, P. Changes in Ecosystem Service Value in the 1 km Lakeshore Zone of Poyang Lake from 1980 to 2020. Land 2021, 10, 951. [Google Scholar] [CrossRef]


| Threat Factor | Maximum Distance | Weight | Spatial Decay Type |
|---|---|---|---|
| Farmland | 1.5 | 0.6 | Linear |
| Rural Resident Land | 2.5 | 0.4 | Exponential |
| Urban Land | 6 | 0.8 | Exponential |
| Other Construction Land | 4 | 0.5 | Exponential |
| Highway | 6 | 0.6 | Linear |
| Railway | 5 | 0.3 | Linear |
| Landscape Types | Habitat Suitability | Farmland | Rural Resident Land | Urban Land | Other Construction Land | Highway | Railway |
|---|---|---|---|---|---|---|---|
| Farmland | 0.4 | 0 | 0.35 | 0.5 | 0.3 | 0.5 | 0.5 |
| Woodland | 1 | 0.8 | 0.85 | 1 | 0.8 | 0.9 | 0.8 |
| Grassland | 0.6 | 0.5 | 0.35 | 0.6 | 0.5 | 0.7 | 0.7 |
| Waters | 1 | 0.7 | 0.75 | 0.9 | 0.9 | 0.75 | 0.6 |
| Construction Land | 0 | 0 | 0 | 0 | 0 | 0 | 0 |
| Unutilized Land | 0 | 0 | 0 | 0 | 0 | 0 | 0 |
| Period | Landscape Types | Farmland | Woodland | Grassland | Waters | Construction Land | Unutilized Land | Transfer Out | Net Transfer Out |
|---|---|---|---|---|---|---|---|---|---|
| 1995~2005 | Farmland | 305,595 | 1238 | 916 | 32,878 | 47,612 | 1166 | 83,811 | 58,403 |
| Woodland | 4202 | 99,495 | 334 | 1423 | 14,291 | 54 | 20,304 | 17,475 | |
| Grassland | 310 | 662 | 7227 | 444 | 603 | 0 | 2019 | 656 | |
| Waters | 14,146 | 778 | 112 | 93,473 | 5588 | 1261 | 21,885 | −16,657 | |
| Construction land | 3551 | 82 | 1 | 2118 | 43,069 | 2837 | 8589 | −59,513 | |
| Unutilized land | 3200 | 69 | 0 | 1679 | 8 | 26,124 | 4956 | −362 | |
| Transfer in | 25,408 | 2829 | 1363 | 38,542 | 68,102 | 5318 | |||
| 2005~2015 | Farmland | 318,526 | 9873 | 659 | 11,669 | 46,976 | 43 | 69,220 | 35,344 |
| Woodland | 15,814 | 93,681 | 642 | 463 | 6518 | 6 | 23,443 | 8893 | |
| Grassland | 805 | 1714 | 4921 | 93 | 49 | 0 | 2661 | 781 | |
| Waters | 9033 | 2631 | 98 | 86,935 | 3368 | 9548 | 24,678 | 1822 | |
| Construction land | 8169 | 331 | 46 | 4179 | 47,333 | 32 | 12,756 | −44,235 | |
| Unutilized land | 54 | 1 | 434 | 6453 | 81 | 25,352 | 7025 | −2604 | |
| Transfer in | 33,876 | 14,550 | 1879 | 22,857 | 56,992 | 9629 |
| Grade | Value Range | Description |
|---|---|---|
| Low | 0~0.2 | Poor habitat quality |
| Relatively low | 0.2~0.3 | Relatively poor habitat quality |
| Medium | 0.3~0.4 | Medium habitat quality |
| Relatively high | 0.4~0.8 | Relatively high habitat quality |
| High | 0.8~1 | High habitat quality |
| Grade | 1995 | 2005 | 2015 | |||
|---|---|---|---|---|---|---|
| Area | Percentage | Area | Percentage | Area | Percentage | |
| Low | 6.1491 | 8.56 | 8.3151 | 11.57 | 9.2899 | 12.93 |
| Relatively low | 39.5481 | 55.05 | 37.4760 | 52.16 | 37.1181 | 51.66 |
| Medium | 2.2179 | 3.09 | 1.5215 | 2.12 | 1.7134 | 2.38 |
| Relatively high | 0.9609 | 1.34 | 0.9260 | 1.29 | 0.7484 | 1.04 |
| High | 22.9699 | 31.97 | 23.6073 | 32.86 | 22.9761 | 31.98 |
| Grade | 2015 | 2025 by CA-Markov | 2025 by CA-Markov | |||
|---|---|---|---|---|---|---|
| Area | Percentage | Area | Percentage | Area | Percentage | |
| Low | 9.2899 | 12.93 | 14.1289 | 19.67 | 12.2113 | 17.00 |
| Relatively low | 37.1181 | 51.66 | 33.5012 | 46.63 | 34.4019 | 47.88 |
| Medium | 1.7134 | 2.38 | 1.7451 | 2.43 | 2.1673 | 3.02 |
| Relatively high | 0.7484 | 1.04 | 0.6250 | 0.87 | 0.6750 | 0.94 |
| High | 22.9761 | 31.98 | 21.8461 | 30.41 | 22.3909 | 31.17 |
Publisher’s Note: MDPI stays neutral with regard to jurisdictional claims in published maps and institutional affiliations. |
© 2021 by the authors. Licensee MDPI, Basel, Switzerland. This article is an open access article distributed under the terms and conditions of the Creative Commons Attribution (CC BY) license (https://creativecommons.org/licenses/by/4.0/).
Share and Cite
Li, Y.; Duo, L.; Zhang, M.; Wu, Z.; Guan, Y. Assessment and Estimation of the Spatial and Temporal Evolution of Landscape Patterns and Their Impact on Habitat Quality in Nanchang, China. Land 2021, 10, 1073. https://doi.org/10.3390/land10101073
Li Y, Duo L, Zhang M, Wu Z, Guan Y. Assessment and Estimation of the Spatial and Temporal Evolution of Landscape Patterns and Their Impact on Habitat Quality in Nanchang, China. Land. 2021; 10(10):1073. https://doi.org/10.3390/land10101073
Chicago/Turabian StyleLi, Yanan, Linghua Duo, Ming Zhang, Zhenhua Wu, and Yanjun Guan. 2021. "Assessment and Estimation of the Spatial and Temporal Evolution of Landscape Patterns and Their Impact on Habitat Quality in Nanchang, China" Land 10, no. 10: 1073. https://doi.org/10.3390/land10101073
APA StyleLi, Y., Duo, L., Zhang, M., Wu, Z., & Guan, Y. (2021). Assessment and Estimation of the Spatial and Temporal Evolution of Landscape Patterns and Their Impact on Habitat Quality in Nanchang, China. Land, 10(10), 1073. https://doi.org/10.3390/land10101073