
South Africa’s Red List of Terrestrial Ecosystems (RLEs)


Abstract
:1. Introduction
2. Materials and Methods
2.1. Core Assessment
2.1.1. Criteria A2b and A3–Historical and Future Reductions in Geographic Range
2.1.2. Criteria B1(i) and B2(i)–Restricted Geographic Range and Ongoing Decline
2.2. Supplementary Assessments
Criteria B1(iii)s and B2(iii)s–Restricted Geographic Range and Species Threats
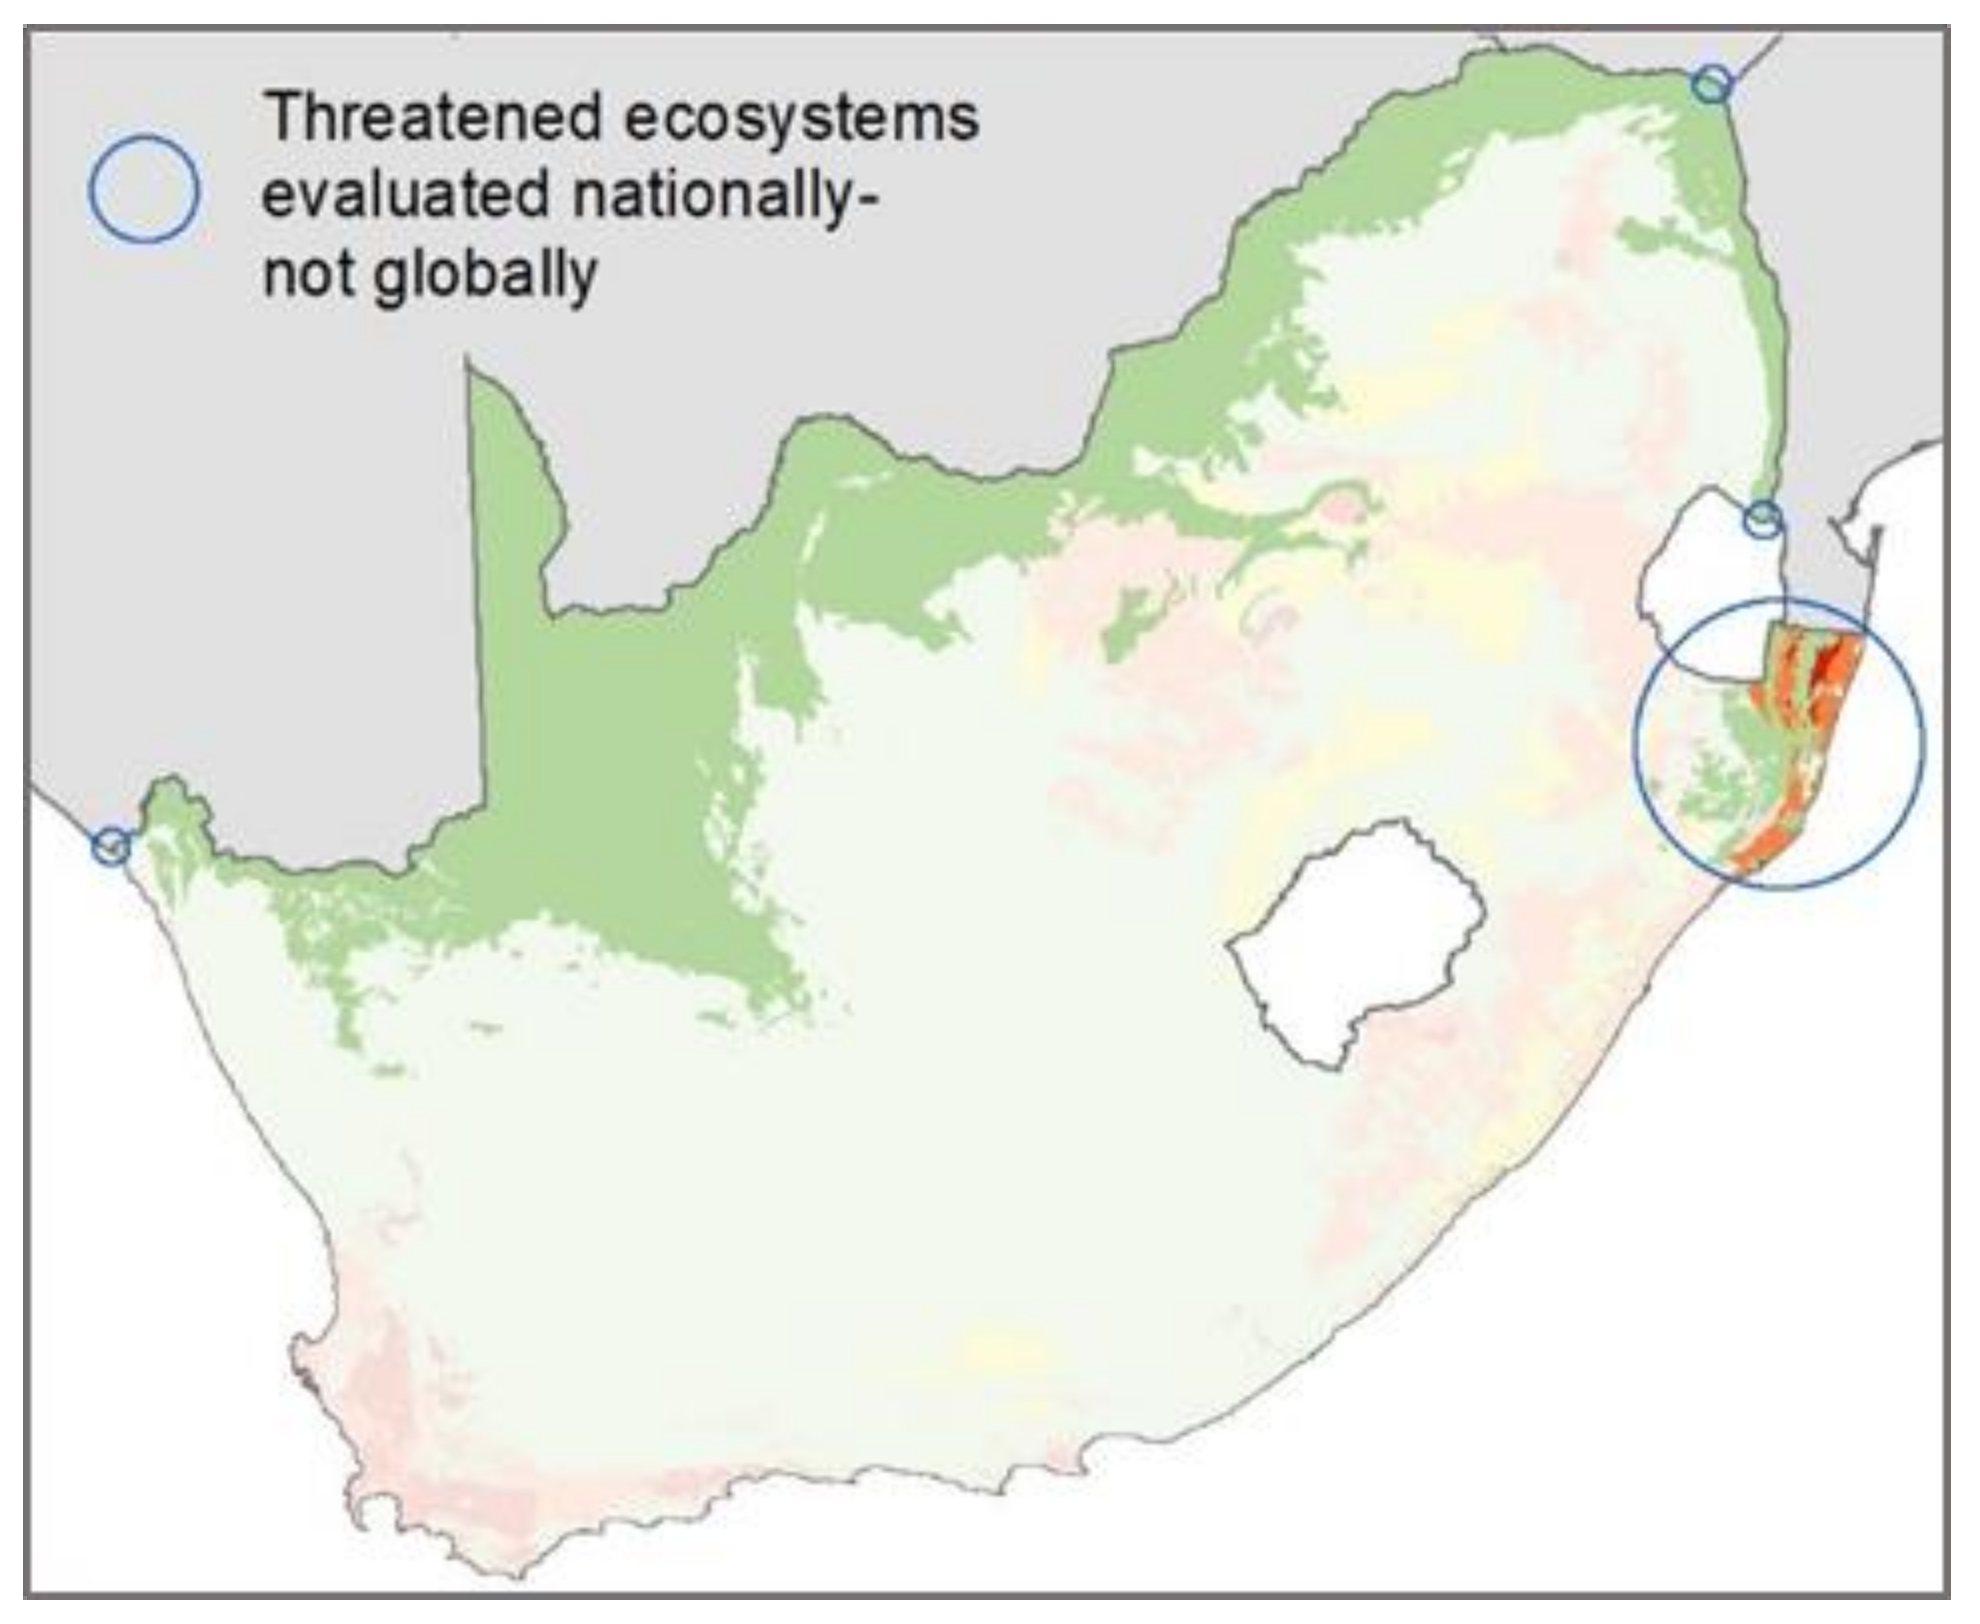
2.3. National vs. Global Scope of Assessments
3. Results
3.1. Overall Results
3.2. Results per Biome
3.3. Triggering Criteria
3.4. Global vs. National Assessments
4. Discussion
4.1. Threatened Ecosystems in South Africa
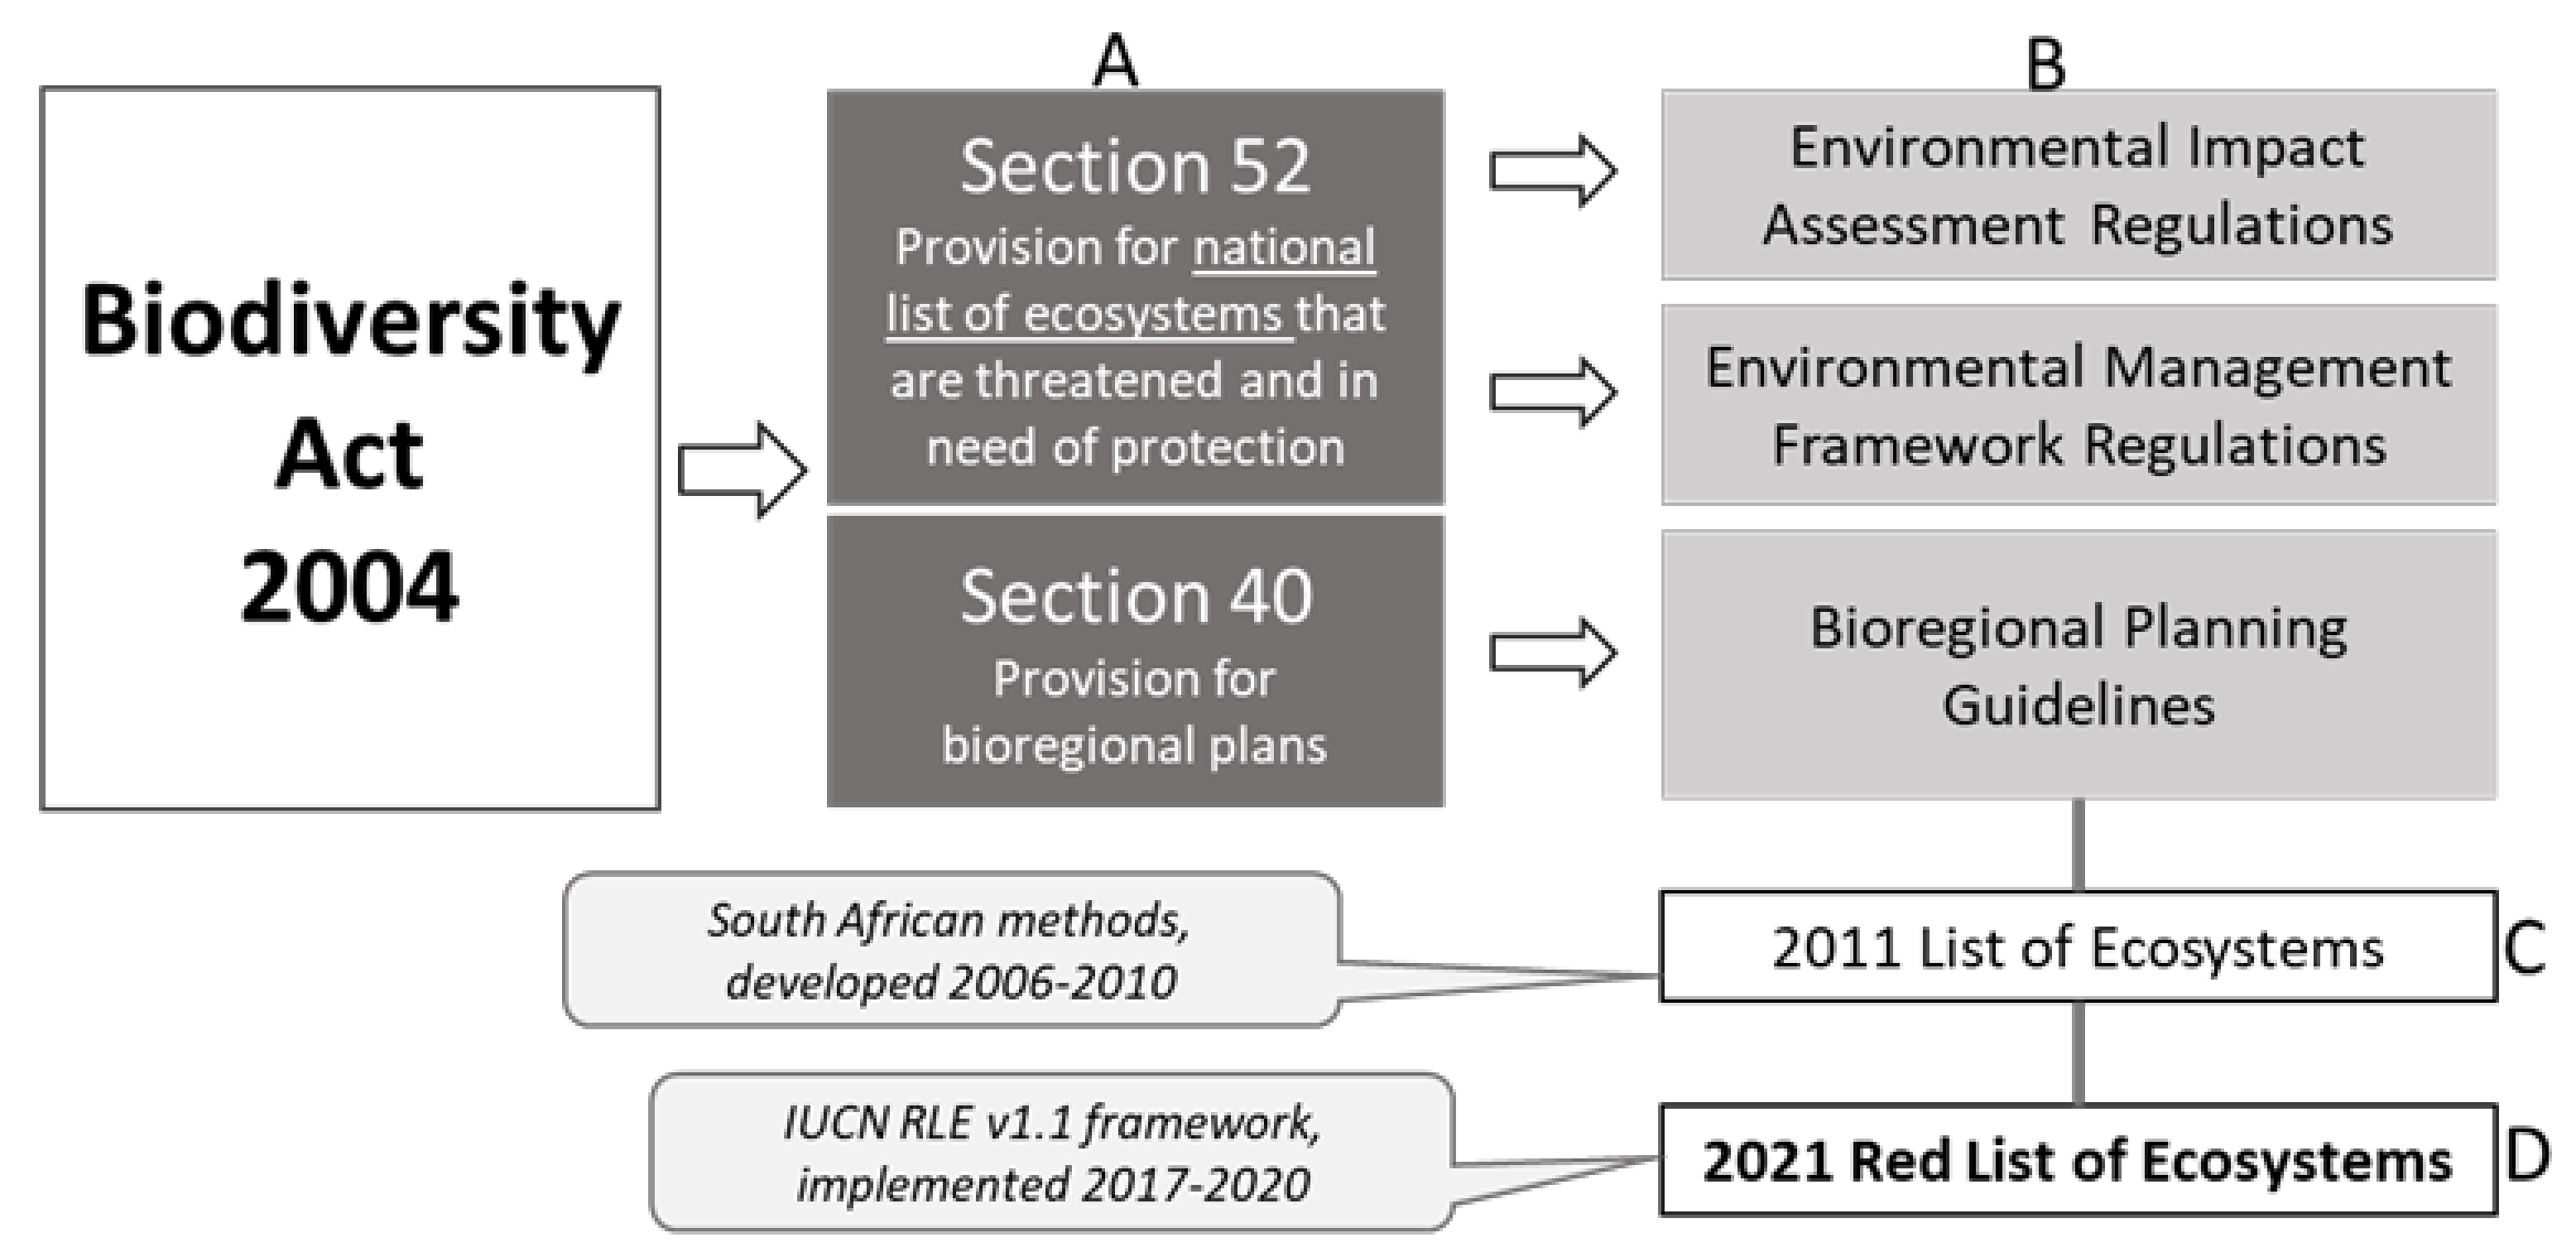
4.2. Moving from a Technical Assessment to a Policy-Relevant Conservation Tool
4.3. Lessons and Future Research
5. Conclusions
Supplementary Materials
Author Contributions
Funding
Institutional Review Board Statement
Informed Consent Statement
Data Availability Statement
Acknowledgments
Conflicts of Interest
National Terrestrial Ecosystem Data
References
- Nicholson, E.; Watermeyer, K.E.; Rowland, J.A.; Sato, C.F.; Stevenson, S.; Andrade, A.; Brooks, T.M.; Burgess, N.D.; Cheng, S.; Grantham, H.; et al. Scientific foundations for an ecosystem goal, milestones and indicators for the post-2020 Global Biodiversity Framework. Nat. Ecol. Evol. 2021, 5, 1338–1349. [Google Scholar] [CrossRef] [PubMed]
- Keith, D.A.; Rodríguez, J.P.; Rodríguez-Clark, K.M.; Nicholson, E.; Aapala, K.; Alonso, A.; Asmussen, M.; Bachman, S.; Basset, A.; Barrow, E.G.; et al. Scientific Foundations for an IUCN Red List of Ecosystems. PLoS ONE 2013, 8, e62111. [Google Scholar] [CrossRef] [PubMed] [Green Version]
- Bland, L.M.; Nicholson, E.; Miller, R.M.; Andrade, A.; Carré, A.; Etter, A.; Ferrer-Paris, J.R.; Herrera, B.; Kontula, T.; Lindgaard, A.; et al. Impacts of the IUCN Red List of Ecosystems on conservation policy and practice. Conserv. Lett. 2019, 12, e12666. [Google Scholar] [CrossRef] [Green Version]
- Alaniz, A.J.; Pérez-Quezada, J.F.; Galleguillos, M.; Vásquez, A.E.; Keith, D.A. Operationalizing the IUCN Red List of Ecosystems in public policy. Conserv. Lett. 2019, 12, e12665. [Google Scholar] [CrossRef] [Green Version]
- Noss, R.F. Indicators for Monitoring Approach Biodiversity: A Hierarchical Approach. Conserv. Biol. 1990, 4, 355–364. [Google Scholar] [CrossRef]
- Rodríguez, J.P.; Rodríguez-Clark, K.M.; Baillie, J.E.M.; Ash, N.; Benson, J.; Boucher, T.; Brown, C.; Burgess, N.D.; Collen, B.; Jennings, M.; et al. Establishing IUCN Red List Criteria for Threatened Ecosystems. Conserv. Biol. 2011, 25, 21–29. [Google Scholar] [CrossRef] [PubMed] [Green Version]
- Bland, L.M.; Keith, D.A.; Miller, R.M.; Rodríguez, J.P.; Murray, N.J. Guidelines for the Application of IUCN Red List of Ecosystems Categories and Criteria, Version 1.1; IUCN: Gland, Switzerland, 2017. [Google Scholar]
- RSA. National List of Ecosystems That Are Threatened and in Need of Protection; Government Gazette 34809; Government Printers: Pretoria, South Africa, 2011.
- Botts, E.; Skowno, A.; Driver, A.; Holness, S.; Maze, K.; Smith, T.; Daniels, F.; Desmet, P.; Sink, K.; Botha, M.; et al. More than just a (red) list: Over a decade of using South Africa’s threatened ecosystems in policy and practice. Biol. Conserv. 2020, 246, e108559. [Google Scholar] [CrossRef]
- Skowno, A.L.; Jewitt, D.; Slingsby, J.A. Rates and patterns of habitat loss across South Africa’s vegetation biomes. S. Afr. J. Sci. 2021, 117, 8182. [Google Scholar] [CrossRef]
- Dayaram, A.; Harris, L.R.; Grobler, B.A.; van der Merwe, S.; Rebelo, A.G.; Powrie, L.W.; Vlok, J.H.J.; Desmet, P.G.; Qabaqaba, M.; Hlahane, K.M.; et al. Vegetation map of South Africa, Lesotho and Swaziland 2018: A description of changes since 2006. Bothalia 2019, 49, 1–11. [Google Scholar] [CrossRef]
- Boitani, L.; Mace, G.M.; Rondinini, C.; Universit, V. Challenging the Scientific Foundations for an IUCN Red List of Ecosystems. Conserv. Lett. 2015, 8, 125–131. [Google Scholar] [CrossRef]
- Bland, L.M.; Regan, T.J.; Dinh, M.N.; Ferrari, R.; Keith, D.A.; Lester, R.; Mouillot, D.; Murray, N.J.; Nguyen, H.A.; Nicholson, E. Using multiple lines of evidence to assess the risk of ecosystem collapse. Proc. R. Soc. B Biol. Sci. 2017, 284, 20170660. [Google Scholar] [CrossRef] [PubMed] [Green Version]
- Mucina, L.; Rutherford, M.C. The Vegetation of South Africa, Lesotho and Swaziland; Mucina, L., Rutherford, M.C., Eds.; Strelitzia; South African National Biodiversity Institute: Pretoria, South Africa, 2006; ISBN 978-1-919976-21-1. [Google Scholar]
- GeoTerraImage. Technical Report: 2013/2014 South African National Land Cover Dataset Version 5; GeoTerraImage: Pretoria, South Africa, 2015. [Google Scholar]
- GeoTerraImage. Technical Report: 1990 South African National Land Cover Dataset Version 5.2; GeoTerraImage: Pretoria, South Africa, 2015. [Google Scholar]
- GeoTerraImage. Technical Report: 2018 South African National Land Cover Dataset Version 4; GeoTerraImage: Pretoria, South Africa, 2019. [Google Scholar]
- SANBI. Red List of South African Plants Version 2020.1. Available online: http://redlist.sanbi.org (accessed on 21 June 2020).
- SANBI. Final Vegetation Map of South Africa, Lesotho and Swaziland [Vector]. 2018. Available online: http://bgis.sanbi.org/Document/Download/5488 (accessed on 21 June 2020).
- City of Cape Town Current Indigenous Vegetation Shapefile. Available online: https://web1.capetown.gov.za/web1/opendataportal (accessed on 21 June 2020).
- Stewart, W.I.; Jorgensen, P.J. Updating of Systematic Biodiversity Plan and Development and Publication of Bioregional Plan for the Nelson Mandela Bay Municipality: NMBM 2015 Landcover; SRK Consulting: Port Elizabeth, South Africa, 2016. [Google Scholar]
- Ezemvelo KZN Wildlife; GeoTerraImage. Updating the Existing KZN Provincial Land-Cover Map (2011) to 2017: Data Users Report and Metadata (Version 006); Ezemvelo KZN Wildlife: Cascades, South Africa, 2018. [Google Scholar]
- GeoTerraImage. Mpumalanga Provincial Land Cover (2017 Sentinel 2 Imagery; 10m Raster Dataset); GeoTerraImage: Pretoria, South Africa, 2018. [Google Scholar]
- Pence, G.Q. Western Cape Biodiversity Spatial Plan: Technical Report; Western Cape Nature Conservation Board: Cape Town, South Africa, 2017. [Google Scholar]
- Lloyd, J.W.; Van den Berg, E.; Palmer, A. Patterns of Transformation and Degradation in the Thicket Biome; Agricultural Research Council: Port Elizabeth, South Africa, 2002. [Google Scholar]
- R Core Team. R: A Language and Environment for Statistical Computing; R Foundation For Statistical Computing: Vienna, Austria, 2014. [Google Scholar]
- Lee, C.K.F.; Keith, D.A.; Nicholson, E.; Murray, N.J. Redlistr: Tools for the IUCN Red Lists of ecosystems and threatened species in R. Ecography 2019, 42, 1050–1055. [Google Scholar] [CrossRef] [Green Version]
- Keith, D.A.; Ferrer-paris, J.R.; Nicholson, E.; Kingsford, R.T. IUCN Global Ecosystem Typology 2.0: Descriptive Profiles for Biomes and Ecosystem Functional Groups; IUCN: Gland, Switzerland, 2020; ISBN 9782831720777. [Google Scholar]
- Van Deventer, H.; Adams, J.B.; Durand, J.F.; Grobler, R.; Grundling, P.L.; Janse van Rensburg, S.; Jewitt, D.; Kelbe, B.; MacKay, C.F.; Naidoo, L.; et al. Conservation conundrum – Red listing of subtropical-temperate coastal forested wetlands of South Africa. Ecol. Indic. 2021, 130, 108077. [Google Scholar] [CrossRef]
- Rebelo, T.; Boucher, C.; Helme, N.; Mucina, L.; Rutherford, M.; Smit, W.; Powrie, L.; Ellis, F.; Lambrechts, J.; Scott, L.; et al. Fynbos Biome. In The Vegetation of South Africa, Lesotho and Swaziland; Mucina, L., Rutherford, M., Eds.; Strelitzia 19; South African National Biodiversity Institute: Pretoria, South Africa, 2006; pp. 53–219. ISBN 1-919976-21-3. [Google Scholar]
- Botts, E.A.; Pence, G.; Holness, S.; Sink, K.; Skowno, A.; Driver, A.; Harris, L.R.; Desmet, P.; Escott, B.; Lötter, M.; et al. Practical actions for applied systematic conservation planning. Conserv. Biol. 2019, 33, 1235–1246. [Google Scholar] [CrossRef] [PubMed]
- Rowland, J.A.; Bland, L.M.; Keith, D.A.; Juffe-Bignoli, D.; Burgman, M.A.; Ferrer-Paris, J.R.; Miller, R.M.; Skowno, A.L.; Nicholson, E. Ecosystem indices to support global biodiversity conservation. Conserv. Lett. 2019, 13, e12680. [Google Scholar] [CrossRef]
- Roelfsema, C.M.; Lyons, M.; Murray, N.; Kovacs, E.M.; Kennedy, E.; Markey, K.; Borrego-Acevedo, R.; Ordoñez Alvarez, A.; Say, C.; Tudman, P.; et al. Workflow for the Generation of Expert-Derived Training and Validation Data: A View to Global Scale Habitat Mapping. Front. Mar. Sci. 2021, 8, 643381. [Google Scholar] [CrossRef]
- Lee, C.K.F.; Nicholson, E.; Duncan, C.; Murray, N.J. Estimating changes and trends in ecosystem extent with dense time-series satellite remote sensing. Conserv. Biol. 2021, 35, 325–335. [Google Scholar] [CrossRef]


| Assessment | Dataset | Description | Reference |
|---|---|---|---|
| All assessments | Terrestrial ecosystem type map | Vegetation map of South Africa, Lesotho and Swaziland 2018 v 22.7. Polygon feature geodatabase developed and curated by South African National Biodiversity Institute. | [11,14,19] |
| Criteria A3, A2b, B1, B2 | National land cover | Land cover change raster based on national land cover products; with modifications for tracking habitat loss and identifying secondary vs. primary natural areas. | [10,16,17] |
| Supplementary: Criterion A3 using alternative data and Criterion D3 and D1 | City of Cape Town natural vegetation remnants map | 2018 Vegetation remnants map produced by City of Cape Town based on remote sensing and in-field validation of condition. Provided as a polygon feature geodatabase. | [20] |
| Nelson Mandel Bay Metro land cover | Natural areas map from the municipal bioregional planning process, with combination of desk top and field validated ecological condition. Provided as a polygon shapefile. | [21] | |
| KwaZulu-Natal land cover | 2017 provincial raster land cover product (20m resolution raster) validated by provincial conservation authorities. | [22] | |
| Mpumalanga land cover | 2017 provincial raster land cover product (10m resolution raster) validated by provincial conservation authorities. | [23] | |
| Western Cape land cover | 2016 provincial raster land cover product (10m resolution raster) validated by provincial conservation authorities. | [24] | |
| Albany Thicket biome degradation data | 2002 biome-wide Landsat TM 5 based raster ecosystem degradation product (30m). Developed and field validated as part of the Subtropical Thicket Ecosystem Project (STEP) by the Agricultural Research Council. | [25] | |
| Eastern Little Karoo degradation mapping | Detailed (1:10 000) ecosystem condition mapping by Cape Nature of the Eastern Little Karoo ecosystem type | (Vlok, A., pers com) | |
| Supplementary assessment: Criteria B1(iii), B2(iii) | Invasive plants, overgrazing and disrupted fire regimes | Evidence of ongoing decline and impaired biotic function for use under Criterion B, extracted from the plant red list database 2020. | [18] |
| Criteria & Sub-Criteria Applied | CR | EN | VU | ||
|---|---|---|---|---|---|
| Criteria A: Reduced geographic distribution | |||||
| Sub-criterion A2b–Reductions in extent over a 50 year period including past present and future. The absolute rate of decline in natural habitat between 1990 and 2018 (Equation (2) was used to estimate the reduction in ecosystem extent between 1990 and 2040 (Equation (3). | ≥80% | ≥50% | ≥30% | ||
| Sub-criterion A3–Historical loss of habitat (since ~1750) The historical reduction in geographic extent of each ecosystem type between ~1750 and 2018 was expressed as a percentage of the original (1750) extent (Equation (1); allowing for the application of the thresholds for Criterion A3 (historical reductions in geographic range). Equivalent supplementary assessments utilised higher resolution land cover products available for KwaZulu-Natal, Mpumalanga, the Western Cape province and two large metropolitan areas. | ≥90% | ≥70% | ≥50% | ||
| Criteria B: Restricted distribution and continuing declines in geographic distribution | |||||
| Sub-criterion B1 (i) and (iii)–Extent of a minimum convex polygon (km2) enclosing all occurrences (EOO) & an observed or inferred continuing decline in spatial extent. The percentage rate of decline (Equation (4) was used to identify ecosystems with ongoing decline. A threshold of ≥0.4%/y was used for those ecosystem types that met the various EOO size thresholds for this sub-criterion B1(ii). A supplementary assessment used a comprehensive threatened plant species database to identify ecosystems with very high levels of biotic disruption (from over grazing, invasive species and inappropriate fire management) as evidence of ongoing decline. Those ecosystems below the EOO thresholds and showing ongoing decline qualified under sub-criterion B1(iii). | ≤2000 km2 | ≤20,000 km2 | ≤50,000 km2 | ||
| Sub-criterion B2 (i) and (iii)–The number of 10 × 10 km grid cells occupied (AOO) & an observed or inferred continuing decline in spatial extent. The same steps were followed as for B1 in identifying qualifying ecosystem types for this sub-criterion, but using the AOO number thresholds. | ≤2 | ≤20 | ≤50 | ||
| Criteria D: Disruption of biotic processes or interactions | |||||
| Sub-criterion D1–Disruption of biotic processes, in the last 50 years (circa 1970), based on change in a biotic variable affecting a fraction of the extent of the ecosystem and with relative severity, as indicated by the table. Ecosystem condition data from Cape Nature scientists (Vlok et al., pers com) was used to identify the extent of Eastern Little Karoo where biotic disruption was ≥80% in severity. The extent of this biotic disruption then dictates the risk category. | Extent (%) | Relative severity (%) | |||
| ≥80 | ≥50 | ≥30 | |||
| ≥80 | CR | EN | VU | ||
| ≥50 | EN | VU | |||
| ≥30 | VU | ||||
| Sub-criterion D3–Disruption of biotic processes, since 1750, based on change in a biotic variable affecting a fraction of the extent of the ecosystem and with relative severity, as indicated by the table. Ecosystem condition data from the Albany Thicket biome, KwaZulu-Natal, Mpumalanga, the Western Cape Province, the City of Cape Town and Nelson Mandela Bay Metro was used to identify the extent of each ecosystem type where biotic disruption was ≥70% in severity. The extent of this biotic disruption then dictates the risk category. | Extent (%) | Relative severity (%) | |||
| ≥90 | ≥70 | ≥50 | |||
| ≥90 | CR | EN | VU | ||
| ≥70 | EN | VU | |||
| ≥50 | VU | ||||
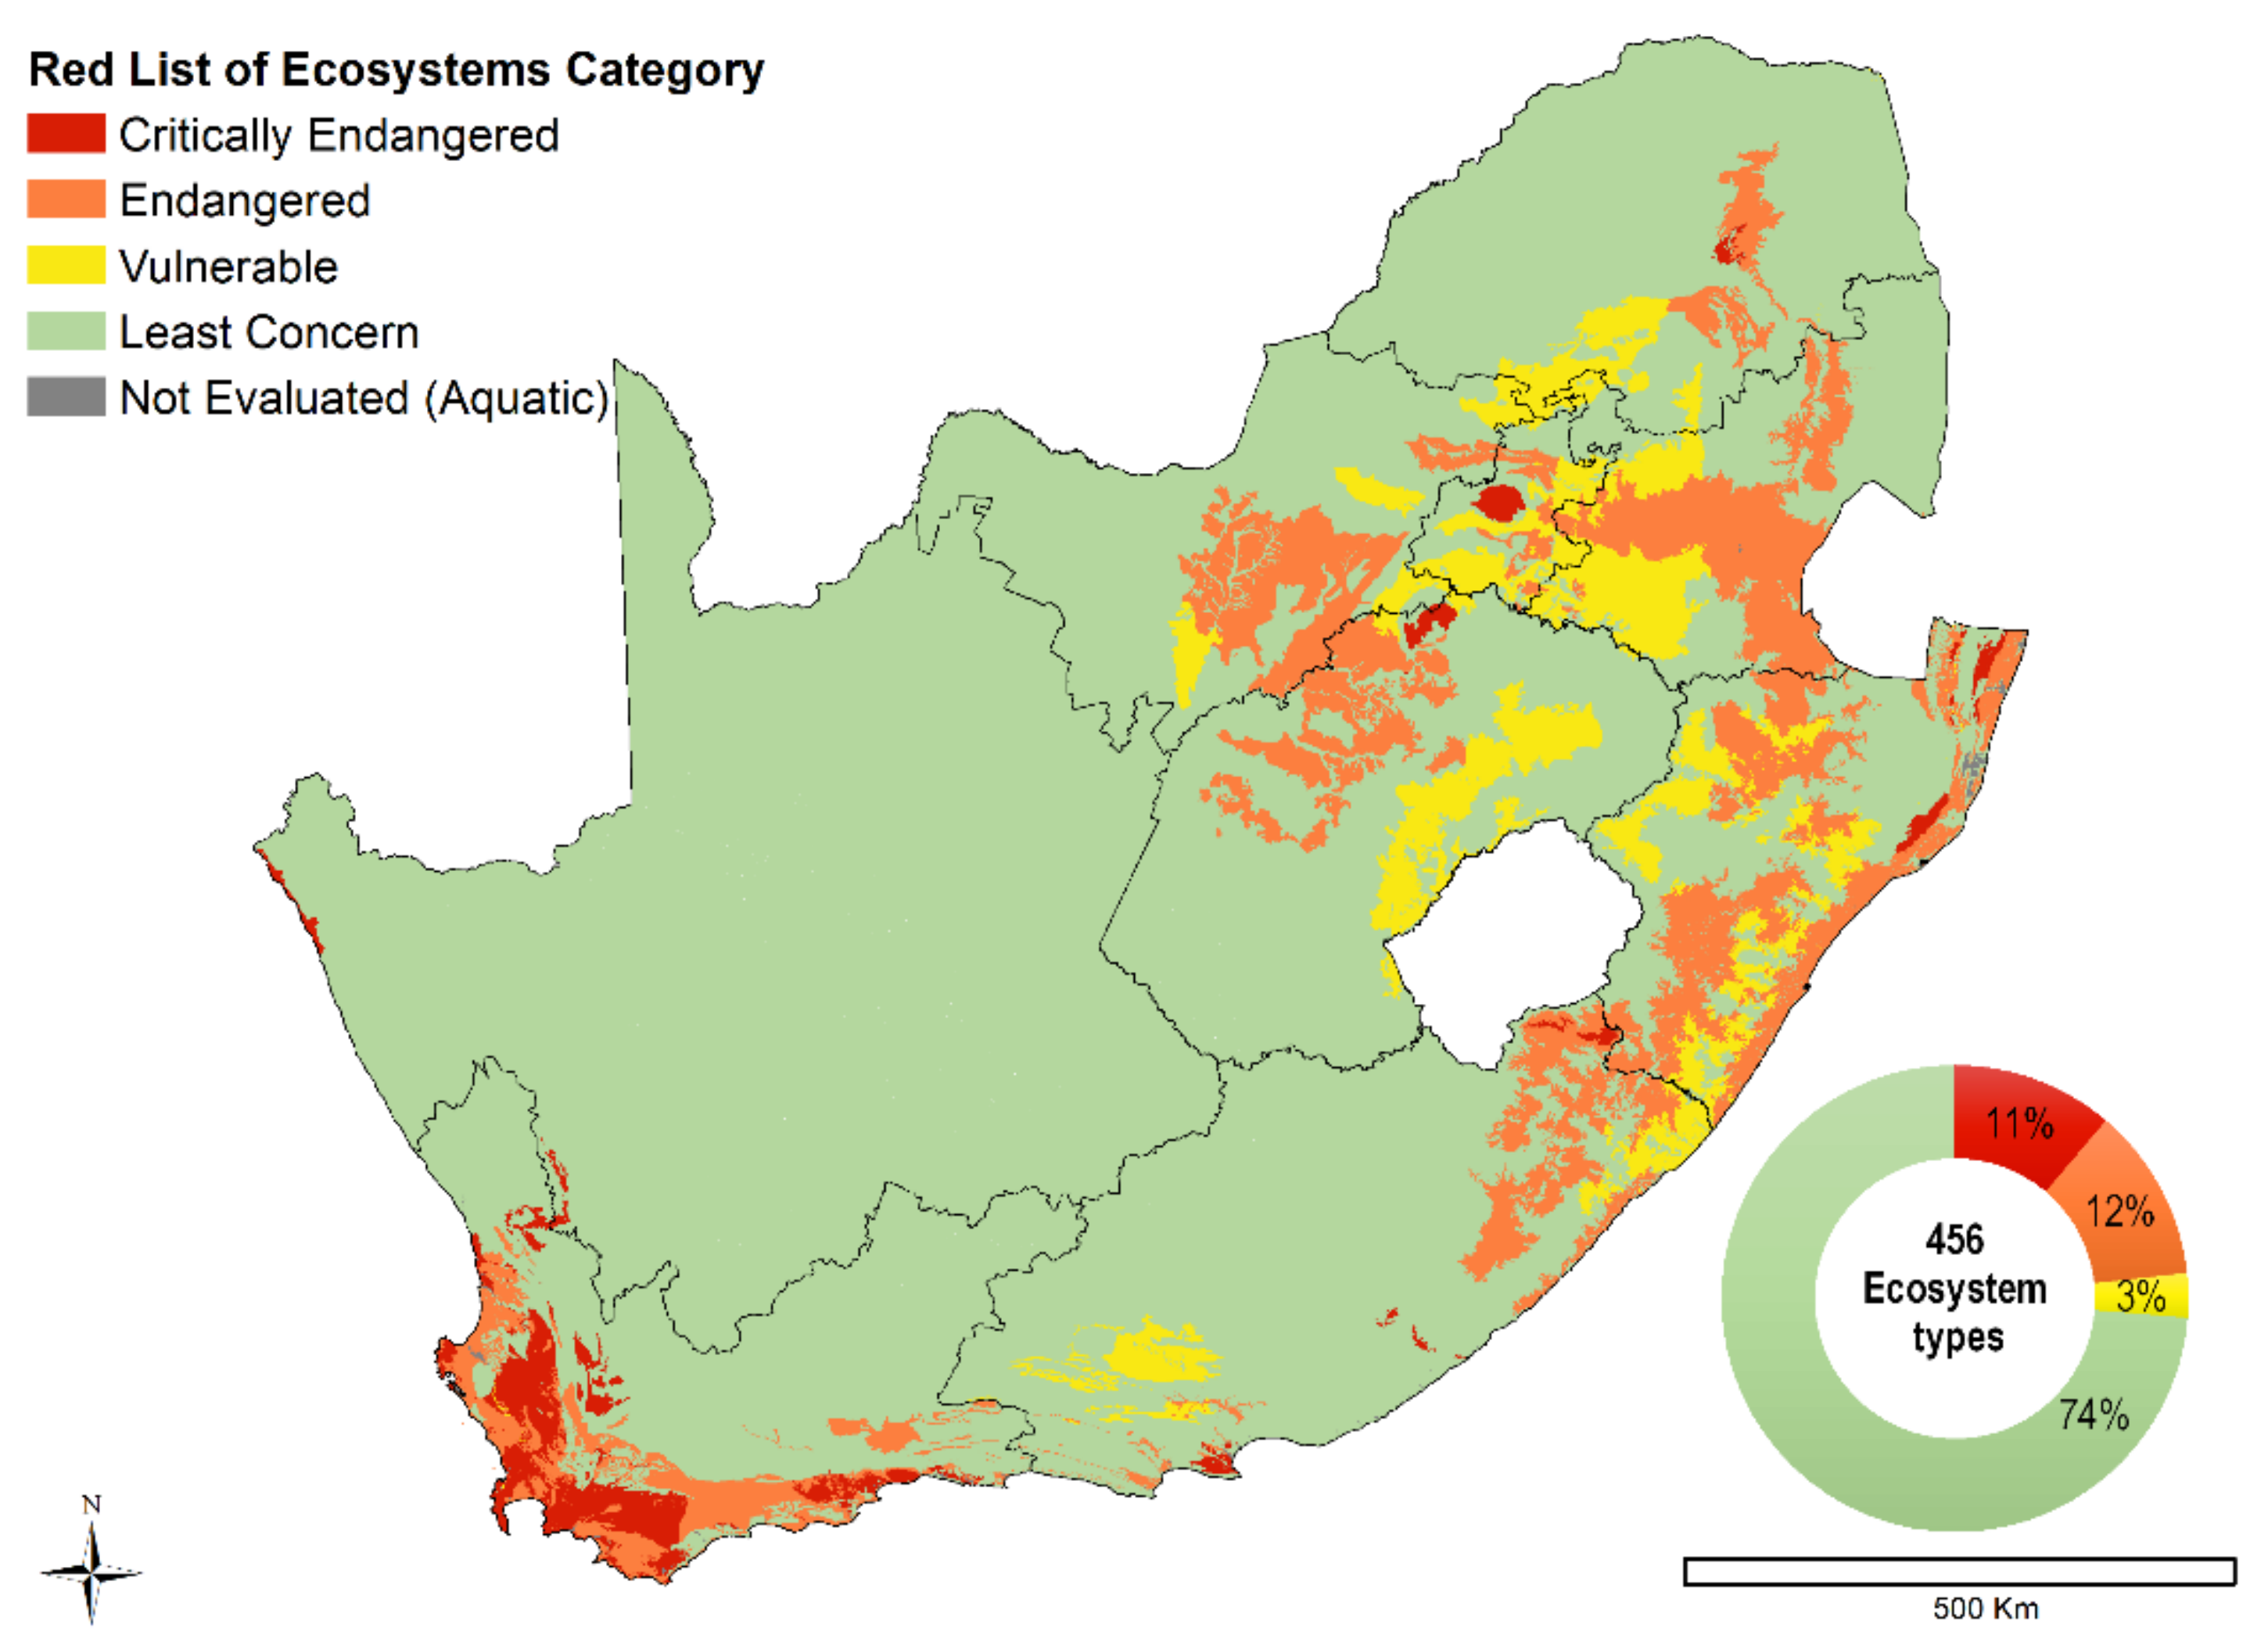
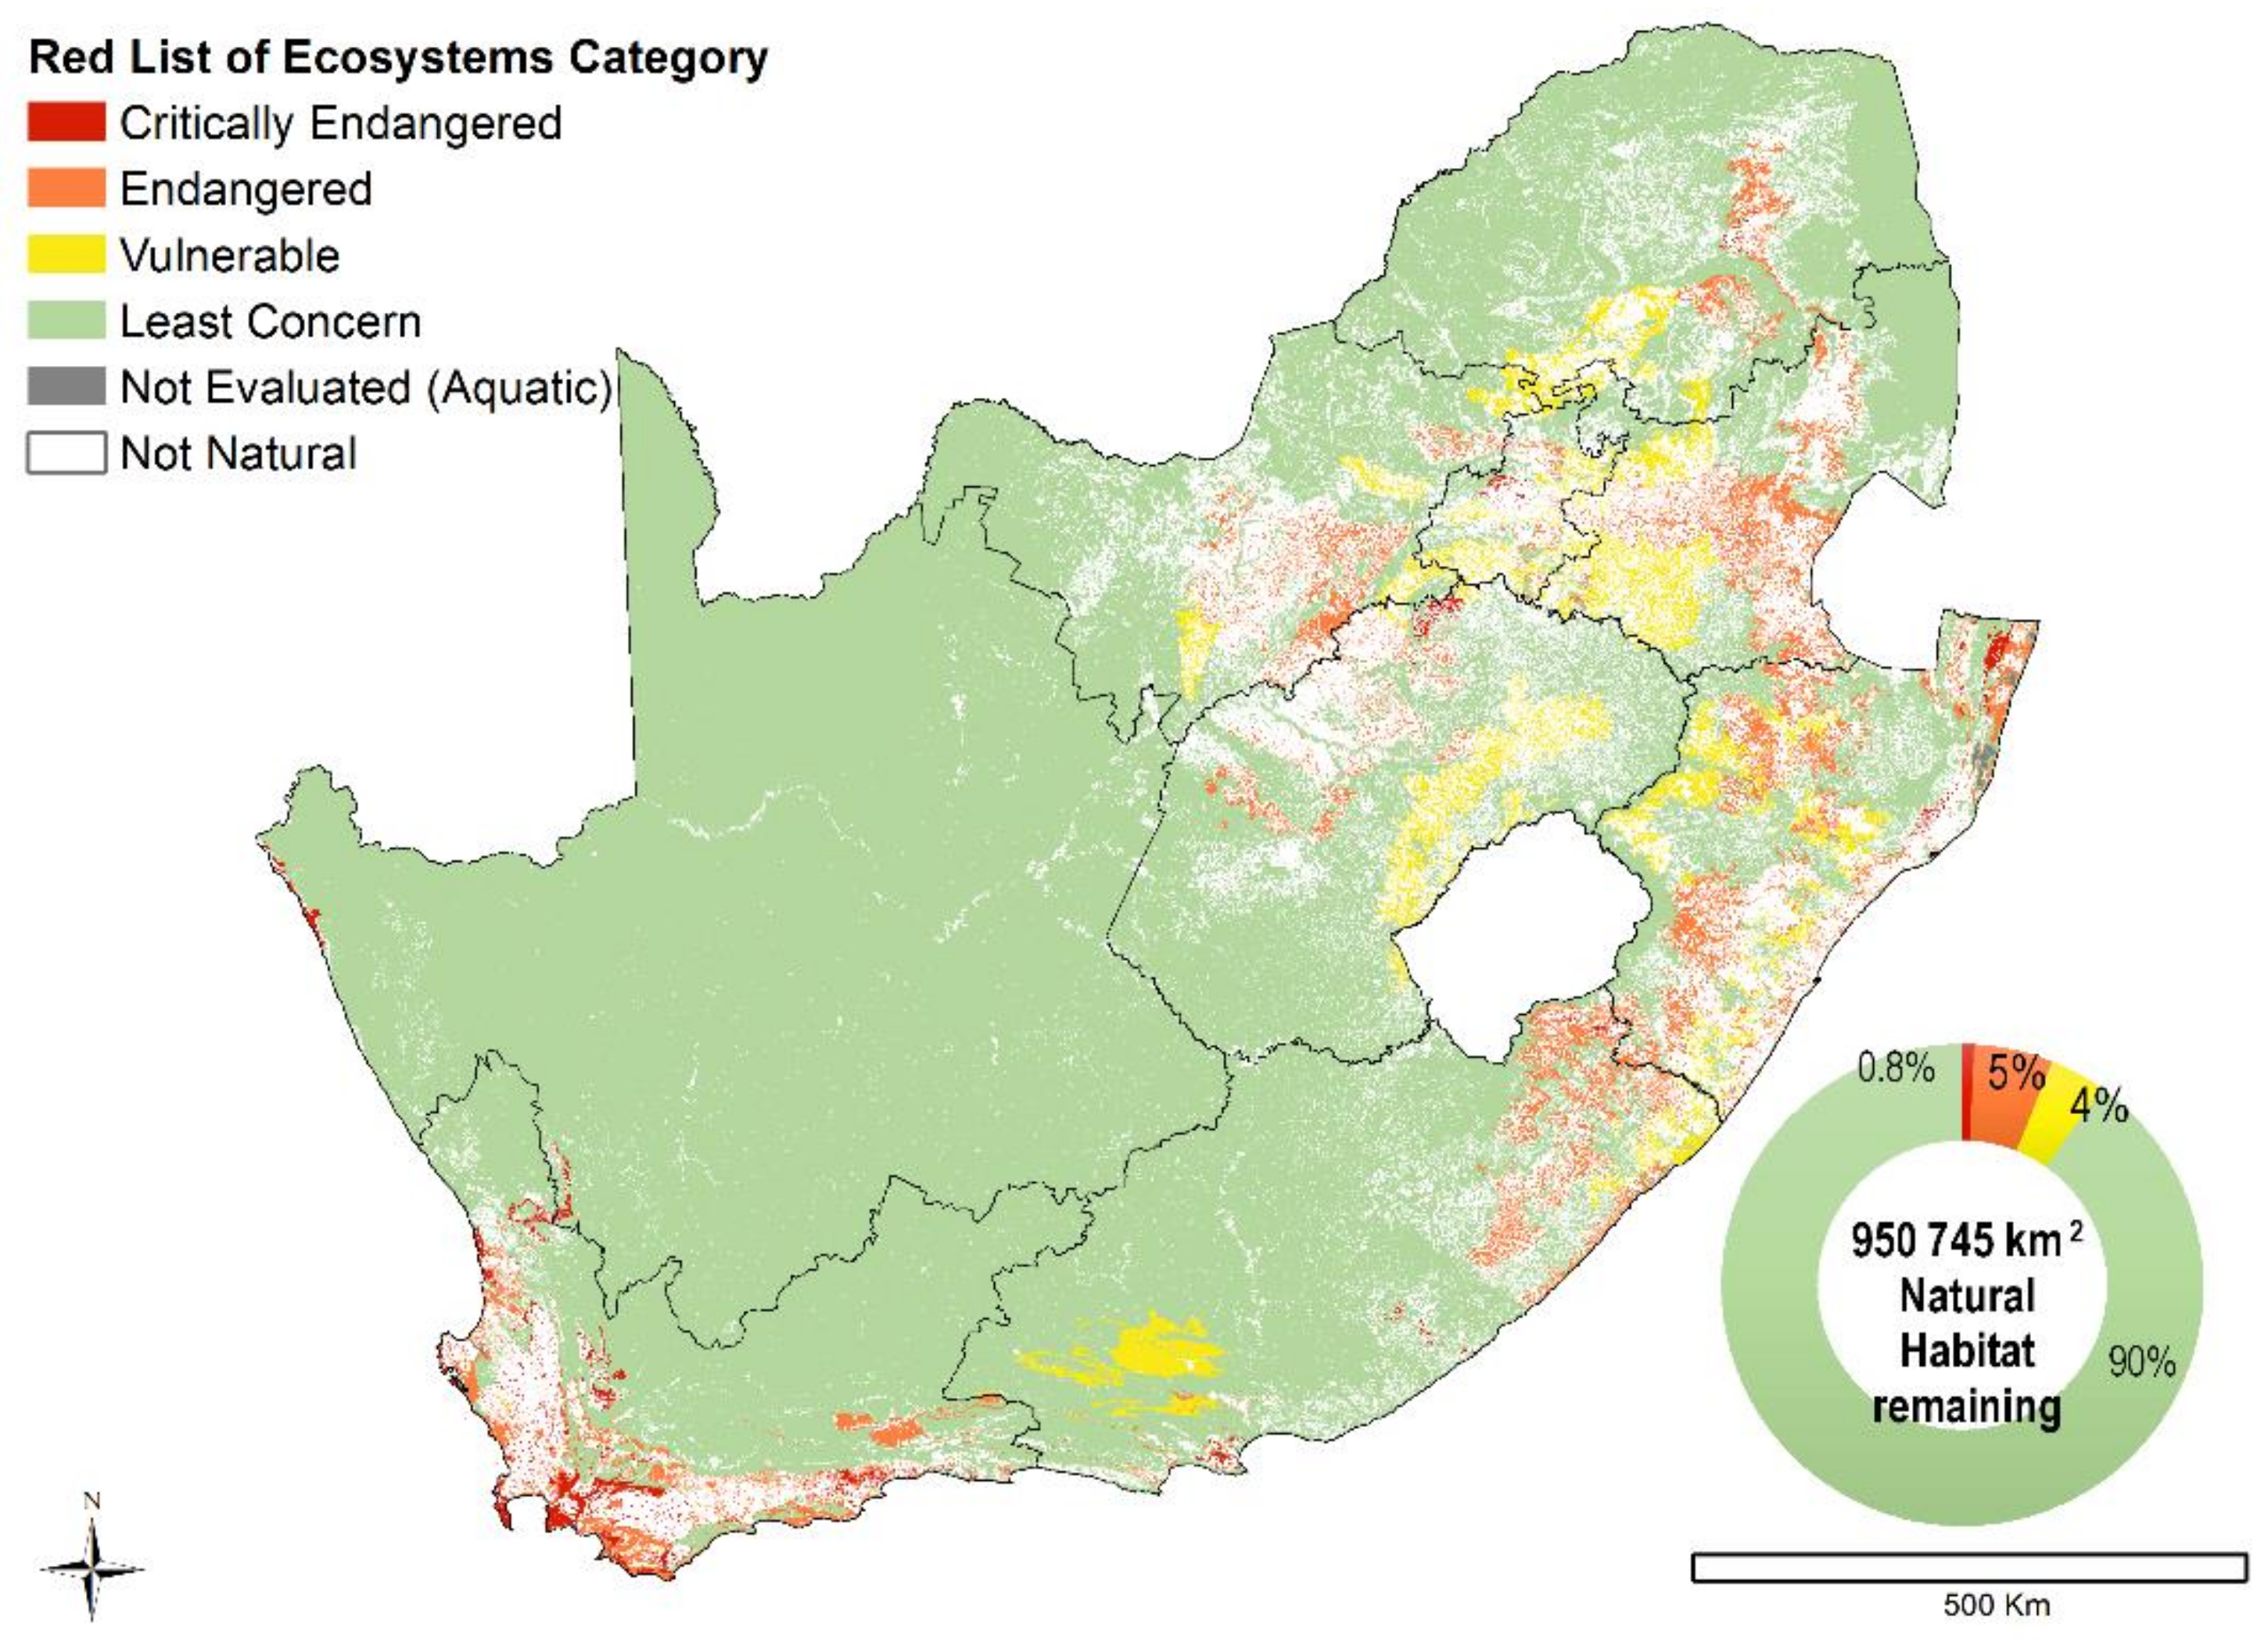
| Category (IUCN RLE) | Number of Ecosystems | Natural Extent Remaining within South Africa in 2018 (km2) | Percentage of Total Terrestrial Landmass Extent | Percentage of Total Natural Remaining Ecosystem Extent |
|---|---|---|---|---|
| Critically Endangered | 51 | 7509 | 0.62% | 0.79% |
| Endangered | 55 | 50,315 | 4.13% | 5% |
| Vulnerable | 14 | 35,346 | 2.90% | 3.72% |
| Least Concern | 336 | 857,576 | 70.39% | 90.20% |
| Total for South Africa | 456 | 950,745 | 78% | 100.00% |
| Biome | Critically Endangered | Endangered | Vulnerable | All Threatened Ecosystems | Least Concern | Grand Total |
|---|---|---|---|---|---|---|
| Azonal Vegetation | 0% (2) | 2.6% (3) | 0% (0) | 2.7% (5) | 97.3% (13) | 18 |
| Succulent Karoo | 0.6% (3) | 1.9% (1) | 0% (0) | 2.4% (4) | 97.6% (60) | 64 |
| Savanna | 0.3% (3) | 1.9% (7) | 1.7% (3) | 3.8% (13) | 96.2% (78) | 91 |
| Nama-Karoo | 0% (0) | 0% (0) | 0% (0) | 0% (0) | 100% (13) | 13 |
| Indian Ocean Coastal Belt | 0% (0) | 83.6% (5) | 16.4% (1) | 100% (6) | 0% (0) | 6 |
| Grassland | 0.5% (4) | 16.2% (14) | 12.2% (6) | 28.9% (24) | 71.1% (49) | 73 |
| Fynbos | 9.3% (33) | 13.3% (24) | 0.1% (2) | 22.7% (59) | 77.3% (63) | 122 |
| Forests | 0% (0) | 0% (0) | 2.4% (1) | 2.3% (1) | 97.6% (9) | 10 |
| Desert | 0.04% (2) | 0% (0) | 0% (0) | 0.04% (2) | 100% (13) | 15 |
| Albany Thicket | 0.9% (4) | 1.6% (1) | 17.3% (1) | 19.8% (6) | 80.2% (38) | 44 |
| Grand Total | 0.8% (51) | 5.3% (55) | 3.7% (14) | 9.8% (120) | 90.2% (338) | 456 |
Publisher’s Note: MDPI stays neutral with regard to jurisdictional claims in published maps and institutional affiliations. |
© 2021 by the authors. Licensee MDPI, Basel, Switzerland. This article is an open access article distributed under the terms and conditions of the Creative Commons Attribution (CC BY) license (https://creativecommons.org/licenses/by/4.0/).
Share and Cite
Skowno, A.L.; Monyeki, M.S. South Africa’s Red List of Terrestrial Ecosystems (RLEs). Land 2021, 10, 1048. https://doi.org/10.3390/land10101048
Skowno AL, Monyeki MS. South Africa’s Red List of Terrestrial Ecosystems (RLEs). Land. 2021; 10(10):1048. https://doi.org/10.3390/land10101048
Chicago/Turabian StyleSkowno, Andrew Luke, and Maphale Stella Monyeki. 2021. "South Africa’s Red List of Terrestrial Ecosystems (RLEs)" Land 10, no. 10: 1048. https://doi.org/10.3390/land10101048
APA StyleSkowno, A. L., & Monyeki, M. S. (2021). South Africa’s Red List of Terrestrial Ecosystems (RLEs). Land, 10(10), 1048. https://doi.org/10.3390/land10101048