Article

Spatiotemporal Differentiation of the School-Age Migrant Population in Liaoning Province, China, and Its Driving Factors

1
School of Education, Liaoning Normal University, Dalian 116029, China
2
Department of Security, Liaoning Police College, Dalian 116036, China
3
Human Settlements Research Center, Liaoning Normal University, Dalian 116029, China
4
Key Laboratory of Regional Sustainable Development Modeling, Institute of Geographic Sciences and Natural Resources Research, CAS, Beijing 100101, China
5
School of Ocean and Civil Engineering, Dalian Ocean University, Dalian 116029, China
*
Author to whom correspondence should be addressed.
Land 2021, 10(10), 1036; https://doi.org/10.3390/land10101036
Submission received: 6 September 2021 / Revised: 29 September 2021 / Accepted: 30 September 2021 / Published: 2 October 2021
(This article belongs to the Topic Climate Change and Environmental Sustainability)

Abstract

:
This study analyzed the spatiotemporal distribution and driving factors of the floating school-age population in Liaoning Province, China from 2008 to 2020 using county-level statistical education data combined with spatial autocorrelation and the multiscale geographically weighted regression model. The major findings are as follows. From 2008 to 2020, the distribution of the school-age migrant population exhibited obvious spatial imbalance characteristics both in terms of the number and proportion of school-age migrants. Specifically, the school-age migrant population was concentrated in the municipal districts of large and medium-sized cities and continued to increase over time in the suburbs of large and medium-sized cities. Over the past 12 years, the distribution of the school-age migrant population in Liaoning Province exhibited significant spatial autocorrelation. From the number of school-age migrants, the cold and hot spot area expanded. Conversely, from the proportion of school-age migrants, the cold and hot spot area decreased gradually, whereas the cold spot area became more diffuse. Regarding the driving factors, the quantity and quality of teaching staff, the quality of teaching equipment and conditions, and the quality of the education environment played a role in promoting or restraining the differentiation of the school-age migrant population in Liaoning Province. Moreover, the degree of influence of the driving factors exhibited substantial spatial differences.

1. Introduction

China has a large, diverse, and complex school-age population, which is currently experiencing profound changes to its social development and demographic structure [1,2]. Moreover, the educational space is diverse and unique [3]. The migrant school-age population of China refers to children and adolescents who have registered their household in other provinces (districts and cities) and counties (districts) and travel to urban areas or towns with their parents for compulsory education [4]. According to the “Statistical Bulletin of the National Education Development in 2020”, there were 156 million students at the compulsory education stage nationwide (including 107.3 million elementary school students and 49.1 million junior high school students). A total of 14.3 million children were classed as relocated children, with 10.3 million enrolled in elementary schools and 3.9 million enrolled in junior high schools, accounting for 9.60% and 8.04% of the total school-age population, respectively [4]. With the increasing population movement in China and the widespread phenomenon of “children moving with them”, the education of migrant children has received increasing attention from central and local governments at all levels. As early as 1998, the former State Education Commission and the Ministry of Public Security jointly issued the “Interim Measures for the Schooling of Migrant Children and Adolescents”, requesting local governments to actively solve the problem of schooling for migrant children and adolescents. Article 12 of the “Compulsory Education Law of the People’s Republic of China” stipulates the right of migrant children and adolescents to receive compulsory education on an equal basis in the place where they enter. In 2011, the State Council issued the “China Children’s Development Program (2011–2020)”, which demands measures to ensure that migrant children receive equal access to compulsory education. In 2012, the “Opinions of the State Council on Further Promoting the Balanced Development of Compulsory Education” stated the need to ensure equal access to compulsory education for special groups and to ensure equal access to compulsory education for children of migrant workers in cities. However, owing to the limitations of the education system and the urban–rural dual socioeconomic structure, the educational integration of migrant children remains a prominent issue in China [5].
Previous research into migrant populations around the world has noted the relationship between labor mobility, human capital accumulation, and regional development [6,7]. In China, scholars have conducted detailed analyses of the evolution and geographical patterns of migrant populations [8,9,10], the typical characteristics and distribution of migrant populations in coastal and inland areas [11,12], and the temporal and spatial characteristics of migrant populations in cities, suburbs, and fringe areas [13,14]. The extensive flow of labor is also accompanied by a large increase in the school-age migrant population, whose spatial distribution was first investigated in the 1960s [15,16]. This revealed a close relationship between population mobility and the allocation of regional compulsory education resources [17], which is reflected by research into the impact of the allocation of educational resources (such as the spatial layout of schools, the use of appropriate education scales, and economic benefits) on the spatial distribution of school-age migrant populations [18]. Increasing attention has also been paid to the temporal and spatial characteristics of the research objects, exploring the relationship between population pressure, residential differentiation, and other factors [19] as well as the allocation of educational resources [20] by introducing theories and methods relating to urban sociology and educational economics.
Domestic research on the Chinese school-age migrant population has focused on changes in the spatial structure of this population, the characteristics of spatial agglomeration and differentiation, and the factors driving these changes. For example, in the three major regions of eastern, central, and western China as well as coastal and inland regions, the spatial distribution of the school-age migrant population shows large regional differences [21]. Based on the uncertain nature of migrant children from urban and rural areas, the distribution of education in China is divided into three integration domains, namely urban areas, rural areas, and urban–rural areas where a large number of school-age migrant populations gather, to describe the distribution of the school-age migrant population and the state of schooling [22]. These domains also enable in-depth analysis of the regional differences in the school-age migrant population, with previous research focusing on super large cities, large cities, national-level new districts, and small and medium-sized cities among others, in order to reveal the distribution of the school-age migrant population in different types of regions [23,24]. According to population flows and distributions, cities can be divided into net inflow cities, approximately stable cities, and net outflow cities [25] to further evaluate the scale and structure of the school-age migrant population. It should be noted that research on the spatial distribution of the school-age migrant population is typically based on data analysis at the prefecture level [26]. Thus, although these findings are significant for guiding the allocation and planning of compulsory education resources, studies should also be performed at the county level to achieve a more in-depth understanding of the spatial patterns and driving factors of the school-age migrant population.
Existing county-level research has analyzed the influence of individual and family factors on the choice of education location [27], with particular attention on the impact of the family’s ability and willingness to move with the children’s school location [28]. However, relatively little attention has been paid to the factors driving the spatial distribution of the school-age migrant population. The factors driving the spatial mobility characteristics of school-age children are typically the same as those for their parents [29], which include factors such as the level of economic and social development, policy environment, urban administrative hierarchy, location advantages, occupational types, and employment opportunities [30]. The driving factors behind the formation and evolution of the spatial distribution of migrant populations also vary over time. As the two key driving forces, the government and the market promote each other, maintain checks and balances with each other, and exert a continuous influence on migrant populations [31,32,33]. Thus, the flow and spatial distribution of the school-age migrant population will inevitably be affected by factors, such as the economic and social development level and policy environment of the inflow area, and will be both promoted and restricted by government and market forces.
Therefore, research on the school-age migrant population in China has mainly focused on the spatial distribution and evolution of the school-age migrant population, the implementation of educational policies for floating children and educational equity [34], and the redistribution of educational resources for the school-age migrant population [35]. Moreover, the research perspective has shifted from the macro scale to the meso- and micro-scales, reflecting the need for more in-depth analysis as well as an understanding of the macroscopic distribution and dynamic trends of the school-age migrant population [36]. More importantly, we must start from the meso- and micro-scales, reducing a wide range of statistical data on the effect of specific differences within the region, and carefully analyze the flow characteristics and driving factors of the school-age migrant population within regions and the characteristics of differences within regions. Therefore, this study uses spatial autocorrelation and other methods to quantitatively explore the temporal and spatial evolution of the school-age migrant population in Liaoning Province, China, from 2008 to 2020 from two aspects: the number and the proportion of school-age migrants. Then, a multiscale geographic weighted regression (MGWR) model is used to analyze the underlying driving factors.

2. Materials and Methods

2.1. Research Area

From 2008 to 2020, the number of students in compulsory education in Liaoning Province, Northeast China, dropped from 3.8 million to 2.97 million, whereas the number and proportion of school-age migrants rose from 200,000 to 263,000 and from 5.26% to 8.85%, respectively. The school-age population continues to exhibit both spatial and temporal differentiation. Changes in the size, structure, and distribution of the school-age population have a significant impact on the allocation of compulsory education resources. Compulsory education resource allocation exhibits clear urban–rural differences, regional differences, and redistribution processes. Liaoning Province has 14 prefecture-level cities, 100 municipal districts, counties (autonomous counties), and county-level cities as well as functional parks, such as the Dalian Huayuankou Economic Zone, Anshan Economic Development Zone, and Jinzhou Binhai New Area. To maintain the unity of administrative divisions, the research object was set to 100 county-level administrative units in Liaoning Province (Figure 1).

2.2. Data and Processing

The student data employed in this study were predominantly derived from the statistical data of government agencies and included the number of students in each school in the province from 2008 to 2020, the number of children of migrant workers in cities, and other statistical information, which provides detailed and reliable data support for studying the school-age migrant population. Geographical data were obtained from the Resource and Environmental Science Data Center of the Chinese Academy of Sciences. ArcGIS 10.7 software was used to link the above-mentioned 12 periods (years) of student system data and corresponding annual statistical data to the administrative division maps of the counties in Liaoning Province. Thus, we established a research database of the school-age migrant population in Liaoning Province.

2.3. Research Methods

Two measurement indicators were employed to reflect the status of the school-age migrant population in a region. One was the number of school-age migrants, which expresses the scale of this population, and the other was the proportion of school-age migrants, which expresses the relative magnitude of this population.

2.3.1. Spatial Autocorrelation

Global spatial autocorrelation is typically used to determine whether a certain geographic phenomenon exhibits agglomeration characteristics in space and reflects the similarity of the attribute values of spatially adjacent research units. Global Moran’s I is the most common measure of global spatial autocorrelation [37,38]. Its value range is [−1, 1], which indicates negative, positive, or no spatial correlation. Local spatial autocorrelation is typically used to measure the degree of similarity or difference between the attributes of a unit and its surrounding units and can reveal how spatial dependence varies with the location. Based on the Queen adjacency principle of GeoDa software, the spatial weight matrix is determined. If there is a common edge or point between two spatial objects, they are considered to be adjacent and a weight of 1 is assigned; otherwise, a weight of 0 is assigned. The Queen adjacency principle can express the distance between two regions and the neighbor relationship with more detail.

2.3.2. Local G Coefficient

Among local spatial autocorrelation measures, the local G coefficient has a very significant effect on the recognition of high-value agglomeration areas and can detect cold spots and hot spots in different areas [39]. Considering that the areas of the counties and districts in Liaoning Province are substantially different, this study adopts the Queen adjacency principle to determine the spatial weight matrix in order to avoid an uneven distribution of neighboring counties and districts caused by a large distance threshold. Furthermore, in order to avoid the island of Changhai County having no neighbors, Jinzhou District, Pulandian City, and Zhuanghe City were set as the neighbors of Changhai County.

2.3.3. MGWR Model

The basic formula for the MGWR model is as follows [40]:
y i = j = 1 k β b w j ( u i ,   v i ) x i j + ε i
where yi is the dependent variable of element i; xij is the attribute value of the independent variable j at position i; β b w j is the bandwidth used by the regression coefficient of the j-th variable; ( u i ,   v i ) are the spatial coordinates of the i element points; and ε i is the residual. The MGWR model can be regarded as a generalized additive model [41], as follows:
y i = j = 1 k f i + ε ( f i = β b w j x i )
in which the back-fitting algorithm can be used to fit each smoothing item. The back-fitting algorithm first needs to initialize all the smoothing terms; therefore, it is necessary to make a preliminary estimate of each coefficient in the MGWR model in advance. There are generally four choices for initialization: classic GWR estimation; semiparametric GWR estimation; least-square estimation; or setting all coefficients to zero. This study chose the classic GWR estimate as the initial estimate. After the initial setting was determined, the difference between the real and predicted values obtained by the initial estimation was calculated, giving the initial residual.

3. Results

3.1. Overall Distribution of the School-Age Migrant Population

According to the distribution of the school-age migrant population in Liaoning Province, combined with the manual classification method in ArcGIS 10.7, the 100 counties in this study were divided into five categories (Figure 2). In general, the spatial distribution of the school-age migrant population in Liaoning Province was extremely unbalanced over the study period. The absolute number of school-age migrants was high in several counties (districts), and the relative proportion of school-age migrants was high in municipal districts, neighboring counties, and cities. However, for most counties and districts, the number and proportion of school-age migrants were relatively low, and decreased in the following order: municipal districts > county-level cities > counties (autonomous counties).

3.1.1. Number of School-Age Migrants

In 2008, areas with a large number of school-age migrants were concentrated in the suburbs of metropolitan areas, such as Shenyang and Dalian, Ganjingzi District, Jinzhou District, Hunnan District, Yuhong District, and Lushunkou District. By 2013, counties and districts with a large school-age migrant population were still predominantly distributed in municipal districts. Haicheng, Wafangdian, Zhuanghe, Donggang, and other economic and populous cities also exhibited an increase in their school-age migrant populations. The data for 2020 revealed no major changes in the spatial distribution characteristics of the school-age migrant population. Notably, the number of school-age migrants in Jinzhou District, Ganjingzi District, Dadong District, Huanggu District, Lianshan District, Shuangta District, Yinzhou District, and other municipal districts maintained a rapidly increasing trend over the 12-year study period. Conversely, the trend in some districts (such as Xigang District and Bayuquan District) remained approximately stable, whereas that in other districts (such as Yuhong District and Sujiatun District) decreased over the study period.

3.1.2. Proportion of School-Age Migrants

In 2008, the school-age migrant population represented more than 10% of the total school-age population in 18 counties and districts. The 10 counties with the largest proportion of school-age migrants were all municipal districts of Dalian or Shenyang. The only exception was Changhai County, which is an island county. Most counties (county-level cities and autonomous counties) exhibited a relatively low proportion of school-age migrants, indicating clear spatial differentiation. By 2013, most municipal districts had a high proportion of school-age migrants, whereas most counties (county-level cities and autonomous counties) still had a low proportion, revealing clear differences between urban and rural areas and between regions. In 2020, the spatial distribution of the proportion of school-age migrants was the same as that in 2013, with counties with low proportions enclosing counties with high proportions. Moreover, counties with high proportions were spatially concentrated and contiguous, whereas counties with low proportions were relatively scattered.

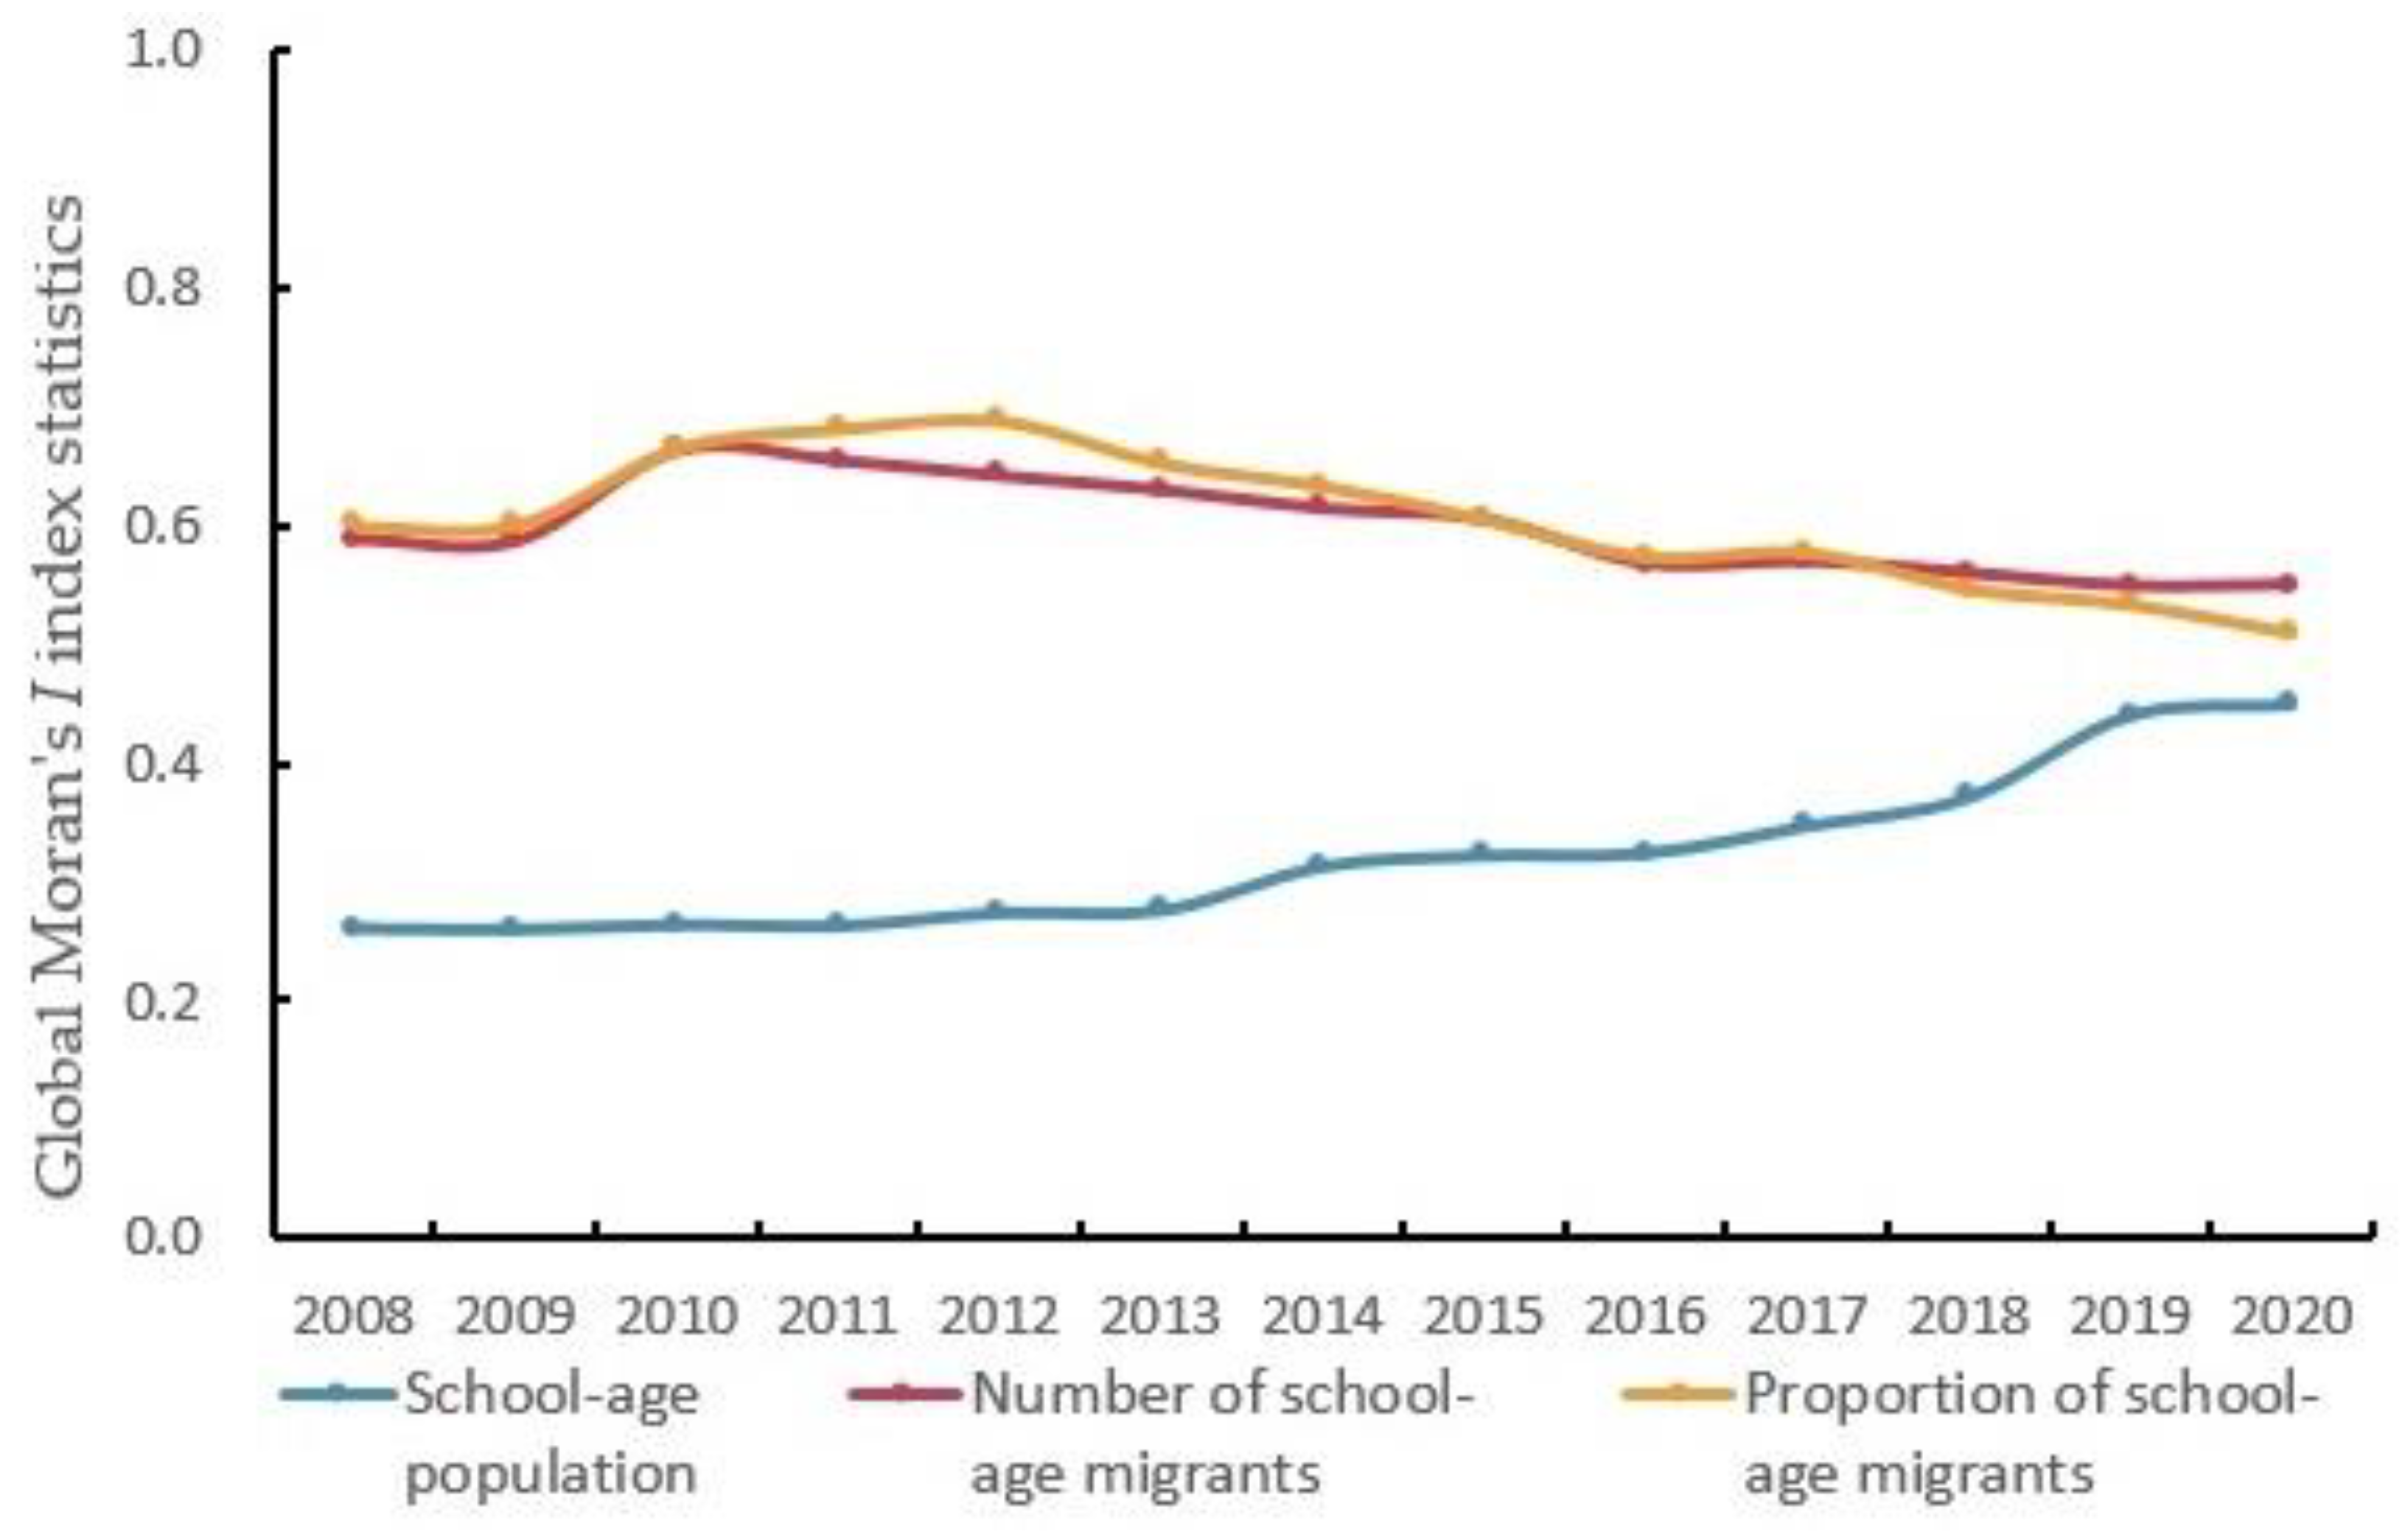
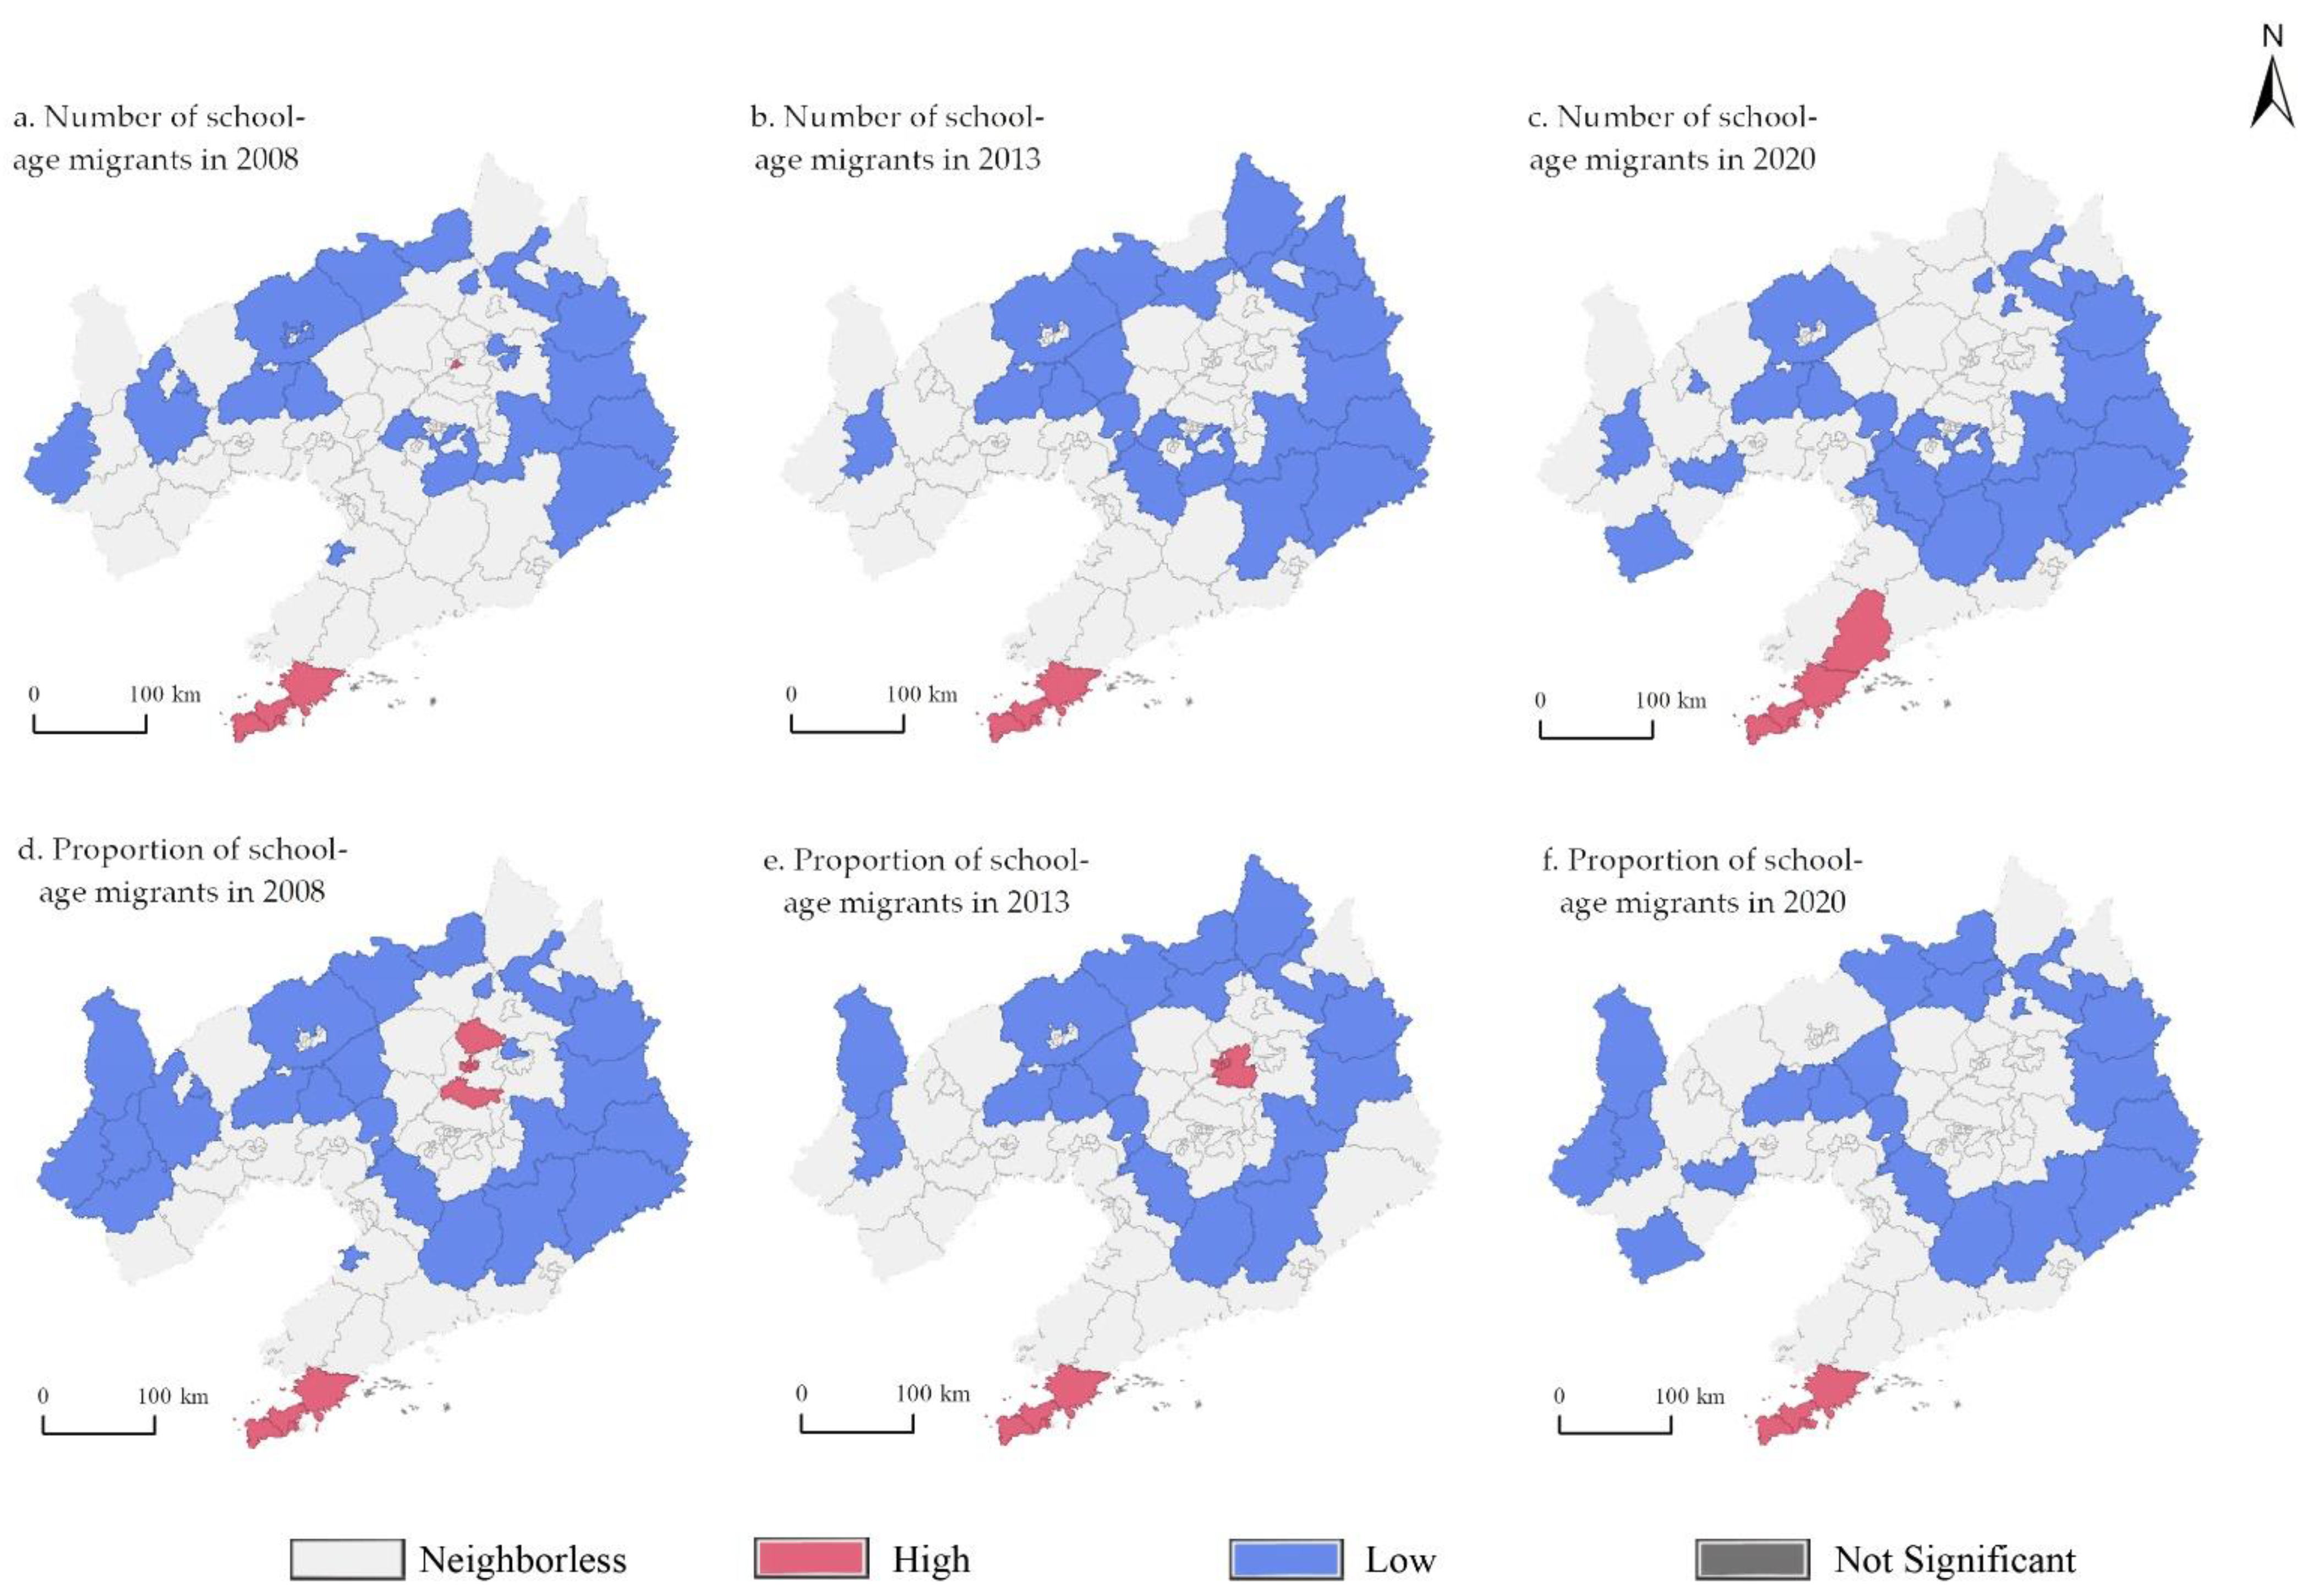
3.2. Spatial Autocorrelation Characteristics of the School-Age Migrant Population

Figure 3 shows the global Moran’s I estimates of the number of school-age children, the number of school-age migrants, and the proportion of school-age migrants among the total school-age population from 2008 to 2020. In the entire study period, all global Moran’s I estimates were greater than zero, and all p-values were less than 0.001. This indicates a significant positive global spatial correlation between the proportion of school-age migrants and the school-age migrant population among county units. This proves that spatial differences in the distribution of the school-age migrant population between regions are objective, and that the school-age migrant population has a significant spatial agglomeration effect. Throughout the study period, the global Moran’s I estimates of the number and proportion of school-age migrants were approximately consistent, first increasing then decreasing. Inflection points occurred in 2010 and 2012; however, the changes were not very large. This shows that the distribution of the school-age migrant population among counties exhibited a certain degree of spatial diffusion as well as spatial agglomeration; however, the overall spatial correlation pattern remained relatively the same as that in 2008. From 2008 to 2015, despite a similar trend, the global Moran’s I estimate of the number of school-age migrants was lower than that of the proportion of school-age migrants. In 2015, these two areas appeared to overlap, with the global Moran’s I estimate of the number of school-age migrants becoming slightly higher from 2015 to 2020. It is worth noting that the global Moran’s I estimate of the total school-age population increased significantly over the study period, with the degree of spatial autocorrelation showing an opposite trend to the distribution of the school-age migrant population. Thus, the spatial distribution of the school-age population may have a certain influence on the uneven spatial distribution of the school-age migrant population.
The local G coefficient method was used to detect the local relevance of the distribution of the school-age migrant population in various counties and districts in Liaoning Province with the aim of analyzing the evolution characteristics of the spatial pattern of cold and hot spots (Figure 4). From 2008 to 2020, the distribution of the school-age migrant population showed strong spatial evolution characteristics and maintained relatively stable regional differences. On the one hand, the hot spots were mainly concentrated in the municipal districts of Dalian and showed a trend of continuous expansion, and the cold spots were mainly distributed in western Liaoning and Liaondong. On the other hand, Shenyang was gradually separated from the cold spots, whereas the size of the cold spot area in Liaodong region expanded. The distribution of both the number and proportion of school-age migrants reflected the obvious spatial differentiation between cold spots and hot spots. However, cold and hot spots related to the number of school-age migrants exhibited gradual expansion and concentration, whereas those related to the proportion of school-age migrants gradually decreased; these are mainly distributed in the municipal districts of most prefecture-level cities.

3.3. Factors Driving the Spatial Differentiation of the School-Age Migrant Population

3.3.1. Variable Selection and Preprocessing

According to current literature and statistical data, six driving factors were selected from three categories (Table 1). Among them, the teacher-student ratio and the number of teachers (persons) with intermediate and above professional and technical titles reflect the quantity and quality of teaching staff; the monetary value of teaching equipment (yuan) and the number of books (books) reflect the quality of the teaching equipment and conditions; and the area of green spaces (m²) and gymnasiums (m²) reflect the quality of the educational and recreational environment. After standardizing the original data, the goodness of fit indicator, R², was 91.7%, and variance inflation factor (VIF) was less than 7.5, which was suitable for regression analysis.

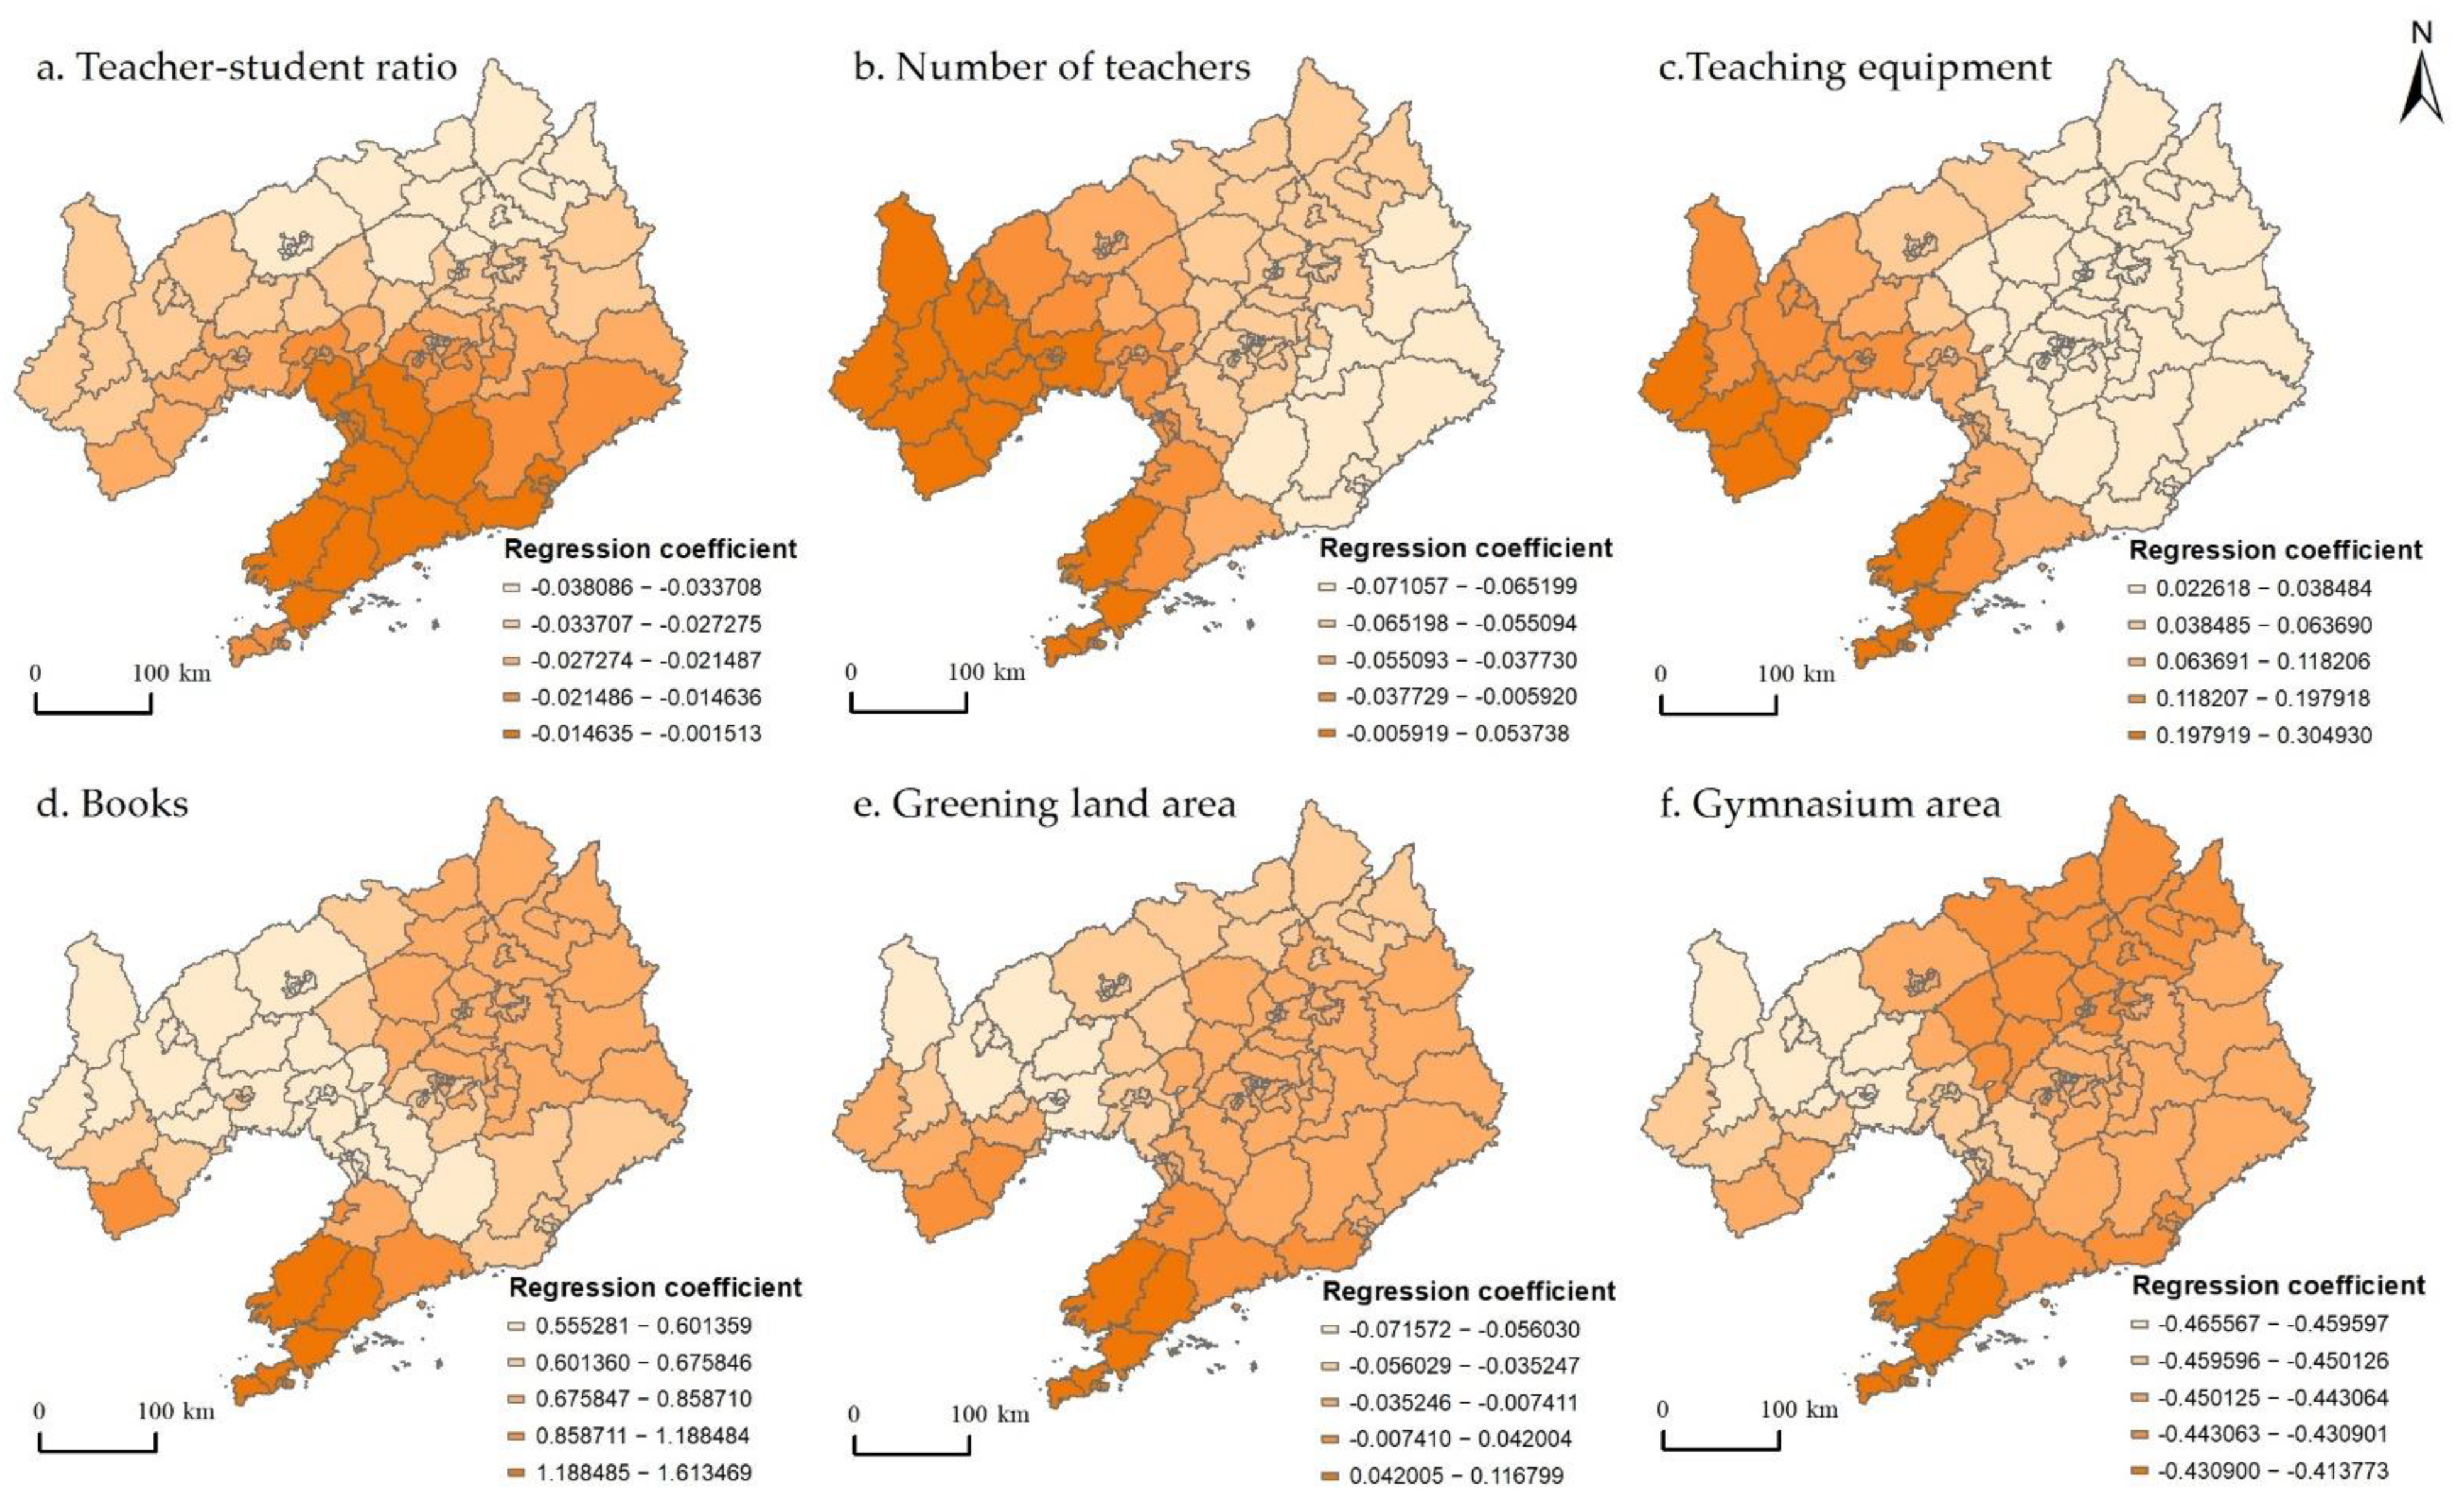
3.3.2. Model Estimation Result

The average value of the regression coefficient of the MGWR model reflects the degree of influence of different driving factors on the school-age migrant population in 2020. The degree of influence decreased in the following order: number of books > teaching equipment value > green area > teacher-student ratio > number of teachers with intermediate and above professional titles > gymnasium area (Table 1). However, the bandwidth of books and teaching equipment was much smaller than that of other variables; thus, they were more sensitive to changes in a regional scale and were considered local variables. All other variables were considered global variables, indicating that their spatial effects were not significant. The results showed that the signs of the regression coefficients of all independent variables were positive and negative; thus, they were not spatially stable. Moreover, the regression coefficients showed a large fluctuation trend, indicating an unstable influence on the distribution of the school-age migrant population.

3.3.3. Analysis of Model Estimation Results

In this study, a Gaussian MGWR model type, adaptive bisquare spatial kernel, golden section bandwidth searching, and AICc optimization criterion were used. In the MGWR model, the research units exhibited spatial and temporal differences in their undetermined coefficient estimates. The larger the value, the greater the driving strength of the explanatory variable on the dependent variable, and vice versa. To more intuitively reflect the relationship between the proportion of school-age migrants and the driving factors, the ArcGIS natural breakpoint method was used to show the degree of influence of the driving factors (Figure 5).
Regarding the influence of teachers on the distribution of the school-age migrant population, the regression coefficient of the teacher-student ratio decreased from the southeast to the northwest of Liaoning Province. The spatial distribution trend of the regression coefficient of the number of teachers with intermediate and above professional and technical titles was approximately opposite to that of the teacher-student ratio, indicating an opposite influence of the quantity and quality of teachers. Therefore, the metropolises represented by Dalian and Shenyang should optimize the structure of the teaching team according to differences between the central city, suburbs, and counties under the jurisdiction of the outer suburbs. Overall, compared with the number of teachers, the quality of teachers attracts a greater school-age migrant population.
As for the impact of teaching equipment and conditions on the distribution of the school-age migrant population, the spatial trends of the regression coefficients of the value of teaching equipment and the number of books indicated restraining and promoting roles on the agglomeration and distribution of school-age migrants, respectively. However, the opposite trend was observed in Chaoyang and Fuxin City, whereas Dalian showed a double promotion effect. Thus, the teaching conditions of Dalian’s primary and secondary schools are highly attractive for the school-age migrant population. Therefore, Chaoyang and Fuxin City are advised to make corresponding adjustments to attract more school-age migrants. Overall, the better the teaching conditions, the higher the proportion of school-age migrants. The quality of the teaching conditions is an important driving factor promoting the spatial agglomeration and distribution of the school-age migrant population.
Lastly, the spatial variation characteristics of the influence of the educational and recreational environment on the distribution of the school-age migrant population are shown in Figure 5. According to the spatial trend of the regression coefficient of the area of green land, green areas in Dalian, Dandong, Shenyang, and other cities promoted the school-age migrant population. Conversely, in Chaoyang City, Jinzhou City, Fuxin City, and other cities, green areas reduced the school-age migrant population. Regarding the area of gymnasiums, a dividing line was observed from Fuxin City and Dalian City, where the distribution of gymnasiums promoted and restricted the school-age migrant population on the east and west sides of this line, respectively. Overall, the amount of green space in the educational environment had a greater impact than recreation on attracting school-age migrants.

4. Discussion

Against the background of population migration in China, limitations in the education management system have led to the insufficient, untimely, and unreasonable allocation of educational resources in the territories. Therefore, it is necessary to guide compulsory education resource allocation to adapt to changes in the school-age population and achieve a truly balanced allocation of compulsory education resources [42,43]. This should involve implementation of a dynamic balance plan for dealing with changing trends in the school-age population, especially the school-age migrant population, strengthening reforms of the educational resource supply side, adjusting the supply of primary and secondary school degrees in a timely manner, promoting “spatial matching” between the school-age population and educational resources, and formulating reasonable compulsory education development planning and spatial layouts [44].

4.1. Overall Distribution of the School-Age Migrant Population

With large-scale population movement, educational issues related to the influx of school-age migrant populations require urgent attention. Thus, the research perspective must change from external to internal, from superficial to in-depth, and from a macro-to meso-scale in order to analyze specific regional differences in the school-age migrant population. However, the regularity of large-scale data may not be universal for small-scale spatial regions. This study used government agency student data from 2008 to 2020 to reveal the temporal and spatial differentiation characteristics of the school-age migrant population on the county scale and to analyze the detailed flow characteristics of the school-age migrant population within the region. The results of this study provide insights into the reasonable distribution of educational resources in the study region and the development planning and spatial layout of compulsory education.

4.2. Factors Driving the Spatiotemporal Differentiation of the School-Age Migrant Population

The driving factors of the school-age migrant population govern changes in the school-age population and the balanced allocation of educational resources. This study used the MGWR model to analyze the degree of influence of the teaching staff, school conditions, and educational/recreational environment. The results revealed significant spatial differences in the strength and trends of factors affecting the distribution of the school-age migrant population. The traditional geographic weighted regression model uses a local regression fitting method to estimate the parameter vector at each observation point and detect the spatial variation in the regression coefficients of various factors; however, it does not directly consider the spatial dependence between factors [45,46]. Conversely, the MGWR model represents an improvement on the traditional model as it cancels the assumption that all modeling processes are on the same spatial scale. By deriving the optimal bandwidth vector, different modeling runs can be performed on different spatial scales, which solves the requirements of multivariate spatial data for different spatial scales, and more effectively recognizes the heterogeneity of multivariate data in spatial dimensions [47,48].

4.3. Study Limitations

In this study, subjective factors inevitably affected the selection of driving factors. Moreover, cultural, economic, and policy factors are difficult to quantify, and some influencing factors were inevitably omitted, which should be addressed in future research. Furthermore, the distribution of the school-age migrant population exhibited significant urban–rural and regional differences. According to this small-scale survey of differences in the distribution of the school-age migrant population between major urban areas, suburbs, and the outer suburbs of metropolises, the findings of this study have significant implications for the balanced allocation of urban compulsory education resources. Therefore, followup research will be conducted in the future.

5. Conclusions

This study analyzed the spatial distribution characteristics of the school-age migrant population in 100 counties and districts in Liaoning Province using spatial autocorrelation methods. We also selected six representative driving factors from three categories, i.e., the quality and quantity of teachers, the quality of teaching conditions, and the amount of green land and recreational facilities, and used a multiscale geographically weighted regression model to analyze the driving force behind the distribution of the school-age migrant population in a multidimensional manner. The main conclusions are as follows. Both the number and proportion of school-age migrants in Liaoning Province exhibited highly uneven spatial distribution characteristics and were concentrated in the districts of various cities, especially Dalian and Shenyang. From 2008 to 2020, the school-age migrant population continued to increase in the suburbs of large and medium-sized cities; however, the number and proportion of school-age migrants in many counties remained relatively low. Additionally, over the 12-year study period, the distribution of the school-age migrant population in Liaoning Province exhibited significant spatial autocorrelation. Regarding the number of school-age migrants, hot spots were mainly concentrated in the municipal district of Dalian, whereas cold and hot spots exhibited continuous expansion and concentration. Conversely, regarding the proportion of school-age migrants, cold and hot spots decreased in area, whereas cold spots became more diffuse. The MGWR model results revealed spatial differences in the factors affecting the distribution of the school-age migrant population. The different driving factors exhibited different degrees of influence and different influence trends on the distribution of the school-age migrant population in Liaoning Province.

Author Contributions

W.X. contributed to all aspects of this work; C.S. wrote the main manuscript text, D.S. and B.Y. conducted the experiment and analyzed the data. All authors have read and agreed to the published version of the manuscript.

Funding

This study was supported by the 2018 National Social Science Fund of China Project: Research on Resources Allocation of Compulsory Education Based on School-age Population Flow Trend Prediction (Grant No. 18BRK037).

Institutional Review Board Statement

Not applicable.

Informed Consent Statement

Not applicable.

Data Availability Statement

The data supporting this study are available from the first author upon reasonable request.

Acknowledgments

The authors would like to acknowledge all colleagues and friends who have voluntarily reviewed the translation of the survey and the manuscript of this study.

Conflicts of Interest

The authors declare no conflict of interest.

References

  1. You, H.; Yang, J.; Xue, B.; Xiao, X.; Xia, J.; Jin, C.; Li, X. Spatial evolution of population change in northeast China during 1992–2018. Sci. Total Environ. 2021, 776, 146023. [Google Scholar] [CrossRef]
  2. Jina, S.; Yangab, J.; Wangb, E.; Liuc, J. The influence of high-speed rail on ice–snow tourism in northeastern China. Tour. Manag. 2020, 78, 104070. [Google Scholar] [CrossRef]
  3. Yu, S.; Chen, B.; Levesque-Bristol, C.; Vansteenkiste, M. Chinese education examined via the lens of self-determination. Educ. Psychol. Rev. 2018, 30, 177–214. [Google Scholar] [CrossRef]
  4. Ministry of Education of the People’s Republic of China. National Statistical Bulletin on Educational Development [EB/OL]; Ministry of Education of the People’s Republic of China: Beijing, China. Available online: http://www.moe.gov.cn/jyb_sjzl/sjzl_fztjgb/ (accessed on 10 September 2021).
  5. Yu, M.; Crowley, C.B. The discursive politics of education policy in China: Educating migrant children. China Q. 2020, 241, 87–111. [Google Scholar] [CrossRef]
  6. Bosker, M.; Brakman, S.; Garretsen, H.; Schramm, M. Relaxing hukou: Increased labor mobility and China’s economic geography. J. Urban Econ. 2012, 72, 252–266. [Google Scholar] [CrossRef] [Green Version]
  7. Fu, Y.; Gabriel, S.A. Labor migration, human capital agglomeration and regional development in China. Reg. Sci. Urban Econ. 2012, 42, 473–484. [Google Scholar] [CrossRef]
  8. Chen, L.; Xi, M.; Jin, W.; Hu, Y. Spatial pattern of long-term residence in the urban floating population of China and its influencing factors. Chin. Geogr. Sci. 2021, 31, 342–358. [Google Scholar] [CrossRef]
  9. Wang, Y.; Wang, Z.; Zhou, C.; Liu, Y.; Liu, S. On the settlement of the floating population in the pearl river delta: Understanding the factors of permanent settlement intention versus housing purchase actions. Sustainability 2020, 12, 9771. [Google Scholar] [CrossRef]
  10. Zhao, M.; Liu, S.; Qi, W. Exploring the differential impacts of urban transit system on the spatial distribution of local and floating population in Beijing. J. Geogr. Sci. 2017, 27, 731–751. [Google Scholar] [CrossRef]
  11. Dong, X.; Jiang, X. Population mobility model & floating growth spatial types and their influencing factors in southwest China. In 2019 International Conference on Management, Finance and Social Sciences Research (MFSSR 2019); Francis Academic Press: London, UK, 2019. [Google Scholar]
  12. Xu, J.; Takahashi, M. Progressing vulnerability of the immigrants in an urbanizing village in coastal China. Environ. Dev. Sustain. 2021, 23, 8012–8026. [Google Scholar] [CrossRef]
  13. Karachurina, L.B.; Mkrtchyan, N.V. Intraregional population migration in Russia: Suburbs outperform capitals. Reg. Res. Russ. 2021, 11, 48–60. [Google Scholar] [CrossRef]
  14. Ma, W.; Jiang, G.; Wang, D.; Li, W.; Guo, H.; Zheng, Q. Rural settlements transition (RST) in a suburban area of metropolis: Internal structure perspectives. Sci. Total Environ. 2018, 615, 672–680. [Google Scholar] [CrossRef]
  15. O’Brien, R.J. Model for planning the location and size of urban schools. Socio-Econ. Plan. Sci. 1969, 2, 141–153. [Google Scholar] [CrossRef]
  16. Morrill, R.L. Efficiency and equity of optimum location models. Antipode 1974, 6, 41–46. [Google Scholar] [CrossRef]
  17. Butler, T.; Hamnett, C. Praying for success? Faith schools and school choice in east London. Geoforum 2012, 43, 1242–1253. [Google Scholar] [CrossRef]
  18. Mustapha, O.-O.; Akintunde, O.; Alaga, A.; Badru, R.; Ogbole, J.; Samuel, P.; Samuel, S. Spatial distribution of primary schools in Ilorin West local government area, Kwara State, Nigeria. J. Sci. Res. Rep. 2016, 9, 1–10. [Google Scholar] [CrossRef]
  19. Andersson, E.; Malmberg, B.; Östh, J. Travel-to-school distances in Sweden 2000–2006: Changing school geography with equality implications. J. Transp. Geogr. 2012, 23, 35–43. [Google Scholar] [CrossRef] [Green Version]
  20. Chi, G.Q.; Ho, H.C. Population stress: A spatiotemporal analysis of population change and land development at the county level in the contiguous United States, 2001–2011. Land Use Policy 2018, 70, 128–137. [Google Scholar] [CrossRef] [PubMed]
  21. Gao, Y.; He, Q.; Liu, Y.; Zhang, L.; Wang, H.; Cai, E. Imbalance in spatial accessibility to primary and secondary schools in China: Guidance for education sustainability. Sustainability 2016, 8, 1236. [Google Scholar] [CrossRef] [Green Version]
  22. Lu, S.; Rios, J.A.; Huang, C.-C. Mindfulness, emotion and behaviour: An intervention study with Chinese migrant children. Child. Soc. 2018, 32, 290–300. [Google Scholar] [CrossRef]
  23. Zhang, W.; Chong, Z.; Li, X.; Nie, G. Spatial patterns and determinant factors of population flow networks in China: Analysis on Tencent location big data. Cities 2020, 99, 102640. [Google Scholar] [CrossRef]
  24. Zhang, D.; Zhou, C.; Xu, W. Spatial-temporal characteristics of primary and secondary educational resources for relocated children of migrant workers: The case of Liaoning province. Complexity 2020, 2020, 1–13. [Google Scholar] [CrossRef]
  25. Li, C.; Wu, Z.; Zhu, L.; Liu, L.; Zhang, C. Changes of spatiotemporal pattern and network characteristic in population flow under COVID-19 epidemic. ISPRS Int. J. Geo-Inf. 2021, 10, 145. [Google Scholar] [CrossRef]
  26. Chan, K.W.; Ren, Y. Children of migrants in China in the twenty-first century: Trends, living arrangements, age-gender structure, and geography. Eurasian Geogr. Econ. 2018, 59, 133–163. [Google Scholar] [CrossRef]
  27. Ye, B. Reform of compulsory education system and urban integration of floating population. World Sci. Res. J. 2021, 7, 184–197. [Google Scholar]
  28. Zhao, M.; Hannum, E. Stark choices: Work-family tradeoffs among migrant women and men in urban China. Chin. Sociol. Rev. 2019, 51, 365–396. [Google Scholar] [CrossRef] [PubMed]
  29. Huijsmans, R. Child migration and questions of agency. Dev. Chang. 2011, 42, 1307–1321. [Google Scholar] [CrossRef]
  30. Tan, S.; Li, Y.; Song, Y.; Luo, X.; Zhou, M.; Zhang, L.; Kuang, B. Influence factors on settlement intention for floating population in urban area: A China study. Qual. Quant. 2017, 51, 147–176. [Google Scholar] [CrossRef]
  31. Luo, J.; Zhang, X.; Wu, Y.; Shen, J.; Shen, L.; Xing, X. Urban land expansion and the floating population in China: For production or for living? Cities 2018, 74, 219–228. [Google Scholar] [CrossRef]
  32. Liu, Z.; Wang, Y.; Chen, S. Does formal housing encourage settlement intention of rural migrants in Chinese cities? A structural equation model analysis. Urban Stud. 2016, 54, 1834–1850. [Google Scholar] [CrossRef]
  33. Yu, D.; Zhang, Y.; Wu, X. Correction to: How socioeconomic and environmental factors impact the migration destination choices of different population groups in China: An eigenfunction-based spatial filtering analysis. Popul. Environ. 2020, 41, 396. [Google Scholar] [CrossRef] [Green Version]
  34. Liu, S.; Zhao, X. How far is educational equality for China? Analysing the policy implementation of education for migrant children. Educ. Res. Policy Pract. 2018, 18, 59–74. [Google Scholar] [CrossRef]
  35. Stiefel, L.; Elbel, B.; Prescott, M.P.; Aneja, S.; Schwartz, A.E. School wellness programs: Magnitude and distribution in New York city public schools. J. Sch. Health 2017, 87, 3–11. [Google Scholar] [CrossRef] [PubMed] [Green Version]
  36. Fan, C.C.; Li, T. Split households, family migration and urban settlement: Findings from China’s 2015 national floating population survey. Soc. Incl. 2020, 8, 252–263. [Google Scholar] [CrossRef]
  37. Goodchild, M.F. What problem? Spatial autocorrelation and geographic information science. Geogr. Anal. 2009, 41, 411–417. [Google Scholar] [CrossRef] [Green Version]
  38. Getis, A.; Ord, J.K. The analysis of spatial association by use of distance statistics. In Advances in Spatial Science; Springer: Berlin/Heidelberg, Germany, 2010; pp. 127–145. [Google Scholar]
  39. Wulder, M.; Boots, B. Local spatial autocorrelation characteristics of remotely sensed imagery assessed with the Getis statistic. Int. J. Remote Sens. 1998, 19, 2223–2231. [Google Scholar] [CrossRef]
  40. Fotheringham, A.S.; Yang, W.; Kang, W. Multiscale geographically weighted regression (MGWR). Ann. Am. Assoc. Geogr. 2017, 107, 1247–1265. [Google Scholar] [CrossRef]
  41. Hastie, T.; Tibshirani, R. Generalized additive models: Some applications. J. Am. Stat. Assoc. 1987, 82, 371–386. [Google Scholar] [CrossRef]
  42. Reis, J.; Ballinger, R.C. Creating a climate for learning-experiences of educating existing and future decision-makers about climate change. Mar. Policy 2020, 111. [Google Scholar] [CrossRef]
  43. Li, J.; Shi, Z.; Xue, E. The problems, needs and strategies of rural teacher development at deep poverty areas in China: Rural schooling stakeholder perspectives. Int. J. Educ. Res. 2020, 99, 101496. [Google Scholar] [CrossRef]
  44. Boldermo, S.; Ødegaard, E.E. What about the migrant children? The state-of-the-art in research claiming social sustainability. Sustainability 2019, 11, 459. [Google Scholar] [CrossRef] [Green Version]
  45. Kumar, S.; Lal, R.; Liu, D. A geographically weighted regression kriging approach for mapping soil organic carbon stock. Geoderma 2012, 189–190, 627–634. [Google Scholar] [CrossRef]
  46. Yang, J.; Bao, Y.; Zhang, Y.; Li, X.; Ge, Q. Impact of accessibility on housing prices in Dalian city of China based on a geographically weighted regression model. Chin. Geogr. Sci. 2018, 28, 505–515. [Google Scholar] [CrossRef] [Green Version]
  47. Fotheringham, A.S.; Yue, H.; Li, Z. Examining the influences of air quality in China’s cities using multi-scale geographically weighted regression. Trans. GIS 2019, 23, 1444–1464. [Google Scholar] [CrossRef]
  48. Li, Z.; Fotheringham, A.S. Computational improvements to multi-scale geographically weighted regression. Int. J. Geogr. Inf. Sci. 2020, 34, 1378–1397. [Google Scholar] [CrossRef]
Figure 1. Location of the study area.
Land 10 01036 g001
Figure 2. Spatial distribution of the school-age migrant population in Liaoning Province from 2008 to 2020: (ac) number of school-age migrants and (df) proportion of school-age migrants.
Land 10 01036 g002
Figure 3. Spatial autocorrelation of the number and proportion of school-age migrants in Liaoning Province according to Global Moran’s I.
Land 10 01036 g003
Figure 4. Spatial agglomeration of the school-age migrant population in Liaoning Province from 2008 to 2020: (ac) number of school-age migrants and (df) proportion of school-age migrants.
Land 10 01036 g004
Figure 5. Spatial distribution of regression coefficients in the GTWR model in 2020: (a) teacher-student ratio, (b) number of teachers, (c) monetary value of teaching equipment, (d) number of books, (e) area of green spaces and (f) area of gymnasiums.
Land 10 01036 g005
Table 1. Statistical description of the MGWR model regression coefficients, indicating the degree of influence of different variables on the school-age migrant population.
VariableBandwidthMeanSTDMinMedianMax
Teacher-student ratio99.000−0.0240.009−0.038−0.025−0.002
Number of teachers86.000−0.0360.037−0.071−0.0580.054
Books43.0000.7520.2760.5550.6851.613
Teaching equipment68.0000.0810.0790.0230.0340.305
Greening land area79.000−0.0190.044−0.072−0.0290.117
Gymnasium area93.000−0.4450.011−0.466−0.445−0.414
Intercept47.000−0.1120.057−0.255−0.1130.009
Publisher’s Note: MDPI stays neutral with regard to jurisdictional claims in published maps and institutional affiliations.

