1. Introduction
Water quality in tidal systems is highly dynamic and can exhibit predictable daily rhythms or undergo rapid directional changes. Capturing and characterizing these properties is the goal of continuous monitoring which can be defined as the acquisition of water quality data at short intervals (e.g., every 15 min) over long periods of time (e.g., 1 year) [
1]. Commonly acquired variables include dissolved oxygen (DO), specific conductance (and/or salinity), pH and water temperature.
Over the last two decades, continuous monitors have been deployed across estuarine systems worldwide. In the Chesapeake Bay region, for example, large scale monitoring efforts, such as the Virginia Estuarine and Coastal Observation System (VECOS) (
http://web2.vims.edu/vecos/) and Maryland’s “Eyes on the Bay” program (
http://eyesonthebay.dnr.maryland.gov/) have been used to track changes in water quality and assess the overall health of the bay. However, only a relatively small amount of data from these and other monitors has been rigorously analyzed and published.
Continuously monitored water quality data have been used to assess the relative importance of driving variables, such as light, tides, freshwater inflows, air temperature and biotic activity, on water quality. For example, under stable and productive conditions, pH and DO are driven by the photosynthesis and respiration of primary producers [
1]. This productivity is dependent on the daily light cycle but other factors, largely related to the movement of water through tides or freshwater inflows, can influence or impede expected water quality patterns [
1].
Studies have compared similar water bodies or two sites within the same water body to better understand the relative influence of these driving variables. Buzzelli et al. [
2] compared two tidal creeks in the southeastern US and found that in a creek with a higher storage volume and wider marsh, there was a strong diel DO signal that was heavily influenced by light and biotic activity, while in a shallower creek that had rapid and complete flushing, there was a strong semidiel DO signal that was likely influenced by tides. Edwards et al. [
3] analyzed data from two sites (upstream and downstream) on a creek in Georgia and found that water temperature, DO and pH at the upstream site experienced diel signals during the summer but the signatures weakened during colder months. In the downstream site, they found the same seasonal pattern for water temperature but no diel signal was found for DO or pH, though a strong tidal influence was seen on those two parameters.
Other studies have used continuously monitored water quality to make larger generalizations about estuarine bodies. Wenner and Geist [
4] used continuously monitored water quality data from coastal states in the National Estuarine Research Reserve System (NERRS) System-Wide Monitoring Program (SWMP) and determined that diel periodicity was a larger source of variation in DO than tidal periodicity in sites with tidal amplitude of less than 1 m, but that specific conductance was strongly affected by tidal activity at all sites. They also found that hypoxic events, with DO saturation of less than 28%, most often occurred during the summer, but that the percent of time the hypoxic events occurred varied greatly among the study sites. Engle et al. [
5] used continuous DO monitors in Louisiana estuaries and estimated that 5.2–29.3% of Louisiana estuaries are affected by low DO conditions.
DO and pH can not only be influenced by diel patterns and the transition of water but also the type of primary producers that are present. Findlay et al. [
6] continuously monitored DO in submerged aquatic vegetation (SAV) beds in the tidal freshwater Hudson River and found that vegetated areas had the capacity for much higher DO saturation percentages. Moore [
7] analyzed diel patterns in 15 min interval water quality data collected from seagrass beds in the lower Chesapeake Bay.
Freshwater inflows, especially during major precipitation events, are often responsible for other water quality changes. Ward [
8] tracked water quality in a Maine estuary and saw large decreases in salinity during and after a major hurricane. A recovery in high tide salinity levels occurred within a few tidal cycles but low tide salinity levels took over 10 days to recover. Additionally, they reported that heavy precipitation events increased turbidity and suspended sediment concentrations in the estuary. Hubertz and Cahoon [
9] collected salinity, pH and DO data on an hourly basis in a North Carolina estuary and looked at the effects of rainfall and runoff on those parameters and other parameters, including total nitrogen and chlorophyll a.
Continuously monitored water quality data has also been used as a supplemental source of information for other related hypotheses. Diel patterns in temperature, DO, salinity and pH from the North Carolina NERRS were used by Necaise et al. [
10] to examine juvenile summer flounder growth. Lee et al. [
11] used continuously monitored chlorophyll and DO levels to make algal bloom predictions in Hong Kong coastal waters.
The goal of this study was to collect, analyze and compare continuously monitored water quality data from two adjacent embayments of the tidal freshwater Potomac River: the tidal Occoquan River and Gunston Cove. It is hypothesized that the two embayments will exhibit similar water quality patterns at both diel and seasonal time scales due to the proximity of the two sites and their geographic similarities. Specifically, it is hypothesized that under stable conditions the basic water quality variables including water temperature, specific conductance, pH and DO, will exhibit diel and/or semidiel patterns based on the relative effects of solar radiation and tidal cycling, respectively. During periods of high freshwater inflow, caused by high amounts of precipitation, or during seasonal transitions these water quality patterns will be dampened or muted entirely. It is further hypothesized that some differences in these patterns will be found between the two stations and that these will be related to site-specific factors.
2. Materials and Methods
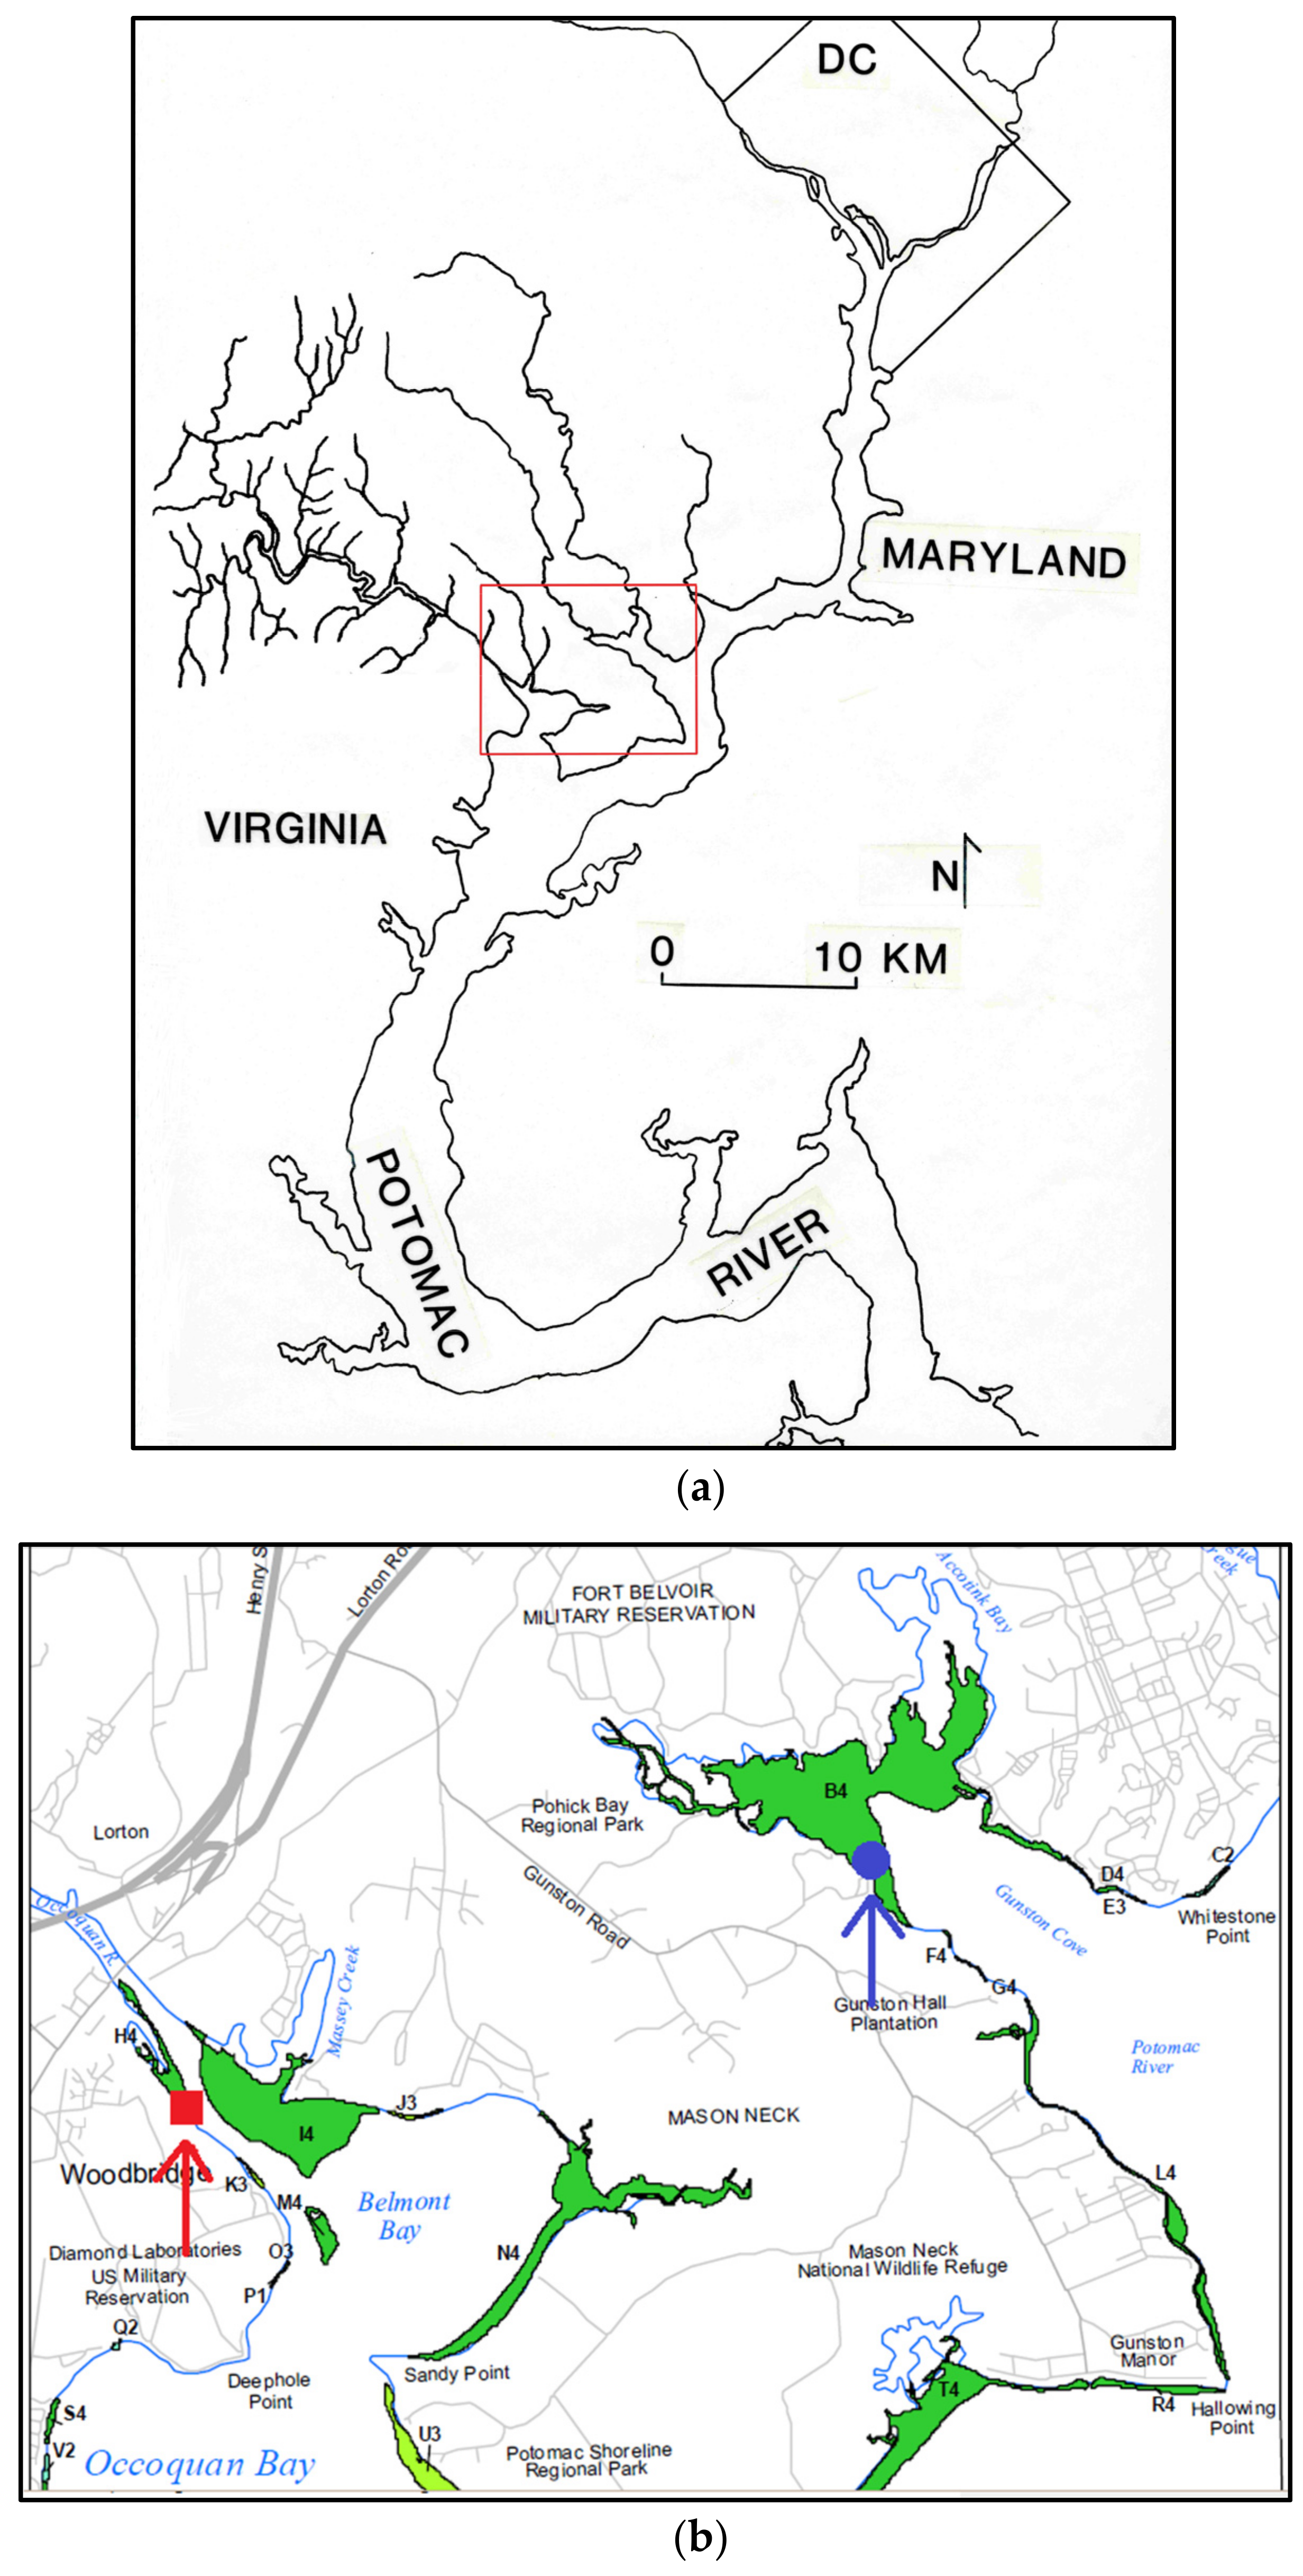
The two embayments chosen for this study are on the Virginia side of the tidal freshwater Potomac River (
Figure 1). The Potomac River is a major subestuary of the Chesapeake Bay system and has a watershed area of 29,940 km
2 at the head of tide [
12]. Tidal influence on the Potomac River extends from Point Lookout, where the river meets the Chesapeake Bay, to Chain Bridge at the western boundary of Washington, D.C., a distance of 160 km [
12]. From the head of tide at Chain Bridge to Quantico, Virginia, about 50 km downstream, freshwater conditions are maintained (<0.5 ppt salinity), except during especially dry summers when slightly brackish conditions can reach points slightly further upstream [
12].
The continuous monitor in the downstream embayment, referred to as the tidal Occoquan from here on, was attached to a floating dock on the tidal Occoquan River at the Belmont Bay development in Woodbridge, Virginia, USA (38.6558° N, 77.2321° W). The tidal Occoquan River has a watershed area of 1476 km
2 [
13] and is a major tributary of the Potomac River, located about 40 km downstream of the Potomac River head of tide [
1]. A dam located just upstream from the head of tide controls the fall line flow to the tidal Occoquan River. The dam is used to create the Occoquan Reservoir which is a major drinking water supply for the region and during dry periods little to no discharge occurs, but during wet periods the discharge volume can be substantial [
1]. The tidal Occoquan, located about 15 km upstream of the general boundary between fresh and brackish waters in the tidal Potomac at Quantico, Virginia, is also located about 10 km downstream of the second study site, Gunston Cove.
The continuous monitor in the upstream embayment, referred to as Gunston Cove from here on, is attached to a fixed dock on Gunston Cove at Pohick Bay Regional Park in Lorton, Virginia, USA (38.6758° N, 77.1663° W). Gunston Cove is formed where Accotink and Pohick Creeks join before draining into the Potomac River. Accotink Creek and Pohick Creek have drainage areas of 131.3 km
2 and 88.1 km
2, respectively [
14,
15]. Gunston Cove is located approximately 30 km downstream of the head of tide at Chain Bridge, 18 km south of Washington, D.C. and 20 km north of the fresh and brackish water boundary at Quantico, Virginia [
12]. Waters in Gunston Cove are influenced by a sewage treatment plant located 5 km upstream on Pohick Creek. The Noman J. Cole Jr. treatment plant treated and discharged to Pohick Creek an average of 142,000 m
3 of wastewater per day in 2012 which is a substantial part of the freshwater flow into Gunston Cove during dry periods. Using information from the Chesapeake Bay Total Maximum Daily Load [
16], the Noman Cole effluent represents about 6% and 2.2%, of total point source discharge volume to Chesapeake Bay and to the tidal Potomac River, respectively. The daily phosphorus load from the plant was 11.4 kg/day and the daily nitrogen load was 602 kg/day in 2012, both greatly reduced in the past decades due to enhanced wastewater treatment practices. The loads from Noman Cole are 2.2% of the point source load of P and 5.1% of the N load to the tidal Potomac. In terms of total Bay point source loads Noman Cole represents 0.4% of the P load and 1.1% of the N load.
Both sites can be characterized as shallow embayments (average depths about 1.5–2.5 m) with areas near the monitors largely dominated by submerged aquatic vegetation (SAV) (
Figure 1b). However, the continuous monitor in Gunston Cove is located in the middle of an SAV bed, while the continuous monitor in the tidal Occoquan is located directly adjacent to a channel area that is dredged to a depth of 3 m.
Both continuous monitors were deployed from mid-April 2012 to the end of November 2012. The monitors, equipped with YSI (Yellow Springs, OH, USA), Incorporated Model 6600 V2 sondes, collected water temperature, specific conductance, pH, and dissolved oxygen data every 15 min. To minimize fouling, the sondes were deployed with copper probe guards, copper coated brush parts and the individual probes either came from the manufacturer coated in copper or copper tape was wrapped around them. Water quality data was uploaded in real time to a dedicated YSI website where it could be regularly downloaded.
To maintain well-calibrated continuous monitors, deployed sondes were rotated with newly calibrated sondes at each site on a monthly basis. Additionally, weekly and bi-weekly visits were performed, at Gunston Cove and the tidal Occoquan, respectively, for supplemental sampling and calibration cross-checking. Sonde calibrations were performed in the lab using known standards, as recommended by the manufacturer [
18]. The supplemental sampling consisted of measurements of Secchi depth, light attenuation coefficient and collection of grab samples for determination of total suspended solids (TSS), volatile suspended solids (VSS), chlorophyll
a and pheopigment by extraction and lab fluorometry which were done on each site visit using standard methods. Profiles of irradiance (photosynthetically active radiation, PAR) were collected with a LI-COR Biosciences (Lincoln, NE, USA) underwater flat scalar PAR probe. Measurements were taken at 10 cm intervals to a depth of 1.0 m. Simultaneous measurements were made with a terrestrial probe in air during each profile to correct for changes in ambient light if needed. Natural log-transformed PAR readings were regressed against depth to determine light attenuation coefficient. Secchi depth was also determined visually using a standard 0.3 m disk.
For TSS and VSS determination, known volumes of water were filtered in the lab in duplicate through preashed and tared glass fiber filters (Whatman 984AH) and used for solids analysis. TSS was determined by drying the filters overnight at 75 °C and reweighing. TSS is analogous to seston dry weight. VSS were then determined by ashing those filters at 500 °C and reweighing with VSS being the difference between dry weight and ashed weight. VSS is analogous to seston organic weight.
Using the water samples, chlorophyll a and pheopigment were also determined. First, a known volume of sample was filtered through a 0.45 μm GN-6 metricel® membrane filter, placed in individual 20 mL plastic scintillation vials, and frozen. Within six months of collection, frozen filters were ground and dissolved with DMSO using a glass grinder and acetone for rinsing. The solutions were left in the scintillation vials and refrigerated overnight to ensure complete pigment extraction. The next day, each solution was centrifuged for 10 min and volumes were ascertained. After measuring the volume, a fluorometer reading was then taken followed by the addition of 0.2 mL of 2N HCl and a subsequent fluorometer reading. The volume filtered, the volume extracted, the two fluorometer readings and calibration coefficients (determined by calibrating the fluorometer at the end of 2012) were used to determine the chlorophyll a and phaeophytin content of the water.
Weather data—air temperature and PAR—were collected at 15 min intervals at the Gunston Cove monitor location using a Hobo weather station from Onset Computer. Potomac River and Accotink Creek flow data were obtained online from the U.S. Geological Survey’s Potomac River near Washington, DC Little Falls Pumping Station (01646500) and Accotink Creek near Annandale, VA (01654000) streamgages, respectively [
19]. Occoquan River flow data were obtained online from Occoquan Watershed Monitoring Laboratory [
13]. A map depicting the 2012 SAV coverage in the tidal Occoquan and Gunston Cove (
Figure 1b) was obtained online from the Virginia Institute for Marine Science [
17].
In order to ensure that the continuous water quality data collected during the study period was of acceptable quality, quality assurance/quality control (QA/QC) methods were developed and utilized. The first method used in the QA/QC process was based on side-by-side comparison readings between the deployed sonde and a freshly calibrated sonde. These readings were done on a weekly or bi-weekly basis throughout the study period. On a monthly basis, the deployed sondes were replaced with newly cleaned and calibrated sondes. Regarding the comparison readings, the following tolerances were deemed acceptable: temperature ± 0.5 °C; specific conductance ± 0.03 mS/cm, DO (% saturation) ± 10%, pH ± 0.35 pH units. Exceptions had to be made in some circumstances. For example, during some sonde changes, water temperature was rapidly increasing and the comparison readings were not taken at the exact same time. This caused the comparison readings to have more than a 0.5°C difference. In these cases, a linear interpolation was used to determine whether the temperature would have been within the 0.5 °C tolerance at the 15 min interval. Additionally, on two of the five sondes used in rotation, the temperature readings had to be calibrated by adjusting the readings by less than 0.5 °C due to the temperature probes not having any internal calibration capabilities. Other issues, caused by malfunctioning probes, could not be resolved and those data had to be removed from the analyses, including pH data from 28 August to 4 October in Gunston Cove and pH data from 19 September to 18 October in the tidal Occoquan.
Acceptable thresholds were also established for each of the parameters in order to find errors. Temperature could not exceed 35 °C, specific conductance could not exceed 5 mS/cm (and specific conductance values exceeding 1 mS/cm were examined closely), DO (% saturation) could not exceed 200%, DO (mg/L) could not be below 2 mg/L, and pH could not be above 11 or below 5. Any values found outside of these ranges were examined closely and it was determined whether they were part of a reasonable pattern or if they were single outliers indicating sonde error. Doubling or halving of values from one 15 min interval to the next was also used as a criterion for finding errors. Lastly, there were some blank 15 min intervals, generally corresponding with the monthly sonde changes. In these instances, the 15 min reading before and the 15 min reading after were averaged to interpolate the missing value as it was necessary to have a complete set of 15 min readings for some time series analyses. On twelve different occasions, at Gunston Cove, the tide was low enough that the sonde was out of the water. For these occasions, a linear interpolation was performed with the reading from before the sonde was out of water and from after the sonde was back in the water. The longest out of water occurrence was five hours, from late 24 November to early 25 November, but on average the sonde was never out of the water for more than two hours.
For all 15 min data (including weather data), Systat 13 was used to calculate daily means, medians, ranges, minima and maxima. Systat 13 was also used for autocorrelation function (ACF) time-series graphing and analysis. Nonparametric Spearman coefficients were used for correlation analysis and were calculated using SPSS 19.0. All other graphs were created using SigmaPlot 11.2.
3. Results
3.1. Grab Samples
On a weekly to bi-weekly basis, solids, chlorophyll
a and light transparency data were collected. During monthly sonde rotations, when two water samples were taken, the grab sample data have been averaged. Median values and ranges were used to characterize general conditions at each station (
Table 1). Parameter ranges were generally similar between the two sites. Median values suggested somewhat clearer water at the Gunston Cove site, although the ranges for each variable overlapped extensively between the two sites.
On all dates that samples were taken at both the tidal Occoquan and Gunston Cove, TSS was higher in the tidal Occoquan with the only exceptions occurring during May. TSS reached high levels at both sites on 1 November, the day after Hurricane Sandy passed through the region, with values of 14.7 and 45.4 in Gunston Cove and the tidal Occoquan, respectively. VSS was also higher in the tidal Occoquan than in Gunston Cove during much of the year, except during the spring. During the warmest months, late June to late August, VSS constituted a higher percentage of TSS in the tidal Occoquan than in Gunston Cove while during all other months, the opposite was true. The VSS percentage of TSS ranged between 22.7–59.6% in Gunston Cove and 14.8–56.5% in the tidal Occoquan, with the minima occurring on 1 November and the maxima in late July–early August. Neither the TSS nor VSS values correlated significantly between the two sites (p > 0.05).
Chlorophyll a and pheopigment were higher in Gunston Cove during the spring and higher in the tidal Occoquan during the summer. Maximum chlorophyll a in Gunston Cove occurred on 31 May and in the tidal Occoquan the maximum occurred on 2 August. There was a moderately significant correlation in chlorophyll a between the two sites (r = 0.492, p < 0.05) but a lack of correlation in pheopigment (p > 0.05).
Light attenuation coefficient reached maximum values at both sites on 1 November, after Hurricane Sandy, and the minimum values occurred at both sites on 28 August. In general, transparency was higher in Gunston Cove than in the tidal Occoquan during the summer and higher in the tidal Occoquan than in Gunston Cove during the spring, which corresponds with the findings for TSS, VSS, chlorophyll a and pheopigment. Although Secchi depth could not be ascertained on many occasions at Gunston Cove, due to the depth being too shallow, the same relationship appears to hold true. Secchi depth ranged from 0.43 m to greater than 1.50 m in Gunston Cove and ranged from 0.2–1.58 m in the tidal Occoquan. As evidenced by the seasonality differences described above, there was a lack of correlation in light attenuation and Secchi depth between the two sites (p > 0.05).
In Gunston Cove, inverse Secchi depth was significantly correlated with TSS (r = 0.949 p < 0.01) and significantly correlated with VSS (r = 0.696, p < 0.01) but did not significantly correlate with chlorophyll a or pheopigment (p > 0.05). However, the light attenuation coefficients did significantly correlate with chlorophyll a and pheopigment (r = 0.576, p < 0.01 and r = 0.630, p < 0.01, respectively), in addition to correlating significantly with TSS and VSS (r = 0.745, p < 0.01 and r = 0.742, p < 0.01, respectively). The difference between Secchi depth and light attenuation is most likely due to the lack of a complete Secchi depth record; on many dates at Gunston Cove the Secchi disk was visible on the bottom of the cove. In the tidal Occoquan, inverse Secchi depth was significantly correlated with TSS (r = 0.817, p < 0.01) and VSS (r = 0.618, p < 0.01) but did not significantly correlate with chlorophyll a or pheopigment (p > 0.05). The light attenuation coefficients were not significantly correlated with VSS, chlorophyll a or pheopigment (p > 0.05) but were significantly correlated with TSS (r = 0.582, p > 0.01). This pattern of correlation suggests that algal solids were more responsible for controlling water transparency in Gunston Cove than in the tidal Occoquan.
3.2. Seasonal Patterns in Hydrologic Forcing Variables
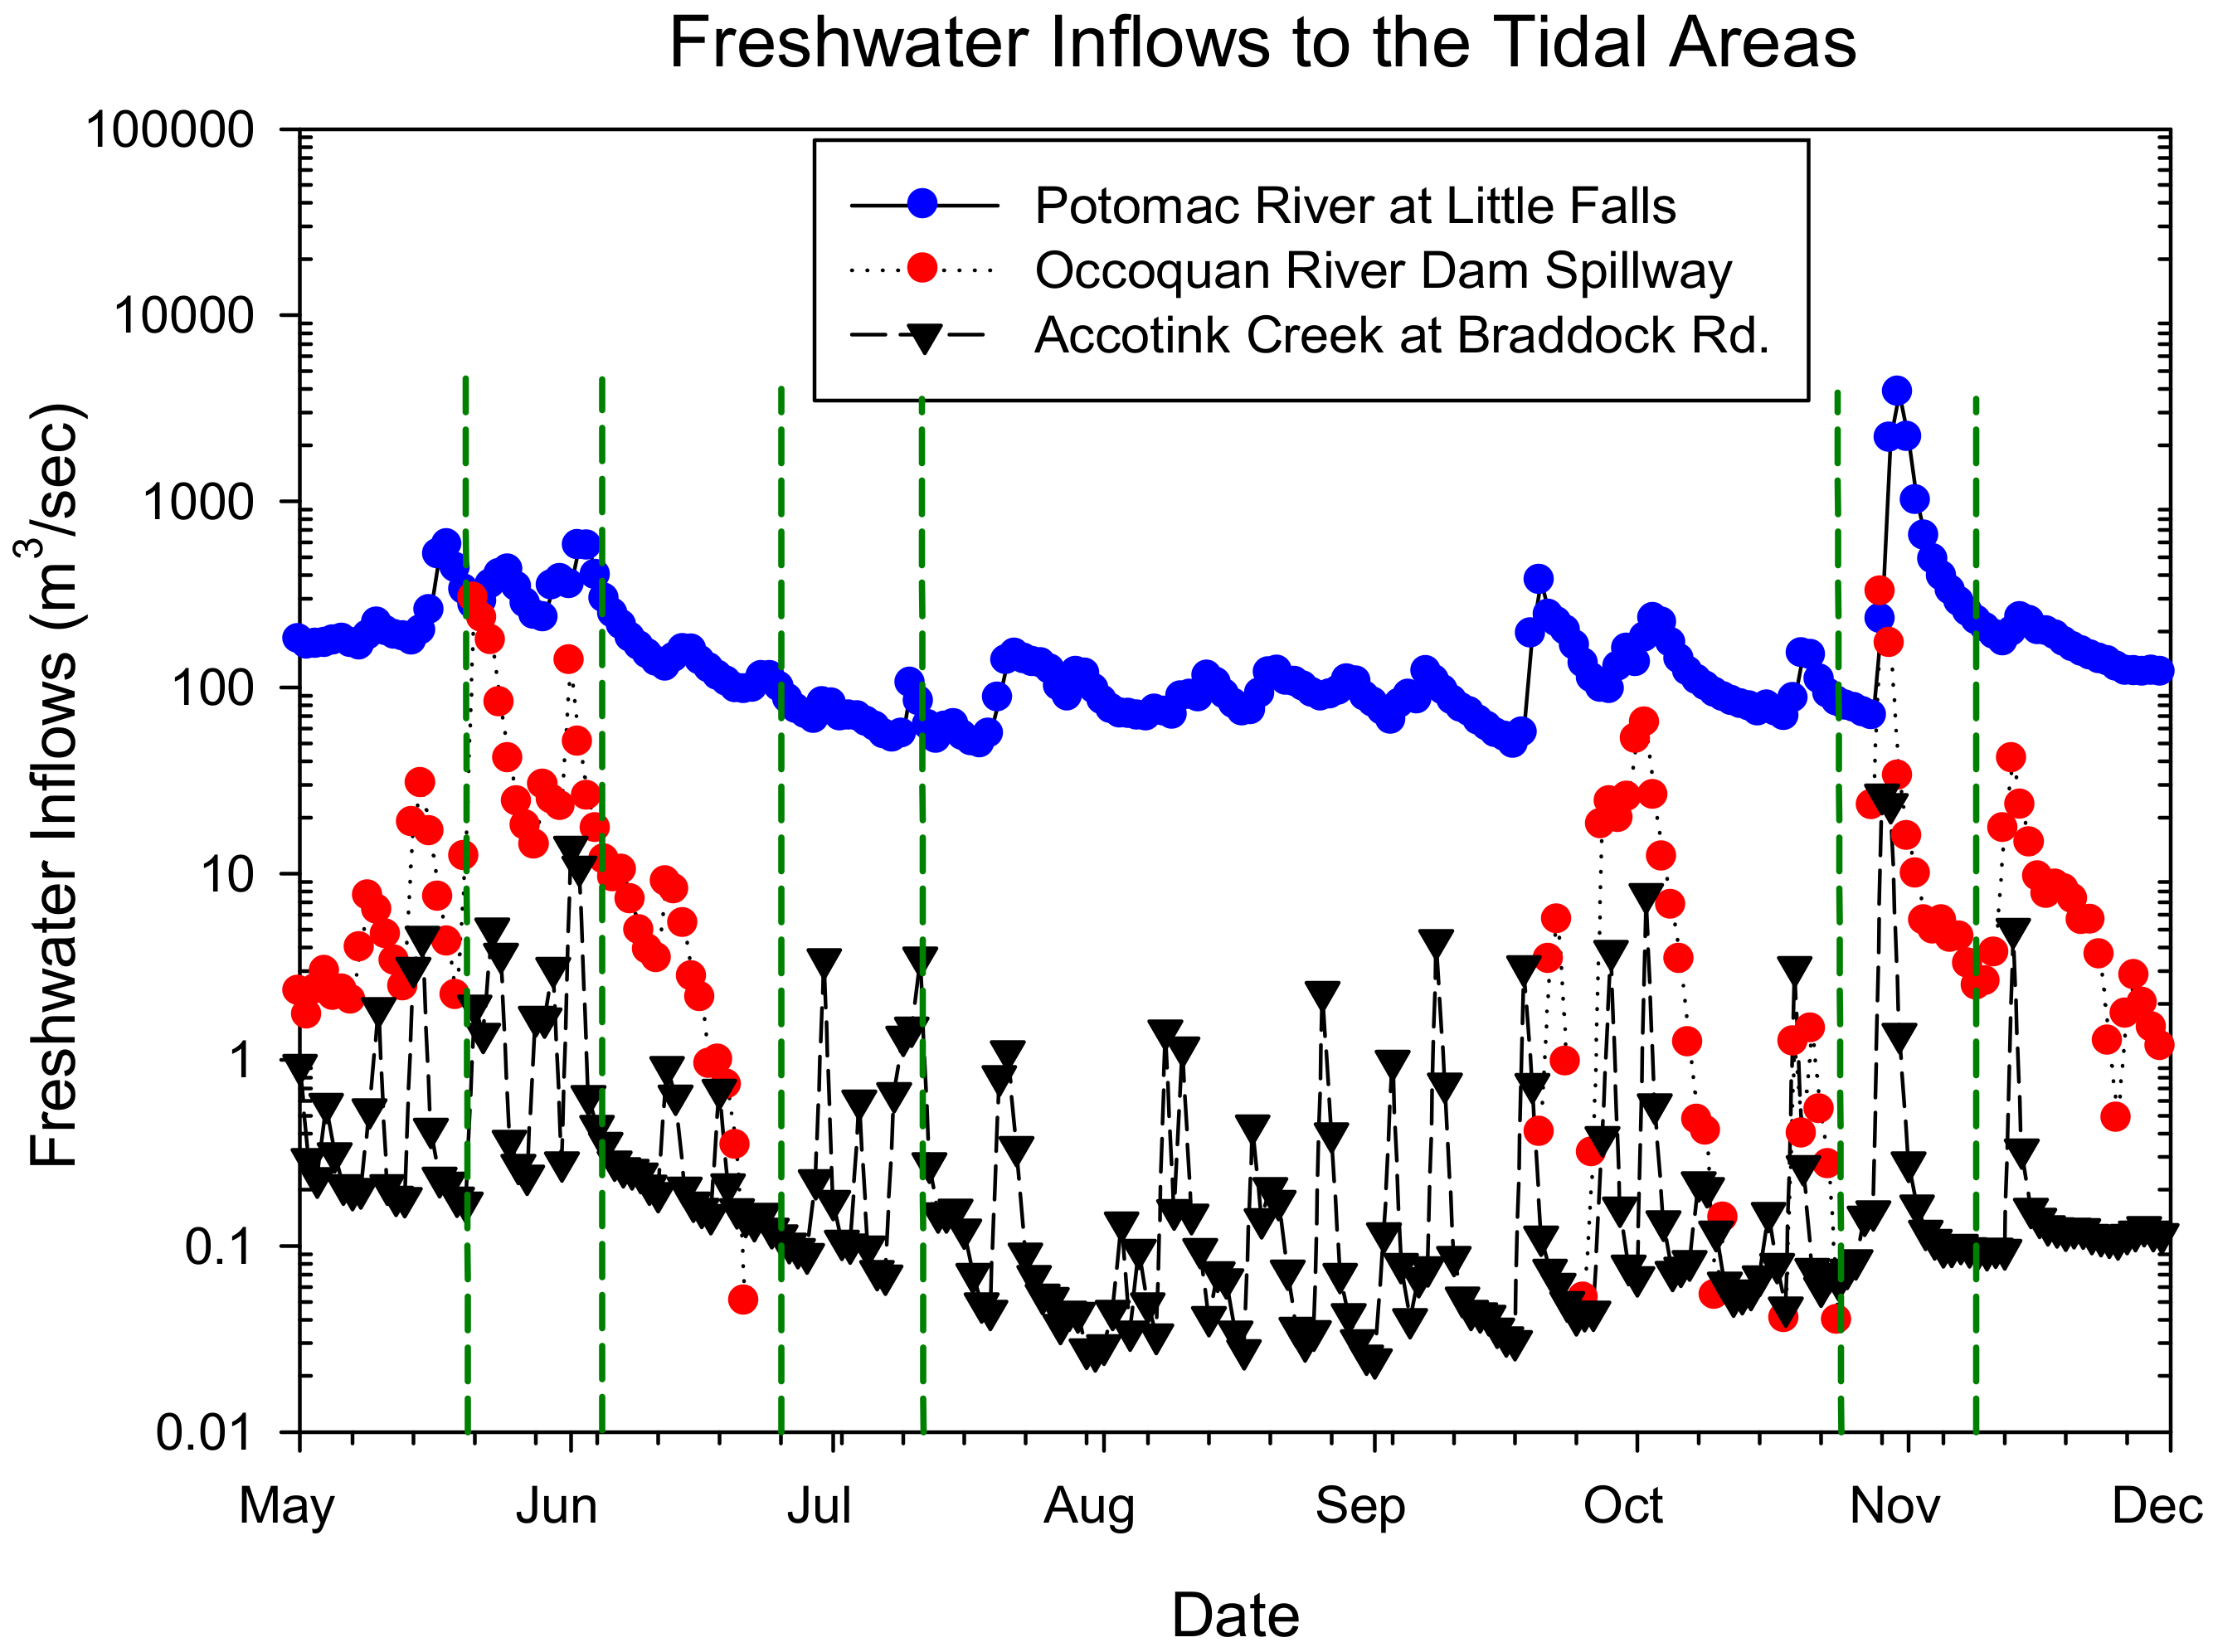
Daily mean values were used to show the seasonal freshwater inflow patterns (
Figure 2). Occoquan River inflows, controlled by a dam, were often zero, especially from mid-June through mid-September, but during periods of high precipitation such as occurred during May and October, major releases from the dam occurred. Three major releases were observed during the study period. The first major freshwater release occurred from 21 May through 25 May with daily mean flows of 41–298 m
3/s, respectively, and a total inflow volume of 72 × 10
6 m
3 for the five days. On 1 June, a freshwater release averaging 137 m
3/s occurred and was followed by a release averaging 50 m
3/s on 2 June, a total inflow volume of 16 × 10
6 m
3 for the two days. The last major freshwater release occurred during Hurricane Sandy on 29 and 30 October with daily mean flows of 322 m
3/s and 170 m
3/s, respectively, and a total inflow volume of 42 × 10
6 m
3 for the two days.
In Accotink Creek, one of the two creeks flowing into Gunston Cove, daily mean flows were more varied than they were below the Occoquan River dam. Nonetheless, average daily flow at agauge that accounts for 61.9 km
2 of the total Accotink Creek drainage area (131.34 km
2) surpassed 8 m
3/s (
Figure 2) on only two occasions, which coincided with the same dates as two of the major freshwater releases that occurred at the dam on the Occoquan River. The first dates of high flows occurred on 1 and 2 June when mean flow rates at the Accotink Creek flow gauge reached 14 and 11 m
3/s, respectively. The second period when daily mean flow rates at the Accotink Creek flow gauge surpassed 8 m
3/s occurred on 29 and 30 October when mean flow rates reached 26 and 24 m
3/s, respectively. There were a few lesser flow peaks between these two high flow periods including 30 June (3.4 m
3/s) and 11 July (3.5 m
3/s).
The freshwater inflows from the Potomac River fall line are chiefly responsible for maintaining overall freshwater conditions in the area. Relatively high flows were maintained at the fall line throughout late May and into early June, consistent with the high flow events that occurred into the two embayments (
Figure 2). During Hurricane Sandy, daily mean flows at the fall line increased significantly for about three days, reaching a maximum daily mean flow of 3794 m
3/s on 31 October. This was fifty times the daily mean flow rate of 69 m
3/s that had occurred just three days prior.
3.3. Seasonal Patterns and Correlations in Monitor Variables Using Daily Means
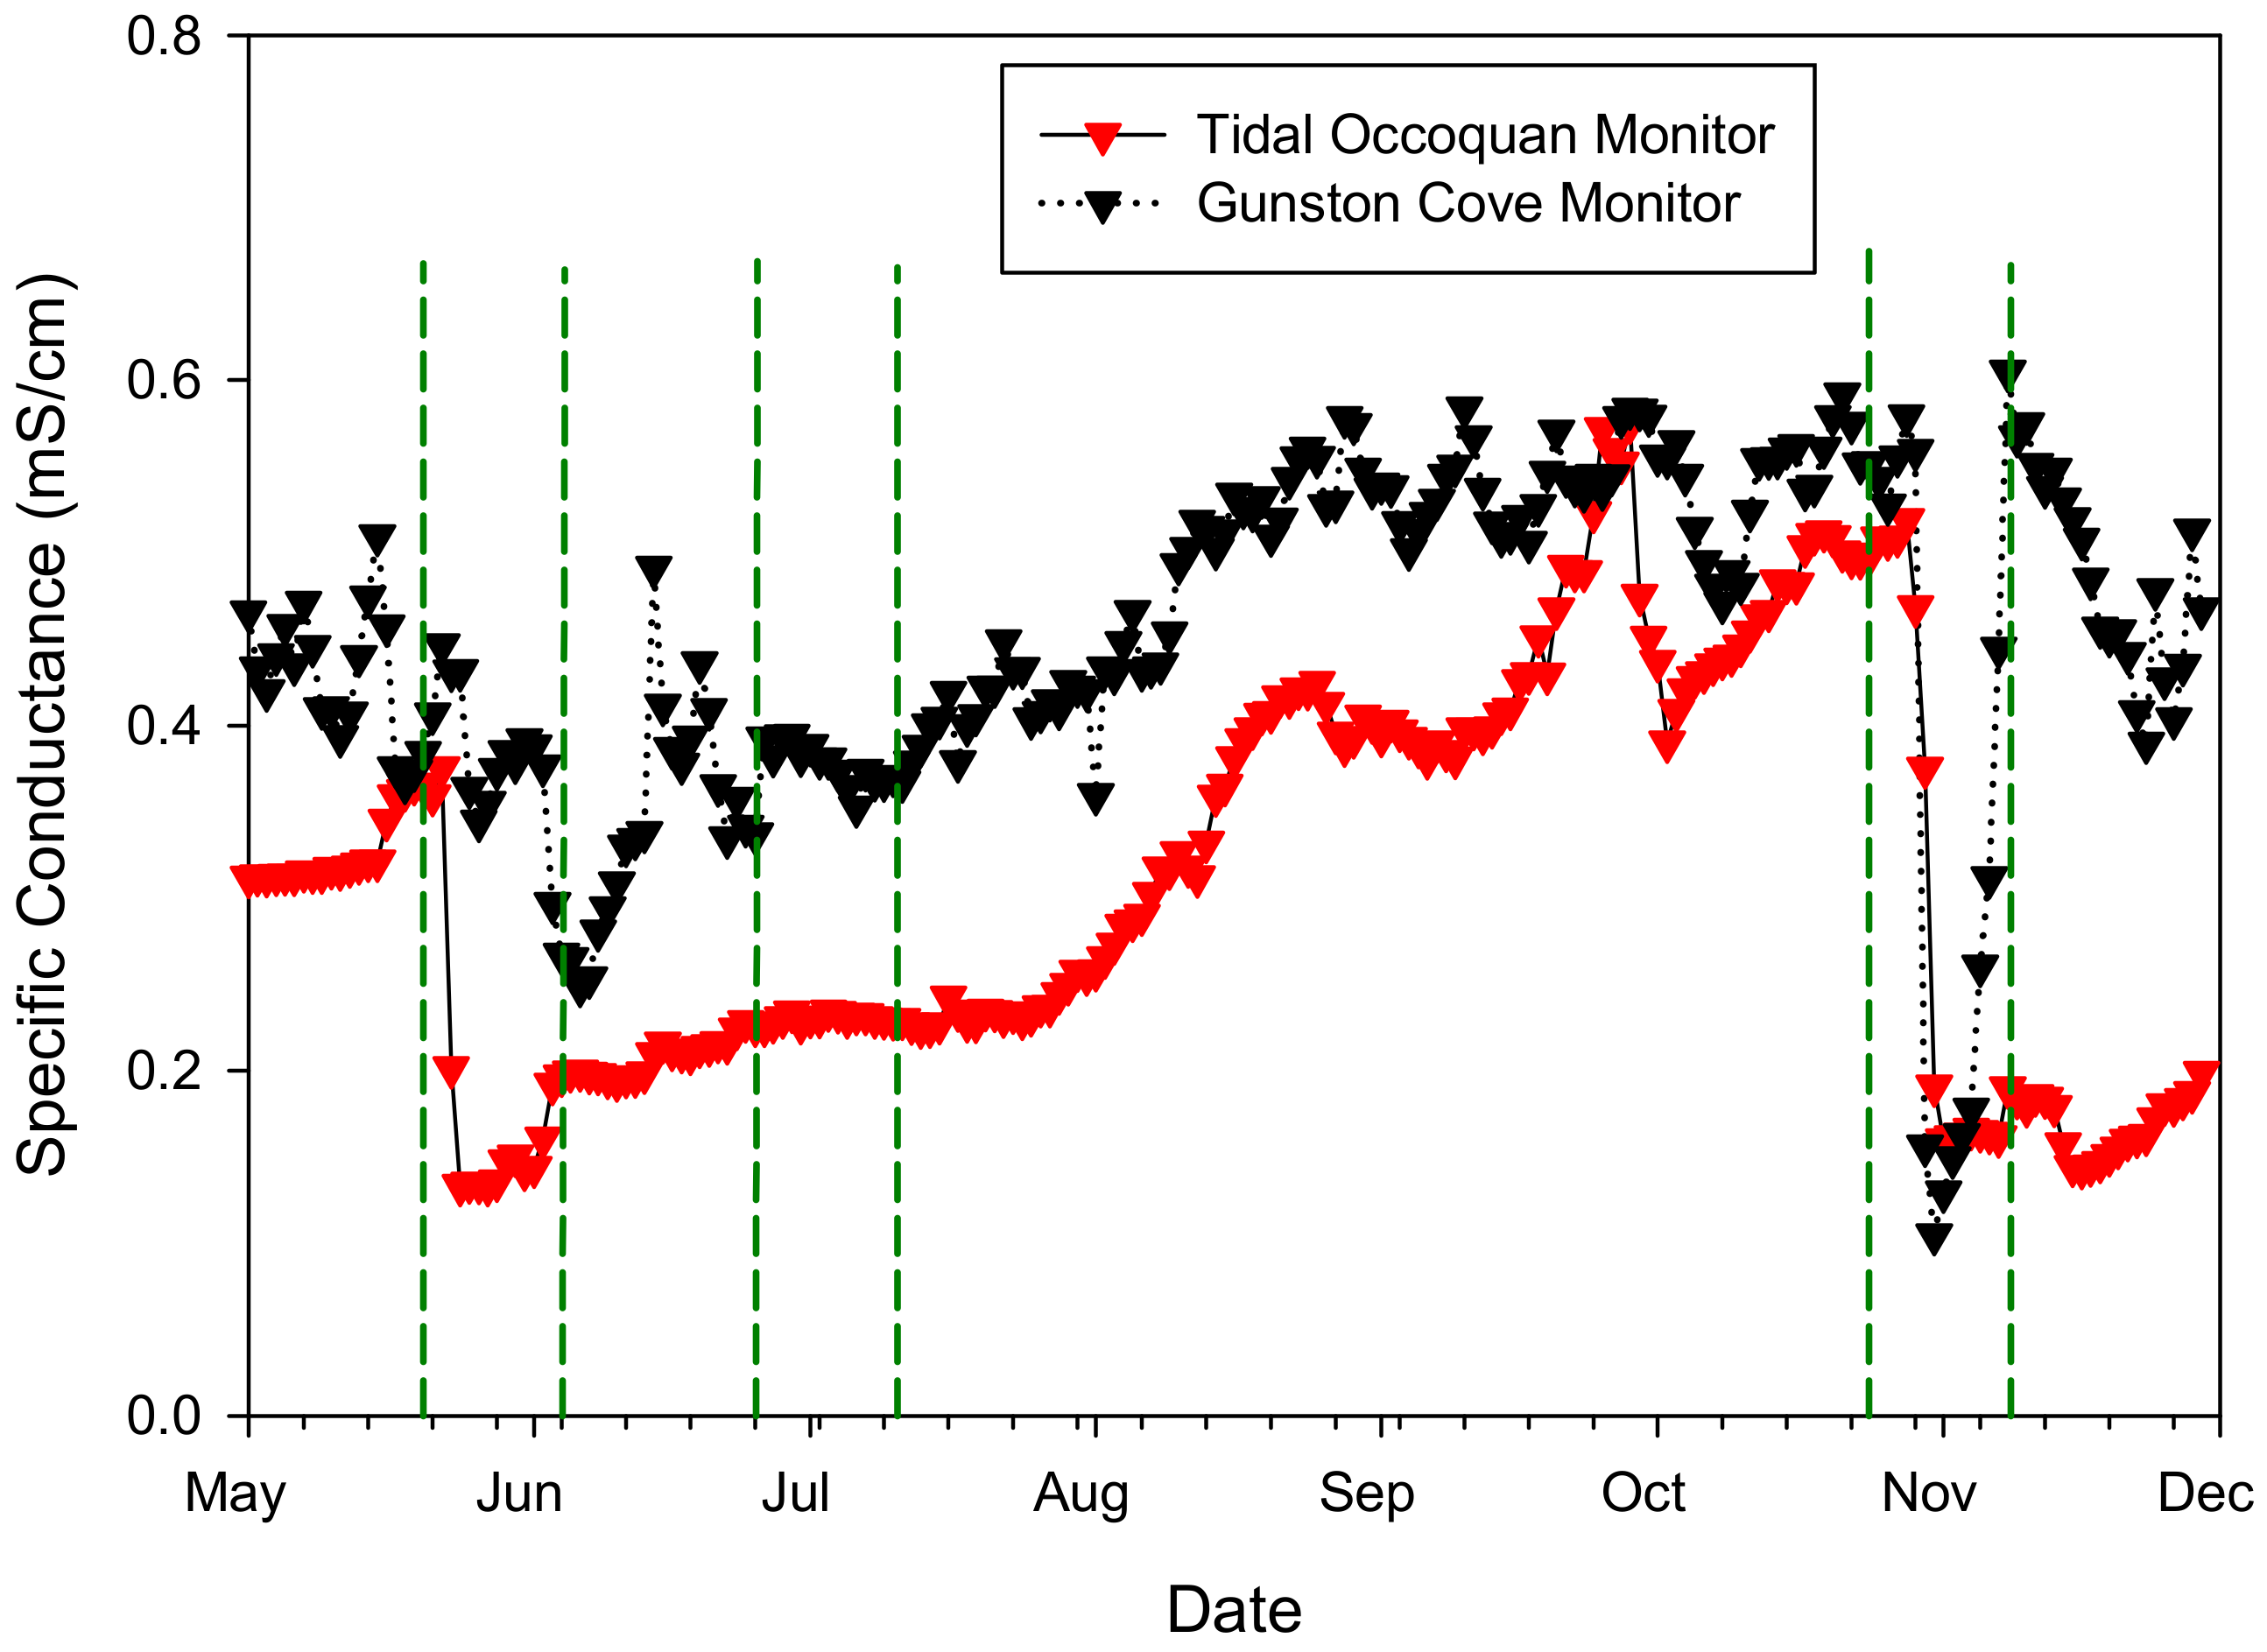
Daily mean specific conductance values were used to track seasonal changes in water mass characteristics. In both embayments there was a clear relationship with the major freshwater inflow events that occurred throughout the year, but the response varied somewhat between the two embayments (
Figure 3). In the tidal Occoquan, daily mean specific conductance fell sharply from 0.374 mS/cm on 22 May to 0.133 mS/cm on 24 May (during the late May freshwater release). The second flow event on 1 and 2 June did not further depress specific conductance. Daily mean specific conductance then generally increased throughout the summer until a maximum daily mean of 0.575 mS/cm was reached on 28 September. A moderately large flow event at that time caused specific conductance to dip to 0.390 mS/cm over the course of four days before rising gradually to 0.519 mS/cm by 28 October when Hurricane Sandy arrived and the freshwater release from the dam caused specific conductance to decrease strongly to 0.160 mS/cm in the span of four days. Meanwhile, daily mean specific conductance in Gunston Cove showed a similar, but less marked seasonal pattern. However, the Gunston Cove monitor exhibited more day-to-day variation throughout the year. A maximum daily mean specific conductance of 0.605 mS/cm was seen at the Gunston Cove monitor on 8 November, shortly after the minimum daily mean specific conductance of 0.105 mS/cm that occurred during Hurricane Sandy on 31 October. Gunston Cove more frequently had higher specific conductance, often between 0.35 mS/cm and 0.60 mS/cm, than the tidal Occoquan where specific conductance was often between 0.13 mS/cm and 0.33 mS/cm with values hovering around 0.25 mS/cm for much of the year.
Many of the variables were correlated with one another both within a site and between sites when daily means were examined. At the tidal Occoquan monitor, DO (% sat) and pH were highly intercorrelated and positively correlated with temperature and PAR, consistent with photosynthesis being the primary driver of these parameters (
Table 2). Both were negatively correlated with Occoquan flow, consistent with a flushing effect. Specific conductance was also negatively correlated with Occoquan flow, also consistent with flushing of tidal water with fresh water runoff of lower ionic content. Occoquan flow was strongly negatively correlated with temperature which was not surprising given that there was no flow over the dam during most of the summer.
At the Gunston Cove monitor, similar results were found (
Table 3). Again, DO and pH were strongly intercorrelated and correlated with water temperature and PAR. Both were also negatively correlated with Accotink flow. Interestingly, Accotink flow was not correlated with water temperature reflecting the episodic nature of flow in unregulated Accotink Creek throughout the summer. However, the negative correlation between specific conductance and tributary flow continued to be found indicative of a flushing and/or dilution effect.
The intercorrelation of daily mean values of each water quality parameter between the two sites was very strong indicating that the sites were responding in a generally similar, though not identical fashion to seasonal and episodic forcing (
Table 4).
3.4. An In-Depth Look at Three Selected Two-Week Periods
In order to gain a better understanding of the processes affecting water quality in the two embayments, three two-week periods were selected for further analysis. The two-week periods can be characterized by the freshwater inflow levels that occurred during the period. The first period was from 25 June to 10 July. This period was at the height of summer and there were relatively stable climatic and hydrologic conditions, including low freshwater inflows and relatively consistent PAR levels. The second period was from 20 May to 4 June. This period was during late spring when there were relatively high freshwater releases from the Occoquan dam into the tidal Occoquan around 23 May and 1 June. In Gunston Cove, there were relatively high flows coming from Accotink Creek at the end of May and the second highest flow rate at Accotink Creek occurred around 1 June. The PAR levels were also less consistent at this time of year. The last two week period explored is the period when Hurricane Sandy passed through the study area in late October and early November and brought the highest levels of precipitation that occurred during the study period.
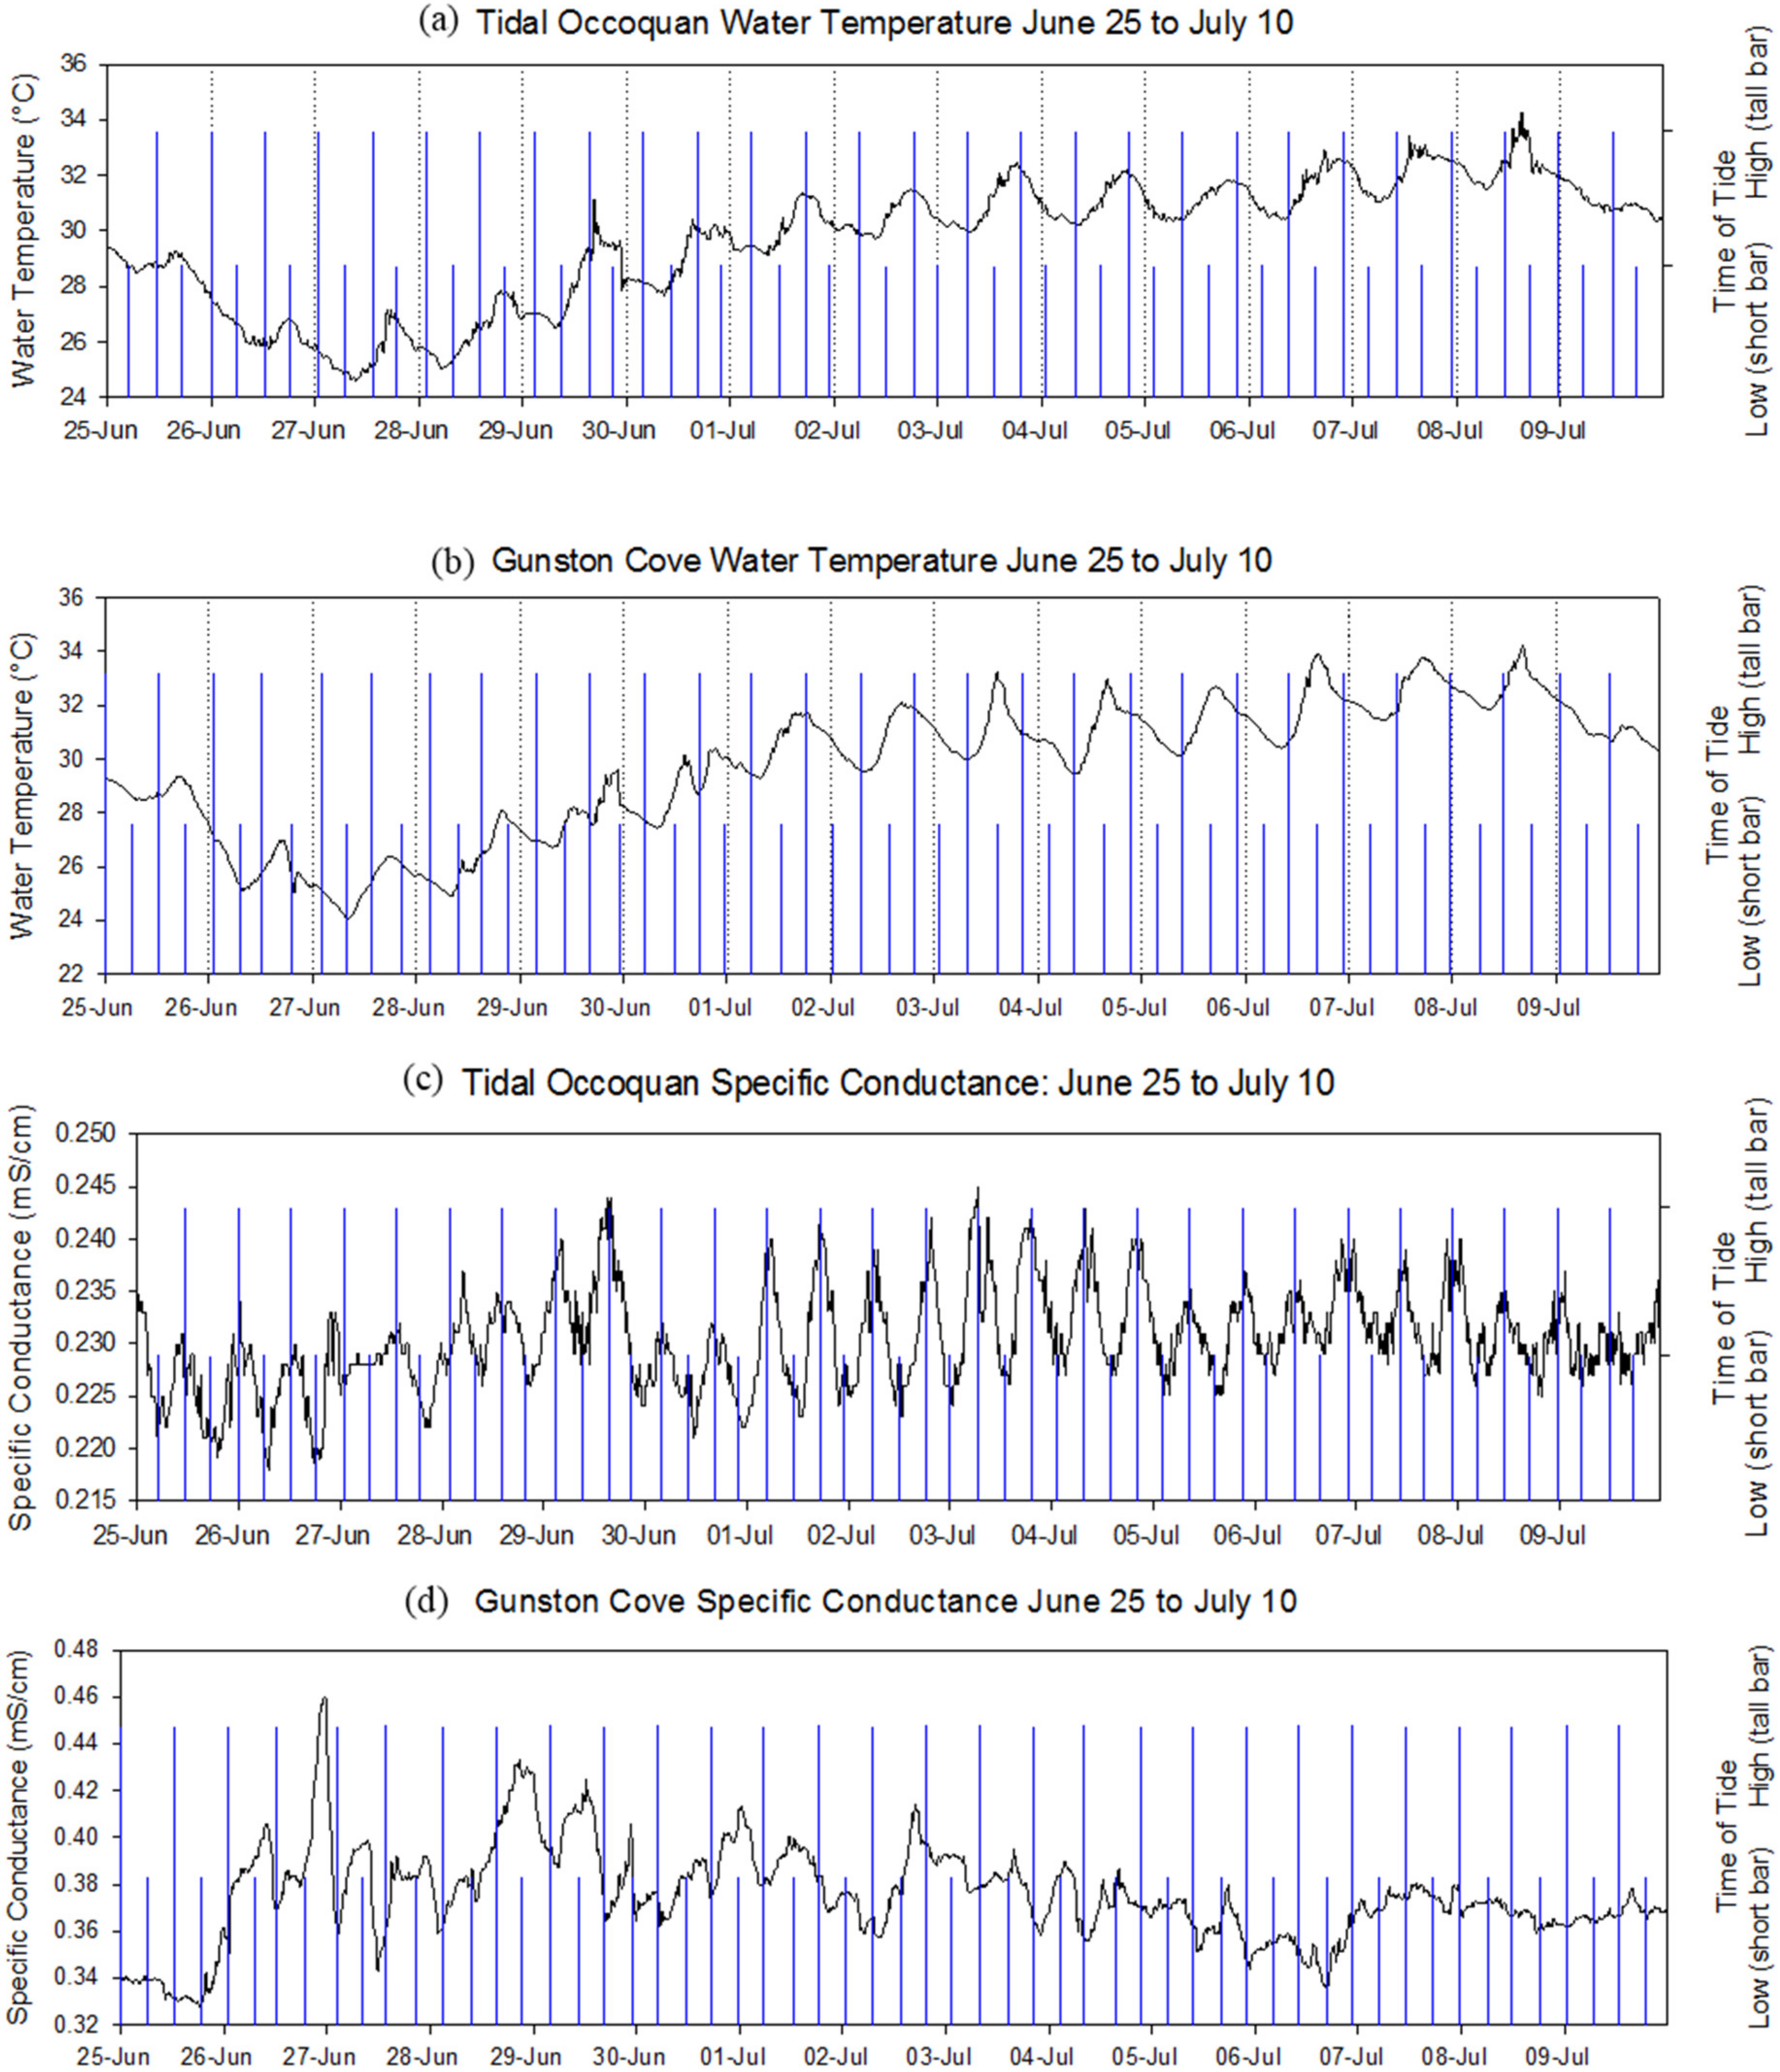
Water temperature patterns for the period of 25 June to 10 July were nearly identical for the tidal Occoquan and Gunston Cove (
Figure 4a,b). They both had a minimum between 24.0 °C and 25.0 °C occurring on 27 June and a maximum of about 34.0 °C occurring on 8 July. There were no obvious tidal effects on temperature as temperature data followed a strictly diel pattern, where maxima were reached toward the end of the daylight hours and minima occurred in the early morning.
During the 25 June to 10 July period, specific conductance patterns were strikingly different between the two sites (
Figure 4c,d). In the tidal Occoquan there is a clear tidally-related, semi-diel specific conductance pattern, where at high tides slightly brackish waters enter the embayment from the river mainstem and increase specific conductance (
Figure 4c). The average amplitude of specific conductance changes that occurred with the tides was between 0.010–0.020 mS/cm with a minimum of 0.218 mS/cm occurring on 26 June and a maximum of 0.245 mS/cm occurring on 3 July. In Gunston Cove, the specific conductance patterns were subject to more noise and appeared to have a different relationship with the tides (
Figure 4d). The low tides often correlated with high specific conductance values and high tides correlated with low specific conductance values (
Figure 4d). This is likely because the specific conductance of the water entering Gunston Cove from Pohick Creek is generally higher than the specific conductance of the water entering from the Potomac River during high tides. Pohick Creek specific conductance is high due to continuous discharges from the wastewater treatment facility. On certain occasions, the specific conductance pattern did not correspond with either high or low tides perhaps reflecting the complex mixing patterns of the effluent laden inflows with existing cove water.
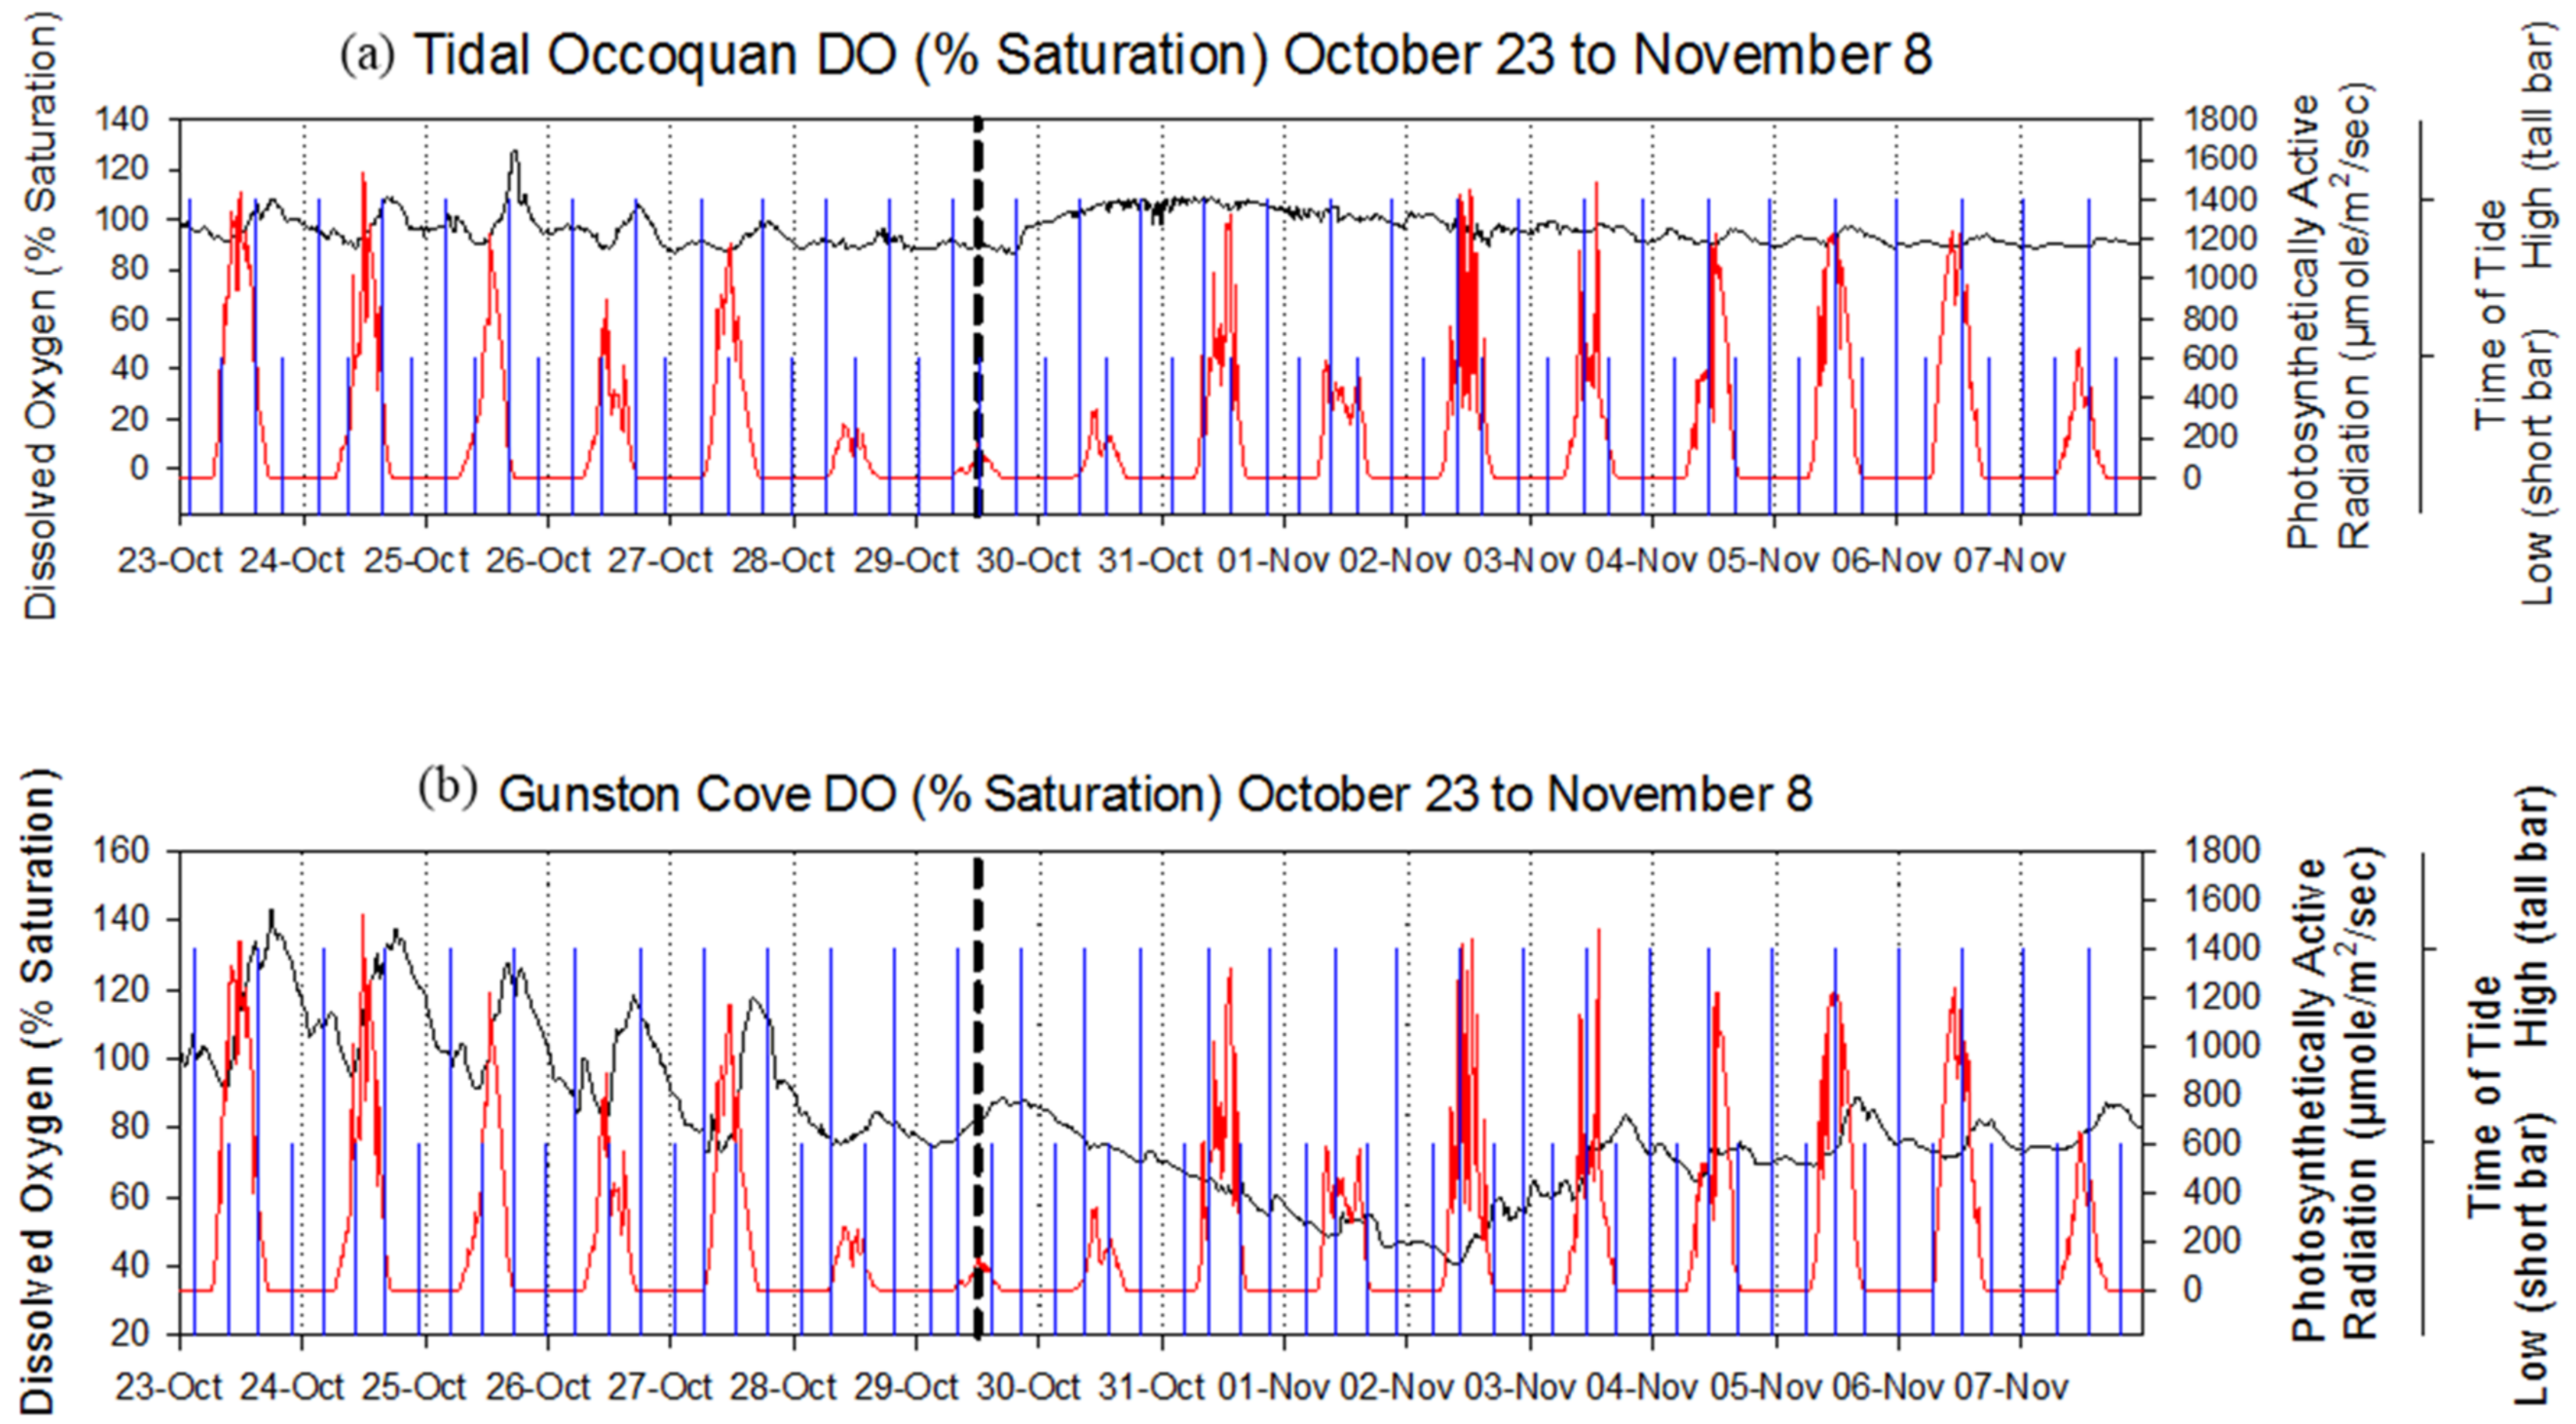
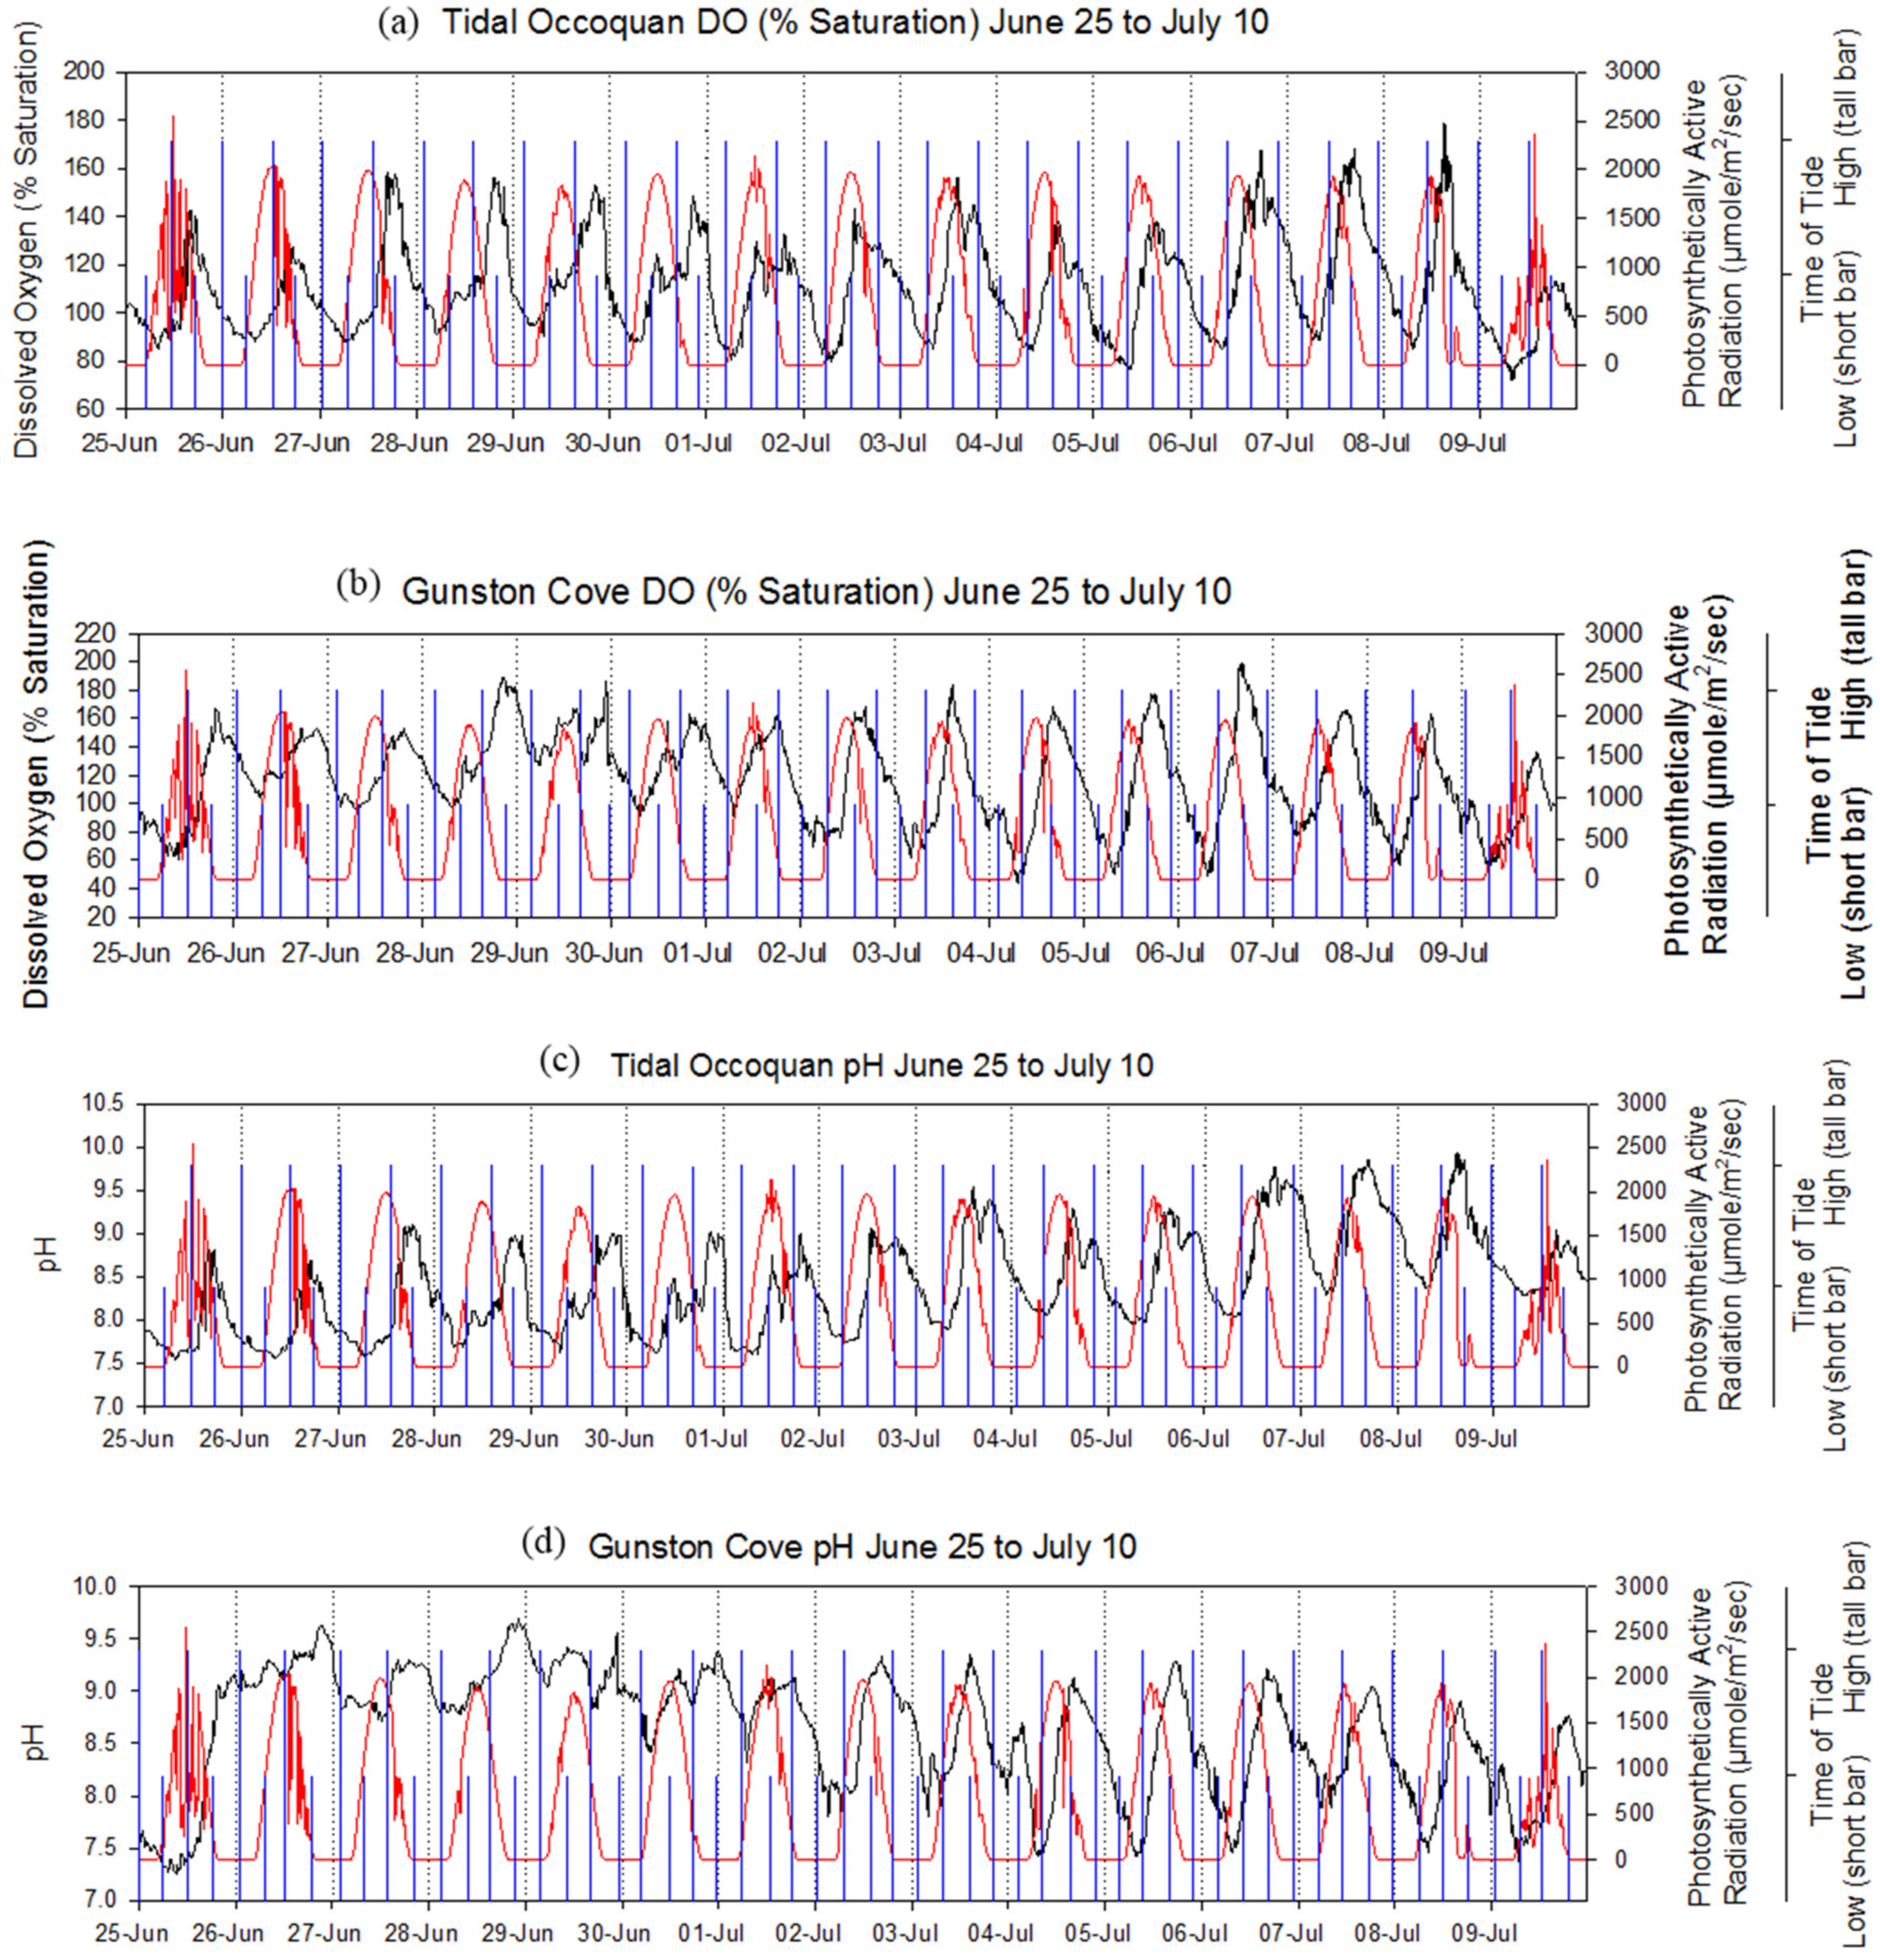
During the 25 June to 10 July period, DO at both sites exhibited strong diel patterns where daily maxima were generally reached approximately 6 h after the daily maximum PAR rate (
Figure 5a,b). During the two-week period, DO saturation in the tidal Occoquan reached a maximum of 179% on 8 July and a minimum of 71% on 9 July. In Gunston Cove, a maximum of 199% was reached on 6 July and a minimum of 44% was reached on 4 July, corresponding with higher daily amplitudes in DO in Gunston Cove versus the tidal Occoquan.
In the tidal Occoquan, pH diel patterns were subject to a little more noise than DO diel patterns during the 25 June to 10 July period but generally exhibited similar diel patterns (
Figure 5c). A minimum pH of 7.6 occurred on 25 June and a maximum of 9.9 occurred on 8 July, reflecting increases in the daily minima and maxima throughout the period. The daily amplitude was relatively stable at 1.5 pH units throughout the period. In Gunston Cove, the minimum pH of 7.3 occurred on 25 June and the maximum pH of 9.7 occurred on 28 June, while the daily maxima remained between 9.0–9.6 (
Figure 5d). However, the diel amplitude was not as stable and ranged from 0.5 units on 27 June to 1.8 units on 5 July. This was a result of the wide range exhibited by the daily minima. For example, 7.3 was the minimum on 25 June and 8.8 was the minimum on 29 June.
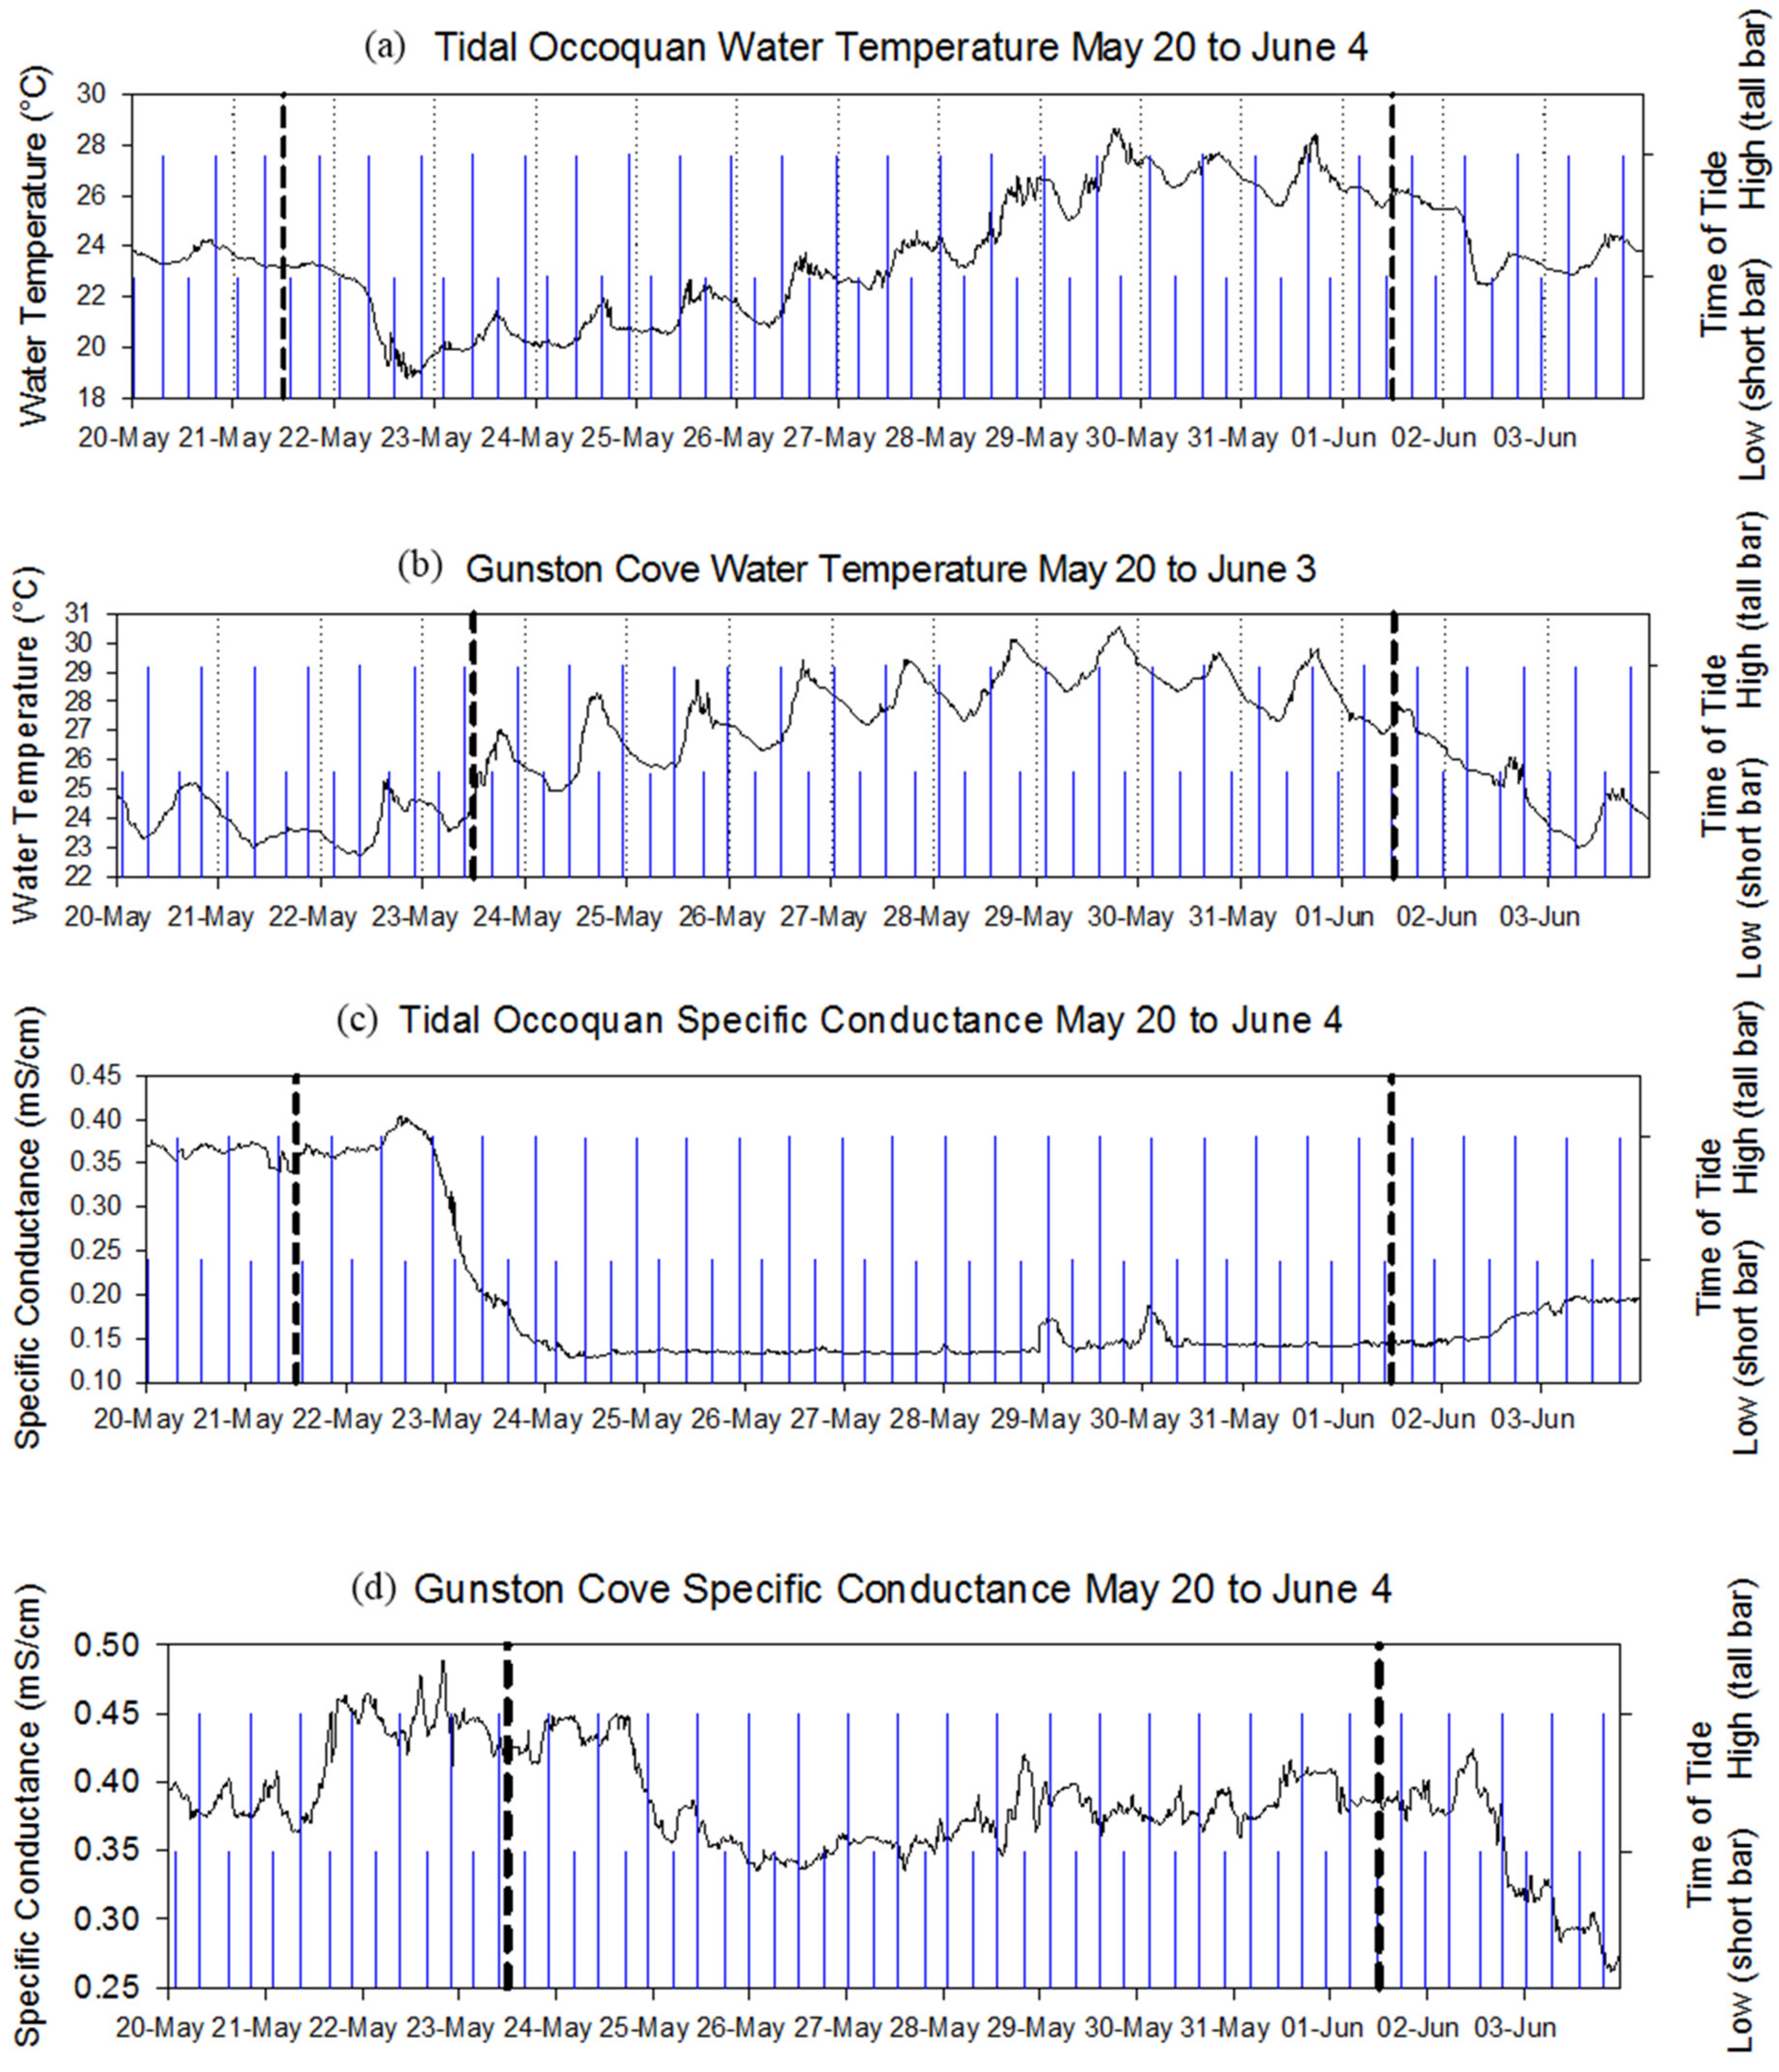
During the 20 May to 4 June period, when high freshwater inflows occurred and PAR rates were not very stable, water temperature appeared to be more strongly affected by freshwater inflows in the tidal Occoquan than in Gunston Cove (
Figure 6a,b). During the peak of the freshwater release from the Occoquan River dam, from about 21 May to the middle of 22 May, diel patterns in water temperature in the tidal Occoquan disappeared. This again occurred on 1 June during the less voluminous freshwater release; on both occasions the peak flow was followed by relatively rapid temperature decreases of about 4 °C. Outside of those two events, diel patterns in water temperature were apparent. A maximum of 28.7 °C occurred on 29 May and a minimum of 18.8 °C occurred on 22 May. In Gunston Cove, a consistent diel pattern in water temperature occurred throughout the period although it was clearly dampened by the flow event that occurred in early June. The diel amplitude during the early June flow event was about 1 °C which is half of the 2 °C diel amplitude that generally occurred prior to the event. A maximum of 30.5 °C occurred on 29 May and a minimum of 22.7 °C occurred on 22 May.
There was very little evidence of semidiel patterns occurring in the specific conductance data at either site (
Figure 6c,d) during the 20 May to 4 June period. At the end of 22 May, one day after the beginning of the freshwater releases from the Occoquan dam, specific conductance in the tidal Occoquan fell from 0.404 mS/cm to 0.143 mS/cm over the course of about 24 h. The semidiel pattern observed during the stable period at the height of the summer appeared to begin weakly on 29 May, but was shortly tamped out by the next major freshwater release that began on 30 May. The daily specific conductance pattern in Gunston Cove was even more irregular during this period than during the stable period explored above. However, inflow effects were clearly seen. During the first period of high flow in Gunston Cove, from 24 May to 25 May, specific conductance fell from 0.450 mS/cm to 0.335 mS/cm over the course of about 12 h and during the second period of high flow, from 2 June to 3 June, specific conductance fell from 0.424 mS/cm to 0.262 mS/cm over the course of about 36 h and remained at or below 0.300 mS/cm until 9 June. These findings reflect the disruption in semidiel tidal patterns caused by flow events.
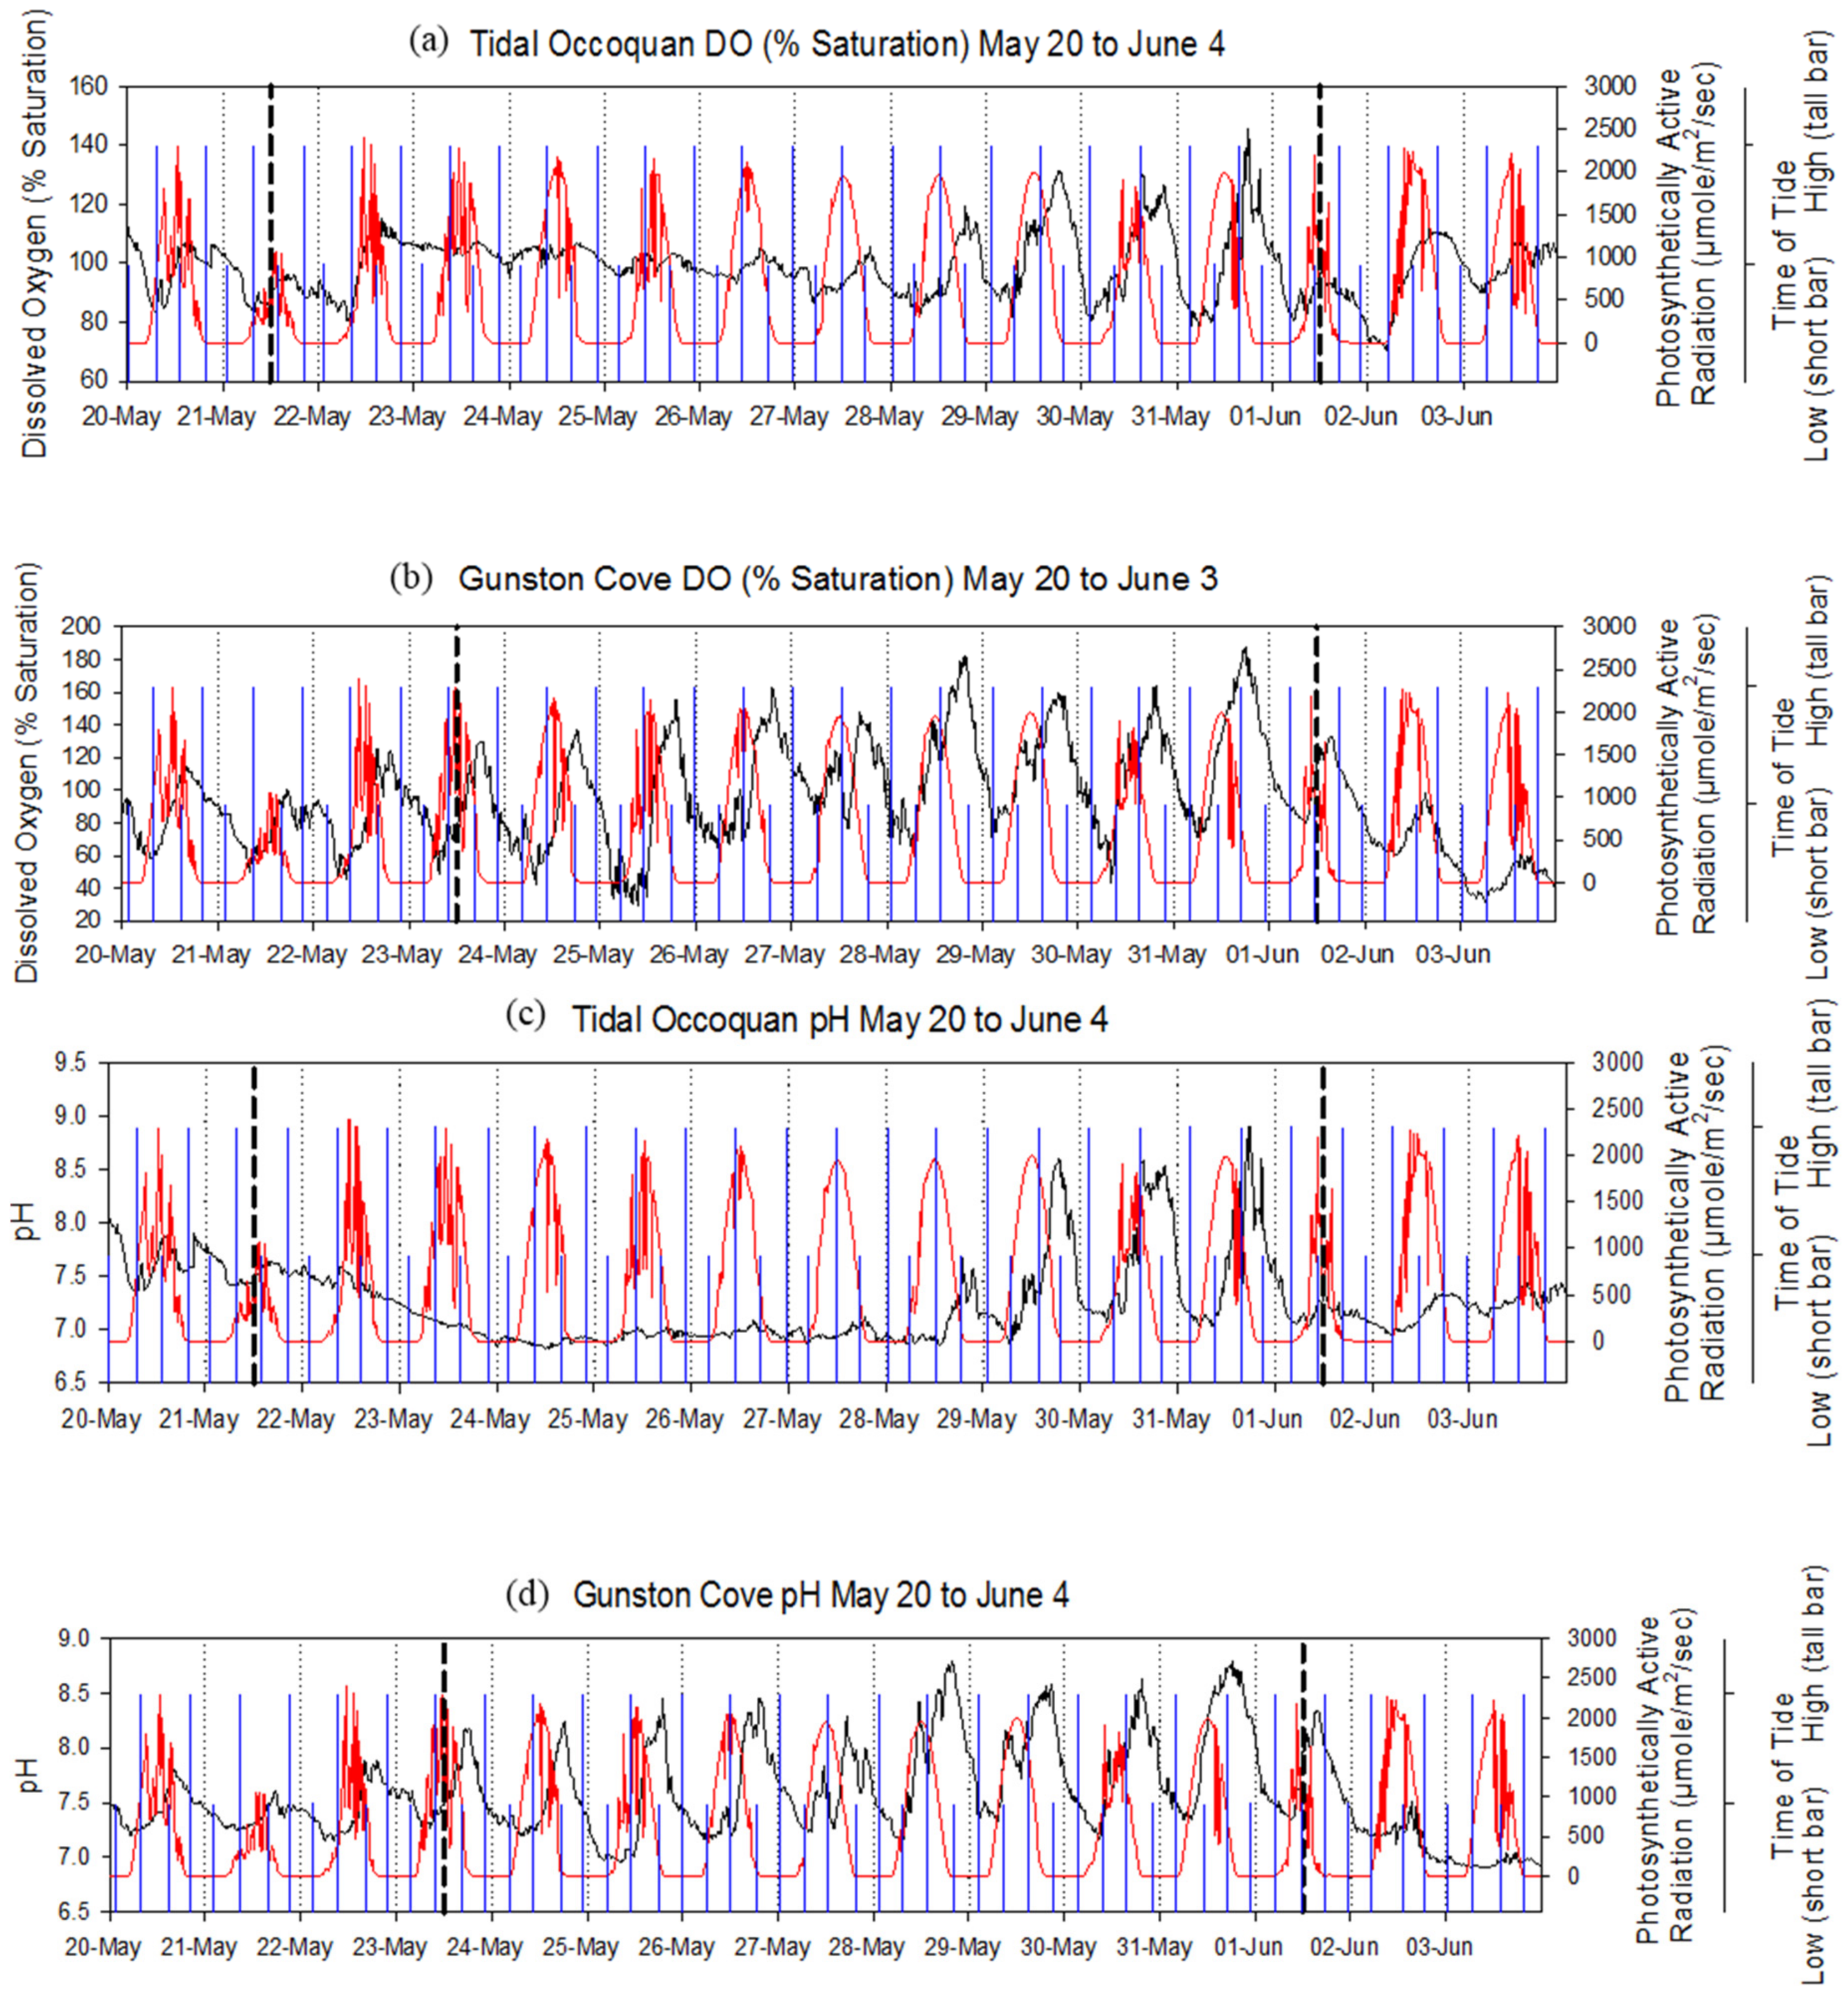
Diel patterns in DO in the tidal Occoquan were significantly dampened by the May flow event that occurred at the beginning of the 20 May to 4 June period (
Figure 7a). Diel amplitudes were between 5–10% from 22 May to 26 May and saturation values hovered around 100%, regardless of the relatively high PAR rates that occurred during that period. After the 22 May to 26 May period, diel patterns and amplitudes began reflecting what was seen in the stable summer period of 25 June to 10 July. The early June flow event had only transitory effects. In Gunston Cove, diel patterns and daily amplitudes similar to the stable summer period remained in effect throughout the May 20 to 4 June time period (
Figure 7b). However, DO saturation dipped to 29% on 25 May from 137% just 12 h prior. This was seen at about the same time specific conductance values reached a low, indicating a possible effect from the high flow rates.
During the 20 May to 4 June period in Gunston Cove and the tidal Occoquan, pH tracked well with the observed DO levels (
Figure 7c,d). In the tidal Occoquan, the effects of the first major freshwater release for the period were even more apparent in the pH data than in the DO data, as the diel patterns in pH were almost completely muted until 28 May. During that time, pH remained between 6.8 and 7.2 with little daily fluctuation. In Gunston Cove, pH diel patterns tracked almost perfectly with the DO diel patterns. A near minimum pH for the period of 7.0 occurred on 25 May, shortly after the first large flow event.
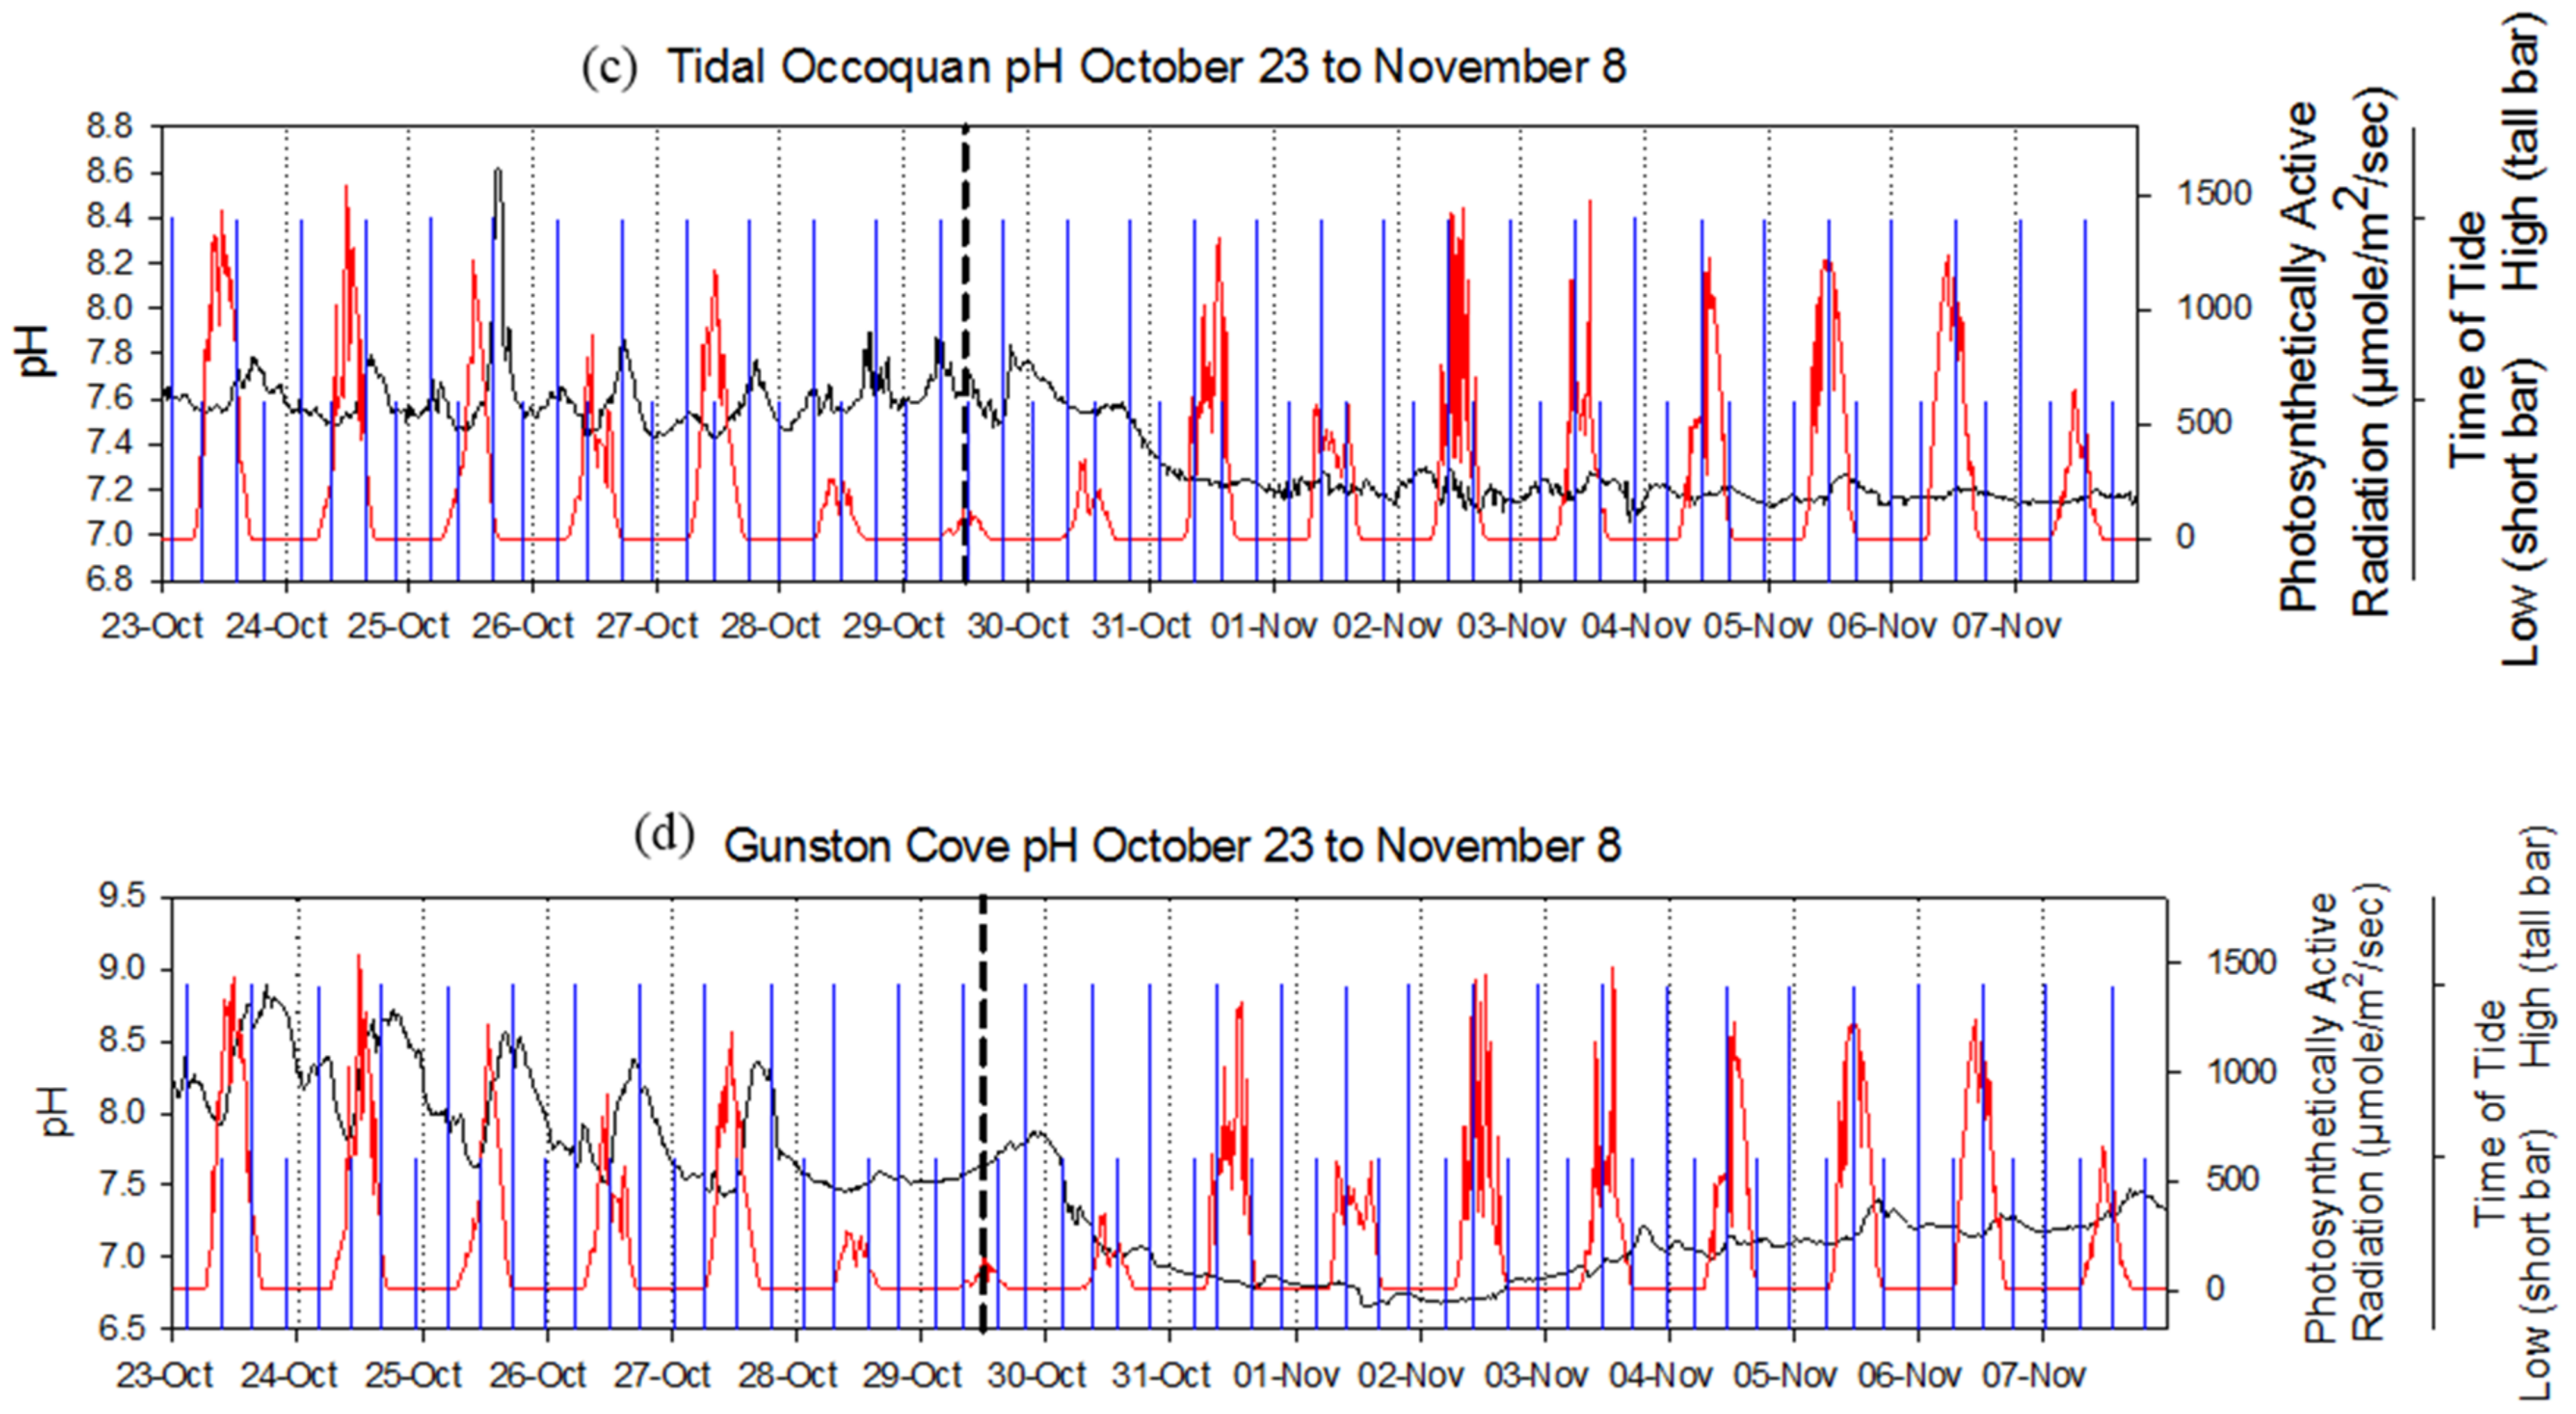
The final two-week period that was analyzed in-depth was the period of 23 October to 8 November, when water quality patterns were affected by Hurricane Sandy. Hurricane Sandy began to affect weather conditions on 28 October and reached its peak on 29 October. It had left the region by daylight hours on 31 October. Other than Hurricane Sandy, which arrived in the middle of the two-week period, the PAR levels were relatively stable and no other major flow events occurred during this third period.
Diel patterns in water temperature were visible in both the tidal Occoquan and Gunston Cove before and after Hurricane Sandy (
Figure 8a,b). However, before the storm, at both sites, temperatures were between 16.4 °C and 19.1 °C, and after the storm passed on 2 November they remained below 11.0 °C for the duration of the two-week period. In the tidal Occoquan, temperatures declined steadily from mid-day 27 October until 30 October when a temperature increase of about 1.0 °C was observed and remained for 12 h before dropping 5.3 °C overnight between 30 October and 31 October. The slight rise in temperature for 12 h was possibly a result of dam releases of freshwater already in the reservoir followed by release of water that had entered the reservoir during the storm. In Gunston Cove, a steadier decline in temperatures was observed, beginning at 2:00 pm on October 27 at 19.0 °C and declining to 10.2 °C by 2:00 am on 30 October. Diel patterns appeared to start recovering sooner in Gunston Cove than in the tidal Occoquan, with diel pattern recoveries occurring on 31 October and 3 November, respectively.
Specific conductance in the tidal Occoquan exhibited a similar decline as water temperature during Hurricane Sandy (
Figure 8c,d). Specific conductance was at 0.544 mS/cm on 29 October and declined to 0.362 mS/cm by the end of the day. It remained around 0.362 mS/cm until late in the day on 30 October and then fell to 0.161 mS/cm by the end of 31 October. Semidiel patterns were observed until the first decline on 29 October and were not observed again until the end of the day on 3 November. In Gunston Cove, specific conductance declined more steadily during the storm and at a faster rate (
Figure 8d). In a span of about 8 h, from late 31 October to the morning of 30 October, specific conductance declined from 0.520 mS/cm to 0.125 mS/cm. Prior to the hurricane’s effects, the semidiel specific conductance pattern characteristic of Gunston Cove was apparent but, after Hurricane Sandy, this pattern was not observed again with any distinguishable regularity in the two-week period.
Diel patterns in DO were also disrupted by Hurricane Sandy. At the beginning of the two-week period in the tidal Occoquan, diel patterns in DO were not very pronounced but they were observable (
Figure 9a). However, during Hurricane Sandy all DO diel patterns were interrupted and did not appear to return for the rest of the two-week period. In the tidal Occoquan, DO remained between 85% and 100% after the hurricane left the study area. In Gunston Cove, a strong diel pattern with amplitude of about 40% was still occurring prior to the hurricane’s arrival (
Figure 9b). This was disrupted by the hurricane activity and a diel pattern did not begin to return until 3 November, and even then, it did not surpass an amplitude of 20% for the rest of the period.
In the tidal Occoquan, pH was exhibiting a diel pattern and a less dominant semidiel pattern prior to Hurricane Sandy (
Figure 9c). The freshwater releases from the dam interrupted that pattern. The pH in the tidal Occoquan also fell by 0.6 units over 32 h. In Gunston Cove, pH was exhibiting a more pronounced diel pattern which was consistent with the diel pattern that was observed in the DO data from that period (
Figure 9d). This pattern, like the DO pattern, was interrupted on 28 October, and was strongly dampened for the remainder of the two-week period.
4. Discussion
General correlations of daily mean values at each monitor location revealed strong coupling between DO (%saturation) and pH and a significant correlation between these values and PAR consistent with a strong role for photosynthesis in driving these variables. Mean daily DO and pH were negatively correlated with tributary flow at each site, indicating that flushing might be a controlling factor when inflow was elevated.
These relationships were further explored by closely observing the behavior of 15 min values over selected approximately two-week periods. Under stable conditions with little freshwater input, there was a strong diel cycle in water temperature, DO (%saturation), and pH that were clearly related to the solar cycle at both sites. Diel temperature variations were 2 to 4 °C and maximum values were found in late afternoon regardless of tide stage. Dissolved oxygen varied from 100 to 200 percentage units and pH 1 to 2 units geared similarly to the solar cycle and not to the tides.
During this stable period, specific conductance exhibited a semi-diel pattern at both sites that was consistent with a tidal effect. At the tidal Occoquan site, this effect was very striking, with clear maxima associated with each high tide and clear minima with each low tide. The higher values are indicative of an influence of river mainstem water that was slightly elevated in ions moving upstream at high tide and a greater influence of lower conductance tributary water from upstream at low tide. At the Gunston Cove monitor, this effect was less consistent and showed signs of a reversal. In the case of Gunston Cove, there was an additional factor. The Noman Cole wastewater treatment plant discharge was elevated in conductance, generally 1000 to 2000 uS/cm. During a stable, low tributary inflow period, this constant source of water of elevated ions altered the pattern. First, specific conductance overall was higher in Gunston Cove than in Occoquan Bay. While still indicative of freshwater conditions, specific conductance was generally twice as high at the Gunston Cove monitor. Second, since higher conductance water was sourced from upstream, the conductance cycle was often reversed: low tide had the highest conductance on many dates, Finally, due to the complexities of mixing in the cove, the diel pattern conductance was not as consistent at Gunston Cove as at the tidal Occoquan.
Freshwater inflows to the area were not consistent, but were marked by both seasonal patterns and specific flow events. Highest flows generally and major flow events in particular were found mainly in the spring and fall. Flows were clearly elevated throughout the study area in late May and early June. By the end of June water was no longer being discharged over the Occoquan dam and this situation continued until the next major release event in late September. Occoquan flow declined again in October until the very large flow event in early November due to Hurricane Sandy. Flows into Gunston Cove as evidenced by the Accotink Creek gauge also showed their highest peaks at similar times , but were more episodic and showed somewhat lower peaks thoughout the summer.
As noted earlier, there were three major releases to the tidal Occoquan River in 2012: 21–25 May (72 × 10
6 m
3); 1–2 June (16 × 10
6 m
3); and 29–30 October (42 × 10
6 m
3). All three of the flow events were capable of flushing out most, if not all, of the water in the tidal Occoquan and replacing it with reservoir water since the entire volume of the tidal Occoquan River and the tidal Occoquan complex is estimated at 35 × 10
6 m
3 [
12]. This effect is clearly shown by the specific conductance data observed at the tidal Occoquan monitor. Both the 21–25 May and the 29–30 October flow events resulted in drastic declines in specific conductance at the Tidal Occoquan monitor which brought levels down below 0.2 uS/cm, similar to what is generally observed in tributaries to the upstream reservoir.
Two of these events also brought higher flows to Gunston Cove: 1–2 June and 29–30 October. The data presented previously was for a gauge which covers 61.9 km
2 which is only a portion of the Gunston Cove tributary watershed area of 219.4 km
2. Thus, the Accotink Creek flow gauge readings were extrapolated to determine a total inflow volume for the two days to the cove. This resulted in a total mean flow rate of 49.6 m
3/s for 1 June yielding a total inflow volume of 4.3 × 10
6 m
3 for that day. Adding that to the calculated inflow volume of 3.4 × 10
6 m
3 for 2 June, the total inflow volume for those two dates was approximately 7.7 × 10
6 m
3. Calculated using the same assumptions, the total inflow volume for 29–30 October was determined to be 15 × 10
6 m
3. The total surface area of Gunston Cove is 9 × 10
6 m
2 [
20] and the average depth is about 1.65 m, therefore, the total volume of Gunston Cove is 14.8 × 10
6 m
3. As a result, these two major flow events were capable of flushing out most, if not all, of the water in Gunston Cove. Specific conductance in Gunston Cove responded to these two major flow events in a fashion similar to that observed in the Tidal Occoquan. A very large decline was observed in the wake of the late October-Hurricane Sandy event. The effect was smaller, but still marked for the early June event.
To ascertain what effect these major flow spikes has on daily and short-term multiday patterns, two additional multiday intervals were examined. The 20 May–4 June period revealed the strong effect of the 20–25 May flow event on both specific conductance levels and daily patterns, particularly at the tidal Occoquan monitor. In addition to lowering values generally, the typical semidiel pattern was eliminated for more than 10 days. At the Gunston Cove monitor overall values were decreased somewhat by both the 21–25 May and 1–2 June events, but the effect on daily cycling was less obvious. Similarly, daily patterns in DO and pH at the tidal Occoquan monitor were strongly affected by both flow events in the 20 May–4 June period, with typical diel cycles disappearing for days on end. The Gunston Cove DO and pH cycling was clearly affected by the 1–2 June event.
The large 29–30 October flow event had major effects on cycling of all parameters at both sites. Due to being later in the year, the SAV had died back significantly and phytoplankton densities were reduced so diel cycling in temperature, DO and pH had already been reduced. In the aftermath of this large flow even it disappeared completely for most of the period examined.
Water quality patterns at the two sites showed many similarities. DO and pH, under stable conditions and especially during the summer months, exhibited strong diel patterns in both Gunston Cove and the tidal Occoquan, suggesting that photosynthesis and respiration were affecting water quality at those sites and times without significant contribution from tidal activity. Buzzelli et al. [
2] found this diel pattern in a tidal creek in the southeastern United States that had a high storage volume, a wide marsh upstream and a robust phytoplankton community. The finding by Wenner and Geist [
4] that estuarine sites with tidal amplitudes less than 1 m will have DO and pH patterns dominated by diel patterns also holds true in both Gunston Cove and the tidal Occoquan. However, DO diel amplitudes and variability were different between the two sites. There was greater amplitude and variability in DO values in Gunston Cove versus the tidal Occoquan. The diel patterns in pH and DO in Gunston Cove also appeared to be more resistant to disruption from freshwater inflows than those in the tidal Occoquan, as evidenced by the diel patterns seen in the 20 May to 3 June time period.
Specific conductance, during periods of stability, exhibited a semidiel pattern in both Gunston Cove and the tidal Occoquan, reflecting the characteristic 12-h tidal period of the tidal freshwater Potomac River. This finding also corresponds with the tidal activity and salinity relationship Wenner and Geist [
4] found at nine continuously monitored estuarine sites of the southeastern United States. Other studies also found this relationship at various oligohaline sites on the east coast of the United States [
3,
8,
10]. However, there was a significant difference between the specific conductance diel patterns found in Gunston Cove and the tidal Occoquan. In Gunston Cove, high specific conductance occurred during low tides and low specific conductance occurred during high tides. The opposite relationship was true in the tidal Occoquan. This suggests that the specific conductance of the water entering Gunston Cove from Pohick Creek was generally higher than the water entering from the Potomac River channel, even during stable periods defined by low precipitation. The elevated specific conductance of releases from the wastewater treatment plant and its variable mixing in to cove waters likely contributed to the less regular semidiel pattern seen in Gunston Cove versus the tidal Occoquan which had no immediate wastewater discharge impacts
Periods of instability, defined primarily by high freshwater inflows, affected the water quality at both sites in different ways. Using the two-week period when Hurricane Sandy passed by as an example, it was seen that both sites had similar responses in water temperature. This response was a significant drop in temperature followed by a recovery in diel patterns within a few days. DO and pH, on the other hand, did not behave the same way at each site and the signals indicated that DO and pH diel patterns recovered faster in Gunston Cove than the tidal Occoquan. Other studies of continuously monitored water quality have found diel and semidiel recovery periods ranging from 2 days to 2 weeks after major precipitation events [
8,
9].
Specific conductance had the most varied responses between the two sites. In Gunston Cove specific conductance decreased significantly during the storm but recovered by 8 November, though the semidiel pattern did not recover. Meanwhile in the tidal Occoquan, specific conductance also decreased significantly but did not increase to the levels it was at prior to the hurricane. However, the semidiel pattern did recover by 3 November. This strongly suggests that the controlled flows in the tidal Occoquan allow for semidiel patterns in specific conductance to reestablish faster than those in Gunston Cove.
Studies such as Findlay et al. [
6] have shown that DO can be much higher in vegetated areas than channel areas. This heterogeneity in water quality within embayments makes it important to place continuous monitors in similar areas when comparing two embayments. The results from this study seem to illustrate that importance. As such, a future study of these two embayments would be served well by either placing both monitors in a channel area or both monitors in a vegetated or nearshore area. Monitors could also be placed in a nearshore vegetated area and a channel area within the same embayment to determine whether one site could acceptably represent the characteristics of the entire embayment.


