Abstract
The study investigated the performance of the pre-denitrification membrane bioreactor (MBR) process to treat high-strength wastewater generated from food waste disposals. Extracellular polymeric substances (EPS) as membrane foulant and microbial community profiles were analyzed under different hydraulic retention time (HRT) operation conditions. The pre-denitrification MBR was effective for treating food wastewater with high chemical oxygen demand (COD)/N resulting in high total nitrogen (TN) removal efficiency. The operational data showed that effluent qualities in terms of COD, TN, and TP improved with longer HRT. However, membrane fouling potential as shown by specific membrane fouling rate and specific resistance to filtration (SRF) increased as HRT increased. The longer HRT conditions or lower influent loading led to higher levels of bound EPS while HRT did not show large effects on the level of soluble microbial products (SMP). The restriction fragment length polymorphism (RFLP) analysis showed similar microbial banding patterns from the sludges generated under different HRT conditions, indicating that HRT had minimal effects on the composition of microbial communities in the system. All these results suggest that the MBR with pre-denitrification is a feasible option for treating high-strength food wastewater and that different HRT conditions could affect the operational performance and the fouling rate, which is governed via changes in microbial responses through EPS in the system.
1. Introduction
In South Korea, use of food waste disposers has been restricted due to the national policy on disposal and recycling of food waste and concerns about increase in wastewater loading to the wastewater treatment facilities (WWTFs). The separate disposal and treatment of food waste, however, usually requires large sites and substantial capital and operational costs. Some studies reported that food waste could be actually effectively treated in WWTFs because it contains high water content [1]. Use of food waste disposers and on-site treatment, especially for small-decentralized apartments and communities, can be an interesting option to manage the high-strength organic waste stream [2].
A lot of on-site wastewater treatment processes have been developed and become popular in Japan: most of these systems are household-sized units with a capacity of 1–2 m3/day [3]. The disposer system combined with on-site wastewater treatment has also been studied in Japan [4] and this process is different from the disposer system widely applied in USA where disposer wastewater gets transported to the municipal WWTFs. In order to remove nitrogenous and carbonaceous pollutants simultaneously, biological nutrient removal (BNR) processes are generally used in wastewater treatment. In particular, the pre-denitrification process like the modified Ludzack-Ettinger (MLE) process could be most pertinent to kitchen wastewater with a high COD to nitrogen ratio. Application of BNR-based activated sludge process to the disposer system has also shown successful performances [3,4]. However, in the conventional process, sludge settling often becomes problematic due to the bulking nature of sludge treating high-strength wastewater.
The membrane bioreactor (MBR) process is a biological wastewater treatment process with enhanced solid-liquid separation by the use of a membrane in the conventional activated sludge system [5]. In the MBR, adoption of long solids retention time (SRT) is possible, which usually allows high biomass concentration and good operation flexibility [6]. These advantages are also needed for treatment of high-strength wastewater like wastewater from food waste disposer system [7,8,9]. In recent years, the MBR coupled with the pre-denitrification has been used for treating many types of wastewater [10,11]. In MBR operation, HRT is an important operation parameter [12] since HRT values are directly related with the volume of reactors and removal performance [13]. In a submerged MBR for the treatment of food wastewater, HRTs in the range of 15–30 h produced effluents with acceptable water qualities. Although the treatment capacity increases with lower HRTs, lower HRT has been reported to cause increase in the rate of membrane fouling in MBRs [12]. Membrane fouling and the need of cleaning could result in higher operational and maintenance costs compared to the conventional activated sludge system.
Extracellular polymeric substances (EPS) are considered an important factor for causing membrane fouling in MBR, though the concentrations of these microbial metabolites are often small [14,15]. Bound EPS implicates properties of hydrophilic and hydrophobic organic colloids, which can cause bio-cake on the membrane surface [12,16]. Soluble microbial products (SMP), which is believed identical to soluble EPS, are high molecular weight compounds released during cell lysis and cell growth, creating high resistance of the membrane and leading to a decline of permeate flux. Thus, investigation of EPS and SMP is an important issue in reducing membrane fouling in MBR [17,18]. However, there are only a few studies reporting process performance and investigation of EPS and SMP in the pre-denitrification MBR, especially for such system treating high-strength food wastewater. Moreover, previous studies have often failed to show the dynamic nature of activated sludge microflora and the community interactions within the MBR reactor, which are crucial factors in determining the characteristics of activated sludge and hence various microbial metabolites (i.e., EPS and SMP).
The purpose of the present study was, thus, to investigate the performance of a pre-denitrification MBR process for treating disposer wastewater under various HRT conditions and to analyze EPS, SMP, and microbial community to better understand their effects on treatment performance and membrane fouling under different HRT conditions.
2. Materials and Methods
2.1. Reactor Set-Up and Operation
Three laboratory scale MLE-type MBR systems were constructed and consisted of 4 L of anoxic tank and 8 L of aerobic tank. The membrane module was submerged in the aerobic tank as shown in Figure 1.
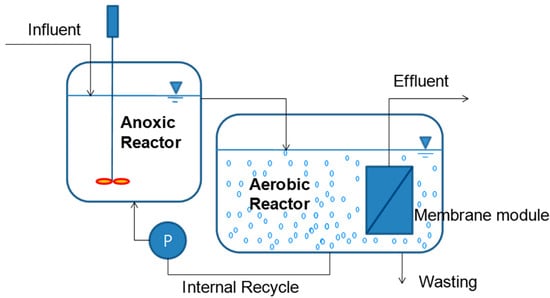
Figure 1.
Schematic diagram of the MLE-type MBR.
The hollow fiber membrane (KMS Co. Ltd., Yongin, Korea) was used and it was characterized by nominal pore size of 0.4 μm and total membrane area of 0.2 m2. The reactors were fed synthetic kitchen disposer wastewater and the effluents were directly withdrawn out of the membrane module by using a suction pump. Sewage sludge was obtained from a waste water treatment plant (WWTP) in Seoul, Republic of Korea and used as the inoculum in this study. Obtained sludge was pretreated to remove impurities using a sieve with a pore size of 500 μm. The MBR process was operated at a constant permeate flux mode except for the event of sampling the activated sludge for analysis and wasting of excess sludge.
Three MBR systems were operated in parallel at three different HRTs (Table 1). As an effort to diminish the membrane fouling, effluents (membrane permeate) were withdrawn intermittently with the sequential intervals of 10 min suction and 2 min idle period. On 28th day of MBR operating, the membrane was taken out from reactor and physical cleaning was performed by flushing. In addition, backwashing of the membrane (chemical cleaning) was also conducted with NaClO.

Table 1.
Operation parameters.
The aeration was continuously provided at the bottom of the tank using a diffuser. The flux for permeate was set at 7.5–15 L/m2-h for the three MBR systems. The corresponding hydraulic retention time (HRT) of the process was 18–36 h (Table 1), which is longer than typical HRT used in the MLE process for sewage treatment [19]. The flow rates of influent wastewater, internal recycle, and excess sludge wasting were maintained by peristaltic pumps. The MBR operated in this study did not include return activated sludge (RAS) while the internal recycle ratio (IR) was maintained high for enhancement of nitrogen removal. Operational conditions in this study are summarized and compared with those of the MLE-type MBR process in Table 1.
2.2. Disposer Wastewater Characterization
Synthetic disposer wastewater was prepared for laboratory experiment based on the typical composition of the actual disposer wastewater monitored in a pilot facility in Korea [20]. Making up of disposer wastewater also followed the previously suggested standard food waste [1,4] in order to reduce the fluctuation of influent. Food waste used in the present study showed the following composition (wet weight gram in 35 L of tap water): Carrot: 45; Cabbage: 45; Banana skin: 25; Apple: 25; Grape skin: 25; Cooked chicken: 20; Fish: 25; Egg shells: 5; Rice: 25; Tea leaves: 10; Bean flour: 24; Corn steep liquor: 30 mL. Food waste was ground and stored at 4 °C refrigerator before use. This resulted in the composition of disposer wastewater as shown in Table 2.

Table 2.
Composition of synthetic disposer wastewater used in this study.
2.3. Extraction and Analysis of EPS and SMP
The study of Park and Novak [21] was referred to establish the protocol for studying EPS and SMP in the current MBR study. Extraction and separation of EPS and SMP were first performed. Briefly, 40 mL of sludge was initially centrifuged (12,000 g × 15 min) to separate soluble fraction of sludge and the pellet. The soluble fraction was collected and used for analyzing SMP. The remaining pellet was resuspended in a low strength phosphate buffer saline (PBS) (2 mM KH2PO4, 6 mM Na2HPO4, and 10 mM NaCl) and underwent sonication to extract bound EPS. Sonication was performed following the procedure of Teague et al. [22] and using a Fisher Scientific Model 500 Sonic Dismembrator (Fisher Scientific, Hampton, NH, USA) on 40 mL of sludge in a 100 mL glass beaker. The sonication probe was placed centrally and 1 cm above the bottom of the sample. The glass beaker was surrounded with crushed ice in order to minimize temperature increase as a result of sonication. Sonication was applied at 20% intensity (80 W) for 1 min. The sonicated sludge was then centrifuged (12,000 g × 15 min) again to separate the extracted materials from the residuals. The supernatant from the centrifuge step was used to measure bound EPS.
2.4. DNA Extraction and RFLP Analysis
Duplicate biomass samples of 1 mL were taken from each unit of the three different systems at the end of this study. The biomass was preserved in 50% ethanol immediately upon sampling, and stored at −20 °C prior to analysis. The sample was then centrifuged at 13,000× g for 10 min after which the supernatant was decanted. The pellet was washed with 1 mL of deionized and distilled water (DDW) and centrifuged once again in the same manner to ensure a maximal removal of residual medium. The supernatant was carefully removed and the pellet was resuspended in 100 µL of DDW. Total DNA in the suspension was immediately extracted using a power soil DNA isolation kit (Mobio, INC., Carlsbad, CA, USA). Purified DNA was eluted with 100 μL of Tris–HCl buffer (pH 8.0) and stored at −20 °C for further analyses.
The bacterial 16S rRNA gene was amplified using two universal bacterial primers, 11f (5’-GTTTGATCCTGGCTCAG-3′) and 1492r (5’-TACCTTGTTACGACTT-3’) [23,24]. The thermal profile used for the universal amplification was: initial denaturation at 95 °C for 5 min; 35 cycles of 95 °C for 30 s; 55 °C for 30 s; 72 °C for 45 s; and final extension at 72 °C for 10 min. For restriction fragment length polymorphism (RFLP) analysis, we digested 16S rRNA gene amplicons using MspI restriction enzymes at 37 °C for 3 h, respectively. The restriction digestion mixture contained 9 mL of PCR product, 1mL of enzyme buffer and 1 mL of 10U of restriction enzymes. The digested 16S rRNA gene was electrophoresed at 60 V for 2 h in horizontal 2.0% (wt/vol) agarose gel in a TAE buffer system. After electrophoresis, the gel was stained with ethidium bromide, examined by UV transillumination and photographed.
2.5. Chemical Analysis
Biochemical oxygen demand (BOD), suspended solids (SS), chemical oxygen demand (COD), total nitrogen (TN) and total phosphorous (TP) contents in the samples were measured according to the procedures shown in Standard Methods [25]. Dead end filtration was conducted using Amicon Cell (Amicon Corp., Bedford, MA, USA) in order to examine the flux behaviors of the sample at a constant filtration pressure. Protein concentrations in both SMP and EPS were quantified by the Lowry method using bovine serum albumin as a standard [26]. Polysaccharides in the same fractions were analyzed using the Dubois method using glucose as a standard [27].
3. Results and Discussion
3.1. Performance of the Pre-Denitrification MBR on Food Wastewater
Designated volume of mixed liquor suspended solids (MLSS) was wasted from the system to maintain SRT at about 45 days. Table 3 summarizes the performance results of the three MBR systems treating high-strength food wastewater.

Table 3.
Performance MLE type MBR.
The average MLSS concentrations increased as HRT decreased due to higher influent organic loading. The effluents were mostly stable and changed according to loading variation (Figure 2).
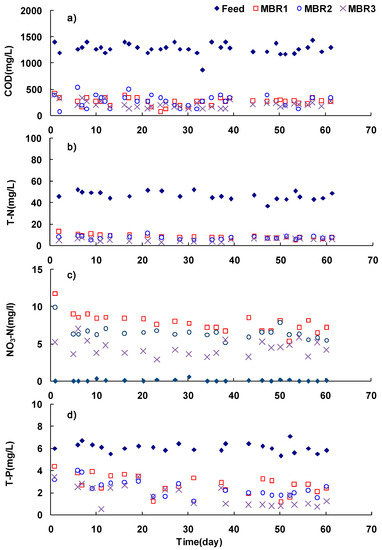
Figure 2.
Water quality change over the experimental period ♦, influent □, MBR1 ○, MBR2: (a) COD; (b) T-N; (c) nitrate nitrogen; (d) T-P.
Although suspended solids (SS) in the effluent was extremely low, the effluent COD was relatively high at 220–280 mg/L corresponding to 79–83% overall COD removal efficiency and this removal efficiency was comparable with previous research [28]. The high COD concentration in the effluent was likely associated with two sources: the residual non-biodegradable organic substances present in the high-strength wastewater and soluble microbial products (SMPs) associated with the growth and decay of biomass. Fuchs et al. reported that the artificial wastewater, which was easily biodegradable, showed more than 90% of COD removal efficiency while wastewater containing hard to biodegraded biomass had lower COD removal efficiency [29]. Good removal of total nitrogen was achieved with efficiency greater than 82% since high COD/N ratio of the wastewater (approximately 27) was beneficial for denitrification and the biodegradable organics could be effectively used for denitrification in the anoxic reactor. On the other hands, in spite of the low concentration of phosphorus in the influent, phosphorus removal efficiency was shown in the range of 54 to 72%. This low removal efficiency was most likely due to process characteristic (not specifically designed for biological removal of phosphorus) and long SRT in three systems.
3.2. Effects of HRT on Nutrient Removal in the Pre-Denitrification MBR on Food Wastewater
Biological denitrification is strongly subject to the COD/N ratio of wastewater and the COD/N ratio of 8 to 9 is generally suggested for the effective denitrification [30,31]. The high COD to N ratio, approximately 27, of the disposer wastewater used in this study was much higher than that from the typical sewage, so it was presumed to be suitable for the process like MLE with pre-denitrification unit as shown in Table 1. In general, effluent nitrogen concentration could be controlled by internal recycle ratio (IR) due to nitrate loading to anoxic tank but it was determined by HRT under the fixed IR condition used in this study. The concentration of nitrate leaving out of the aerobic reactor is calculated by mass balance on nitrogen in the aerobic reactor including nitrogen synthesized into biomass [32]. As the MLE-type MBR does not involve RAS, the equation can be simplified as follows:
where: NO3 is effluent concentration of nitrate, TN0 is influent total nitrogen, IR is internal recycle ratio, HRT is hydraulic retention time of the system, and SRT is solids retention time of the system.
For the given amount of nitrogen concentrations and IR, the effect of the HRT on the effluent nitrate concentration is illustrated in Figure 3.
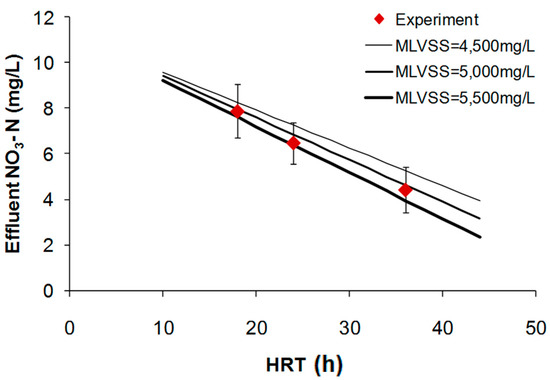
Figure 3.
Effect of HRT on effluent nitrate nitrogen concentration.
As shown in Figure 3, the nitrogen concentrations in effluent were decreased according to HRT increased. It is widely known that the increasing of HRT value lead to decreasing of substance concentration in effluent for a certain influent substance concentration. The experimental data was well fitted with the values calculated by Equation (1) demonstrating that increased HRT could enhance the removal efficiency of nitrogen under fixed IR condition in MLE-MBR.
The removal of phosphorous from wastewater can be achieved by wasting the biomass that accumulates phosphorus by cell assimilation. Theoretically, phosphorus removal of the treatment system is governed by wasting of excess sludge biomass and it is also dependent on the biomass growth rate. Therefore, phosphorus concentration of effluent could be expressed as a function of HRT under the fixed SRT condition as follows [32]:
where: P is effluent phosphorus concentration, P0 is influent phosphorus concentration, fp is phosphorus content in biomass.
The parameters used for the calculation were as follows: phosphorus content (fp) was based on typical fraction (2.67%) of P from C5H7O2NP0.1 and average influent phosphorus (P0) was measured to be 6.1 mg/L. Figure 4 shows the observed and calculated effluent phosphorus concentrations for a wide range of HRTs.
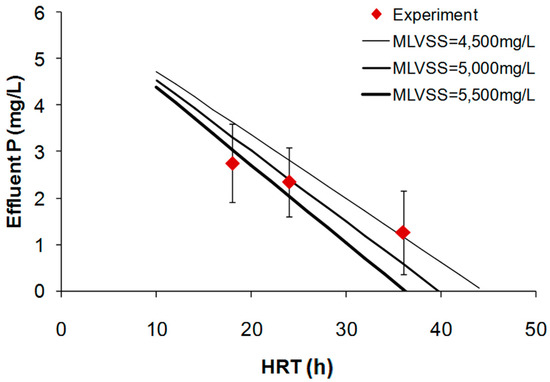
Figure 4.
Effect of HRTs on effluent phosphate concentration.
Effluent phosphorus was not very low since the SRT was maintained at a high value of 45 days. Both calculated and experimental P data showed that P removal through cell synthesis and biomass wasting increased with increase in HRT. Overall experimental data on effluent N and P obtained from the three pre-denitrification MBR systems could be comparable with those predicted from the well-known engineering equations. It was certain that higher HRT led to better N and P removal in the studied process.
3.3. Membrane Fouling
The most relative part of system to treat food wastewater in this study was MBR. Hence, the membrane fouling and maintenance need to be investigated along the wastewater treatment performance. Furthermore, COD and BOD concentrations of the influent were 1276 and 750 mg/L, respectively, which were about 4 to 6 times higher than those of the typical domestic wastewater [33,34,35]. This led to adoption of long HRT in this study. Long HRT and high MLSS concentration associated with MBR could also lead to generation of a substantial amount of EPS and were thought to affect membrane biofouling [36].
In the experiments, the permeation of membrane was conducted at three constant fluxes of 15, 11.25 and 7.5 L/m2-h, corresponding to HRT (h) of 18 (MBR 1), 24 (MBR 2), and 36 (MBR 3), respectively. Transmembrane pressure (TMP) was monitored to examine the trend of the membrane fouling under three different flux conditions, and the result are shown in Figure 5.
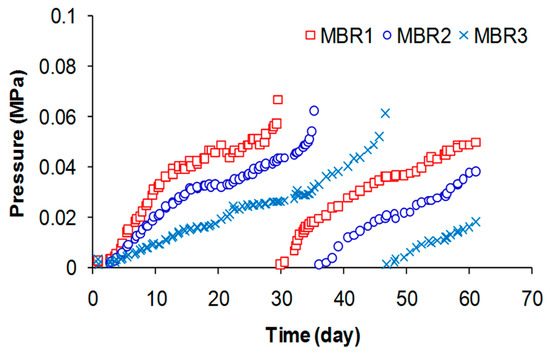
Figure 5.
Transmembrane pressure profiles and cleaning.
With the high flux of 15 L/m2-h (MBR 1), the increase of pressure drop occurred rapidly. On 28th day, the membrane was first taken out of the reactor and then physical cleaning was performed by flushing and backwashing of the membrane followed by the chemical cleaning with NaClO. Permeability of membrane got improved after cleaning with the decrease of pressure from 0.065 to 0.003 MPa. There was no significant difference in TMP changes between virgin (first operating period) and non-virgin (second operating period) membrane. In general, chemical cleaning is more effective than physical cleaning to recover flux in membrane system [37]. The chemical and physical cleaning were conducted together and original state of membrane was almost restored. A constant and slower fouling rate is expected at higher cleaning levels, while an exponential increase in the fouling rate is expected at lower cleaning levels [38]. Appropriate cleaning level for energy saving and fouling amelioration should be considered.
To determine the specific resistance of the sludge to filtration, dead end filtration experiment was conducted. The time to permeate volume (t/V) versus the cumulative permeate volume (V) was plotted to calculate the specific resistance of filtration (SRF) (Figure 6).
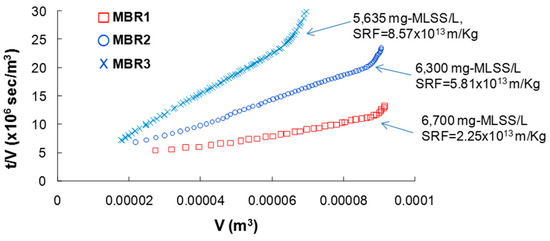
Figure 6.
Plot of the time to permeate volume (t/V) versus the permeate volume cumulative (V) and calculated specific resistance of filtration (SRF).
The SRF value was calculated by linear regression for the given filtration data normalized by concentration of MLSS [39]. The data clearly showed that higher SRF, an indicator for the higher membrane fouling, was seen with lower HRT. This result is consistent with the TMP data described above (Figure 5), indicating that system HRT has a large effect on the membrane fouling.
Finally, the specific membrane fouling rate, the rate of TMP increase per the specific flux set (dTMP/Flux), was plotted along given HRT (Figure 7).
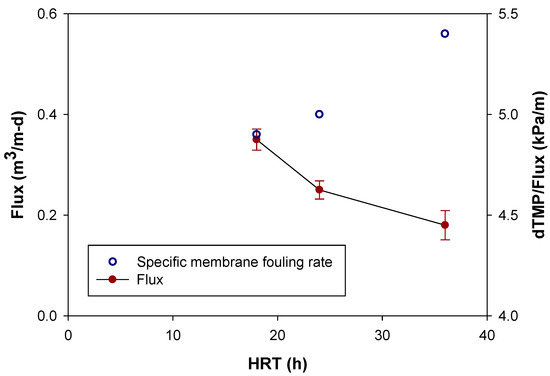
Figure 7.
Effect of HRT on Membrane fouling rate and flux.
As the flux and HRT increased, the specific membrane fouling rate increased. Specifically, at HRT of 18, 24 and 36 h, dTMP/Flux was 4.9, 5.0, and 5.4 kPa/m, respectively. The observed data from the current study, together with previous research in the literature, reveal that HRT is significant operating parameter that affect membrane performance in MBR process [40].
3.4. EPS and SMP in the Reactor
It is known that activated sludge EPS originate from microbial metabolism, cell lysis, and organic matter adsorbed from wastewater such as human fecal proteins from influent sewage [28]. For the pre-denitrification MBR system treating high-strength wastewater from food waste disposer, production of EPS could be affected by various factors such as organic loading (HRT), SRT, carbon source, and limiting nutrients, etc. [41,42]. Figure 8 shows both SMP and sonication-extracted EPS obtained from aerobic sludges in three MBR systems.
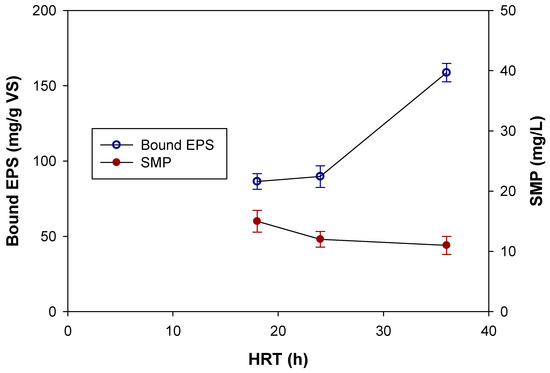
Figure 8.
SMP and bound EPS in mixed liquor.
In view of the fact that SMP can be defined as ‘soluble compounds that do not include the initial substrate nor its biodegradation products’ [43], measurement of SMP is considered identical to the materials found in effluent permeate. As the data shows, there was not large variation between SMP in effluent COD from three systems. However, it can be clearly seen that bound EPS (sum of protein and polysaccharide) was greatly influenced by HRT used in the system. The bound EPS showed 86.4, 89.7, and 158.7 mg/g VS for the sludges obtained from MBR 1 (18 h HRT), MBR 2 (24 h HRT), and MBR 3 (36 h HRT), respectively. It is clear that short HRT employed in MBR 1 caused higher expression of bound EPS into the sludge. These data clearly indicate that HRT led to large effects on production of EPS from sludge and that the higher membrane fouling occurrence seen earlier was strongly associated with difference in bound EPS.
3.5. Microbial Community Profile by RFLP Analysis
RFLP analysis reveals genetic fingerprints that can provide information about the composition and changes in microbial communities. The diversity of the microbial community in this study was estimated by examining overall banding profile and counting the number of bands on RFLP gels, in which each band corresponded to a different taxon. This is one of the simplest ways to describe community diversity in the complex microbial system. Samples from more diverse microbial communities are expected to produce more RFLP bands.
All three systems started with the same seed sludge, removing variation in seed microorganisms in different systems. RFLP was performed on sludges from both aerobic and anoxic reactors at the end of the operation (day 62). As Figure 9 shows the diversity of the microbial communities was not that high as seen with a few number of bands in each reactors.
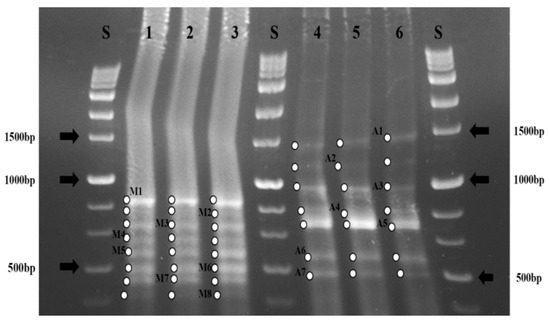
Figure 9.
RFLP pattern analysis of bacterial 16S rRNA gene digested with MspI; Lane 1 = MBR1; Lane 2 = MBR2; Lane 3 = MBR3 in the aerobic membrane reactor; Lane 4 = MBR1; Lanes 5 = MBR2; Lane 6 = MBR3 in the anoxic activated sludge reactor.
More importantly, the composition of the microbial communities in each reactor was very similar, resulting in the same banding pattern on RFLP gels despite the fact that systems were operated under different feed conditions for long time. Although the composition of the microbial communities did not vary under various feed loading, different conditions between the aerobic (Lane 1–3) and anoxic reactors (Lanes 4–6) resulted in different composition of the microbial communities, as demonstrated by different banding patterns. In addition, eight bands in the aerobic reactors and seven bands in the anoxic reactors were observed respectively, indicating different diversity. These results indicate that different metabolic conditions (aerobic vs. anoxic) led to selection of different microbes but different organic loading by varying HRT did not influence much on the composition of bacteria.
As seen above, differences in HRT influenced the level of bound EPS and membrane fouling rate. The lack of difference in microbial composition by different HRT may support the hypothesis that the effects of HRT on membrane fouling are largely governed by the expression of EPS as microbes undergo physiological adaptation in each system. However, an alternate way to explain the little difference seen in RFLP data could be that a community with some numbers of taxa are present at concentrations below the threshold detection limit of the RFLP. Such a situation could also result in a decrease in the number of RFLP bands detected.
4. Conclusions
The study investigated the performance of the pre-denitrification MBR process treating high-strength food wastewater. The main focus of the study was to investigate the effect of HRT on operational performance; both on effluent permeate quality and membrane fouling. We also investigated the role of EPS, SMP, and microbial community in membrane fouling in the pre-denitrification MBR system. The specific conclusions obtained from this study are as follows:
- Suspended solids were removed by the membrane system ensuring 99% of removal efficiency and the system could be effective to remove suspended solid in food wastewater.
- Effluent COD was relatively high due to high concentrations of non-biodegradable organic substances and SMP.
- High COD/N (~27) in food wastewater permitted effective biological denitrification achieving TN removal efficiency greater than 82% for the three systems. However, high SRT used in MBR did not allow effective TP removal due to characteristics of the system (not conceived for P removal).
- Longer HRT in general showed better effluent quality in terms of effluent COD, TN, and TP.
- HRT showed large effects on membrane fouling that could be assessed by changes in TMP, increase in SRF, and high membrane fouling rate. Longer HRT led to high membrane fouling.
- HRT also showed large effects on the level of bound EPS. However, that effect was not readily seen from the microbial composition assessed by RFLP.
- Overall, the pre-denitrification MBR is feasible for treating high COD/N food wastewater. When applying pre-denitrification MBR process, higher HRT is preferable in terms of better effluent quality and lower membrane fouling potential due to smaller bound EPS existing in sludge.
Acknowledgments
This paper was supported by Konkuk University in 2016.
Author Contributions
All authors contributed to the work presented in the manuscript. Ki Young Park and Jongkeun Lee conceived and designed this study, and Jongkeun Lee performed the analysis of documents and organized research data under advising from coauthors. Jongkeun Lee discussed observed data with Jae Woo Lee, Young Mo Kim, Chul Park, and Ki Young Park. The manuscript was mainly prepared and arranged by Jongkeun Lee and Ki Young Park.
Conflicts of Interest
The authors declare no conflict of interest.
References
- Gonzales, H.B.; Takyu, K.; Sakashita, H.; Nakano, Y.; Nishijima, W.; Okada, M. Biological solubilization and mineralization as novel approach for the pretreatment of food waste. Chemosphere 2005, 58, 57–63. [Google Scholar] [CrossRef] [PubMed]
- Battistoni, P.; Fatone, F.; Passacantando, D.; Bolzonella, D. Application of food waste disposers and alternate cycles process in small-decentralized towns: A case study. Water Res. 2007, 41, 893–903. [Google Scholar] [CrossRef] [PubMed]
- Ichinari, T.; Ohtsubo, A.; Ozawa, T.; Hasegawa, K.; Teduka, K.; Oguchi, T.; Kiso, Y. Wastewater treatment performance and sludge reduction properties of a household wastewater treatment system combined with an aerobic sludge digestion unit. Process Biochem. 2008, 43, 722–728. [Google Scholar] [CrossRef]
- Sankai, T.; Ding, G.; Emori, N.; Kitamura, S.; Katada, K.; Koshio, A.; Maruyama, T.; Kudo, K.; Inamori, Y. Treatment of domestic wastewater mixed with crushed garbage and garbage washing water by advanced gappei-shori johkaso. Water Sci. Technol. 1997, 36, 175–182. [Google Scholar] [CrossRef]
- Visvanathan, C.; Aim, R.B.; Parameshwaran, K. Membrane separation bioreactors for wastewater treatment. Crit. Rev. Environ. Sci. Technol. 2000, 30, 1–48. [Google Scholar] [CrossRef]
- Wang, Y.; Huang, X.; Yuan, Q. Nitrogen and carbon removals from food processing wastewater by an anoxic/aerobic membrane bioreactor. Proc. Biochem. 2005, 40, 1733–1739. [Google Scholar] [CrossRef]
- Boonnorat, J.; Boonapatcharoen, N.; Prachanurak, P.; Honda, R.; Phanwilai, S. Toxic compounds biodegradation and toxicity of high strength wastewater treated under elevated nitrogen concentration in the activated sludge and membrane bioreactor systems. Sci. Total Environ. 2017, 592, 252–261. [Google Scholar] [CrossRef] [PubMed]
- Chiemchaisri, C.; Yamamoto, K. Performance of membrane separation bioreactor at various temperatures for domestic wastewater treatment. J. Membr. Sci. 1994, 87, 119–129. [Google Scholar] [CrossRef]
- Di Bella, G.; Di Trapani, D.; Torregrossa, M.; Viviani, G. Performance of a MBR pilot plant treating high strength wastewater subject to salinity increase: Analysis of biomass activity and fouling behaviour. Bioresour. Technol. 2013, 147, 614–618. [Google Scholar] [CrossRef] [PubMed]
- Côté, P.; Buisson, H.; Pound, C.; Arakaki, G. Immersed membrane activated sludge for the reuse of municipal wastewater. Desalination 1997, 113, 189–196. [Google Scholar] [CrossRef]
- Mannina, G.; Cosenza, A.; Di Trapani, D.; Capodici, M.; Viviani, G. Membrane bioreactors for treatment of saline wastewater contaminated by hydrocarbons (diesel fuel): An experimental pilot plant case study. Chem. Eng. J. 2016, 291, 269–278. [Google Scholar] [CrossRef]
- Meng, F.; Shi, B.; Yang, F.; Zhang, H. Effect of hydraulic retention time on membrane fouling and biomass characteristics in submerged membrane bioreactors. Bioprocess Biosyst. Eng 2007, 30, 359–367. [Google Scholar] [CrossRef] [PubMed]
- Le-Clech, P.; Chen, V.; Fane, T.A. Fouling in membrane bioreactors used in wastewater treatment. J. Membr. Sci. 2006, 284, 17–53. [Google Scholar] [CrossRef]
- Jarusutthirak, C.; Amy, G. Role of soluble microbial products (SMP) in membrane fouling and flux decline. Environ. Sci. Technol. 2006, 40, 969–974. [Google Scholar] [CrossRef] [PubMed]
- Wang, Z.; Wu, Z.; Tang, S. Extracellular polymeric substances (EPS) properties and their effects on membrane fouling in a submerged membrane bioreactor. Water Res. 2009, 43, 2504–2512. [Google Scholar] [CrossRef] [PubMed]
- Pan, J.R.; Su, Y.; Huang, C. Characteristics of soluble microbial products in membrane bioreactor and its effect on membrane fouling. Desalination 2010, 250, 778–780. [Google Scholar] [CrossRef]
- Ng, H.Y.; Tan, T.W.; Ong, S.L. Membrane fouling of submerged membrane bioreactors: Impact of mean cell residence time and the contributing factors. Environ. Sci. Technol. 2006, 40, 2706–2713. [Google Scholar] [CrossRef] [PubMed]
- Remy, M.; Potier, V.; Temmink, H.; Rulkens, W. Why low powdered activated carbon addition reduces membrane fouling in MBRs. Water Res. 2010, 44, 861–867. [Google Scholar] [CrossRef] [PubMed]
- Eddy, M.; Burton, F.L.; Stensel, H.D.; Tchobanoglous, G. Wastewater Engineering: Treatment and Reuse; McGraw Hill: New York, NY, USA, 2003. [Google Scholar]
- Oh, S.H.; Park, I.W.; Bae, S.K. The effect of garbage disposer system on the influent loading rate of domestic waste water facilities in apartment. In Proceedings of the 15th Annual Conference of the Japan Society of Waste Management Experts, Takamatsu, Japan, 17–18 November 2004. [Google Scholar]
- Park, C.; Novak, J.T. Characterization of activated sludge exocellular polymers using several cation-associated extraction methods. Water Res. 2007, 41, 1679–1688. [Google Scholar] [CrossRef] [PubMed]
- Teague, P.; Wang, M.; Hyun, C.D.; Kim, Y.M.; Park, C. The effect of aeration basin reactor configuration on anaerobic digestion and sludge properties. Proc. Water Environ. Fed. 2011, 9, 6438–6454. [Google Scholar] [CrossRef]
- Kane, M.D.; Poulsen, L.K.; Stahl, D.A. Monitoring the enrichment and isolation of sulfate-reducing bacteria by using oligonucleotide hybridization probes designed from environmentally derived 16s rRNA sequences. Appl. Environ. Microbiol. 1993, 59, 682–686. [Google Scholar] [PubMed]
- Lin, C.; Stahl, D.A. Comparative analyses reveal a highly conserved endoglucanase in the cellulolytic genus Fibrobacter. J. Bacteriol. 1995, 177, 2543–2549. [Google Scholar] [CrossRef] [PubMed][Green Version]
- APHA. Standard Methods for The Examination of Water and Wastewater; American Public Health Association: Washington, DC, USA, 2005. [Google Scholar]
- Lowry, O.H.; Rosebrough, N.J.; Farr, A.L.; Randall, R.J. Protein measurement with the folin phenol reagent. J. Biol. Chem. 1951, 193, 265–275. [Google Scholar] [PubMed]
- Dubois, M. Colorimetric method for determination of sugars and related substances. Anal. Chem. 1956, 28, 350–356. [Google Scholar] [CrossRef]
- He, Y.; Xu, P.; Li, C.; Zhang, B. High-concentration food wastewater treatment by an anaerobic membrane bioreactor. Water Res. 2005, 39, 4110–4118. [Google Scholar] [CrossRef] [PubMed]
- Fuchs, W.; Binder, H.; Mavrias, G.; Braun, R. Anaerobic treatment of wastewater with high organic content using a stirred tank reactor coupled with a membrane filtration unit. Water Res. 2003, 37, 902–908. [Google Scholar] [CrossRef]
- Park, K.Y.; Lee, J.W.; Ahn, K.H.; Maeng, S.K.; Hwang, J.H.; Song, K.G. Ozone disintegration of excess biomass and application to nitrogen removal. Water Environ. Res. 2004, 76, 162–167. [Google Scholar] [CrossRef] [PubMed]
- Park, C.; Helm, R.F.; Novak, J.T. Investigating the fate of activated sludge extracellular proteins in sludge digestion using sodium dodecyl sulfate polyacrylamide gel electrophoresis. Water Environ. Res. 2008, 80, 2219–2227. [Google Scholar] [CrossRef]
- Bruce, E.R.; Perry, L.M. Environmental Biotechnology: Principles and Applications; McGraw Hill: New York, NY, USA, 2001. [Google Scholar]
- Choi, Y.Y.; Baek, S.R.; Kim, J.I.; Choi, J.W.; Hur, J.; Lee, T.U.; Park, C.J.; Lee, B.J. Characteristics and Biodegradability of Wastewater Organic Matter in Municipal Wastewater Treatment Plants Collecting Domestic Wastewater and Industrial Discharge. Water-Sui 2017, 9, 409. [Google Scholar] [CrossRef]
- Ren, X.; Shon, H.K.; Jang, N.; Lee, Y.G.; Bae, M.; Lee, J.; Cho, K.; Kim, I.S. Novel membrane bioreactor (MBR) coupled with a nonwoven fabric filter for household wastewater treatment. Water Res. 2010, 44, 751–760. [Google Scholar] [CrossRef] [PubMed]
- Yeom, I.T.; Nah, Y.M.; Ahn, K.H. Treatment of household wastewater using an intermittently aerated membrane bioreactor. Desalination 1999, 124, 193–203. [Google Scholar] [CrossRef]
- Di Bella, G.; Torregrossa, M.; Viviani, G. The role of EPS concentration in MBR foaming: Analysis of a submerged pilot plant. Bioresour. Technol. 2011, 102, 1628–1635. [Google Scholar] [CrossRef] [PubMed]
- Le Clech, P.; Jefferson, B.; Chang, I.S.; Judd, S.J. Critical flux determination by the flux-step method in a submerged membrane bioreactor. J Membr. Sci. 2003, 227, 81–93. [Google Scholar] [CrossRef]
- Lew, B.; Tarre, S.; Beliavski, M.; Dosoretz, C.; Green, M. Anaerobic membrane bioreactor (AnMBR) for domestic wastewater treatment. Desalination 2009, 243, 251–257. [Google Scholar] [CrossRef]
- Cho, J.; Song, K.G.; Ahn, K.H. The activated sludge and microbial substances influences on membrane fouling in submerged membrane bioreactor: Unstirred batch cell test. Desalination 2005, 183, 425–429. [Google Scholar] [CrossRef]
- Holler, S.; Trösch, W. Treatment of urban wastewater in a membrane bioreactor at high organic loading rates. J. Biotechnol. 2001, 92, 95–101. [Google Scholar] [CrossRef]
- Dvořák, L.; Gómez, M.; Dvořáková, M.; Růžičková, I.; Wanner, J. The impact of different operating conditions on membrane fouling and EPS production. Bioresour. Technol. 2011, 102, 6870–6875. [Google Scholar] [CrossRef] [PubMed]
- Jang, N.; Ren, X.; Choi, K.; Kim, I.S. Comparison of membrane biofouling in nitrification and denitrification for the membrane bioreactor (MBR). Water Sci. Technol. 2006, 53, 43–49. [Google Scholar] [CrossRef] [PubMed]
- Holakoo, L.; Nakhla, G.; Bassi, A.S.; Yanful, E.K. Long term performance of MBR for biological nitrogen removal from synthetic municipal wastewater. Chemosphere 2007, 66, 849–857. [Google Scholar] [CrossRef] [PubMed]
© 2017 by the authors. Licensee MDPI, Basel, Switzerland. This article is an open access article distributed under the terms and conditions of the Creative Commons Attribution (CC BY) license (http://creativecommons.org/licenses/by/4.0/).