2.1. Development of Evaluation Indicators
A systematic and reasonable evaluation index system is desired in the evaluation of a large number of remediation technologies. Thus, evaluation indicators need to be identified and screened out. The indicators should cover pollution types, and intensity, geological survey as well as social and economic research. Therefore, the establishment of evaluation index system should use a variety of indicator selection methods. Indicators are used to describe the advantages and disadvantages of the methods in terms of cost, efficiency, application range, and technical maturity [
19,
20,
21]. To carry out the selection of indicators and establish of index system, we must refer to certain principles [
22,
23,
24,
25,
26,
27,
28]. The general principles of establishing index system include: (a) the indicator system should be scientifically based on concept and calculation method of the theory of sustainable development; (b) any developed index systems should include not only the index of technical applicability, but also the indexes that reflect the management cost, technology maturity, and efficiencies; there must be indicators that can reflect the degree of mutual coordination between the above system indicators; (c) because of the difference between the natural environment and social economy, the selection of indicators should be consistent with the regional characteristics and local conditions of the study area; (d) terminology, concepts, and calculation methods should be made as standard as possible to achieve comparability with other regional indicators; and (e) a combination of qualitative and quantitative indicators. Quantitative indicators should be selected as far as possible. Important indicators that are difficult to quantify can be described qualitatively. (f) Simplicity, i.e., the availability of data and the feasibility of statistical computation, should be taken into account. The index system should be easy to be understood and should be convenient to use through the adoption of certain mathematical evaluation models.
Therefore, to establish a scientific, reasonable and systematic evaluation index system for groundwater remediation technologies, based on the basic concept of water resources security and theoretical analysis method combined with expert consultation and system analysis, we scientifically select indicators to reflect the safety of groundwater, and establish an evaluation index system. We have collected a wide range of research results in recent years on water pollution, oil pollution, groundwater treatment and oil pollution control at home and abroad. Through theoretical analysis, we select indicators that can represent the features of petroleum and the associated products. The initially established evaluation index system contains a wide range of indicators and the correlation degree of some indexes is relatively large. Therefore, we need to choose certain indicators from all. Expert consultation method is a commonly used index screening method that is conducted by means of a questionnaire. We used a 0–1 scale design questionnaire from the “Oil Polluted Groundwater Remediation Technologies Evaluation Index System”. In the questionnaire, . This means that j is more important than i, and the smaller aij is, the more important j is than i. We solicited the opinions of 18 domestic experts in the fields of water resources, water environment, ecological environment, oil pollution remediation, and other research areas and ensure that the indicators can fully reflect the views of the experts.
2.2. Uncertainties of Evaluation
Many uncertainties are associated with the evaluation process. For example, fuzzy judgments might be given for any criteria, which can be dealt with through the introduction of fuzzy sets theory. Normally, the first stage is fuzzy impact transformation, which includes two steps: (a) transformation of descriptive linguistic variables, which means transforming a descriptive language index into fuzzy sets; and (b) transforming the fuzzy sets into crisp values. The result of this stage is to generate a new index matrix that contains only numerical data. The second stage is to use the classical MCDA method to sort the various decision schemes. In the third stage, we use mean ranking and Borda ranking methods to integrate the results of MCDA methods to obtain a more accurate priority.
Chen proposed a numerical approximation system that can systematically convert linguistic variables into the corresponding fuzzy sets [
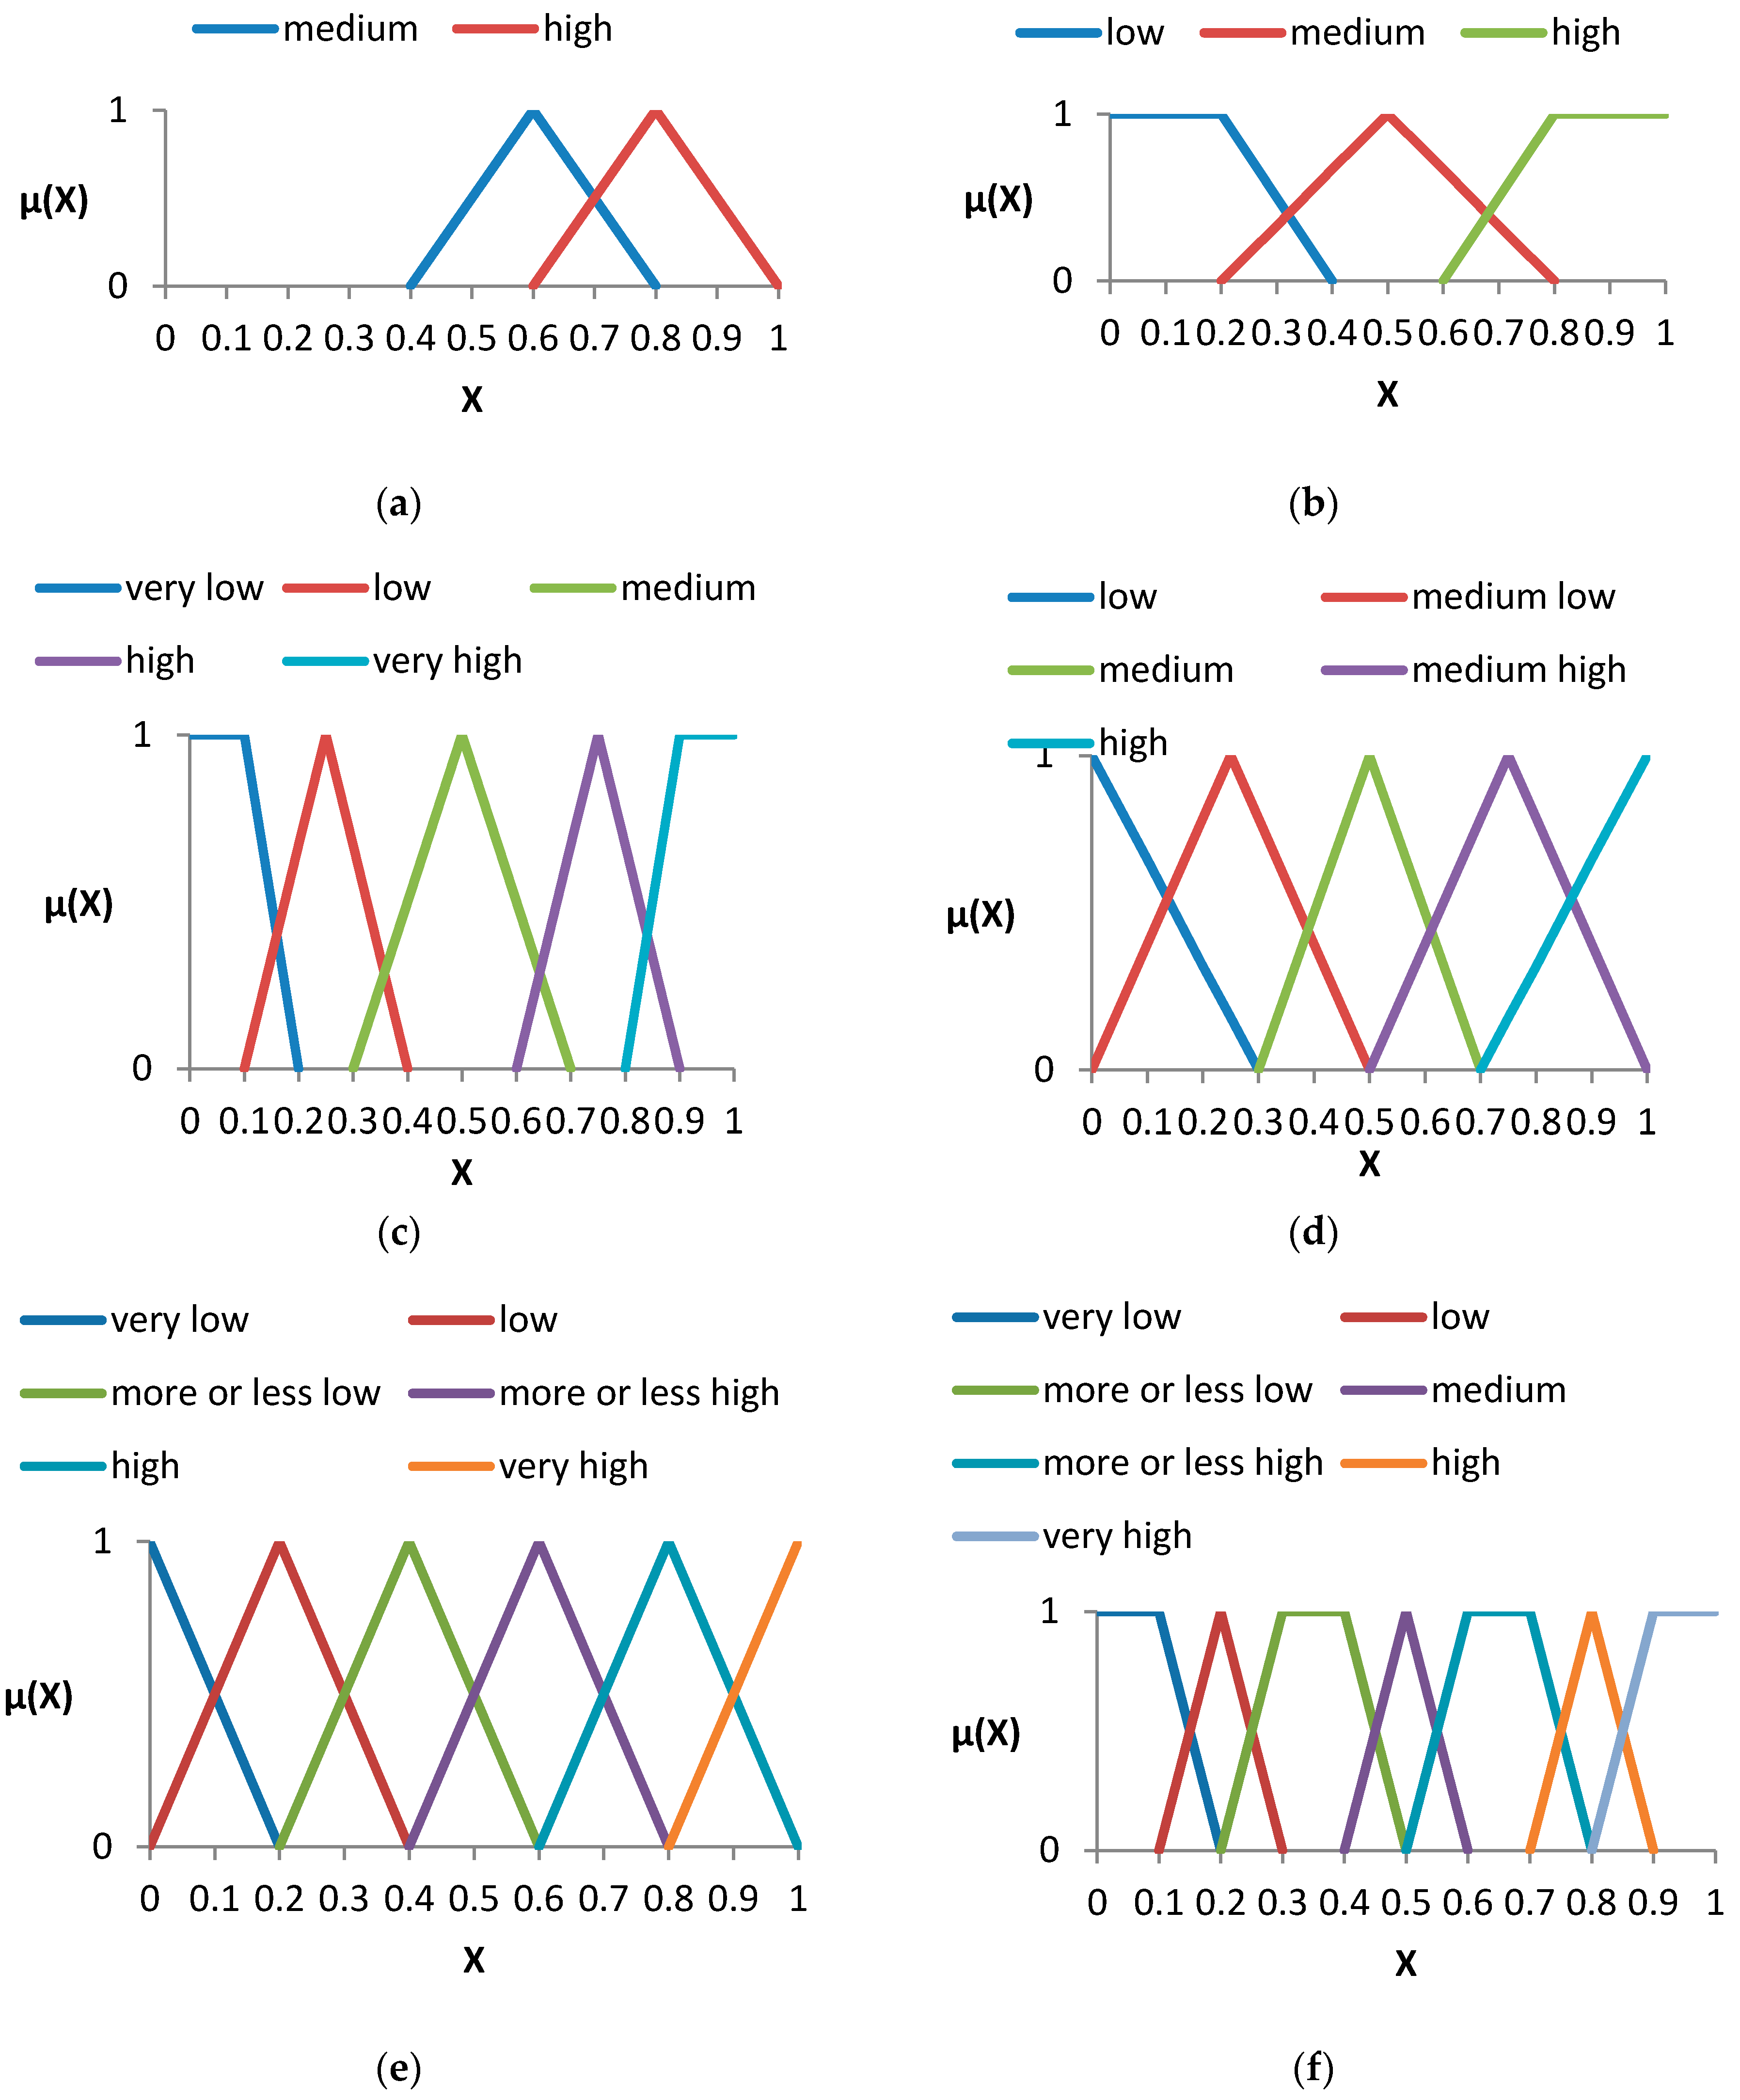
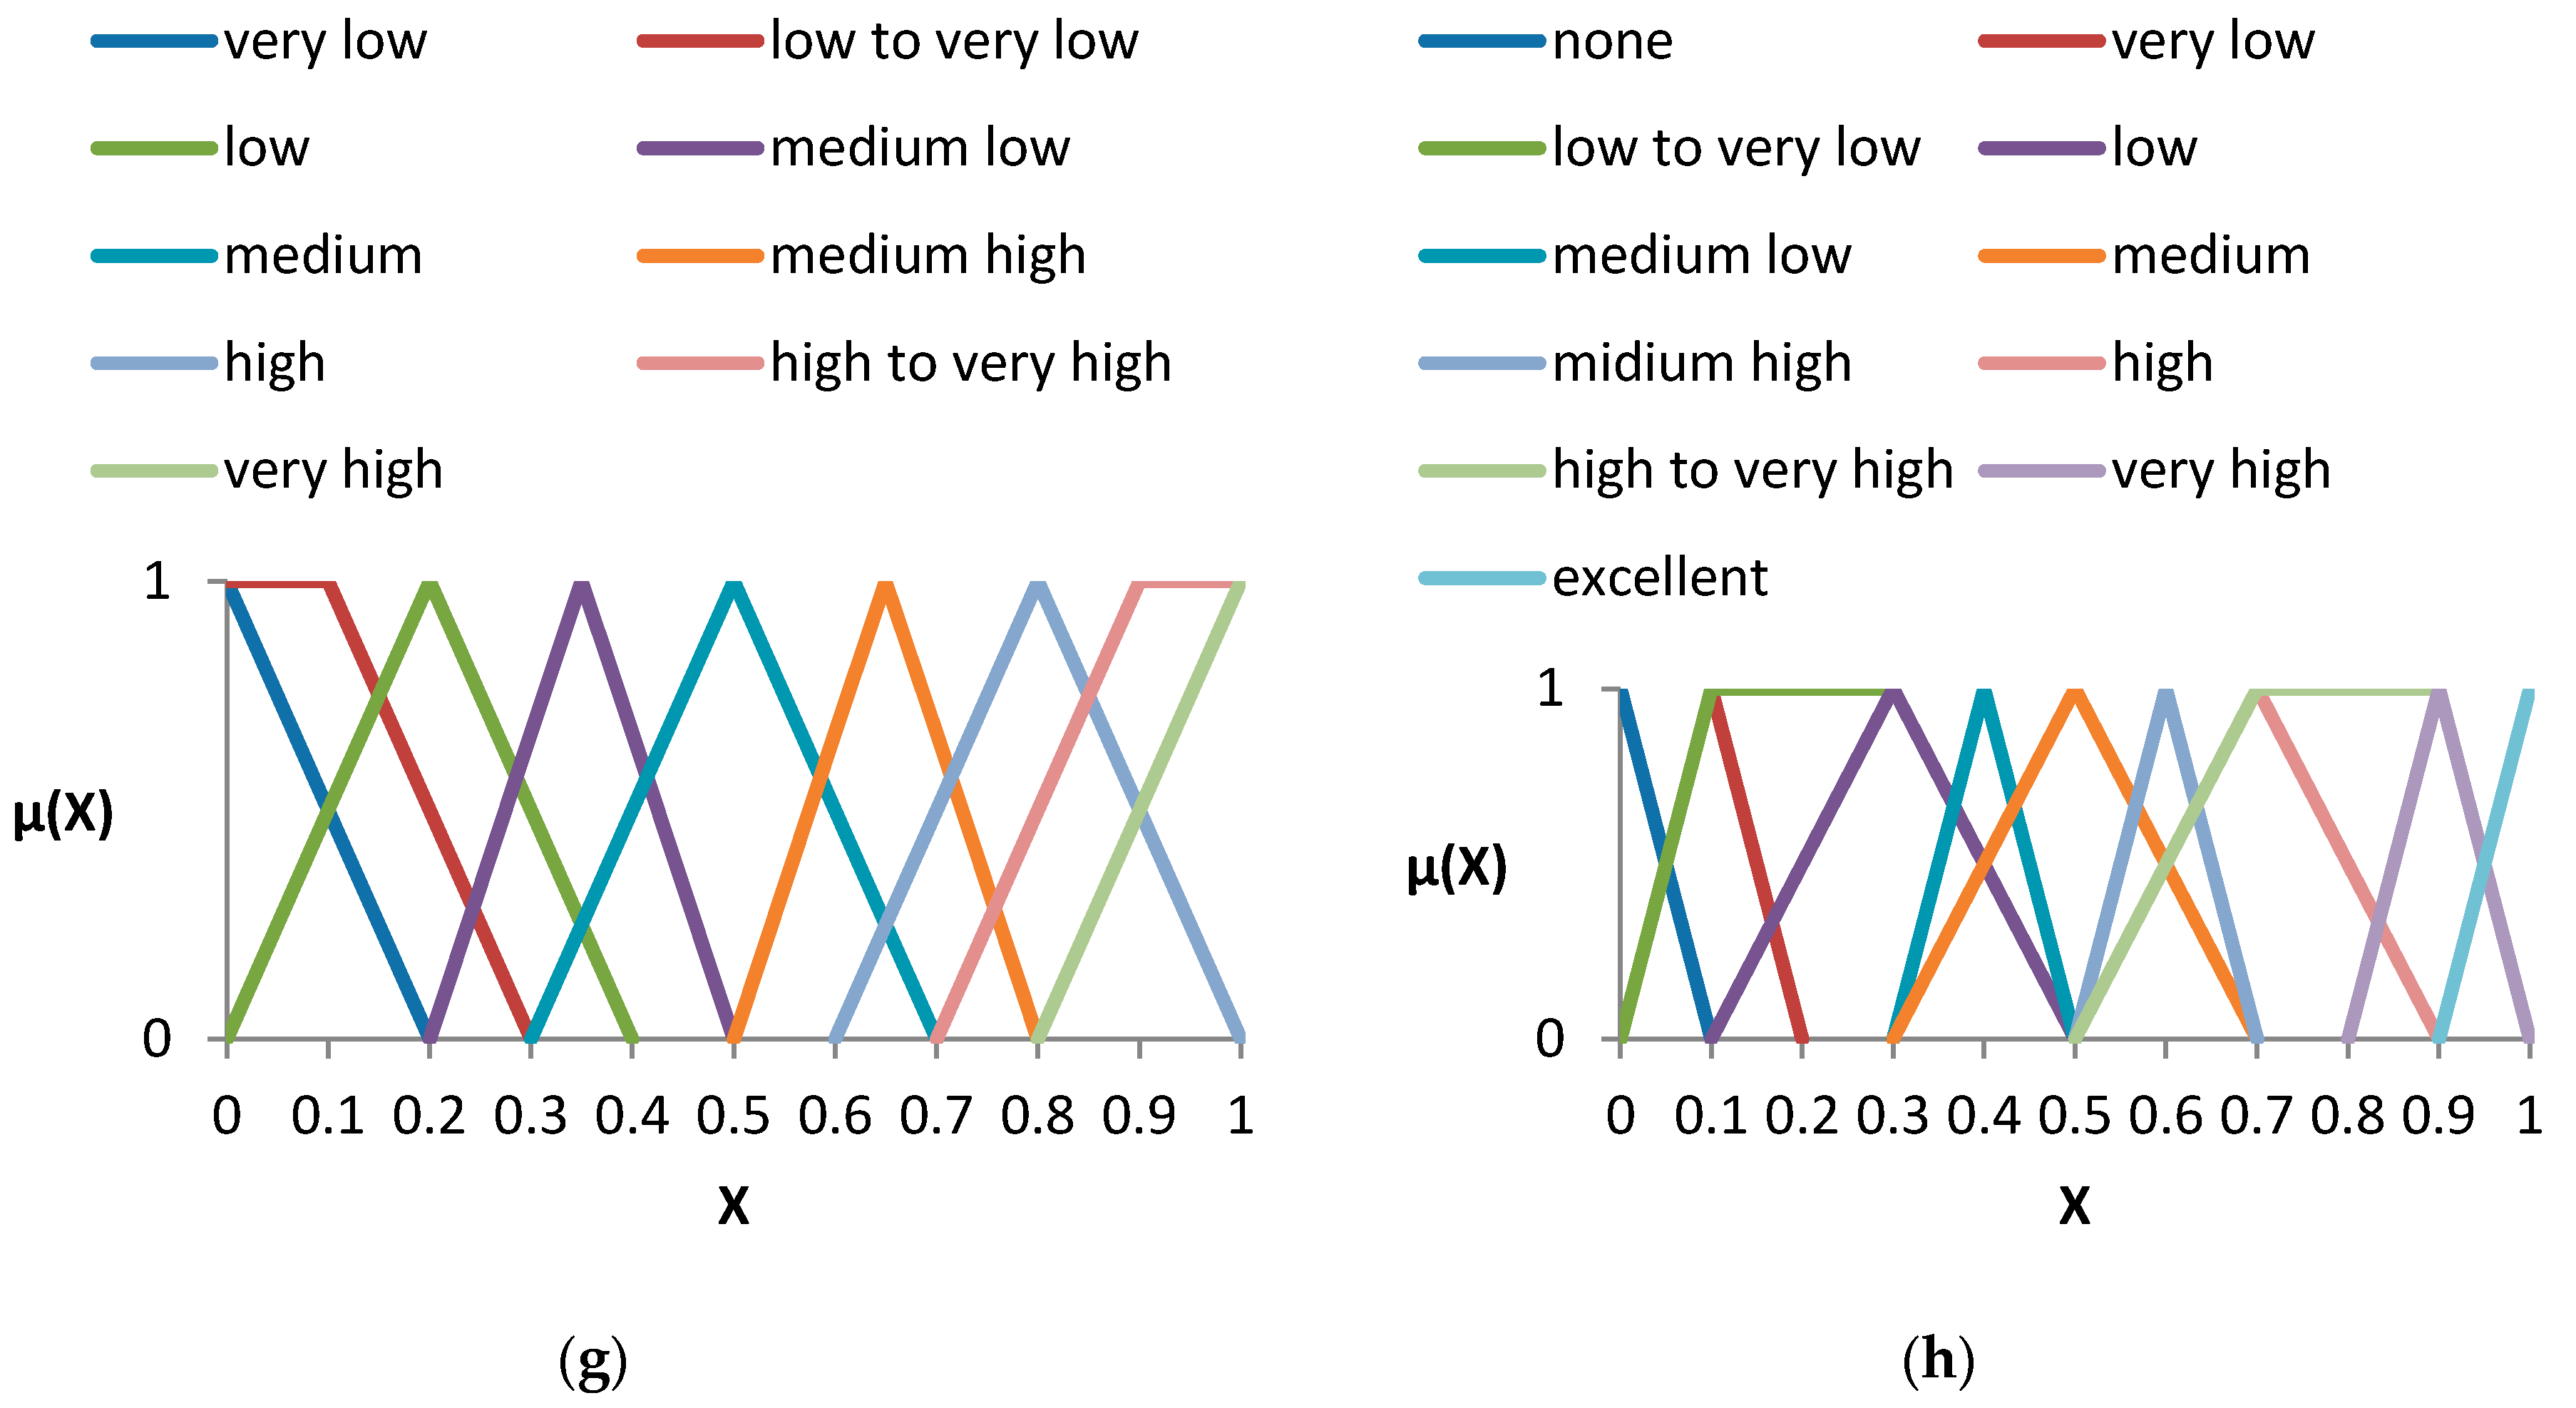
29]. According to Chen, this transformation required eight conversion scales, as shown in
Figure 1a–h. These conversion scales were presented in the synthesis and modification of Baas (1977), Bonissone (1982), Chen (1988), Efstathiou (1979, 1982), Kerre (1982) and Wenstop (1976) [
30,
31,
32,
33,
34,
35,
36] and applied widely by Wang (2016), Xue (2016), Mardani (2016), and Karsak (2015) [
37,
38,
39,
40]. In general, the scale given in the graph is sufficient to cover all the representations of each feature, “high” and “low”. When given a specific variable representation, one of them can be used to analyze. Even if the same variable is used as the “high”, the membership functions are not the same in the different graphs. Chen argued that this phenomenon was caused by the fact that the same linguistic variables were expressed differently in different situations [
29]. We used the membership function set to express the meaning of language data. For example, in
Figure 1a, the red peak indicates the membership degree of “high”; the farther away it is from 0.8, the less it belongs to “high”.
The second step in the transformation of fuzzy variables is to convert the fuzzy values into crisp values. A lot of scholars have made relevant research such as Hipel (1982) [
41] and Cheng (2000) [
42]. Generally speaking, this kind of conversion can be regarded as a method to calculate the fuzzy average value. The fuzzy mean value is not necessarily the highest degree of membership. A left–right scoring approach based on Jain (1977) [
43] and Chen (1985) [
44] was used. The score of fuzzy sets M can be obtained through the following steps. In order to get the score value, fuzzy sets need to be compared with the maximum fuzzy sets (fuzzy maximum) and the minimum fuzzy sets (fuzzy minimum). These two fuzzy sets can be defined as:
The score on the right is obtained by the intersection of fuzzy sets
M and fuzzy maximum. The right score can be obtained by the following equation:
Similarly,
M left score can be calculated by using the following formula:
The total score of
M can be calculated by left and right scores:
As shown in
Figure 2,
and
are the intersection points of the two diagonal with the membership function respectively, and the membership functions are as follows:
Then, using Equations (1)–(3), we can get the total score. They can be used instead of the original language to describe the data. As shown in
Table 1, 0.8846, 0.7000, 0.5000, 0.4333, and 0.1154 take the place of “high”, “medium high”, “medium”, “medium low”, and “low”.
2.3. Multi-Criteria Decision Analysis
Multi-criteria decision analysis (MCDA) is a batch of methods that can evaluate a series of alternatives on the basis of irrelevant and inconsistent rules to identify the desired decision alternatives. It has the characteristics of flexibility and clear judgment of the correlation between indicators. Over the past 20 years, MCDA methods have become a powerful tool for decision analysis, and developed rapidly in management, engineering, and other fields. More recently, MCDA has been applied to many research areas such as environmental resource management. Hipel (1982), for example, introduced a fuzzy MCDA model in a sludge management (SWM) problem [
41]. In order to broaden its scope of application, decision support systems (DSS) and MCDA methods were combined in the 1980s to form an integrated system, which has been applied in a variety of areas [
45]. In Finland, PROMETHEE were used as an assistant decision method to solve landfill site selection problems [
46]. Maniezzo (1998) applied it to the site selection of industrial waste management facilities in Italy [
47]. Haastrup (1998) developed a decision support system that combined optimization algorithms to solve facility location problems [
48]. Cheng (2000) established a DSS and applied it to support urban solid waste management problems [
49]. Normally, MCDA is a method for decision makers to evaluate the merits and demerits of several schemes containing many attributes. In this research, four MCDA methods are introduced. These four methods are selected because they can deal with the same type of data (the index value and the weight).
(1) Simple Weighted Addition Method (SWA)
Simple Weighted Addition Method is believed to be the simplest MCDA method. Because it is relatively easy for decision makers to understand, it is widely used in various fields. For each scheme, the utility value of the index is obtained by the product of the normalized index value and the weight of each index, and the sum of the scheme can be obtained:
In the formula, is the weight of the index I, is the index value after standardization. After calculating the Uj, the scheme with the maximum value is the most desirable scheme for the decision maker.
A basic assumption of the SWA method is that it is independent of the index. Therefore, the weight of the index will not be affected by the weight of other indexes. Simplicity is the biggest advantage of SWA, but its disadvantages are also obvious: there is usually contact or complementarity between indicators. The basic assumption is not easy to accept, while ignoring the relevance between the indexes may lead to incorrect results.
(2) Weighted Product Method (WP)
The weighted product method has been in use for a long time. The SWA method needs to first standardize indicators of data to remove the impact of the unit, but the WP method does not have to standardize the data. When the index value is multiplied, the index weight is the power of the index value, and the
Uj of each scheme is:
In the formula, is the weight of the index of number i. Forward index weights are positive in power. Backward index weights are negative in power. When adopting this method, the scheme with the maximum Uj is the most desirable for decision makers. Theoretically, due to the characteristic of the product, the value may be infinite. The purpose of WP is to screen out the scheme with the smallest Uj, and the difference between the largest and the second largest values is larger than that given by the SWA method. WP has reasonable logic and a simple calculation method, but it has not been widely used.
(3) Technique for Order Preference by Similarity to Ideal Solution (TOPSIS)
Technique for Order Preference by Similarity to Ideal Solution is proposed by Chen [
29]. This author proposes that a MCDA problem can be regarded as a collection system. The
m schemes with
n indicators that need to be evaluated are equivalent to
m points in the
n-dimensional space. Therefore, the most desirable program should meet the “shortest distance” to the best scheme and the “longest distance” to the worst scheme. Compared to the CGT, in which only the worst solution is considered, MCDA can give more comprehensive consideration of the data when solving the TOPSIS problem.
The specific process is as follows:
(a) The data need to be standardized; the dimensional effects need to be removed and thus it is more convenient to make the comparison among the indicators. According to the given weight, the index value matrix with weight needs to be calculated.
In the formula, is the weight of the index i.
(b) After
is calculated, the best scheme
and the worst scheme
is defined as follows:
where
I represents the number of positive indicators and
I’ represents the number of reverse indicators.
(c) Calculate the value of each scheme, that is, the relative closeness of the best scheme.
In the formula, is the distance between the number j scheme and the best scheme. is the distance between the number j scheme and the worst scheme. At the same time, .
Finally, we can sort all the schemes by the value of . The scheme that has the biggest is the most desirable. The advantages of this method are the same as for SWP. It is easy to understand, but in a situation, it cannot point to a clear decision. If an MCDA problem involves only two indicators, it can be considered as a geometric problem of a two-dimensional space; the optimal and the worst scheme are defined as and , assuming there are two schemes ( and ) and they have the same Uj. In this case, they are considered to be the same and there is no more desirable scheme. The decision makers can only select a scheme based on their own judgment.
(4) Cooperative Game Theory (CGT)
Cooperative game theory is similar to the WP method and can also be considered as a combination of WP and TOPSIS. It can also enlarge the distance among the schemes. So decision makers can choose the scheme with the longest distance to the worst scheme. The method is designed to help decision makers choose the scheme that has the maximum geometric distance to the worst case. To define the worst scheme, the decision maker first defines a minimal acceptable set of indicator values. However, not all of the indicators have a minimum acceptable level. For example, it is difficult to determine the minimum cost to a decision maker, and when the cost is an indicator that must be considered in the MCDA problem-solving process, the decision maker must give the minimum value. Therefore, in order to avoid this situation, we can select the minimum value of the index before calculating. When a set of decision schemes is given, the worst index set
is defined as:
Among them, x
ij is the value of the index
i;
is the minimum value (the worst level) of the index
i in all the schemes. Therefore, the
of each index can be calculated by the following formula [
49]:
in which
is the weight of each index. The most desirable scheme is the one with the maximum
. At the same time, each program can be sorted by
.
It is not uncommon to solve the MCDA problem by Cooperative Game Theory. Lau believes that CGT can produce scheme selection system with more security and less risk [
50]. In fact, the scheme sorting given by CGT is conservative for policy makers, and there are also some problems. Since any number multiplied by 0 equals 0, the CGT method will automatically exclude all programs that contain at least one minimum value (the worst level). They are not considered, even if the other indicators of these schemes are larger (better level).
(5) Integration of MCDA Approaches
To avoid the accidental nature of different methods, two integration methods, mean ranking and Borda Ranking, are used. The mean ranking method is one of the simplest methods. This method is based on the concept and theory of statistical computation. According to the ranking of technologies obtained by each MCDA method, we carry out mean ranking and get the final rank of each technology. Based on the voting theory, the Borda method is used to construct the N × N matrix by comparing every scheme to another. For each pair of schemes and , the number of votes is defined as the number of support. For example, the first two rows in the table can determine the number of and votes. According to and , is better than . However, according to and , is worse than . Thus, compared to , gets two votes by . Similarly, compared to , , also gets two votes by . So an N × N matrix X is established, and: , which means that gets more votes than ; , and vice versa.
As
Table 2 shows,
and
get the same number of votes. Thus,
and
both equal 0. The last column
indicates the degree to which
is better than other scheme, which is the sum of the same row. In this way, the scheme with the largest value of
is considered the best and most desirable scheme. For example, this sorting result is
, and the most desirable scheme is
.
Thus, an integrated approach is proposed based on the combination of the abovementioned indicator system, as well as uncertainty expression and MCDA methods. Also, in order to reflect the uncertainties associated with weights for the evaluation, a fuzzy analytical hierarchy process (FAHP) [
51] is used. Therefore, a fuzzy multi-criteria decision analysis (FMCDA) system is established.


