Article

Inexact Two-Stage Stochastic Programming for Water Resources Allocation under Considering Demand Uncertainties and Response—A Case Study of Tianjin, China

1
Research Base of Beijing Modern Manufacturing Development, College of Economics and Management, Beijing University of Technology, Beijing 100124, China
2
Polytech Nice Sophia, Ploytech Lab, University Nice Sophia Antipolis, 930 Route de Colles, 06903 Sophia Antipolis, France
3
Yingda Taihe Property Insurance Co., LTD., Beijing 100005, China
4
Environmental Systems Engineering Program, Faculty of Engineering, University of Regina, Regina, SK S4S 0A2, Canada
5
School of Energy and Environmental Engineering, University of Science & Technology, Beijing 100083, China
*
Author to whom correspondence should be addressed.
Water 2017, 9(6), 414; https://doi.org/10.3390/w9060414
Submission received: 25 April 2017 / Revised: 25 May 2017 / Accepted: 2 June 2017 / Published: 9 June 2017
(This article belongs to the Special Issue Modeling of Water Systems)

Abstract

:
In this paper, an inexact two-stage stochastic programming model was developed for supporting regional water resource allocation management under uncertainties. The proposed model is an integrated framework of interval parameter programming and two-stage stochastic programming, which can tackle uncertain parameters expressed as interval values with probability distribution information. The proposed model was successfully applied to a typical heavy industrial city suffering water shortage in the east of China, Tianjin. The uncertainties of future water demand were taken into account through generating a set of representative scenarios. The results indicated that different scenarios would affect the water distribution patterns, water shortages, total benefits and system cost. The results revealed that the transferred water from Luan River and Changjiang River would still be the main water resource for each water user. Besides, nearly all water demand in planning horizon would be guaranteed through the reasonable dispatch except under high demand level scenario, in which a small proportion of water requirement in agricultural, municipal and environmental sectors would not be satisfied. The developed method could be used by environmental managers to identify the optimal water supply plan from multiple sources to different end-user sectors under system uncertainties.

1. Introduction

Water is a scare and essential resource for the human survival, the social pillar of sustainable development and economic growth. Water resource shortage is more likely to occur in countries or areas with population explosion and high density, such as in India, China, Mexico, and Africa [1]. Water scarcity has become the bottleneck of sustainable development in these water-stressed areas. Therefore efficient water resource allocation is important to guarantee the water use security, reduce the waste, and improve the social benefits. However, due to the variations in natural water resource availability, the complex interconnected processes (e.g., water transmission, distribution, and recycle), the unpredictable market environment and technology development, and fluctuations in demand, water allocation management is extremely complicated in practice. The above complexities bring great challenges for water managers in decision making. Therefore, suitable and effective optimization tools are desired to help decision makers to identify the optimal water allocation strategies in such complex conditions [2].
During the past decades, various dedicated mathematical programming models with single objective or multiple objectives have been developed for the water resource allocation and management [3,4,5,6]. With the consideration of the complicated uncertainties in water systems, a large number of inexact optimization methods have been developed for dealing with water resource allocation and management problems. Stochastic programming, fuzzy programming, and interval parameter programming are the popular approaches for tackling uncertainties in the different forms [7,8,9,10]. Stochastic programming is a well-known approach to deal with decision problems under random uncertainties with probability distribution information [11]. In the stochastic programming models, the objective function is expected to perform well on average, and uncertainties are presented through a scenario tree. Among stochastic programming models, the two-stage stochastic programming (TSP) model has been widely applied in water resource allocation due to its unique advantages [12,13]. In TSP model, an initial decision is first made before unknown events are realized, and then, in the second-stage, the extra adjustment decision can be made to take corrective measures when the uncertainties occur. The second stage decision could minimize the penalty due to any infeasibility caused by the unpredictable events [14].
Although TSP can effectively tackle uncertainties with accurate probability distribution information, it may fail to deal with uncertainties in other forms, especially when there is no sufficient historical data to generate probability distributions in practice. In contrast, since the uncertain parameters in the objective function and constraints of interval parameter programming can be expressed as interval values with lower and upper bounds, it is an appropriate alternative tool to tackle uncertainties with less uncertain information and computational efforts. By integrating interval parameter programming, the inexact two-stage stochastic programing (ITSP) approach was initially proposed by Huang and Loucks [15] to deal with uncertain information expressed as interval values as well as random variables. Under the framework of ITSP method, various advanced models have been proposed and applied in water resources management. For example, Niu et al. [16] developed an interactive two-stage fuzzy stochastic programming approach for supporting crop planning and water resource allocation, where the relative uncertainties are expressed as probability distributions and fuzzy-boundary intervals. Li et al. [17] presented an interval-fuzzy two-stage stochastic quadratic programming model to determine the optimal plan for irrigation water allocation with the aim of maximum benefits. Xin et al. [18] proposed a factorial two-stage irrigation system optimization model for supporting agricultural irrigation water resource management under dual uncertainties. By integrating ITSP with credibility constrained programming, Wang et al. [19] developed a hybrid optimization model for the water resources allocation in Dalian, China within a multi-year context.
Therefore, the purpose of the present study is to develop an inexact two-stage stochastic programming model for supporting water resources allocation under uncertainties. The proposed approach is applied to identify the optimal water resource allocation and management in a coastal city that faces serious water shortage problem, i.e., Tianjin, China. The main contribution of this study can be summarized as: (1) an inexact two-stage stochastic programming model for supporting the mid-long term regional water resources allocation and management under the multiple uncertainties; (2) the demand uncertainties in different scenarios and demand response are taken into account; and (3) both conventional water resource (i.e., surface water, underground water, and transferred water) and unconventional water resource (i.e., recycled waste water, and desalinated seawater) are considered to make the model closer to the reality in a water-stressed coastal city in China.

2. Methodology

A general TSP model with maximum objective function value can be formulated as follows (Model 1) [14]:
M a x   C T X E [ Q ( X , ω ) | ω Ω ]
subject to
x X
With   Q ( X , ω ) = min   f ( x ) T y
and
D ( ω ) y h ( ω ) + T ( ω ) x
y Y
where C R n 1 are the coefficients of the objective function, X R n 1 are the decision variables, Y R n 2 are the decision variables at the second stage, E ( ) represents the expected value, and ω is the discrete random variable with probability P h ( h = 1, 2, …, v and P h = 1 ).
Model 1 can be equivalently transformed as a linear programming model [20]. It can effectively deal with uncertainties on the right-hand side presented as probability distributions when coefficients on the left-hand side and in the objective function are deterministic. However, in practice, it is difficult to obtain accurate probability distribution functions of uncertainties. Hence, interval parameter programming in which uncertainties can be expressed by interval parameter with lower and upper bounds is more suitable to deal with uncertain programming with less historical statistical information. According to Huang and Loucks [15], Model 1 can be transformed into the following interval two-stage stochastic programming (ITSP) model, which is identified as Model 2:
M a x   f ± = C T 1 ± X ± h = 1 v p h D T 2 ± Y ±
subject to
A r ± X ± B r ± , r = 1 , 2 , ... , m 1
A t ± X ± + A t ± Y ± ω h ± , t = 1 , 2 , ... , m 2 ; h = 1 , 2 , ... , v
x j ± 0 , x j ± X ± , j = 1 , 2 , ... , n 1
y j h ± 0 , y j h ± Y ± , j = 1 , 2 , ... , n 2 ; h = 1 , 2 , ... , v
where superscript ± represents the lower and upper bounds of interval parameter; C T 1 ± and D T 2 ± are the coefficients of X ± and Y ± in the objective function, respectively; A r ± and A t ± are the coefficients of X ± in constraints r and h, respectively; A t ± denotes the coefficients of Y ± in constraint h; and ω h ± represent the random variables associated with probability p h . Huang et al. [21] proposed an interactive algorithm to solve the ITSP models, by transforming Model 2 into two deterministic submodels corresponding to the lower and upper bounds of desired objective function, f + and f . For the optimization model with the aim of maximizing the objective function value, the upper bound objective function f + is desired first, and obtains the optimal solution x j o p t + (j = 1, 2, …, k1), x j o p t (j = k1 + 1, k1 + 2, …, n1), y j h o p t (j = 1, 2, …, k2, and h = 1, 2, …, v), and y j h o p t + (j = k2 + 1, k2 + 2,…, n2, and h = 1, 2, …, v). Based on these, the optimal solutions of f can be obtained as, x j o p t (j = 1, 2, …, k1), x j o p t + (j = k1 + 1, k1 + 2, …, n1), y j h o p t + (j = 1, 2, …, k2, and h = 1, 2, …, v), and y j h o p t (j = k2 + 1, k2 + 2, …, n2, and h = 1, 2, …, v). Therefore, the optimal solutions for Model 2 can be obtained as [ f o p t , f o p t + ], [ x j o p t , x j o p t + ] and [ y j h o p t , y j h o p t + ]. For more details, refer to [22,23].

3. Case Study

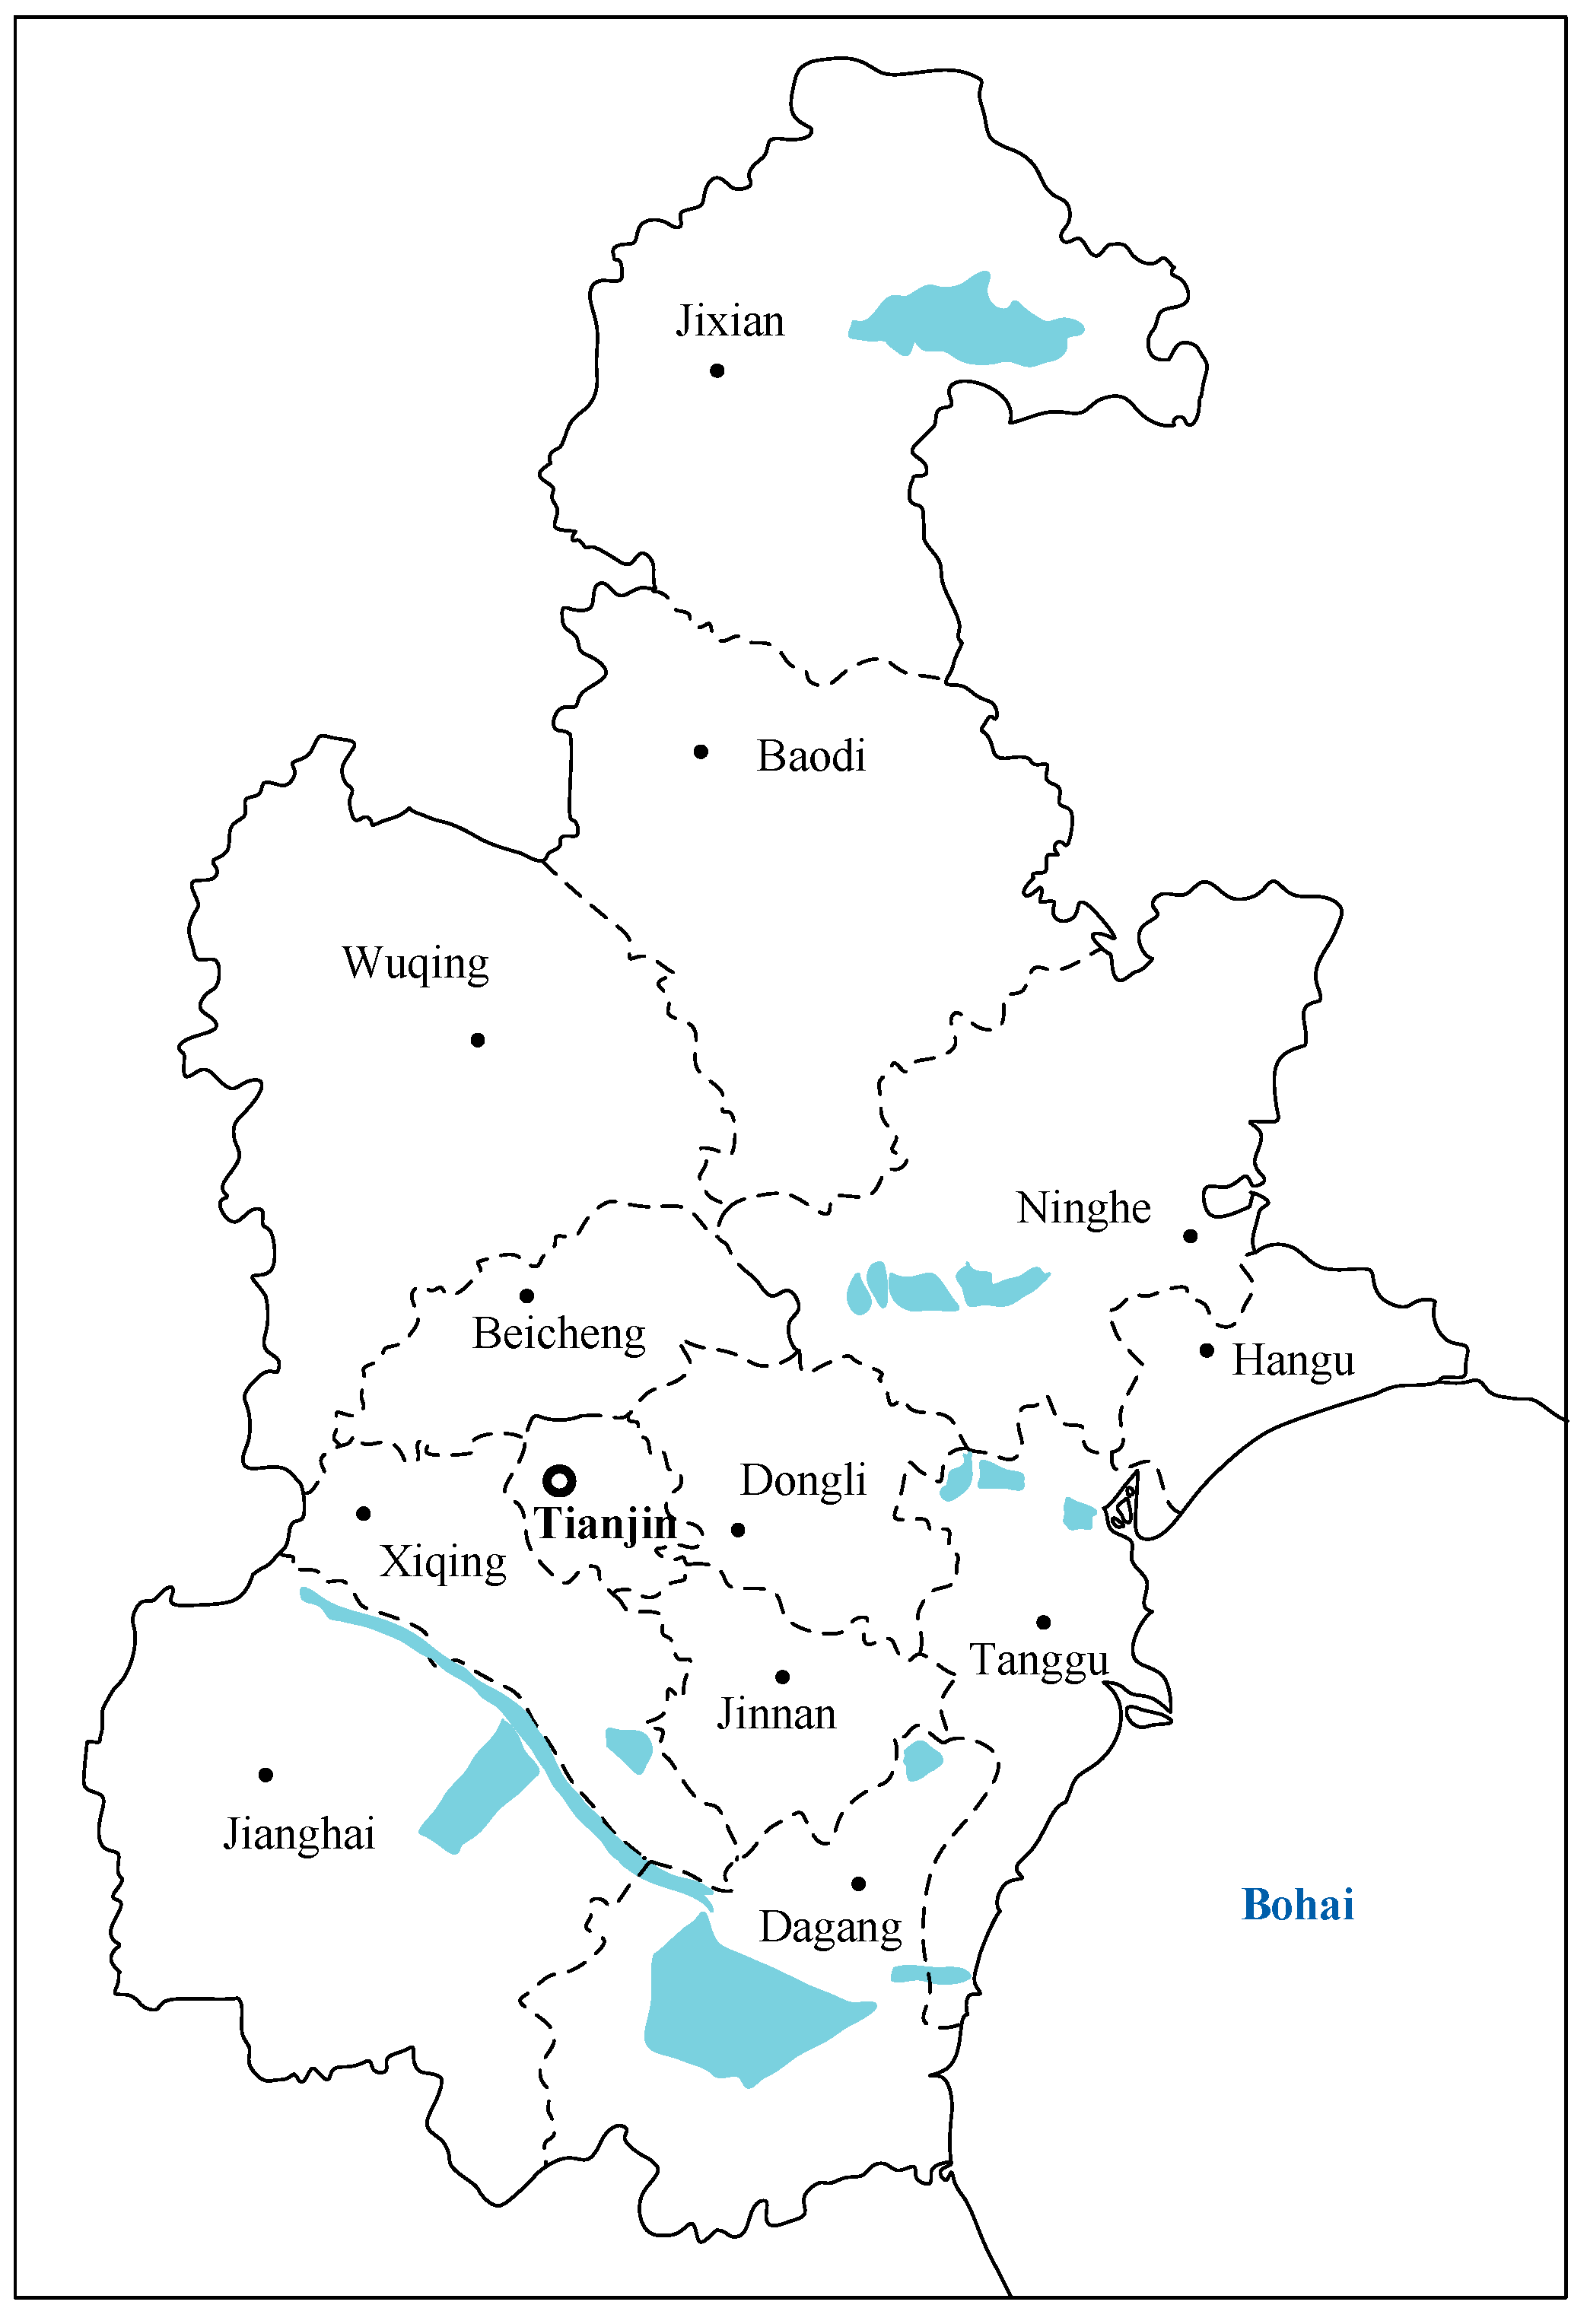
3.1. Overview of Water Supply and Demand in Tianjin

Tianjin (38°34′–40°15′ N, 116°43′–118°04′ E) is located in the northeast of China, the west of Bohai Sea (Figure 1). Tianjin covers 11,916.85 km2, where 6982.29 km2 is for agricultural production. In 2015, it had a population of 15.47 million and GDP of RMB 1.65 × 10³ billion [24]. The total water consumption was 2.68 billion m3, including agricultural sector water consumption 1.23 billion m3, industrial sector water consumption 0.53 billion m3, municipal sector water consumption 0.51 billion m3, and environmental and ecological sector consumption 0.40 billion m3. The comprehensive water use per capita was about 173 m3, and the water consumption per million industrial added value was 765 m3 [25].
Tianjin is associated with a typical temperate monsoon climate. The volume of rainfall is quite unevenly distributed, occurring mainly in summer from July to August, with an average precipitation of 536.2 mm. The available surface and underground water resources are 0.87 and 0.49 billion m3, respectively. There are three large-scale and eleven medium-scale reservoirs with the total capacity of 1.19 billion m3. In general, Tianjin has an extreme lack of water resources. The available water sources are complex, consisting of local surface water, underground water, transferred water from Luan River and Changjiang River, reused water, and desalinated seawater. Water supply heavily reliant on transferred water. In 2015, the transferred water from Luan River and Changjiang River totaled 0.66 and 0.38 billion m3, respectively, accounting for 39% of total water supply. Although the transferred water alleviates the serious water shortage situation, it also increases the supply cost greatly. Reused water and desalinated seawater are the main unconventional water resources as supplement to meet the increasing water consumption. By the end of 2015, there were 69 sewage treatment plants with total scale of 3.0 million m3/day and wastewater reuse rate of 30%. Due to the high cost of seawater desalination, there are only three desalination plants with total scale of 0.31 million m3/day. In 2015, the reused water and the desalinated seawater were 0.25 and 0.04 billion m3, respectively [25]. The serious water shortage has severely restricted the sustainable development of Tianjin. The optimal water resource allocation is necessary to coordinate the conflicts among different end-users (e.g., agricultural sector, industrial sector, municipal sector, and environmental and ecological sector) within limited water supply.
However, during the mid-long term of water resource allocation planning, random events are inevitable, such as changes in the availability of local water resources and transferred water, the price of transferred water, the working days, efficiency and operation cost of sewage treatment plants and desalination plants, which would make the water allocation management much more complicated. According to the historical statistic, the maximum and minimum levels and even probability distribution information can be obtained to reflect the randomness of uncertain parameters. Hence, the interval two-stage stochastic programming approach is desired to address the complex water resource allocation problem under uncertainty. It could provide the optimal water dispatch with high benefit and low risk violation.

3.2. Model Formulation

In this study, the planning horizon covers 10 years with five years per period, i.e., 2016–2020 and 2021–2025. During the 13th five-year planning horizon, Tianjin will upgrade its industrial structure to become the national advanced manufacturing and development base, the international shipping core area in north China, and the finance innovation demonstration area. Tianjin’s GDP will grow at an average annual rate of 8.5%, and the added value of service industry will account for more than 55% of the total GDP by 2020. Limited by water resource, the size of population will be controlled strictly. By the end of 2020, the total number of permanent resident population will be limited to 18 million, and the total annul water consumption amount will be limited within 3.8 × 10⁶ m3 [26]. According to the future economic and social development of Tianjin, and considering uncertain events, the forecasted water demand for each end-user is uncertain with three possible scenarios, i.e., low, medium and high, with the corresponding probability of 0.25, 0.6 and 0.15, respectively (shown in Table 1).
Besides, other uncertain economic and technical parameters during the planning horizon, including the variability of available water sources, operation efficiency and cost of sewage treatment and seawater desalinization, social benefit of water consumption in different sectors, and cost of water supply, are also considered and expressed as interval value by estimating their maximum and minimum values. Table 2 presents the net benefit and penalty for different sectors from various water resources, which refer to the study of Xie et al. [27]. The main objective is to maximize the total benefit, which is calculated as water utilization benefit minus the cost of water supply, sewage treatment, and penalty for shortage.
An inexact two-stage stochastic programming model for water resource allocation is formulated as follows:
M a x   f ± = f 1 ± f 2 ± f 3 ± f 4 ±
(1) Water utilization benefits
f 1 ± = t = 1 2 j = 1 5 s = 1 3 p s N B j t ± Q j s t ±
where t is the planning horizon, t = 1, 2 for the period of 2015–2020 and 2021–2025. p s represents the scenario probability, s = 1 for low, s = 2 for medium, and s = 3 for high. N B j t ± denotes the water utilization benefit for sector j (million RMB/106 m3), where j = 1,2,3,4 for agricultural, industry, municipal, and environmental and ecological sectors, respectively. Q j s t ± is the water consumed by sector j at period t under scenario s (106 m3).
(2) Water supply cost
f 2 ± = t = 1 2 i = 1 4 j = 1 5 C W S i t ± W j i t + t = 1 2 i = 1 4 j = 1 5 s = 1 3 p s E C W S i t ± E W j i s t ±
where subscript i denotes the water supply sources, 1 for surface water, 2 for underground water, 3 for transferred water, 4 for sea water desalination, and 5 for reused water. C W S i t ± and E C W S j i t ± represent the regular and extra water supply cost from source i, respectively (million RMB/106 m3). W j i t is the predesigned supply amount from source i to sector j; and E W j i s t ± is the extra supply from source i to sector j under scenario s (106 m3).
(3) Sewage treatment cost
f 3 ± = t = 1 2 j = 1 5 s = 1 3 p s γ j t ± η j t ± C W T j t ± Q j s t ±
where γ j t ± denotes the discharge of wastewater per unit water consumption for sector j during period t; η j t ± represents the sewage treatment rate of emission from sector j during period t; and C W T j t ± is the sewage treatment cost (million RMB/106 m3).
(4) Water shortage penalty
f 4 ± = t = 1 T j = 1 5 s = 1 3 p s C P j t ± ( D j s t ± Q j s t ± )
where C P j t ± denotes the penalty cost for water shortage; D j s t ± is the water demand for sector j during period t under scenario s.
Constraints:
(1) Constraint for maximum available public and transferred water resource
j = 1 5 W j i t ± + E W j i s t ± A W i t ± , i { 1 , 2 , 3 } , s , t
where A W i t ± is the maximum available water resources (106 m3).
(2) Constraint for seawater desalinization
j = 1 5 W j i t ± + E W j i s t ± A S H t ± × μ t ± × D C t ± , i = 4 , s , t
where D C t ± represents the capacity of sea water desalinization (106 m3/day); μ t ± represents the production efficiency; and A S H t ± is the average working days (days/year).
(3) Constraints for water recycling
W j i t ± + E W j i s t ± = 0 , i = 5 j = 1 , s , t
j = 3 5 W j i t + E W j i s t ± j = 3 5 α j t ± γ j t ± η j t ± Q j s t ± , i = 5 , s , t
j = 1 5 W j i t + E W j i s t ± j = 1 5 α j t ± γ j t ± η j t ± Q j s t ± , i = 5 , s , t
where α j t ± represents the recycling ratio from sector j during period t. Equation (18) indicates the reused water cannot be used in agricultural sector; Equation (19) guarantees municipal and environmental sectors only utilize the reused water from their emission; and Equation (20) means that industrial sector can use the reused water from any sectors.
(4) Water supply and demand balance
i = 1 5 ( W j i t + E W j i s t ± ) ( 1 β j i t ± ) = Q j s t ± , t , j , s
D j s t ± Q j s t ± e j t ± D j s t ± , t , s , j
where β j i t ± represents the transmission loss from source i to end-user j during period t; e j t ± is the maximum tolerance of water shortage for end-user j.
(5) Others
0 E W j i s t ± W j i t , i , j , t , s

4. Results Analysis and Discussion

Table 3 presents the optimal predesigned water resource allocation for the different sectors during the planning horizon, which provides water managers the optimal strategy with the consideration of minimum uncertain risk in future. The agricultural sector consumes large quantities of water, which would be mainly supplied by surface water, underground water, and the reused water. The water supply for industrial sector would be from underground water and the reused water. During Period 1, when the forecasted local water resource is low, the desalinated seawater would also be seen as an additional source of water for industrial sector. The optimal predesigned water allocation for municipal sector would be mainly from the transferred water, and supplemented by the other sources. The optimal predesigned water allocation for environmental and ecological sector would also be mainly from transferred water and reused water. In general, the optimal predesigned water allocation for different sectors during Period 2 would be higher than that in Period 1, since water consumption would increase with the social and economic development in future.
Figure 2 and Figure 3 illustrate the optimal allocation of local surface water and underground water under different scenarios during the planning horizon, respectively. The supply of surface water and underground water would mainly be limited by local natural resource conditions. Most of the supply would be allocated to agricultural sector, and the rest to municipal sector. The future demand scenario would also impact on the water allocation. With the agricultural sector’s water demand increasing, the provision from surface water would decrease, while that from underground water would increase. For example, during Period 1, under low, medium and high demand level, the water flow from surface water to agricultural sector would be [3.80, 4.10] × 109 m3, 3.80 × 10⁹ m3 and 2.80 × 10⁹ m3; and the water flow from underground water to agricultural sector would be 1.50 × 10⁹ m3, [1.71, 1.72] × 109 m3, and [1.71, 2.03] × 109 m3, respectively. In addition, with the municipal sector’s demand increasing, the water flow from both surface water and underground water resources would increase accordingly. For example, during Period 2, under low, medium and high demand level, the water flow from surface water to agricultural sector would be 410 × 106 m3, [410, 470] × 106 m3, and [410, 470] × 106 m3; and the water flow from underground water to agricultural sector would be 485 × 106 m3, [485, 639] × 106 m3, and [718, 969] × 106 m3, respectively.
Table 4 presents the optimal water allocation from transferred water, desalinated seawater and reused water under different scenarios during planning horizon. The transferred water would still be the main source of water supply in Tianjin during the planning horizon, especially for industrial, environmental, and ecological sectors. For example, during Period 1, under medium demand level, the water flow from transferred water to industrial, environmental and ecological, municipal, and agricultural sectors would be 1980 × 106 m3, 1589 × 106 m3, [837, 885] × 106 m3, and [595, 680] × 106 m3, respectively. In addition, with the demand level increasing, the water flow from transferred water to its main user sectors, i.e., industrial, environmental and ecological sectors, would increase accordingly; on the contrary, its water flow to the other two sectors, i.e. municipal and agricultural sectors, would decrease. For example, during Period 1, under low, medium, and high demand scenarios, the water flow from transferred water to industrial sector would be 1980 × 106 m3, 1980 × 106 m3, and [1980, 2088] × 106 m3, while that to municipal sector would be [837, 1047] × 106 m3, [837, 885] × 106 m3, and [837, 840] × 106 m3, respectively.
Due to the optimistic prediction on the natural resource condition, the desalinated seawater would still play a negligible role in the near future. During Period 1, the desalinated seawater would only supply for industrial and municipal sectors; during Period 2, it would only supply for municipal and environmental sectors. The water supply from reused water would affected by discharge amount, sewage treatment rate, and recycling ratio. The reused water would be used by all end-users except agricultural sector. With water demand increasing, the water flow from reused water to industrial, environmental and ecological sectors would increase accordingly, while that to municipal sector would decrease. For example, during Period 1, under low, medium, and high demand level, the water flow from reused water to industrial sector would be [350, 486] × 106 m3, [452, 593] × 106 m3, and [537, 700] × 106 m3; and that to municipal sector would be [610, 700] × 106 m3, [414, 700] × 106 m3, and [350, 740] × 106 m3, respectively.
Table 5 shows the unsatisfied water demand and the corresponding penalty cost. Although most of the water demand could be satisfied under uncertainties, water shortage is possible for some end-users under the high demand level scenario. Due to the high net benefit and expensive penalty cost of industrial sector, there would be no shortage in industrial sector. For example, the unsatisfied water demand in agricultural, municipal, and environmental and ecological sectors would be [0, 204.73] × 106 m3, [59, 109.18] × 106 m3, and [0, 165.14] × 106 m3, and the relative penalty cost would be RMB [0, 6654] × 106, RMB [326, 546] × 106 and RMB [0, 3385] × 106, respectively. Besides, due to the optimistic water supply prediction in future, the unsatisfied water demand during Period 2 would be much less than that in Period 1. During Period 2, only environmental and ecological sector would face [0, 37] × 106 m3 water shortage when demand level is high, and the corresponding penalty cost would be RMB [0, 951] × 106.
Figure 4 illustrates the total benefit and total cost under different scenarios during the planning periods. With the water demand increasing, both total benefit and cost would increase accordingly. The total benefit and cost in Period 2 would be much higher than that in Period 1. For example, under medium demand level scenario, during Period 1, the total benefit and cost would be RMB [714, 770] × 106 and RMB [73.80, 82.65] × 106; during Period 2, it would be RMB [824, 882] × 106 and RMB [76.41, 87.51] × 106, respectively. Besides, during the same period, under higher demand scenario, the total benefit and cost would also increase. For example, during Period 1, under low, medium, and high water demand levels, the total benefit would be RMB [685, 739] × 106, RMB [714, 770] × 106, and RMB [758, 826] × 106. Similarly, the total cost would be RMB [68.40, 77.76] × 106, RMB [73.80, 82.65] × 106, and RMB [88.76, 90.75] × 106, respectively.
Figure 5 illustrates the pollutant treatment cost for different sectors under various demand levels in the planning periods. The pollutant treatment cost would be affected by the pollutant treatment amount and price in the future. Since the water utilization in agricultural sector would not be recycled, no pollutant treatment cost in agricultural sector would occur. Due to the high pollutant treatment price for industrial sector, the total pollutant treatment cost in industrial sector would be much higher, followed by municipal, and environmental and ecological sectors. For example, during Period 1, under medium demand level, the pollutant treatment cost for industrial, municipal, and environmental and ecological sectors would be RMB [7.25, 1024] × 109, RMB [1.32, 1.56] × 109, and RMB [0.70, 0.74] × 109, respectively. During the same planning period, under higher demand level, the pollutant treatment cost would be greater. For example, during Period 1, under low, medium, and high demand level, the pollutant treatment cost would be RMB [1.27, 1.47] × 109, RMB [1.35, 1.56] × 109, and RMB [1.40, 1.65] × 109. However, with relevant technology development in the future, the pollutant treatment price would expected to be lower, which would reduce the total pollutant treatment cost in some degree.

5. Conclusions

In this paper, an inexact two-stage stochastic programming model was developed for mid-long term regional water resource allocation management. The proposed method is developed as an integrated framework based on interval parameter programming and two-stage stochastic programming, which can handle uncertain parameters as interval values with probability distributions. It can effectively coordinate the conflicts between maximum benefits and the violation penalty under uncertainties, especially the consideration of unconventional water resources and demand response of end-users to make the model more practical for addressing the water allocation problem in water-stressed areas. The proposed model was successfully applied to the regional water resource allocation in Tianjin, China, from 2016 to 2025. By solving the optimization model, the optimal water allocation strategies from five water sources to four end-user sectors under different water demand levels were determined. The corresponding total benefit, water supply cost, wastewater treatment cost, penalty cost, and water supply shortage were analyzed as well. The results are valuable for water resource managers to make desired management targets and effective plans with various uncertainties consideration in complex water resource system. The proposed method could be also effective to support decision making in water resource allocation problem under different optimal objectives and system conditions with insufficient probability distribution information. The proposed framework could also be applied in other water-stressed areas such as India, Mexico, and Africa, to provide efficient decision-making support for water allocation management. However, in practice, some limitations still exist in the developed model. For instance, although the ITSP model could provide optimal predesigned schedule and adjustment under different scenarios, it cannot measure the decision risk or reflect the risk attitude of decision makers when facing uncertainties. In addition, more details on water supply, transformation, and allocation processes could be further modeled in future research.

Acknowledgments

The authors gratefully acknowledge the financial support from Natural Science Foundation of Beijing Municipality (No. 9174028) and National Natural Science Foundation of China (No. 71603016 and No. 51609003). The authors are grateful to the anonymous reviewers and editors for their valuable comments and suggestions.

Author Contributions

Yu-Lei Xie and Ling Ji designed the manuscript and developed the models; Ling Ji and Ping Sun drafted the manuscript; Qiang Ma and Na Jiang collected the data and revised the manuscript; Guo-He Huang and Yu-Lei Xie checked the content and revised the manuscript. All authors made contributions to the study and the writing of the manuscript.

Conflicts of Interest

The authors declare no conflict of interest.

References

  1. Tumeizi, A.; Hammad, A.A. Traditional water distribution for irrigation in the Middle Ease: Practices and environmental impacts. J. Water Clim. Chang. 2016. [Google Scholar] [CrossRef]
  2. Wang, Y.Y.; Huang, G.H.; Wang, S.; Li, W. A stochastic programming with imprecise probabilities model for planning water resources systems under multiple uncertainties. Stoch. Environ. Res. Risk Assess. 2016, 30, 2169–2178. [Google Scholar] [CrossRef]
  3. Kondili, E.; Kaldellis, J.K.; Papapostolou, C. A novel systemic approach to water resources optimisation in areas with limited water resources. Desalination 2010, 250, 297–301. [Google Scholar] [CrossRef]
  4. Davijani, M.H.; Banihabib, M.E.; Anvar, A.N.; Hashemi, S.R. Multi-objective optimization model for the allocation of water resources in arid regions based on the maximization of socioeconomic efficiency. Water Resour. Manag. 2016, 30, 927–946. [Google Scholar] [CrossRef]
  5. He, G.; Yan, J.; Sha, J.; Song, C.; Zhong, S. Exploration of an optimal policy for water resources management including the introduction of advanced sewage treatment technologies in Zaozhuang City, China. Water 2016, 8, 608. [Google Scholar] [CrossRef]
  6. Hong, S.; Xia, J.; Chen, J.; Wan, L.; Ning, L.; Shi, W. Multi-object approach and its application to adaptive water management under climate change. J. Geogr. Sci. 2017, 27, 259–274. [Google Scholar] [CrossRef]
  7. Xie, Y.L.; Xia, D.H.; Huang, G.H.; Li, W.; Xu, Y. A multistage stochastic robust optimization model with fuzzy probability distribution for water supply management under uncertainty. Stoch. Environ. Res. Risk Assess. 2017, 31, 125–143. [Google Scholar] [CrossRef]
  8. Rezaei, F.; Safavi, H.R.; Zekri, M. A hybrid fuzzy-based multi-objective PSO algorithm for conjunctive water use and optimal multi-crop pattern planning. Water Resour. Manag. 2017, 31, 1139–1155. [Google Scholar] [CrossRef]
  9. Li, X.; Kang, S.; Niu, J.; Du, T.; Tong, L.; Li, S.; Ding, R. Applying uncertain programming model to improve regional farming economic benefits and water productivity. Agric. Water Manag. 2017, 179, 352–365. [Google Scholar] [CrossRef]
  10. Puy, A.; Muneepeerakul, R.; Balbo, A. Size and stochasticity in irrigated social-ecological systems. Sci. Rep. 2017. [Google Scholar] [CrossRef] [PubMed]
  11. Zahiri, B.; Torabi, S.A.; Tavakkoli-Moghaddam, R. A novel multi-stage possibilistic stochastic programming approach (with an application in relief distribution planning). Inf. Sci. 2017, 385–386, 225–249. [Google Scholar] [CrossRef]
  12. Xu, J.; Huang, G.; Li, Z.; Chen, J. A two-stage fuzzy chance-constrained water management model. Environ. Sci. Pollut. Res. 2017. [Google Scholar] [CrossRef] [PubMed]
  13. Zhou, Y.; Huang, G.; Wang, S.; Zhai, Y.; Xin, X. Water resources management under dual uncertainties: A factorial fuzzy two-stage stochastic programming approach. Stoch. Environ. Res. Risk Assess. 2016, 30, 795–811. [Google Scholar] [CrossRef]
  14. Birge, J.R.; Louveaux, F.V. Introduction to Stochastic Programming; Springer: New York, NY, USA, 1997. [Google Scholar]
  15. Huang, G.H.; Loucks, D.P. An inexact two-stage stochastic programming model for water resources management under uncertainty. Civ. Eng. Environ. Syst. 2000, 17, 95–118. [Google Scholar] [CrossRef]
  16. Niu, G.; Li, Y.P.; Huang, G.H.; Liu, J.; Fan, Y.R. Crop planning and water resource allocation for sustainable development of an irrigation region in China under multiple uncertainties. Agric. Water Manag. 2016, 166, 53–69. [Google Scholar] [CrossRef]
  17. Li, M.; Guo, P.; Singh, V.; Zhao, J. Irrigation water allocation using an inexact two-stage quadratic programming with fuzzy input under climate change. J. Am. Water Resour. Assoc. 2016. [Google Scholar] [CrossRef]
  18. Xin, X.; Huang, G.H.; Sun, W.; Zhou, Y. Factorial two-stage irrigation system optimization model. J. Irrig. Drain. Eng. 2016, 142. [Google Scholar] [CrossRef]
  19. Wang, B.; Cai, Y.; Yin, X.; Tan, Q.; Hao, Y. An integrated approach of system dynamics, orthogonal experimental design and inexact optimization for supporting water resources management under uncertainty. Water Resour. Manag. 2017, 31, 1665–1694. [Google Scholar] [CrossRef]
  20. Ahmed, S.; Tawarmalani, M.; Sahinidis, N.V. A finite branch-and-bound algorithm for two-stage stochastic integer programs. Math. Program. Ser. A 2004, 100, 355–377. [Google Scholar] [CrossRef]
  21. Huang, G.H. IPWM: An interval-parameter water quality management model. Eng. Optim. 1996, 26, 79–103. [Google Scholar] [CrossRef]
  22. Ji, L.; Huang, G.H.; Huang, L.C.; Xie, Y.L.; Niu, D.X. Inexact stochastic risk-aversion optimal day-ahead dispatch model for electricity system management with wind power under uncertainty. Energy 2016, 109, 920–932. [Google Scholar] [CrossRef]
  23. Zeng, X.; Li, Y.; Huang, G.H.; Yu, L.Y. Inexact mathematical modeling for the identification of water trading policy under uncertainty. Water 2014, 6, 229–252. [Google Scholar] [CrossRef]
  24. Tianjin Statistic Bureau. Tianjin Statistical Yearbook 2015; China Statistics Press: Beijing, China, 2016. [Google Scholar]
  25. Tianjin Municipality’s Water Conservancy Bureau. Tianjin Water Resources Bulletin 2015; Tianjin Municipality’s Water Conservancy Bureau: Tianjin, China, 2016. [Google Scholar]
  26. Tianjin Municipal Government. Tianjin General Planning (2015~2030); Tianjin Municipal Government: Tianjin, China, 2016.
  27. Xie, Y.L.; Huang, G.H.; Li, W.; Li, J.B.; Li, Y.F. An inexact two-stage stochastic programming model for water resources management in Nansihu Lake Basin, China. J. Environ. Manag. 2013, 127, 188–205. [Google Scholar] [CrossRef] [PubMed]
Figure 1. Map of Tianjin.
Water 09 00414 g001
Figure 2. Optimal surface water allocation under different scenarios during Period 1 (a) and 2 (b).
Water 09 00414 g002aWater 09 00414 g002b
Figure 3. Optimal underground water allocation under different scenarios during Period 1 (a) and 2 (b).
Water 09 00414 g003
Figure 4. Net benefit (a); and total cost (b) under different scenarios during the planning horizon.
Water 09 00414 g004
Figure 5. Pollutant treatment cost under different scenarios during Period 1 (a) and 2 (b).
Water 09 00414 g005
Table 1. Forecasted water demand under different scenarios (unit: 106 m3).
Sectorst = 1t = 2
LowMediumHighLowMediumHigh
j = 1[5700, 5985][5900, 6195][6100, 6405][5800, 6090][6000, 6300][6300, 6615]
j = 2[2400, 2520][2500, 2625][2700, 2835][2500, 2625][2600, 2730][2800, 2940]
j = 3[2300, 2415][2450, 2573][2650, 2783][2400, 2520][2550, 2678][2750, 2888]
j = 4[1900, 1995][2100, 2205][2300, 2415][2000, 2100][2200, 2310][2400, 2520]
Table 2. The main economic parameters in the optimization model (unit: million RMB/106 m3).
SectorsNet Benefit for Water ConsumptionPenalty Cost for Unsatisfied Demand
t = 1t = 2t = 1t = 2
j = 1[22.5, 23.5][23.5, 24.5][32.5, 33.5][36.5, 39.0]
j = 2[220, 225][248, 251][305, 310][322, 328]
j = 3[2.8, 3.0][3.5, 3.8][5.0, 6.2][5.5, 6.9]
j = 4[11.5, 12.0][13.2, 14.0][20.5, 22.0][23.8, 25.4]
Table 3. Optimal initial water resource allocation (unit: 109 m3).
PeriodWater Resourcesj = 1j = 2j = 3j = 4
t = 1i = 13.8000.400
i = 21.5000.400
i = 30.591.980.841.59
i = 400.120.110
i = 500.350.350.35
t = 2i = 13.9900.410
i = 21.1200.480
i = 30.832.110.751.56
i = 4000.060.07
i = 500.370.370.37
Table 4. Optimal water allocation of transferred water, desalinated seawater, and reused water (unit: 106 m3).
t = 1t = 2
s = 1s = 2s = 3s = 1s = 2s = 3
Transferred water (i = 3)
j = 1[595, 680][595, 685]595[832, 917]832832
j = 219801980[1980, 2088]21102110[2110, 2260]
j = 3[837, 885][837, 1047][837, 840][748, 896][748, 998]748
j = 415891589[1589, 1777]15591559[1559, 1660]
Sea water desalination (i = 4)
j = 1000000
j = 2119119[119, 239]000
j = 3115115[115, 229]5959[59, 118]
j = 40006767134
Reused water (i = 5)
j = 1000000
j = 2[350, 486][452, 593][537, 700][425, 568][527, 675][729, 740]
j = 3[610, 700][414, 700][350, 700]740740[557, 740]
j = 4[350, 457][554, 673][590, 700][402, 517][604, 731]740
Table 5. Unsatisfied water demand and its penalty cost.
Sectorst = 1t = 2
s = 1s = 2s = 3s = 1s = 2s = 3
Unsatisfied water demand (106 m3)j = 100[0, 204.73]000
j = 2000000
j = 300[59, 109.18]000
j = 400[0, 165.14]00[0, 37]
Penalty cost (million RMB)j = 100[0, 6654]000
j = 2000000
j = 300[326, 546]000
j = 400[0, 3385]00[0, 951]

