
Shoreline Response to a Sequence of Typhoon and Monsoon Events

 ,
,  and
and 
Abstract
:1. Introduction
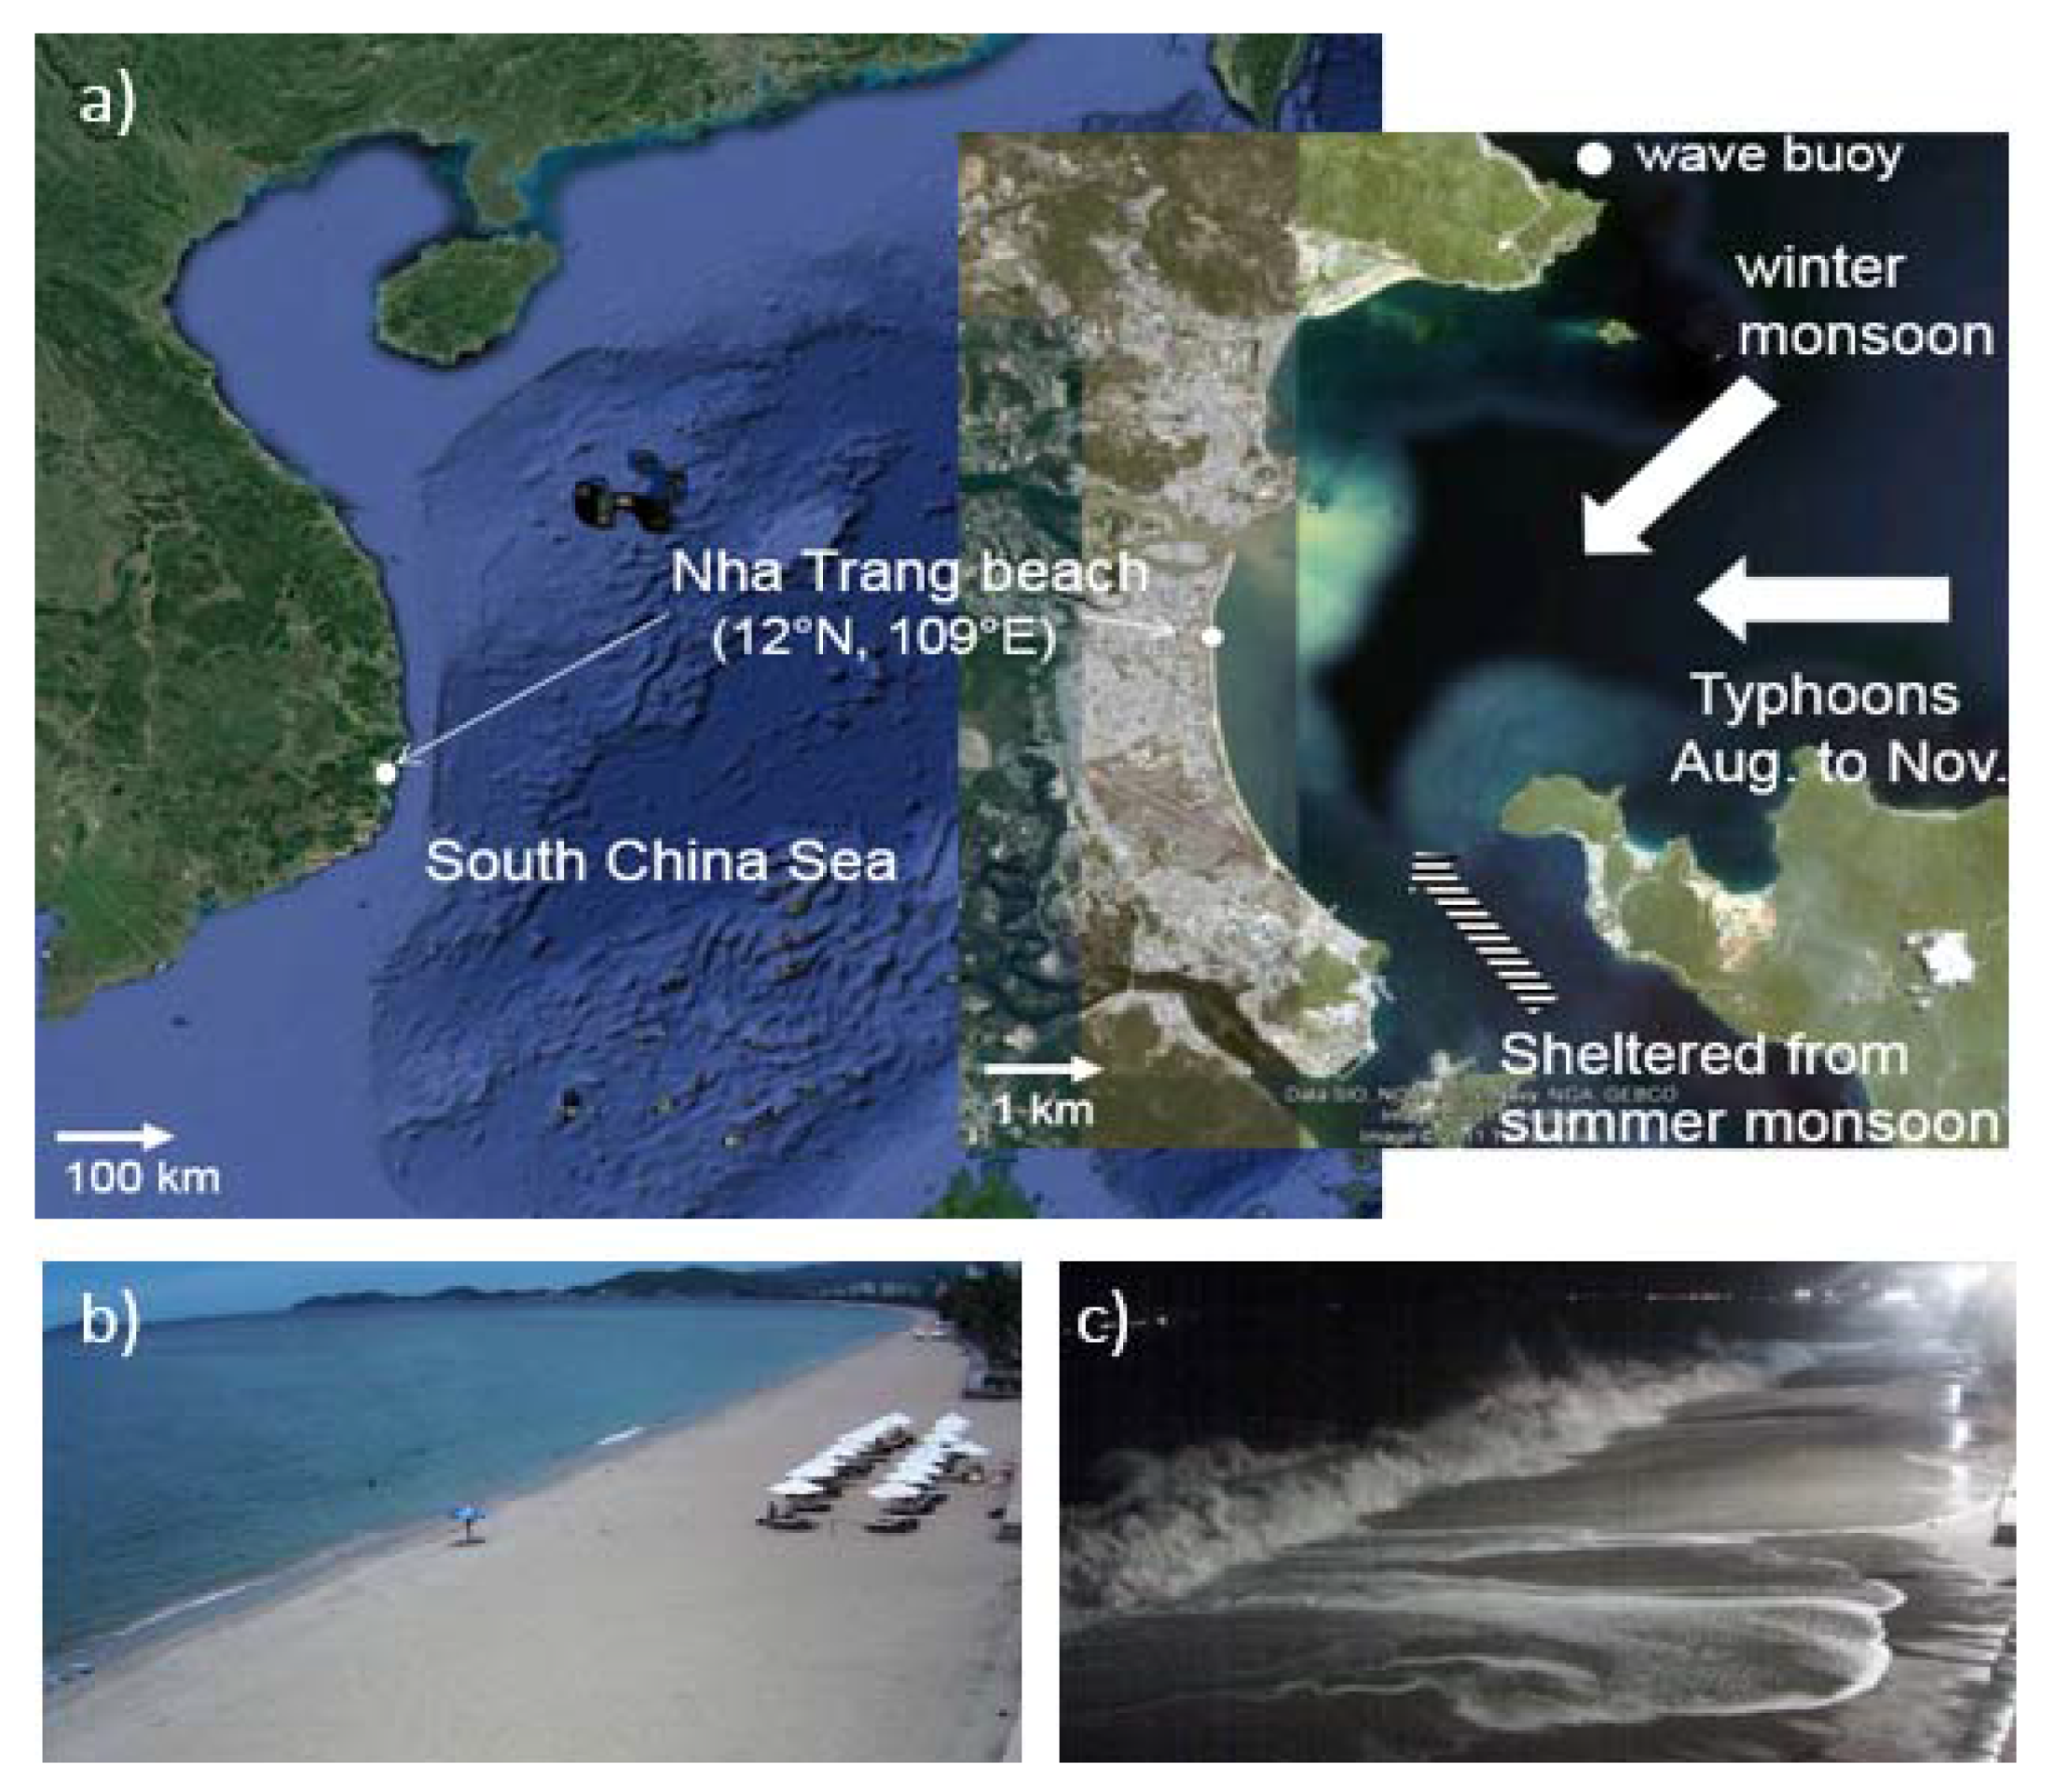
2. Study Site
2.1. Typhoons
2.2. Monsoons
3. Methods and Data
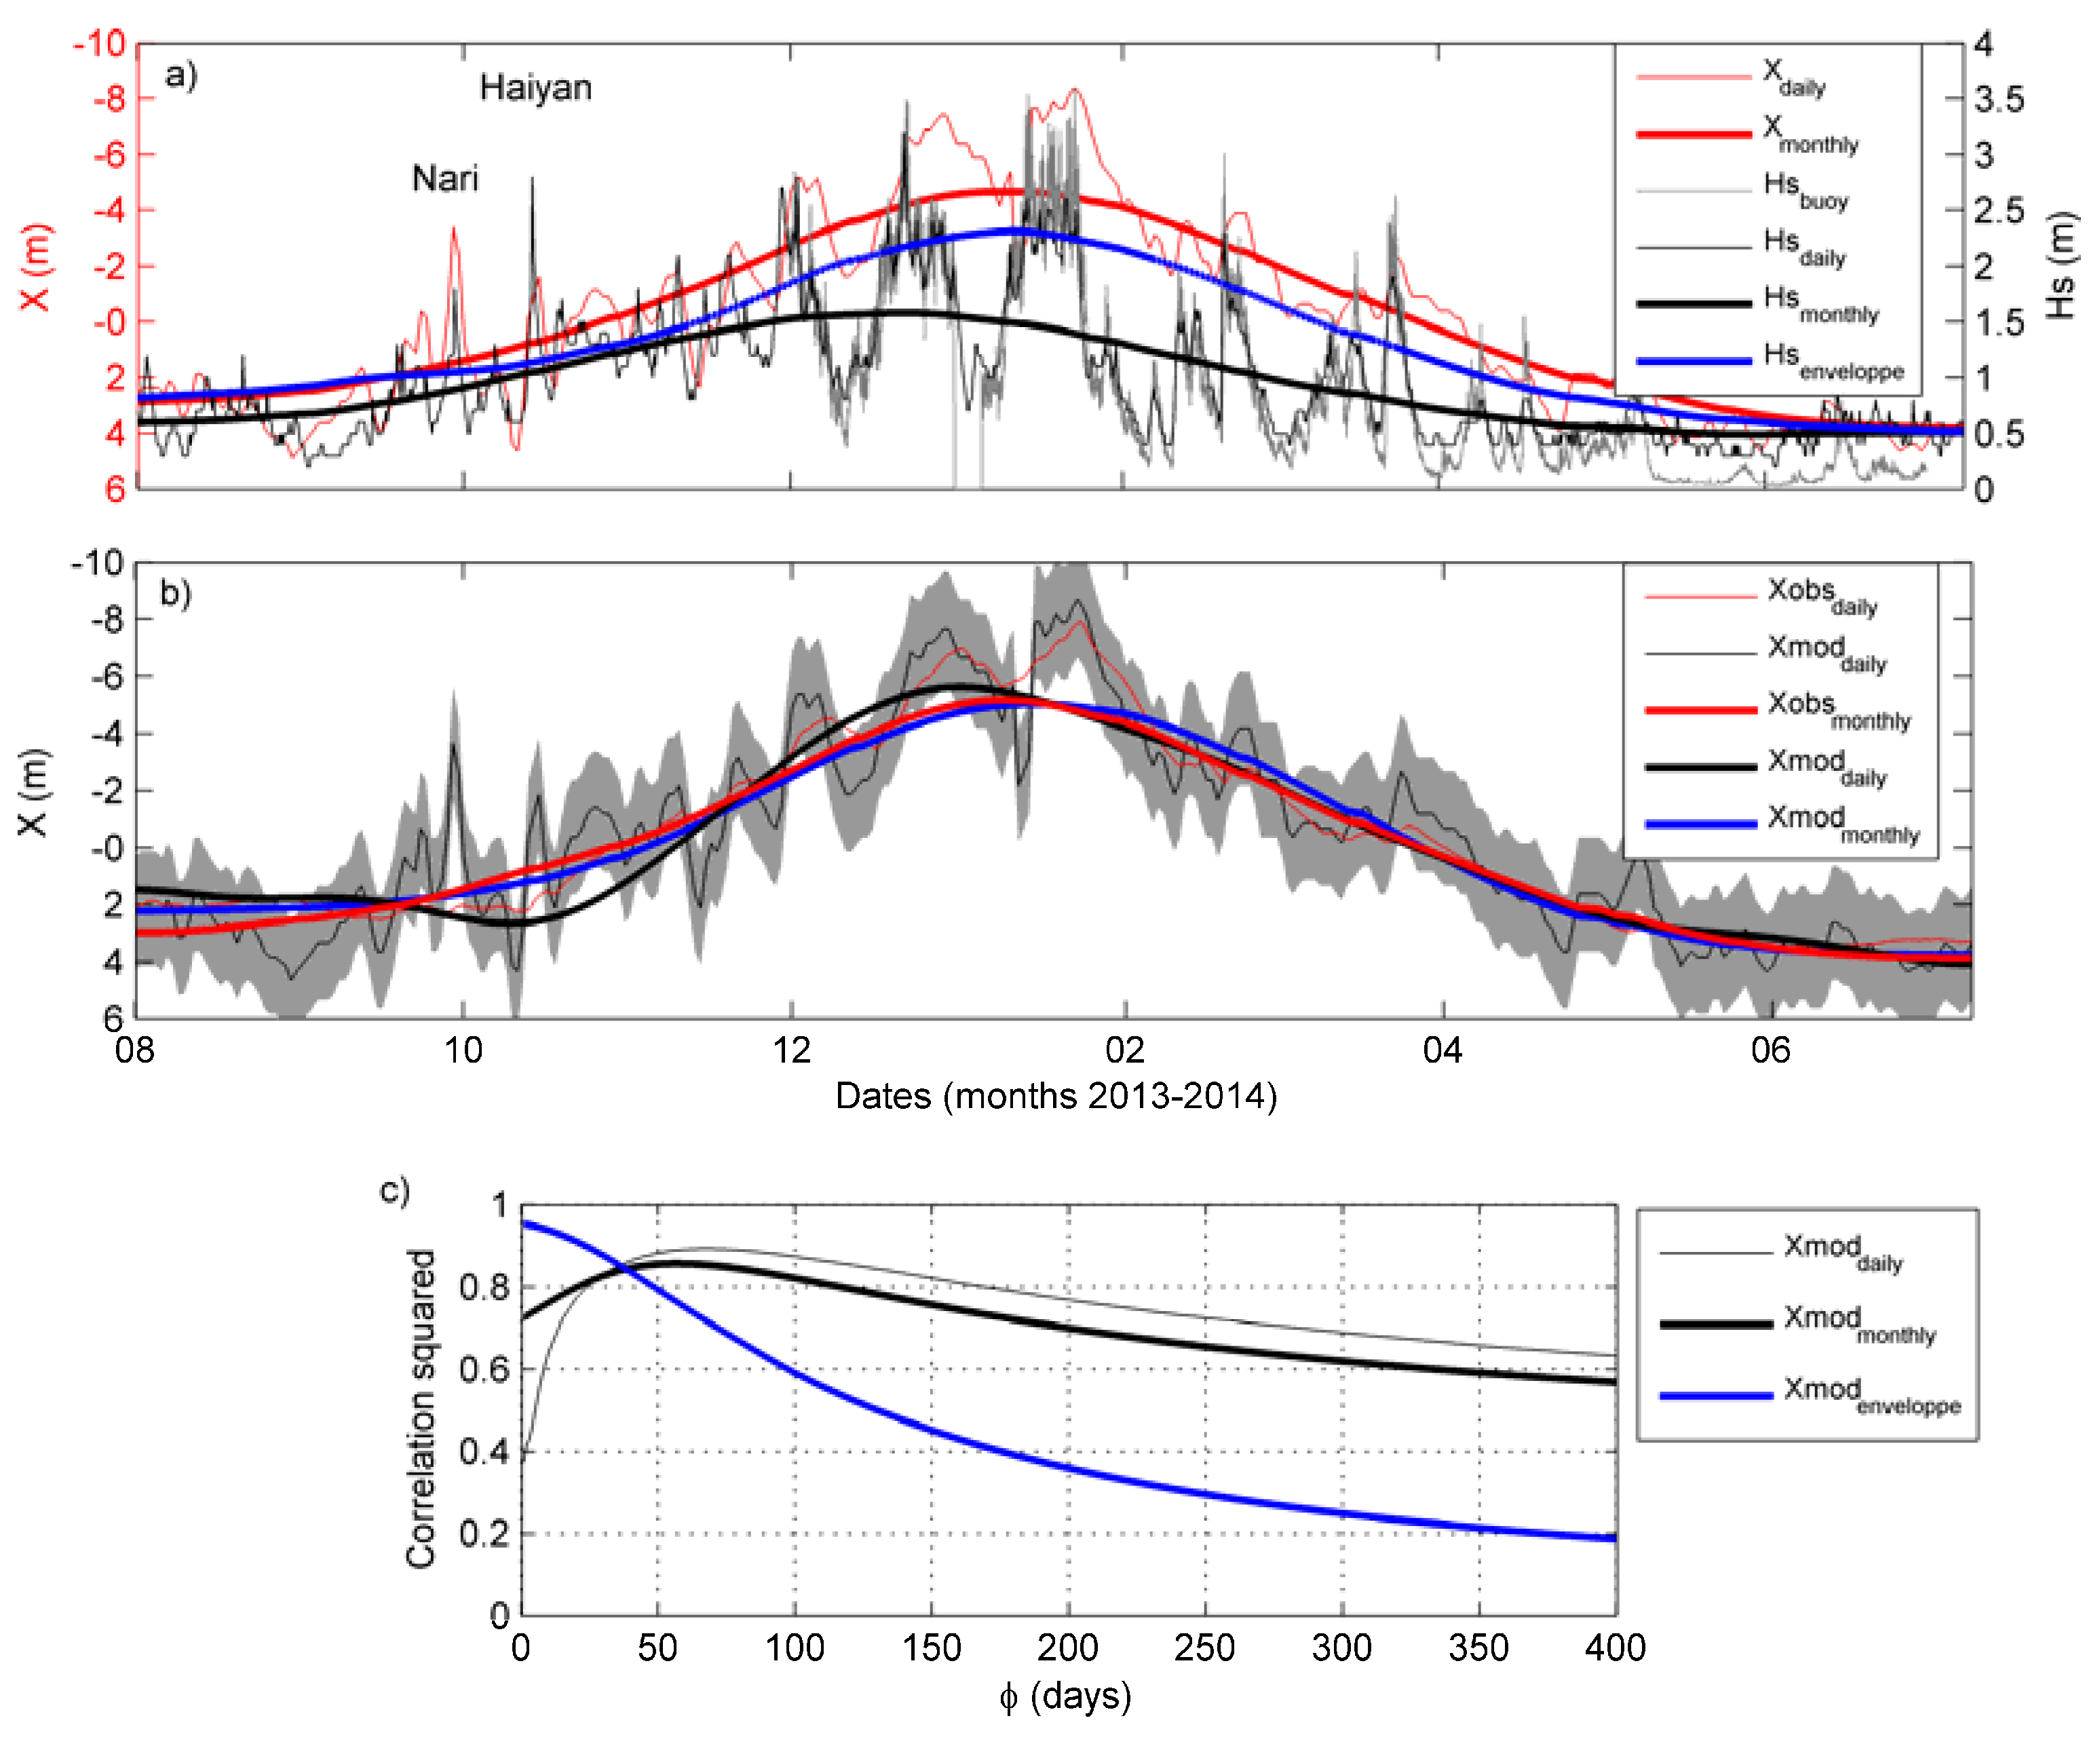
4. Results
5. Discussion
6. Conclusions
Acknowledgments
Author Contributions
Conflicts of Interest
References
- Ashton, A.D.; Evans, R.L.; Donnelly, J.P. Discussion of the Potential Impacts of Climate Change on the Shorelines of the Northeastern USA. Mitig. Adapt. Strateg. Glob. Chang. 2008, 13, 719–743. [Google Scholar] [CrossRef]
- Davidson, M.A.; Splinter, K.D.; Turner, I.L. A simple equilibrium model for predicting shoreline change. Coast. Eng. 2013, 73, 191–202. [Google Scholar] [CrossRef]
- Cooper, J.A.G.; Pilkey, O.H. Sea-level rise and shoreline retreat: Time to abandon the Bruun Rule. Glob. Planet. Chang. 2004, 43, 157–171. [Google Scholar] [CrossRef]
- Anderson, T.R.; Frazer, L.N.; Fletcher, C.H. Transient and persistent shoreline change from a storm. Geophys. Res. Lett. 2010, 37. [Google Scholar] [CrossRef]
- Ranasinghe, R.; Holman, R.; de Schipper, M.A.; Lippmann, T.; Wehof, J.; Minh Duong, T.; Roelvink, D.; Stive, M.J.F. Quantification of nearshore morphological recovery time scales using Argus video imaging: Palm Beach, Sydney and Duck, NC. Coast. Eng. Proc. 2012, 1, 24. [Google Scholar]
- Kriebel, D.L.; Dean, R.G. Convolution method for time dependent beach profile response. J. Waterw. Port. Coast. Ocean Eng. 1993, 119, 204–226. [Google Scholar] [CrossRef]
- Frazer, L.N.; Anderson, T.R.; Fletcher, C.H. Modeling storms improves estimates of long-term shoreline change. Geophys. Res. Lett. 2009, 36. [Google Scholar] [CrossRef]
- Ferreira, Ó. Storm groups versus extreme single storms: Predicted erosion and management consequences. J. Coast. Res. 2005, 21, 221–227. [Google Scholar]
- Coco, G.; Senechal, N.; Rejas, A.; Bryan, K.R.; Capo, S.; Parisot, J.P.; Brown, J.A.; MacMahan, J.H.M. Beach response to a sequence of extreme storms. Geomorphology 2014, 204, 493–501. [Google Scholar] [CrossRef]
- Karunarathna, H.; Pender, D.; Ranasinghe, R.; Short, A.D.; Reeve, D.E. The effects of storm clustering on beach profile variability. Mar. Geo. 2014, 348, 103–112. [Google Scholar] [CrossRef]
- Splinter, K.D.; Carley, J.T.; Golshani, A.; Tomlinson, R. A relationship to describe the cumulative impact of storm clusters on beach erosion. Coast. Eng. 2014, 83, 49–55. [Google Scholar] [CrossRef]
- Masselink, G.; Scott, T.; Poate, T.; Russell, P.; Davidson, M.; Conley, D. The extreme 2013/14 winter storms: Hydrodynamic forcing and coastal response along the southwest coast of England. Earth Surf. Proc. Landf. 2016, 41, 378–391. [Google Scholar] [CrossRef]
- Yates, M.L.; Guza, R.T.; O’Reilly, W.C. Equilibrium shoreline response: Observations and modeling. Geophys. Res. 2009, 114. [Google Scholar] [CrossRef]
- Splinter, K.D.; Turner, I.L.; Davidson, M.A.; Barnard, P.; Castelle, B.; Oltman-Shay, J. A generalized equilibrium model for predicting daily to interannual shoreline response. J. Geophys. Res. Earth Surf. 2014, 119, 1936–1958. [Google Scholar] [CrossRef]
- Jackson, N.L.; Nordstrom, K.F.; Eliot, I.; Masselink, G. “Low energy” sandy beaches in marine and estuarine environments: A review. Geomorphology 2002, 48, 147–162. [Google Scholar] [CrossRef]
- Chen, S.S.; Curcic, M. Ocean surface waves in Hurricane Ike (2008) and Superstorm Sandy (2012): Coupled modeling and observations. Ocean Mod. 2016, 103, 161–176. [Google Scholar] [CrossRef]
- Chang, C.-P.; Wang, Z.; Hendon, H. The Asian Monsoon; Springer: Heidelberg, Germany, 2006; pp. 89–128. [Google Scholar]
- Wu, M.C.; Chan, J.C.L. Surface features of winter monsoon surges over South China. Mon. Wea. Rev. 1995, 123, 662–680. [Google Scholar] [CrossRef]
- Camargo, S.J.; Robertson, A.W.; Gaffney, S.J.; Smyth, P.; Ghil, M. Cluster analysis of typhoon tracks, Part I: General properties. J. Clim. 2007, 20, 3635–3653. [Google Scholar] [CrossRef]
- Nicholls, R.J.; Hoozemans, F.M.; Marchand, M. Increasing flood risk and wetland losses due to global sea-level rise: Regional and global analyses. In Global Environmental Change; Elsevier: Amsterdam, The Netherlands, 1999; Volume 9, pp. 69–87. [Google Scholar]
- Chan, J.C.L. Tropical cyclone activity in the northwest Pacific in relation to El Niño/Southern Oscillation phenomenon. Mon. Weather Rev. 1985, 113, 599–606. [Google Scholar] [CrossRef]
- Nakamura, T.; Yamazaki, K.; Iwamoto, K.; Honda, M.; Miyoshi, Y.; Ogawa, Y.; Tomikawa, Y.; Ukita, J. The stratospheric pathway for Arctic impacts on midlatitude climate. Geophys. Res. Lett. 2016, 43, 3494–3501. [Google Scholar] [CrossRef]
- Nakamura, R.; Shibayama, T.; Esteban, M.; Iwamoto, T. Future typhoon and storm surges under different global warming scenarios: Case study of typhoon Haiyan (2013). Nat. Hazards 2016, 82, 1645–1681. [Google Scholar] [CrossRef]
- Chu, P.C.; Qi, Y.; Chen, Y.; Shi, P.; Mao, Q. South China Sea wind- wave characteristics. Part I: validation of Wavewatch-III using TOPEX/Poseidon data. J. Atmos. Ocean Technol. 2004, 21, 1718–1733. [Google Scholar] [CrossRef]
- Mirzaei, A.; Tangang, F.; Juneng, L.; Mustapha, M. A.; Husain, M. L.; Akhir, M. F. Wave climate simulation for southern region of the South China Sea. Ocean Dyn. 2013, 63, 961–977. [Google Scholar] [CrossRef]
- Lefebvre, J.-P.; Almar, R.; Viet, N.T.; Uu, D.V.; Thuan, D.H.; Binh, L.T.; Ibaceta, R.; Duc, N.V. Contribution of swash processes generated by low energy wind waves in the recovery of a beach impacted by extreme events: Nha Trang, Vietnam. J. Coast. Res. 2014, 70, 663–668. [Google Scholar] [CrossRef]
- Duong, H.T.; Binh, L.T.; Viet, N.T.; Hanh, K.D.; Almar, R.; Marchesiello, P. Typhoon impact and shoreline recovery from continuous video monitoring: a case study from Nha Trang beach, Vietnam. Proceedings of the 14th International Coastal Symposium (Sydney, Australia). J. Coast. Res. 2016, 75, 263–267. [Google Scholar]
- Almeida, L.P.; Almar, R.; Marchesiello, P.; Blenkinsopp, C.; Martins, K.; Sénéchal, N.; Floc’H, F.; Bergsma, E.; Benshila, R.; Caulet, C.; et al. Swash zone dynamics of a reflective beach with a low tide terrace. Mar. Geol. 2017. submitted for publication. [Google Scholar]
- Abessolo, O.G.; Almar, R.; Kestenare, E.; Bahini, A.; Houngue, G.H.; Jouanno, J.; Du, P.Y.; Castelle, B.; Melet, A.; Messignac, B.; et al. Potential of video cameras in assessing event and seasonal coastline behaviour: Grand Popo, Benin (Gulf of Guinea). J. Coast. Res. 2016, 75, 442–446. [Google Scholar] [CrossRef]
- Dee, D.P.; Uppala, S.M.; Simmons, A.J.; Berrisford, P.; Poli, P.; Kobayashi, S.; Andrae, U.; Balsamo, G.; Bauer, P.; Bechtold, P. The ERA-Interim reanalysis: Configuration and performance of the data assimilation system. Q. J. R. Meteorol. Soc. 2011, 137, 553–597. [Google Scholar] [CrossRef]
- Davidson, M.A.; Turner, I.L. A behavioral template beach profile model for predicting seasonal to interannual shoreline. J. Geophys. Res. 2009, 114, F01020. [Google Scholar] [CrossRef]
- Ruggiero, P.; Buijsman, M.; Kaminsky, G.M.; Gelfenbaum, G. Modeling the effects of wave climate and sediment supply variability on large-scale shoreline change. Mar. Geol. 2010, 273, 127–140. [Google Scholar]
- Veltcheva, A.D. Wave and group transformation by a Hilbert spectrum. Coast. Eng. J. 2002, 44, 283–300. [Google Scholar] [CrossRef]
- Ortega, J.; Smith, G.H. Hilbert-Huang transform analysis of storm waves. Appl. Ocean Res. 2009, 31, 212–219. [Google Scholar] [CrossRef]
- Douglas, B.C.; Crowell, M. Long-Term Shoreline Position Pre diction and Error Propagation. J. Coast. Res. 2000, 16, 145–152. [Google Scholar]
- Zhang, K.; Douglas, B.C.; Leatherman, S.P. Do Storms Cause Long-Term Beach Erosion along the U.S. East Barrier Coast? J. Geol. 2002, 110, 493–502. [Google Scholar] [CrossRef]
- Hansen, J.E.; Barnard, P.L. Sub-weekly to interannual variability of a high-energy shoreline. Coast. Eng. 2010, 57, 959–972. [Google Scholar] [CrossRef]
- Thanh, T.M.; Tanaka, H.; Viet, N.T.; Mitobe, Y.; Hoang, V.C. Evaluation of longshore sendiment transport on Nha Trang coast considering influence of Northeast monsoon waves. J. Jpn. Soc. Civ. Eng. 2015, 71, 1681–1686. [Google Scholar]
- Turki, I.; Medina, R.; Gonzalez, M.; Coco, G. Natural variability of shoreline position: Observations at three pocket beaches. Mar. Geol. 2013, 338, 76–89. [Google Scholar] [CrossRef]
© 2017 by the authors. Licensee MDPI, Basel, Switzerland. This article is an open access article distributed under the terms and conditions of the Creative Commons Attribution (CC BY) license (http://creativecommons.org/licenses/by/4.0/).
Share and Cite
Almar, R.; Marchesiello, P.; Almeida, L.P.; Thuan, D.H.; Tanaka, H.; Viet, N.T. Shoreline Response to a Sequence of Typhoon and Monsoon Events. Water 2017, 9, 364. https://doi.org/10.3390/w9060364
Almar R, Marchesiello P, Almeida LP, Thuan DH, Tanaka H, Viet NT. Shoreline Response to a Sequence of Typhoon and Monsoon Events. Water. 2017; 9(6):364. https://doi.org/10.3390/w9060364
Chicago/Turabian StyleAlmar, Rafael, Patrick Marchesiello, Luis Pedro Almeida, Duong Hai Thuan, Hitoshi Tanaka, and Nguyen Trung Viet. 2017. "Shoreline Response to a Sequence of Typhoon and Monsoon Events" Water 9, no. 6: 364. https://doi.org/10.3390/w9060364
APA StyleAlmar, R., Marchesiello, P., Almeida, L. P., Thuan, D. H., Tanaka, H., & Viet, N. T. (2017). Shoreline Response to a Sequence of Typhoon and Monsoon Events. Water, 9(6), 364. https://doi.org/10.3390/w9060364