Article

Developing Intensity–Duration–Frequency (IDF) Curves under Climate Change Uncertainty: The Case of Bangkok, Thailand

by
Ashish Shrestha
1,2,*,
Mukand Singh Babel
2,
Sutat Weesakul
2 and
Zoran Vojinovic
1,2,3,4
1
UNESCO-IHE, Institute for Water Education, Westvest 7, AX Delft 2611, The Netherlands
2
School of Engineering and Technology, Asian Institute of Technology, P.O. Box 4 Klong Luang, Pathumthani 12120, Thailand
3
College of Engineering, Mathematics and Physics, University of Exeter, Exeter EX4 4QF, UK
4
School of Civil Engineering, University of Belgrade, Bulevar kralja Aleksandra 73, Beograd 11000, Serbia
*
Author to whom correspondence should be addressed.
Water 2017, 9(2), 145; https://doi.org/10.3390/w9020145
Submission received: 8 December 2016 / Revised: 10 February 2017 / Accepted: 15 February 2017 / Published: 22 February 2017
(This article belongs to the Special Issue Hydroinformatics and Urban Water Systems)

Abstract

:
The magnitude and frequency of hydrological events are expected to increase in coming years due to climate change in megacities of Asia. Intensity–Duration–Frequency (IDF) curves represent essential means to study effects on the performance of drainage systems. Therefore, the need for updating IDF curves comes from the necessity to gain better understanding of climate change effects. The present paper explores an approach based on spatial downscaling-temporal disaggregation method (DDM) to develop future IDFs using stochastic weather generator, Long Ashton Research Station Weather Generator (LARS-WG) and the rainfall disaggregation tool, Hyetos. The work was carried out for the case of Bangkok, Thailand. The application of LARS-WG to project extreme rainfalls showed promising results and nine global climate models (GCMs) were used to estimate changes in IDF characteristics for future time periods of 2011–2030 and 2046–2065 under climate change scenarios. The IDFs derived from this approach were corrected using higher order equation to mitigate biases. IDFs from all GCMs showed increasing intensities in the future for all return periods. The work presented demonstrates the potential of this approach in projecting future climate scenarios for urban catchment where long term hourly rainfall data are not readily available.

1. Introduction

Almost on daily basis we can observe that the world is being overwhelmed by extreme hydro-meteorological disasters such as hurricanes (or typhoons), widespread flooding and droughts, all of which are associated with devastating losses and suffering (e.g., [1,2,3,4]). Therefore, our search for optimal configurations of water infrastructure systems represents a great challenge for researchers and practitioners (e.g., [5,6,7,8,9,10]). The uncertainty brought by climate change (or climate extremes) make the above challenge even more significant. Addressing climate change effects in the development of disaster management plans has been on the agenda of many governments and institutions. Hydrodynamic flood modelling is an important aspect in the development of flood mitigation and climate adaptation strategies, which requires high resolution time series data of continuous precipitation or design storms. Hence, a more effective disaster management planning requires both current and projected climate change scenarios for which a range of optimal measures needs to be sought. The use of physical-based models is invaluable for this purpose [11,12]. For example, with numerical models, it is possible to explore the generation and propagation of floods and explore any potential impacts that may be incurred due to floods. However, there is a significant body of literature that suggests that a great care and caution should be applied to data collection and processing activities (e.g., rainfall and hydrological data, system data, terrain data, etc.), selection of a model to reflect the problem at hand and the use of geographic information system (GIS) mapping techniques [13,14,15,16,17,18,19,20,21,22,23,24,25,26,27,28,29,30].
Gaining understanding of the potential change of frequency, intensity and volume of extreme rainfall due to climate change has been put forward by many researchers and practitioners (e.g., [31,32,33,34,35]). The need for such understanding comes from the fact that the existing drainage systems are designed to cope with past records of rainfall events and as such they may be insufficient to accommodate future rainfall characteristics. Hence, development of appropriate present and future Intensity–Duration–Frequency (IDF) curves assist in hydrological study for the urban drainage system performance analysis, design and operation. The IDF relationship is a mathematical relationship between rainfall intensity i, duration d, and the return period T [36]. The IDF curve is a convenient form of rainfall information and, as such, it has been an important data set for the design of urban drainage systems [37]. However, it has been a well-accepted fact that those IDFs developed from past climatic conditions cannot be valid for future climatic conditions unless the IDFs are updated to the future climate trends (see also [38,39]). A study in Mediterranean area, showed that in spite of the important decreases or lesser increment in corresponding total precipitation, extreme rainfall of shorter duration will increase in future [40]. Several methods exist for studying changes in IDF under climate change; for examples, equidistance quantile matching method using spatial and temporal downscaling of global climate models (GCMs) and sub-daily observed rainfall in Canada [41]; spatial downscaling and temporal downscaling based on scaling properties of rainfall in urban area of Spain [40]; and spatial-temporal downscaling approach using scaling generalized extreme value (GEV) distribution in Canada [42]. Mailhot and Duchesne [38] strongly argue that there is a need to evaluate the climate induced change of pattern, intensity and frequency of extreme rainfall before embarking on any system performance analysis. In this regard, the process of downscaling climate data has been an important task for many researchers and practitioners; and the use of GCMs has been the most appealing method for studying the implications of climate change. However, there are numerous issues associated with the process of downscaling climate data. Despite being important tools to project the expected future scenarios of climatic parameters, GCMs contain biases when compared to observed data due to their parameterization systems and large grid size, which at the regional scale is insignificant, but are significant at basin scale [43]. Bias correction methods are applied to correct one or more statistical aspect, which are referred as statistical bias correction, quantile-based bias correction, and histogram equalization methods [43,44,45,46]. The present paper provides contribution in this direction and it presents an approach based on spatial downscaling-temporal disaggregation method (DDM), which appears to give promising results in generating rainfall data for a single site station in an urban catchment.

2. Use of Global Climate Models (GCMs) in Urban Scale Applications
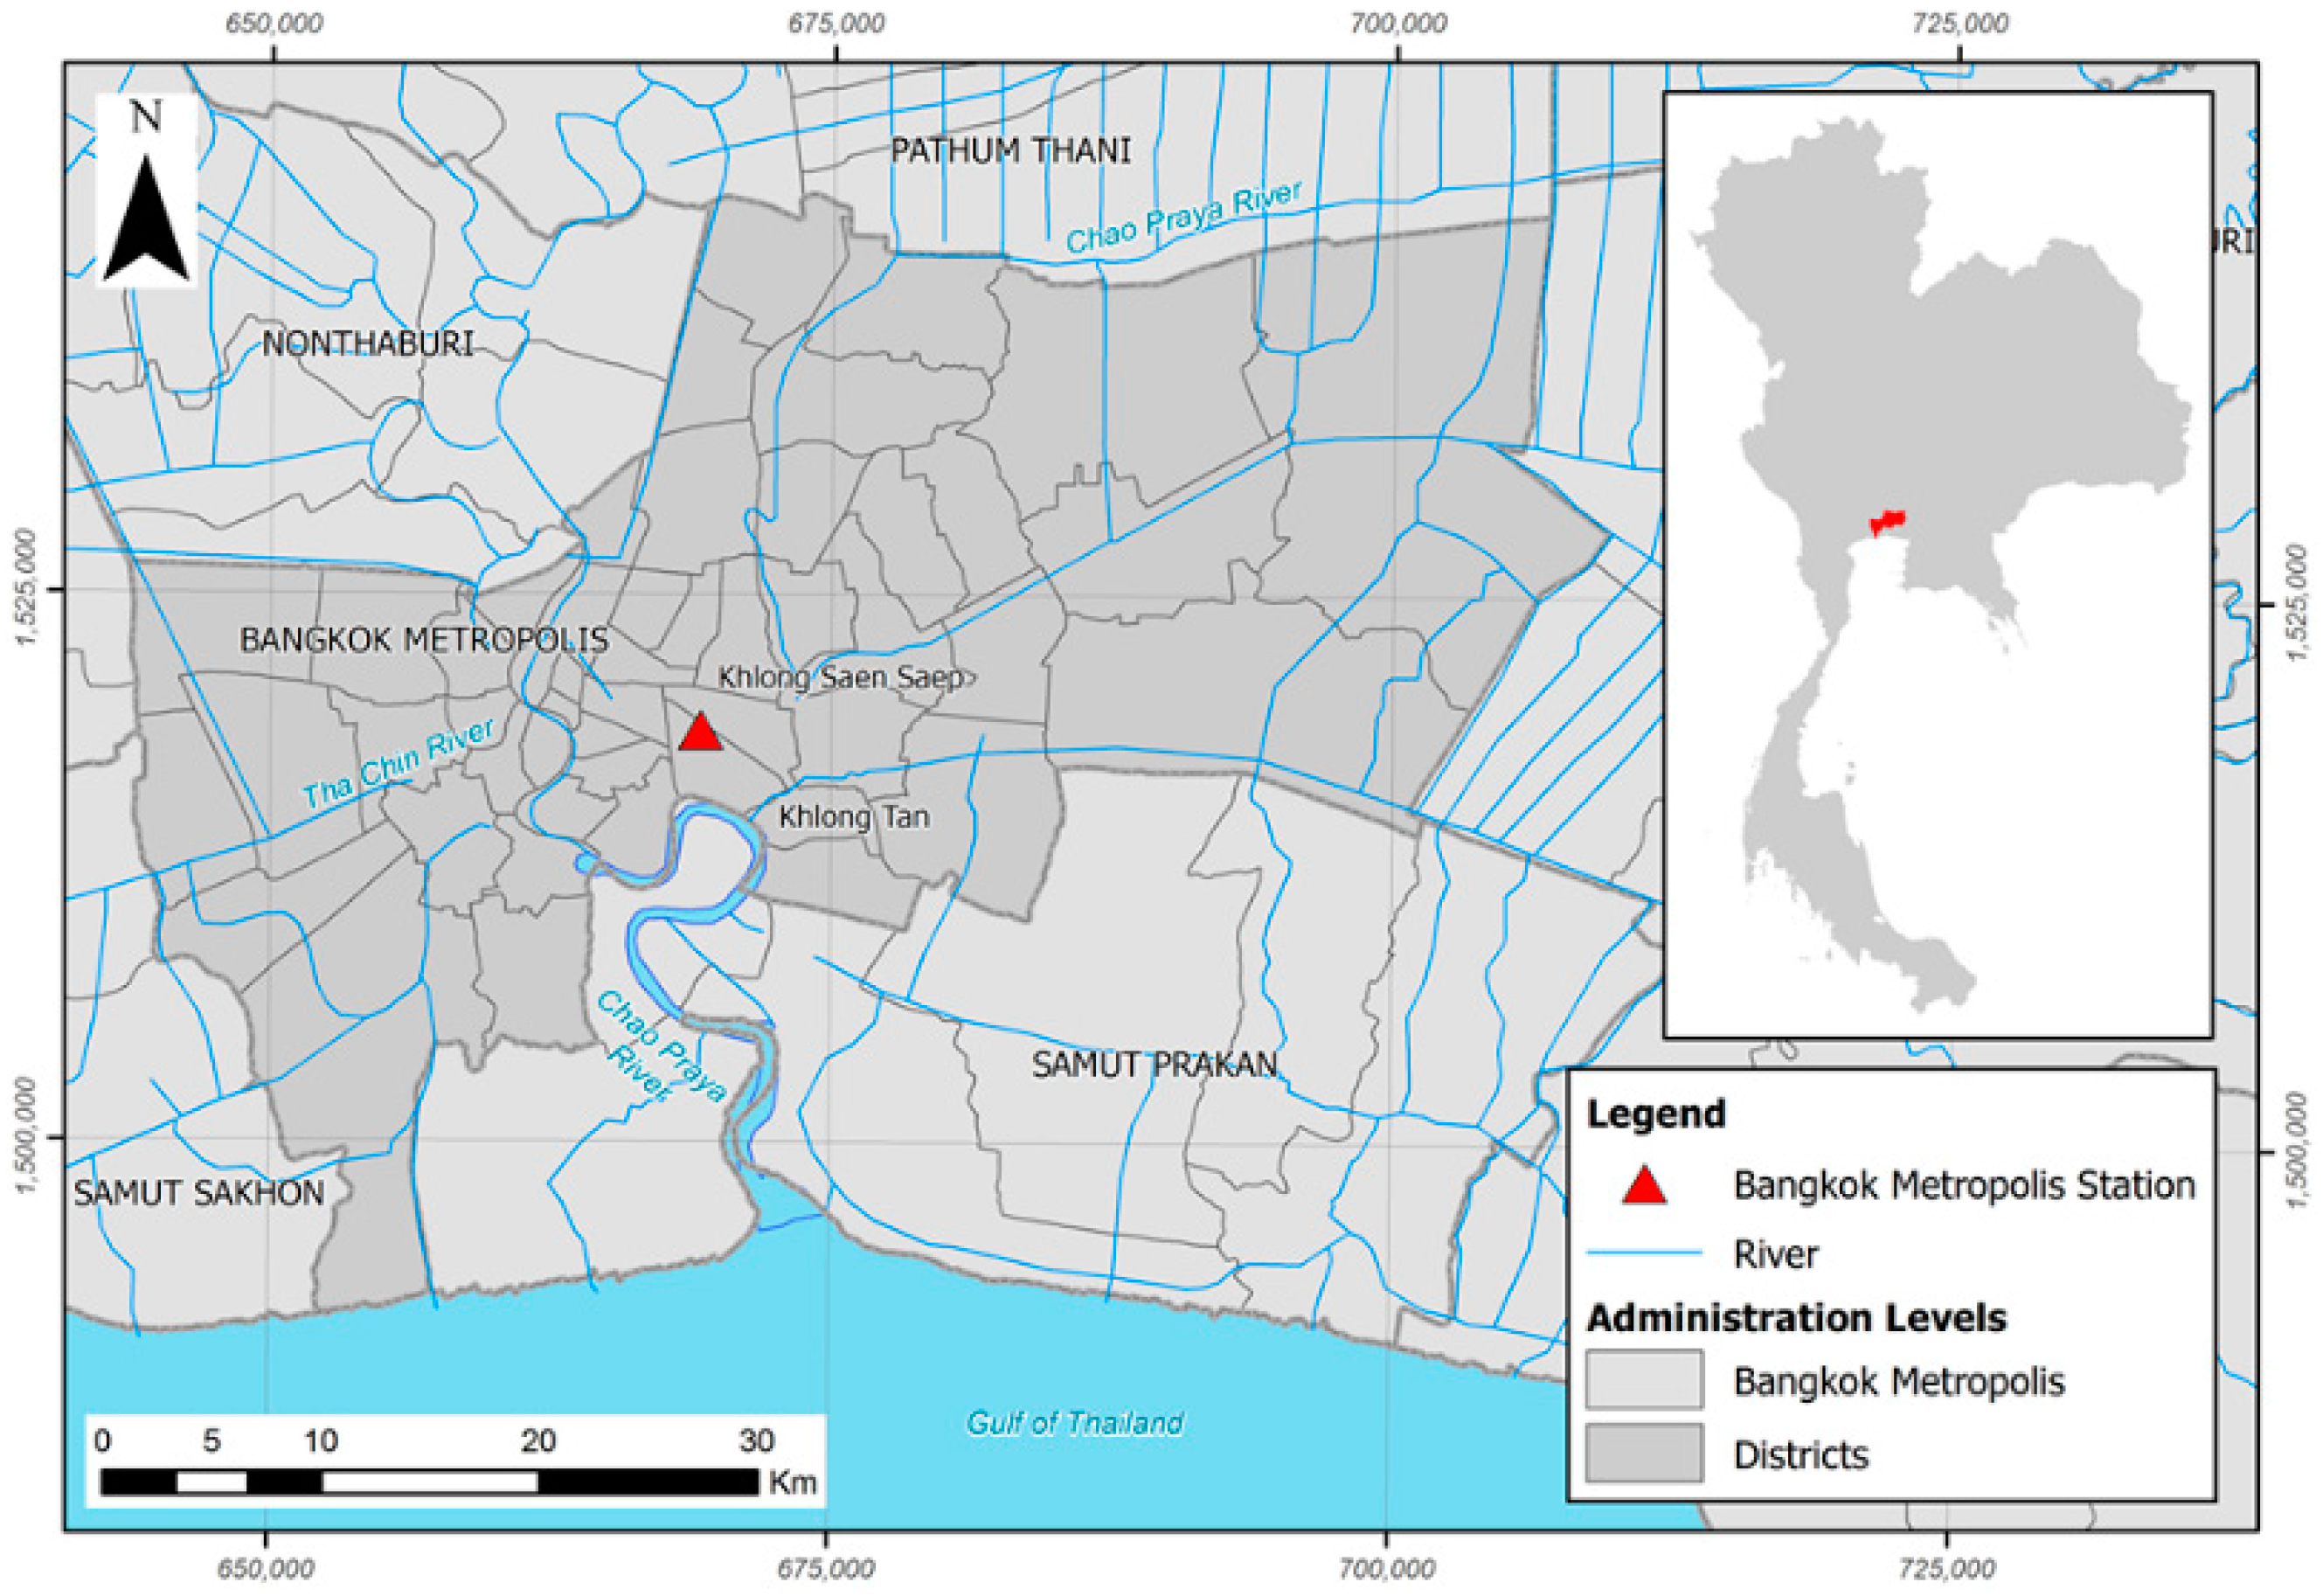
The outputs from GCMs are typically defined at 150–300 km coarse grids, while regional climate models (RCMs) resolutions are about 12–50 km [47]. The different downscaling techniques in practice are dynamical downscaling, statistical downscaling, regression based downscaling, weather typing procedure and the stochastic weather generator (see [47,48,49]). The most commonly applied techniques are dynamic and statistical downscaling methods. Long Ashton Research Station Weather Generator (LARS-WG) is a single site numerical model for simulating time series of daily weather. The Weather Generator is a model which, after calibrating site parameters with observed weather data at that site, is capable of simulating synthetic time series of daily weather that are statistically similar to observed weather [50]. LARS-WG incorporates projections from 15 GCMs, as used in the Intergovernmental Panel on Climate Change (IPCC) Assessment Report IV, and climate projections are available for the Special Report on Emissions Scenarios (SRES)—SRB1, SRA1B and SRA2 for most of the 15 GCMs [51]. The IPCC’s latest Assessment report V categorized future projections defined by Representative Concentration Pathways (RCPs) which is based on different 21st century pathways of greenhouse gases (GHG) emissions and atmospheric concentrations, air pollutant emissions and land use. It includes a stringent mitigation scenario (RCP2.6) which keeps global warming likely below 2 °C above pre-industrial temperatures, two intermediate scenarios (RCP4.5 and RCP6.0) and one scenario with very high GHG emissions (RCP8.5) [52]. This study is based on analysis and modelling scenarios based on earlier IPCC Assessment report IV—Special Report on Emission Scenarios (SRES). The Assessment report IV categorized the scenarios of future climate based on carbon emission levels and climate policy. The future scenarios can be summarized into four storylines: A1, A2, B1 and B2, where the A2 family is the most extreme scenario owing to its higher amount of carbon emission [53]. In terms of overall forcing, RCP8.5 is broadly comparable to the SRES A2/A1FI scenario, RCP6.0 to B2 and RCP4.5 to B1 [52].
Although it is common practice to downscale the results from GCMs or RCMs to urban scales, and despite considerable improvements in computational power in recent years, climate models still remain relatively coarse in space and temporal resolution, and are unable to resolve significant features at the finer scales of urban drainage systems (see [43,54]). In most places, there are numerous rain gauges that have been in operation for several decades, but most of them measure daily rainfall while recordings at hourly or sub-hourly data are not so common. Any hydrological study requires rainfall data at different time scales, depending on the purpose. The studies of water supply and irrigation require data on a monthly time scale, while studies on rainwater harvesting and river flow estimation require data on a daily time scale. However, for urban drainage and pluvial flood studies, it is necessary to have the rainfall data on sub-daily time scales as hydrological processes in urban drainage systems and small catchments occur at moderately smaller spatial and temporal scales [55]. Hydrological study in a small urban catchment may require rainfall data at spatial and temporal resolution of 1 km2 and 5 min respectively. One of the reasons for the lack of availability of high temporal scale rainfall data is the cost associated with collection of such data. Due to this explicit requirement of small scale and short duration rainfall, studies dealing with climate change impacts on urban drainage are particularly challenging [56]. The disaggregation of available coarse rainfall data to a small duration can be one way to address this limitation. Koutsoyiannis [57] developed a method to utilize the available daily rainfall data and disaggregate it to hourly scale. Furthermore, numerous disaggregation models have been developed to disaggregate monthly data to daily scale for a single site stations [57].
Stochastic disaggregation models for rainfall disaggregation can be divided into two categories: first is the point process theory based on Bartlett–Lewis and Neyman–Scott rectangular pulses; the second is the scale invariance theory of cascade, fractal and multifractal approaches [58]. Most of the disaggregation techniques developed before 2001 are essentially single site techniques. However, while multiple site rainfall disaggregation (as a means of simultaneous spatial and temporal disaggregation) is of a significant interest to many researchers, this technique comes with issues such as increased mathematical complexity when compared to a single site disaggregation [57]. Koutsoyiannis and Onof [59] addressed the problem of single site rainfall disaggregation to a fine scale (of up to 1 h) by developing a stochastic model based on the Bartlett–Lewis rainfall model referred to as Hyetos. Kossieris et al. [60] developed the improved version of Hyetos (Version 2.0) for its application to sub-hourly time scales. In the present paper, we discuss the results obtained from the Hyetos application (Version 0.3, developed by Koutsoyiannis and Onof, in Imperial College London) for continuous series hourly rainfall generation from daily observed and downscaled future data.
An example of applying downscaled data for IDF generation is given in the study by Liew et al. [61] who developed present and future IDF curves for the cities of Singapore, Kuala Lumpur and Jakarta. Since the data required were scarce, dynamic downscaling using RCM, the Weather Research and Forecasting (WRF) model and 1957 to 2002 dataset from ERA-40 (European Centre for Medium range Weather Forecasting) were used. The results from their study showed significant underestimation of rainfall intensities in WRF-ERA-40 generated data. Bias correction was applied for downscaled future data from 2071 to 2100. The study concluded that there is a general increment in rainfall intensities throughout the future period. The study applied linear adjustment of the IDF curve to correct biases from the model’s results. The application of linear adjustments is relevant when the duration considered is at coarse scales: for instance, from 6 h to 24 h, the curve will be of a linear nature. However, the mathematical representation of IDFs for shorter duration rainfall requires higher order equations. One of the challenges in urban drainage modelling is that IDFs with very short duration are required owing to the corresponding time of concentration within the catchment. As collecting continuous short duration climate variables requires significant resources, projections of future climate variables using climate downscaling techniques is insufficient as output is generally on daily scale. To generate future IDFs for urban hydrological studies, such coarse rainfall data requires disaggregation to a finer scale.
An approach developed based on spatial downscaling-temporal disaggregation (DDM) is presented in the following sections of this paper and its usefulness is demonstrated on the case study of Bangkok, Thailand.

3. Case Study Area

Bangkok, the capital and commercial hub of Thailand, is one of the highly urbanized cities in Southeast Asia. The selected Bangkok metropolis rainfall station is located in Sukhumvit area, which is in the central part of Bangkok metropolis (Figure 1). Sukhumvit area is surrounded by major canals on the eastern and northern sides which connects to Chao Phraya River on the southern side. The geographical location of the study catchment is 13°44′18.01″ N latitudes and 100°33′41.31″ E longitude. The area is flat, with an average altitude of 0.4 m to 1 m above mean sea level. The climate is tropical wet and dry with long hours of sunshine, fairly high temperatures year-round and high humidity. The rainy season is observed in mid-May which continues until October. The average minimum temperature is approximately 20 °C which occurs during November–February and maximum temperature could reach up to 35 °C during March–June. Bangkok receives an average annual rainfall of 1500 mm and is influenced by seasonal monsoons. The drainage outlets from the Sukhumvit catchment area are connected to canals which discharge further into the Chao Phraya River. The time of concentration in the urban catchment of Sukhumvit area was observed to be 2.5 h (see [62]). Bangkok suffered from severe floods in 1942, 1983, 1995 and 2011. The flood event in 2011 was the worst flood event in Thailand over the past 50 years. Climate risks from flooding and potential sea level rise are causing Bangkok to be one of the most vulnerable coastal cities in the world [63]. The temperature and precipitation in dense urban parts of Bangkok are expected to increase in the future [64], with increase in the extent of flood prone areas and flood volume [65].

4. Methodology

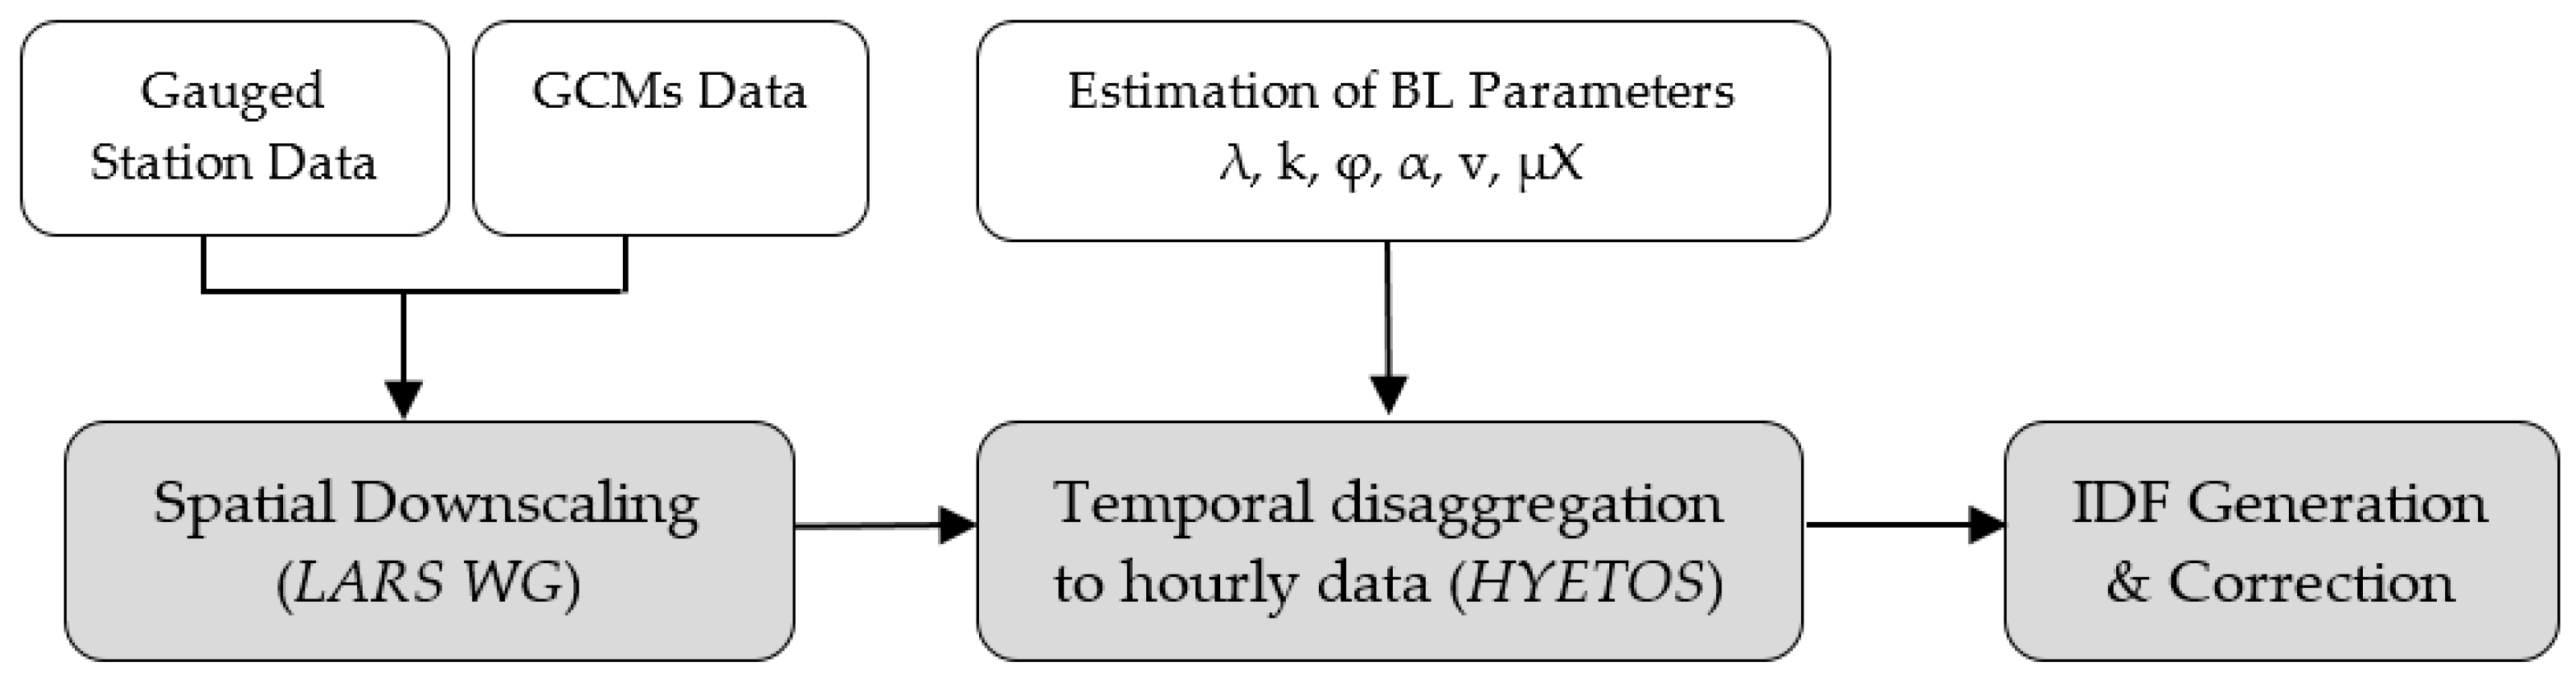
4.1. Methodological Framework for the Spatial Downscaling-Temporal Disaggregation Method (DDM) Approach

To produce future IDF curves for Bangkok a methodological framework was developed (Figure 2). This framework consists of three parts: spatial downscaling of rainfall obtained from GCMs, temporal disaggregation of daily rainfall series into hourly series and the application of generalized extreme value (GEV) distribution with annual maximum series to generate IDF curves for the present and the future.
The rainfall data of 3 h and 24 h, from 1981 to 2010 were acquired from the Bangkok metropolis rainfall station of Thai Meteorological Department. These data were utilized for the present IDFs generation, estimation of Bartlett–Lewis Rectangular Pulse (BLRP) parameters, and inputs for LARS-WG and Hyetos. Each of the methodological details is described in the following Section 4.2, Section 4.3 and Section 4.4.

4.2. Spatial Downscaling Using Long Ashton Research Station Weather Generator (LARS-WG)

LARS-WG uses a semi-empirical distribution (SED), the cumulative probability distribution function (PDF) with 23 intervals, to approximate probability distributions of dry and wet series of daily precipitation in each month [51]. The semi-empirical distribution Emp = { a 0 , a i ;   h i ,   i = 1 , ,   10 } is a histogram with 10 intervals, [ a i 1 ,   a i ] where a i 1 < a i , and h i denotes the number of events from the observed data in the i-th interval. Each interval contains a number of events based on the observed data. For each climatic variable v, a value of a climatic variable v i corresponding to the probability p i is calculated as [51]:
v i = min { v : P ( v o b s   v ) p i }   i = 0 ,   .. ,   n
where P() denotes probability based on observed data { v o b s }, p 0 = 0 and p n = 1 and these are fixed parameters with corresponding values of v 0 = min{ v o b s } and v n = max{ v o b s }. The simulation of precipitation occurrence is modeled as alternate wet (precipitation > 0.0 mm) and dry series. The length of each series is chosen randomly from the wet or dry semi-empirical distribution for the month in which the series start. For a wet day, the precipitation value is generated from the semi-empirical precipitation distribution for the particular month, independent of the length of the wet series or the amount of precipitation on previous days. The methodology for spatial downscaling using LARS-WG to generate future climate variables includes three major steps: site analysis, calibration i.e. comparison of the statistical properties of the synthetic data with observed data; and generation of climate data. First, an analysis of the observed weather parameters such as temperature, rainfall and solar radiation was done and second, the synthetic daily weather data are generated utilizing these weather parameters. Site analysis involved the LARS-WG model calibration process, which is done to determine the statistical characteristics of the observed data. The synthetic weather of similar time period as observed data is generated using the parameter file derived during the model calibration step, to validate the model. The statistical characteristics determined from the observed weather data are used to generate synthetic weather data, which have the same statistical properties as observed weather. Climate data are generated based on site parameters and climate scenarios from GCMs of interest. A scenario file is required for this process which can be manually edited and prepared or can be derived automatically from GCMs’ data in grid. The latest version of the stochastic weather generator was developed as LARS-WG 5.0, which is able to generate high resolution climate change scenarios over a region using direct outputs from GCMs. LARS-WG incorporates predictions from 15 GCMs, namely BCM2, CGMR, CNCM3, CSMK3, FGOALS, GFCM21, GIAOM, HADCM3, HADGEM, INCM3, IPCM4, MIHR, MPEH5, NCCCSM and NCPCM; and climate predictions are available for IPCC Assessment Report IV’s SRES emissions scenarios SRB1, SRA1B and SRA2 for most of the GCMs (see [51]). In this study, two scenarios, SRA1B and SRA2, were considered and future projections of these scenarios are available from 9 GCMs, namely, CNCM3, GFCM21, HADCM3, HADGEM, INCM3, IPCM4, MPEH5, NCCCSM and NCPCM (Table 1).

4.3. Disaggregation to Hourly Time Scale Using Hyetos

Hyetos is based on the Bartlett–Lewis Rectangular Pulse (BLRP) process theory which has been developed into a computer program and it is a proven disaggregation technique which adjusts finer scale data in order to obtain the coarser scale data without affecting stochastic structure by the model (see [57]). The general assumptions of the model are: storm origins occur following a Poisson process (rate lambda-λ), origins of cells of each storm arrive following a Poisson process (rate Beta-β), arrivals of each storm terminate after a time exponentially distributed (parameter gamma-γ), each cell has a duration exponentially distributed (parameter eta-η), and each cell has a uniform intensity with a specified (exponential or gamma) distribution. The parameter η is randomly varied from storm to storm with a gamma distribution with a shape parameter alpha-α and a scale parameter v. Subsequently, parameters β and γ also vary such that the ratios k = β/η and φ = γ/η stay constant. The distribution of uniform intensity Xij is typically assumed to be exponential with the parameter 1/μX. Alternatively, two-parameter gamma can be assumed with mean μX and standard deviation σX. The relationship for mean, variance, lag 1 autocovariance and proportion of dry periods, depending upon these variables of the Bartlett–Lewis parameters at the particular time had been derived into equations as presented in [57]. Hyetos adopts the Bartlett–Lewis model for the generation of synthetic rainfall along with an adjusting procedure to preserve consistency with observed daily data. For a sequence of wet days, model runs several times and generates a sequence that best matches with the observed daily data. The sequence of synthetic hourly rainfall is modified according to the proportional adjusting procedure, which aggregates to daily data, such that certain statistics are preserved among daily and hourly data [60]. In addition to adjusting procedure, the model uses repetition to ensure similarity in observed and modelled data. For the longer series, the model divides the wet series into independent cluster separated by at least one day, which reduces the computational time. The model runs separately for each wet cluster series, until the departures of the sequence of daily sums from the given sequence of daily rainfall becomes lower than an acceptable limit. For the sequence of L wet days generated, the daily rainfall depths are calculated and compared with the observed ones by logarithmic distance, which is mathematically given as [59]:
d = [ i = 1 L ln 2 ( Z i + c Z ˜ i + c ) ] 1 / 2
where Z i and Z ˜ i are observed and generated daily rainfall depth of day i of wet day sequence, respectively, and c is constant (=0.1 mm). The model verifies if departure d is smaller than acceptable limit da, which continues for the allowed number of repetitions and if the condition is not satisfied, the cell is discarded and new one is generated.

4.4. Intensity–Duration–Frequency (IDF) Generation and Correction

There are different distribution functions for IDF analysis: Extreme Value Type I, i.e., Gumbel (EVI) distribution, Generalized extreme value (GEV) distribution, Gamma distribution, Log Pearson III distribution, Lognormal distribution, Exponential distribution, and Pareto distribution. Gumbel distribution function (see for example, [36]) and GEV distribution (see [42]) are the most commonly used function for IDF analysis. In this present work, the annual maximum series from observed rainfall data (1981–2010) were fitted into GEV, Log Pearson III, Lognormal, Gamma and Gumbel distributions using method of moments and L-moments. The mathematical expression for GEV probability distribution is given by,
F ( x ) = exp ( 1 k   x μ σ ) 1 / k
where k (shape parameter), σ (scale parameter, σ > 0) and µ (location parameter) are to be determined. For k = 0, GEV reduces to Gumbel (EVI) distribution and for k < 0, it reduces to Extreme Value Type II distribution, which implies an upper bound of the variable, which is not the case in maximum rainfall intensity [36].
The method of moments, first developed by Karl Pearson in 1902, considers that the good estimates of the parameters of a probability distribution are those for which moments of the probability density function about the origin are equal to the corresponding moments of the sample data [66]. L-moments are the improvement over the conventional moments, which has major advantage, being linear functions of the data, suffer less from the effects of sampling variability and are more robust than conventional moments to outliers in the data. It is also less subjected to bias in estimation and enable more secure inferences to be made from small samples about an underlying probability distribution [67]. Let X 1 : n     X 2 : n   ≤ … ≤   X n : n be an order statistics of the random sample of size n from distribution X, and X is the real valued random variable with cumulative distribution function F(x), the L-moments can be estimated by,
λ r = r 1 k = 0 r 1 ( 1 ) k ( r 1 k )   E X r k : r  
r = 1, 2, …, where the expectation of an order statistic can be expressed as,
E X j : r = r ! ( j 1 ) ! ( r j ) !   x { F ( x ) } j 1 { 1 F ( x ) } r j   dF ( x )
For the details of L-moments and parameters for different probability distributions, readers are referred to Hosking and Wallis [68].
For the selection of distribution functions, the goodness of fit of the probability distributions are carried out by comparative test of theoretical and sample values of the relative frequency or the cumulative frequency function, using Kolmogorov–Smirnov (K-S) test and Chi-Squared test to determine if the annual maximum rainfall data follow the specified distribution. The K-S test is based on the largest vertical difference between the theoretical and the empirical cumulative distribution function. For the given sample size of x 1 , ... ,   x n , of the distribution with cumulative distribution function (CDF) F(x), the K-S test statistic is expressed as,
D = max 1 i n ( F ( x i ) i 1 n ,   i n   F ( x i ) )
The Chi-squared test statistics is defined as,
χ 2 =   i = 1 k ( Observed i Expected i ) 2 Expected i
where Observed i is observed number of occurrence in interval i, Expected i = F ( x 2 ) F ( x 1 ) is the corresponding expected number of occurrences in interval i, F is the cumulative distribution function being tested and k = 1 + log 2   N ( sample   size ) . The p-value from the goodness of fit tests are calculated based on test statistics of each fitted distribution, which compares the suitability of each distribution. Finally, the graphical comparison of IDFs from observed and disaggregated data and the corrections carried out using suitable equation in this study are discussed in Section 5.

5. Results and Discussion

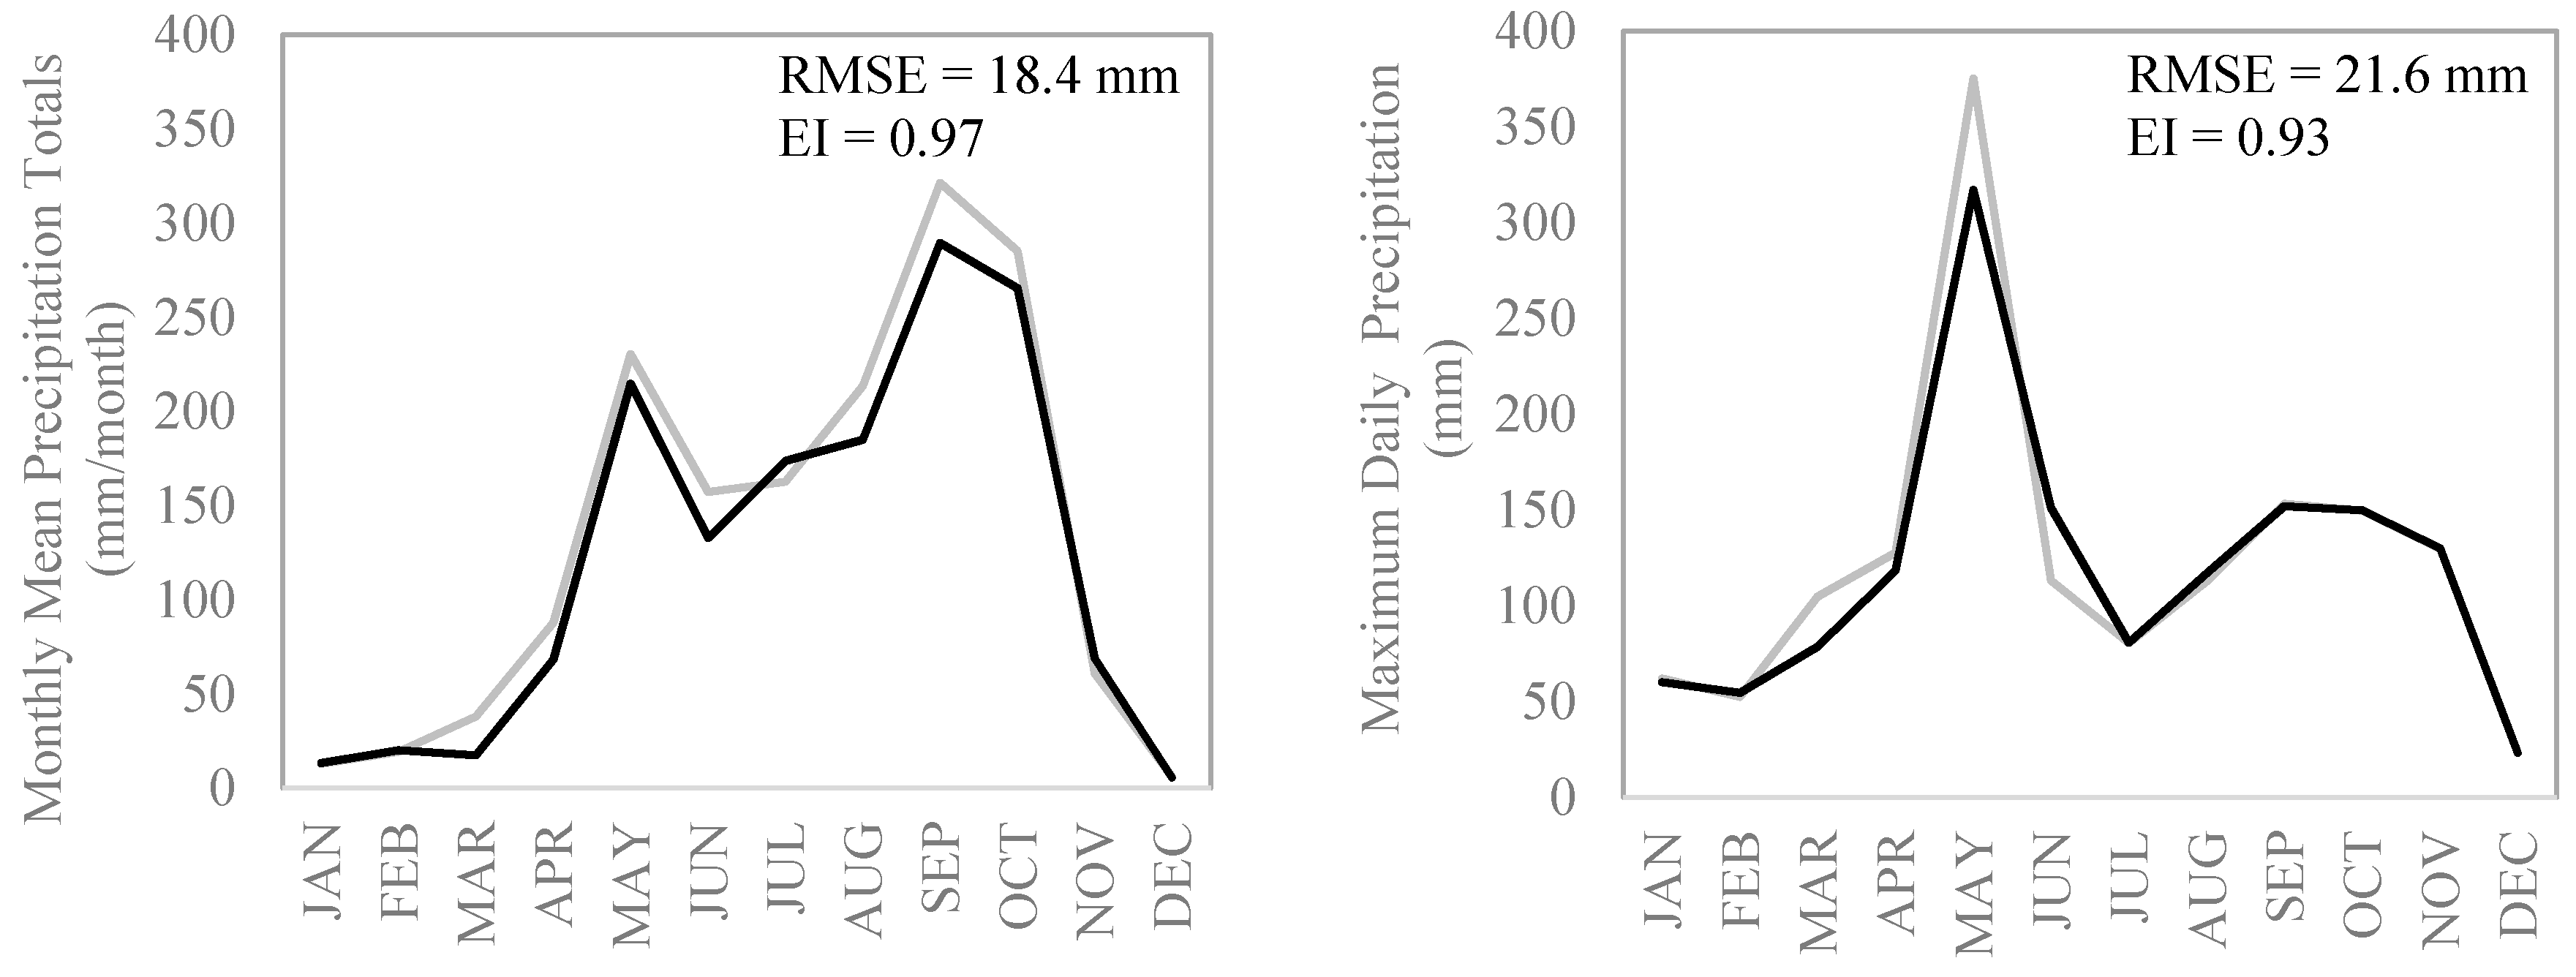
5.1. Spatial Downscaling

In this study, the observed precipitation data were analysed to determine their statistical characteristics and to compute site parameters. Weather generation was done for 1981–2010. The total monthly mean rainfall and maximum daily rainfall for each month were selected as statistics for comparing observed and generated data (Figure 3).
The Root Mean Square Errors (RMSE) and Efficiency Index (EI) have been used as standard metrics to show that the model is capable of reproducing past rainfall. RMSE and EI are mathematically expressed as:
RMSE = 1 n i = 1 n ( X i Y i ) 2
EI = i = 1 n ( X i X ¯ ) 2 i = 1 n ( X i Y i ) 2 i = 1 n ( X i X ¯ ) 2
X ¯ = 1 n i = 1 n X i
where X i is observed data at time i, X ¯ is mean of observed data, Y i is synthetic data at time i and n is the total number of data points. The RMSE for both mean and maxima are in acceptable range and further EI are over 90%. Developing a set of IDFs generally depends on extreme rainfall and the LARS-WG results showed its ability to project extreme rainfall as close to the observed rainfall maxima, hence, LARS-WG was used for future downscaling of climate variable (i.e., rainfall series). The above-mentioned nine GCMs (in Section 4.4) (for SRA1B and SRA2) were used in the analysis to estimate range of likely changes in future IDFs.

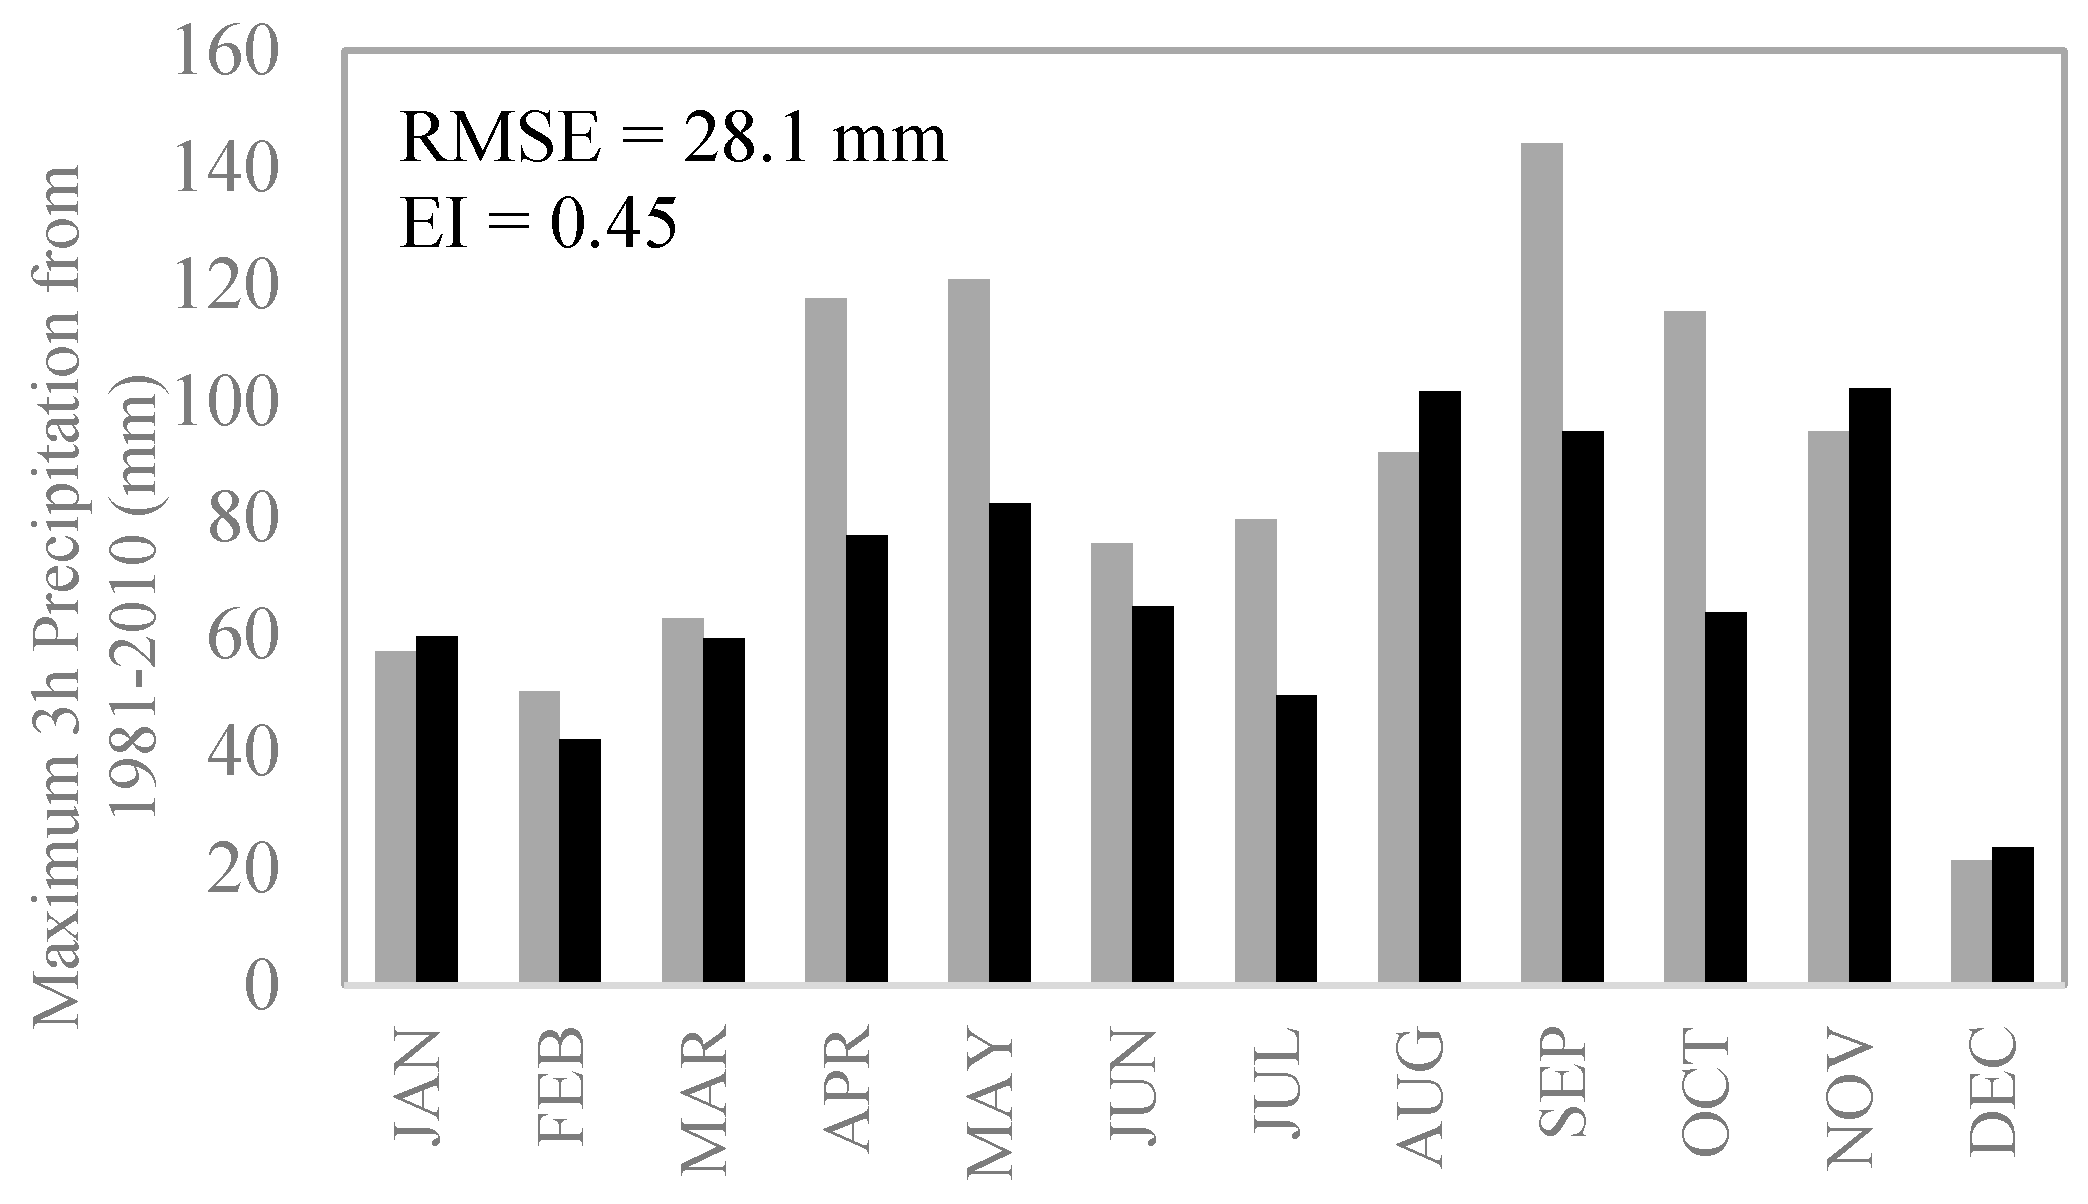
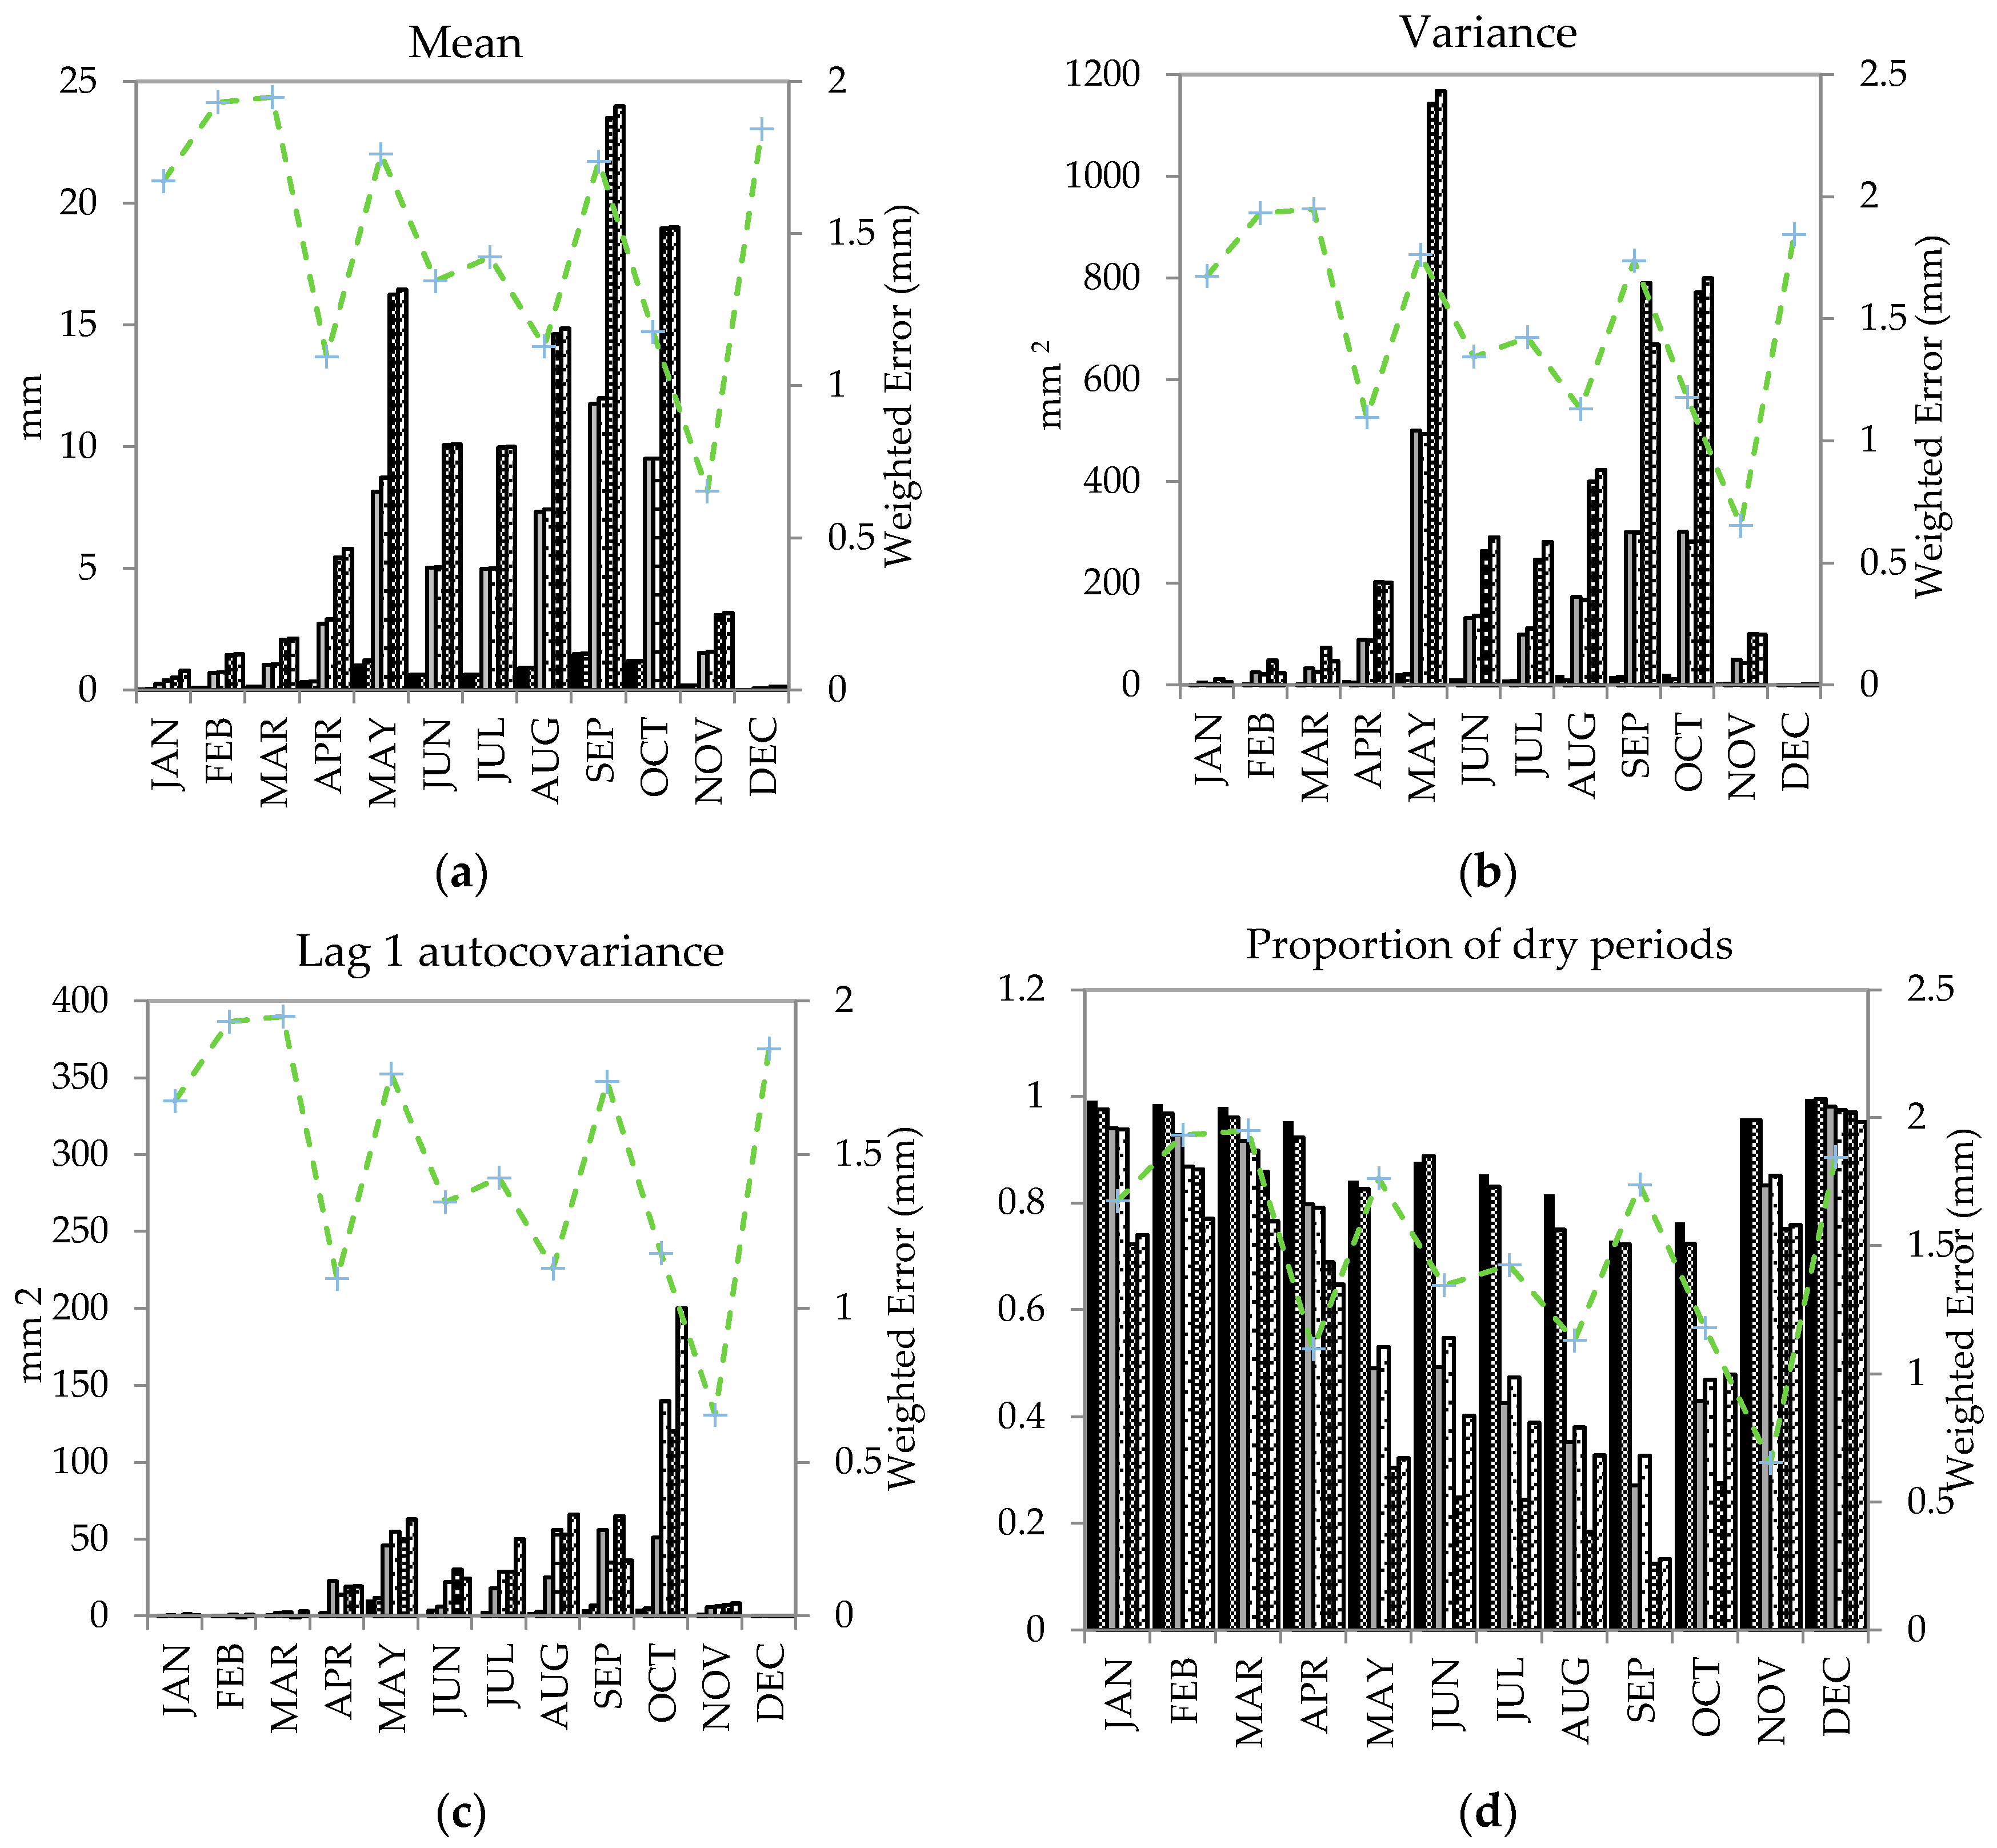
5.2. Temporal Disaggregation

The method follows the assumption of the BLRP process that can be derived into expressions defined by parameters—λ, k, φ, α, v, μX and σX—which mathematically elucidate the rainfall event (see also, [57,59]). The method aims to preserve statistical characteristics such as mean, variance, lag 1 autocovariance and proportion of dry periods of observed time series with the synthetically generated disaggregated time series. The estimation of the BLRP parameters was done by calculating these statistical characteristics from the observed 3 h, 12 h and 24 h data from 1986 to 2000 for each month, separately (Figure 4). A period between 1986 and 2000 was selected for the analysis since maximum daily rainfall occurred in the same period. The parameters λ, k, φ, α, v, μX and σX were optimized to minimize relative error between synthetic and observed values. The synthetic rainfall generated preserves the statistical properties of observed rainfall series.
Optimization of the variables to minimize weighted error between synthetic and historical observed data is shown in Figure 4. The overall error in simulating disaggregated data is below 2 mm for 3 h, 12 h and 24 h, with satisfactory optimization of mean, variance, lag 1 autocovariance and proportion of dry periods. The optimized parameters for each month (Table 2) were used to disaggregate present observed data and future downscaled daily data. The same parameters have been used for past and future disaggregations.
The maximum 3 h precipitation for each month is compared between disaggregated and observed data for the period 1981–2010 (Figure 5). The disaggregated data indicated under prediction, especially in the months of April, May, September and October.

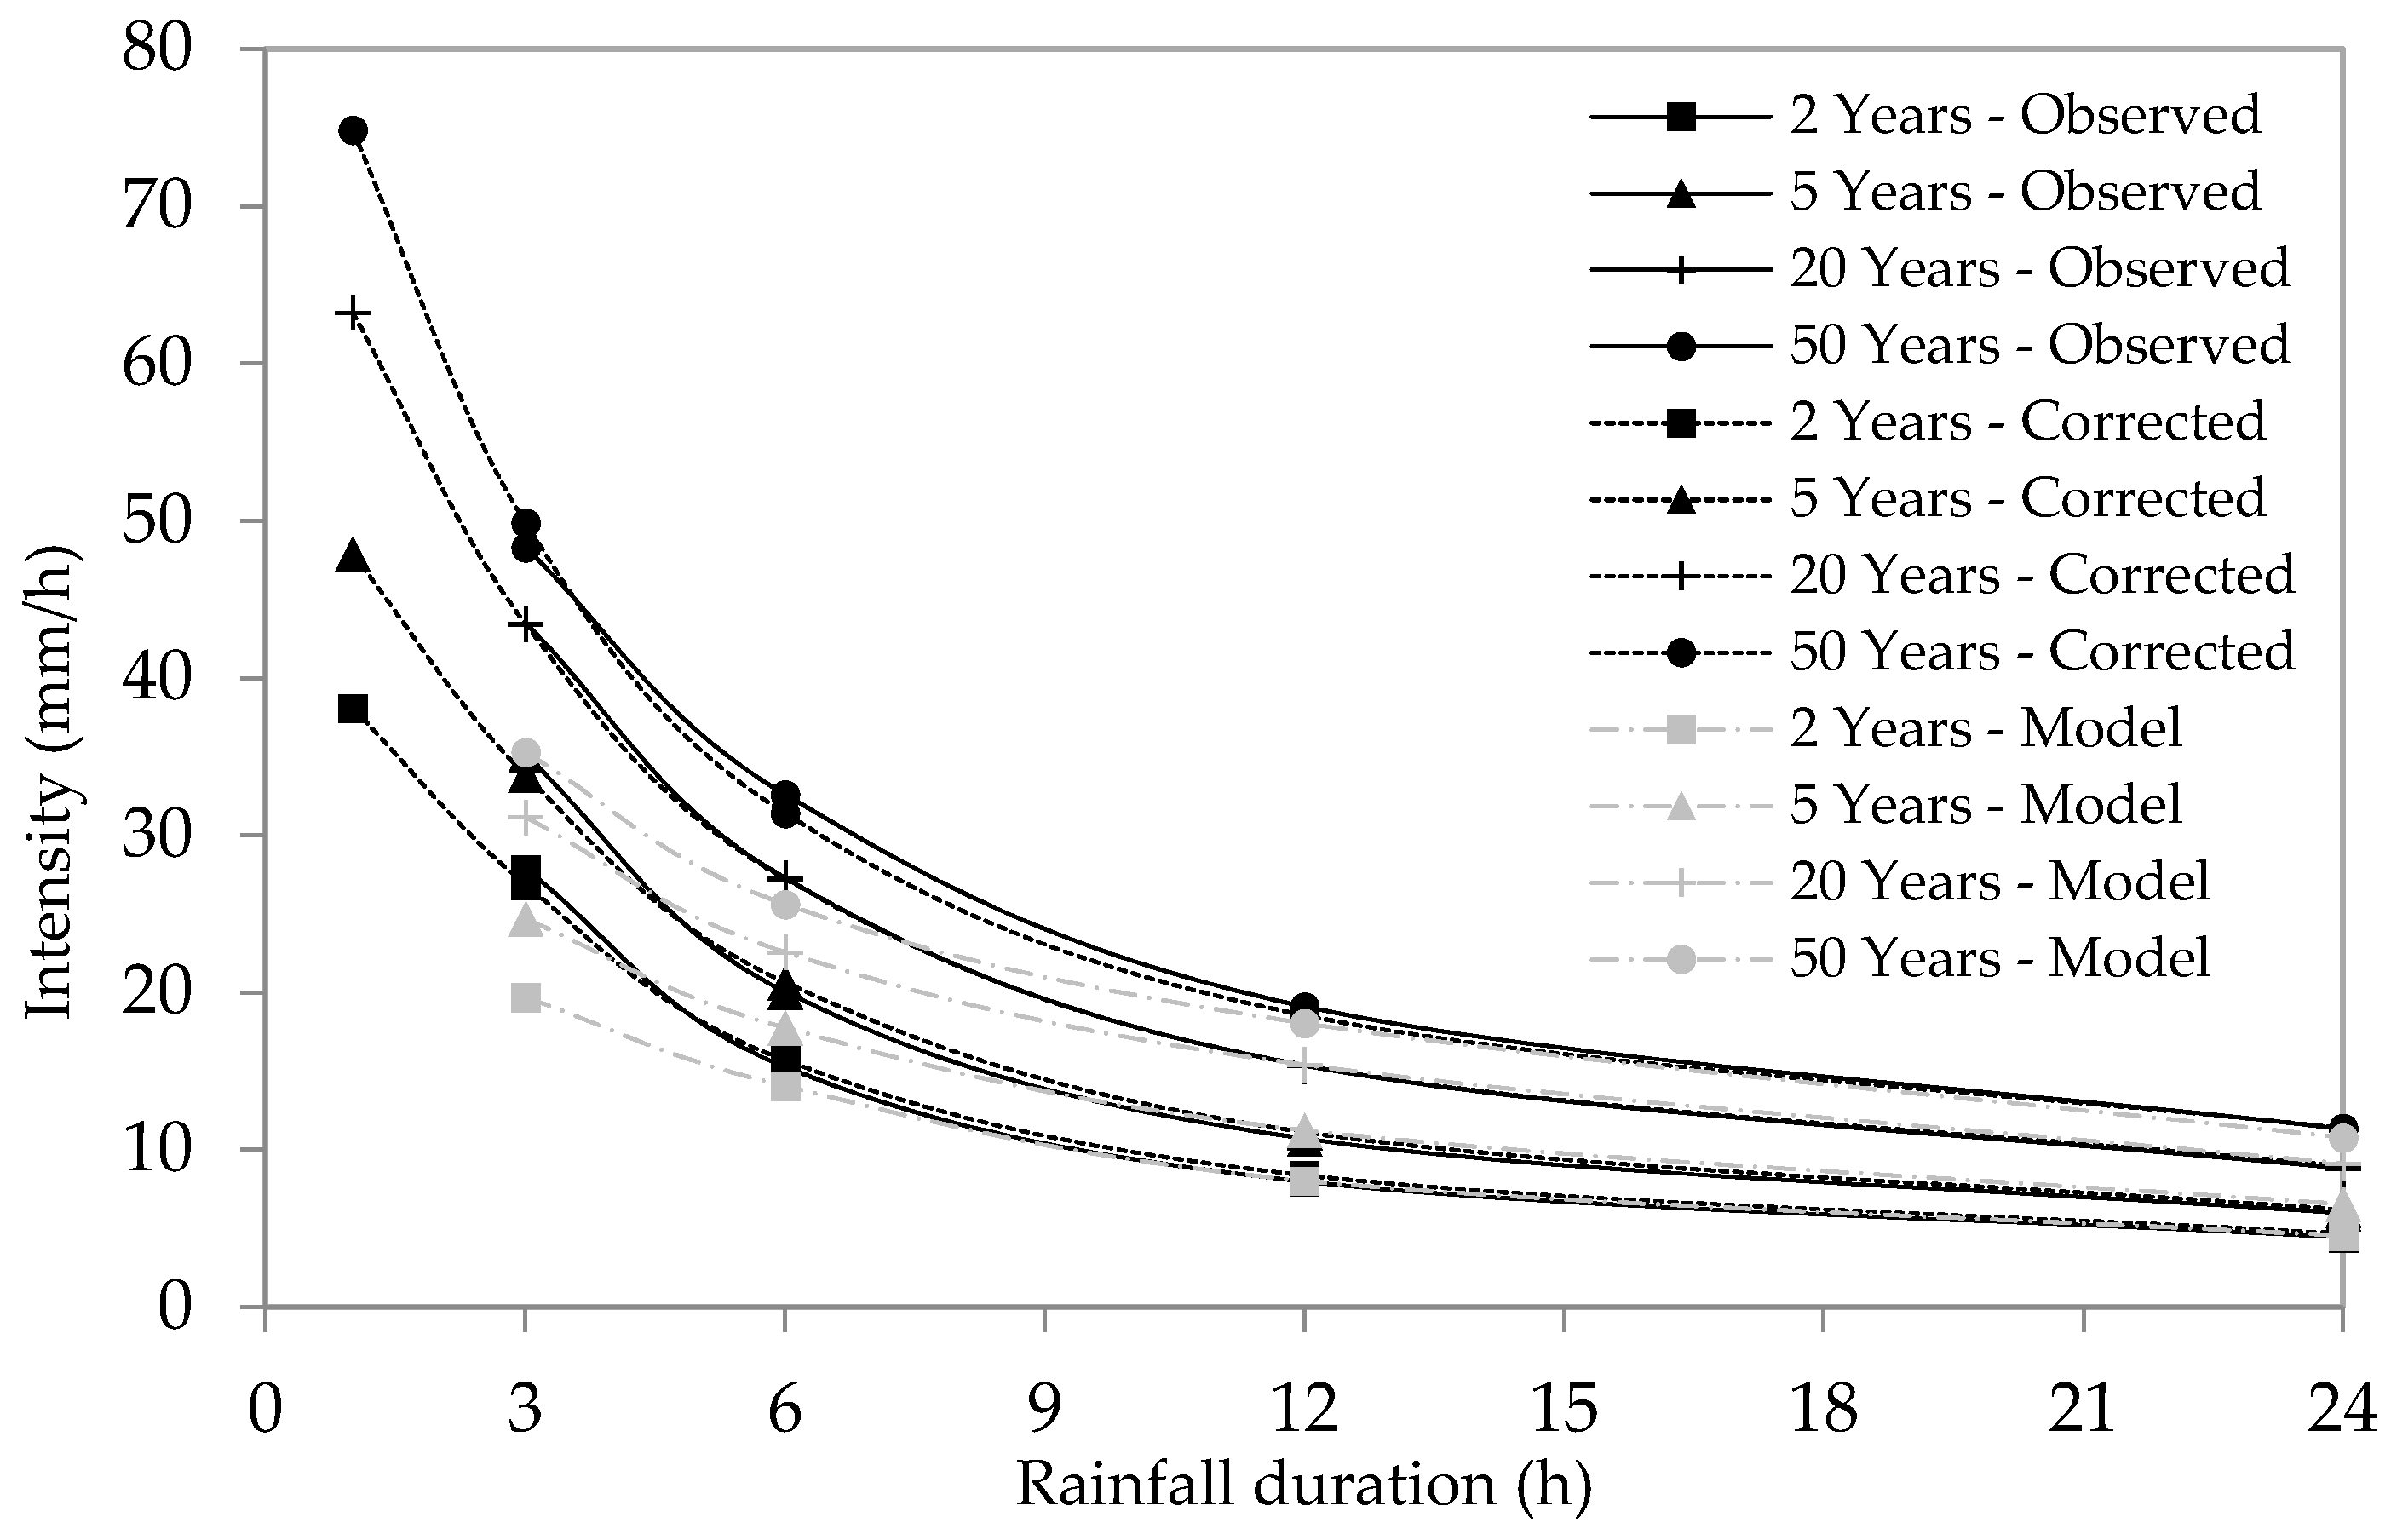
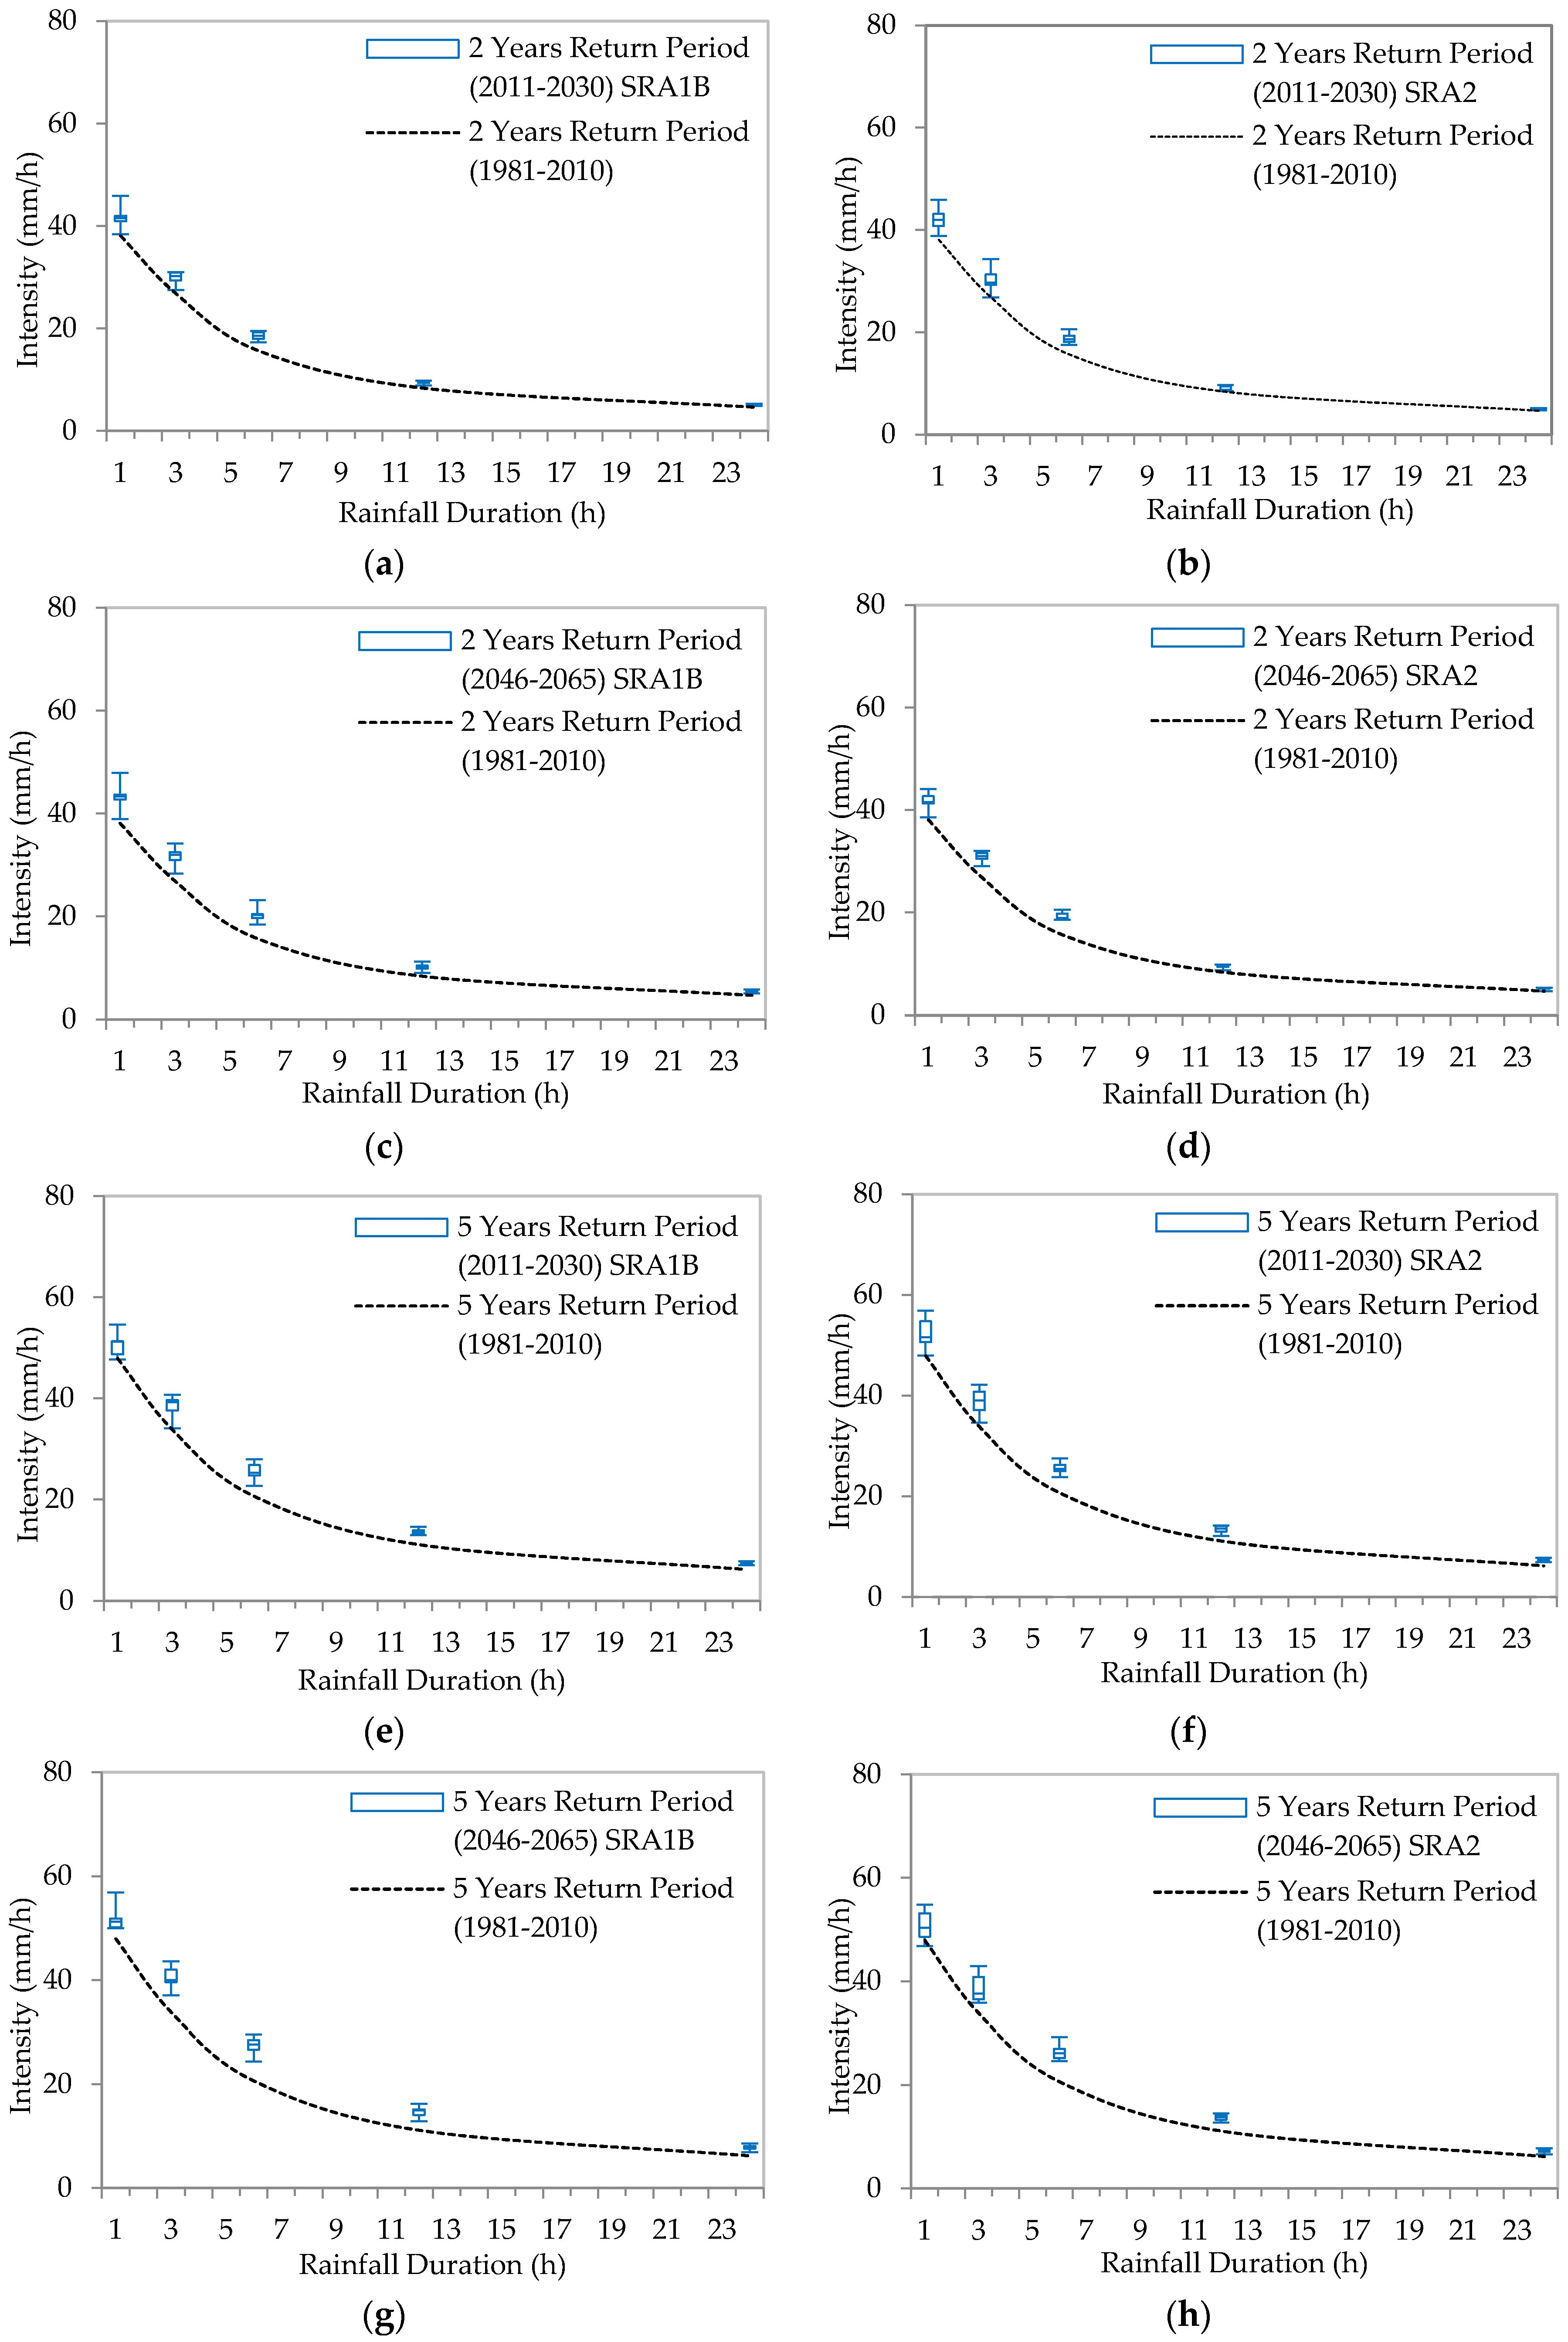
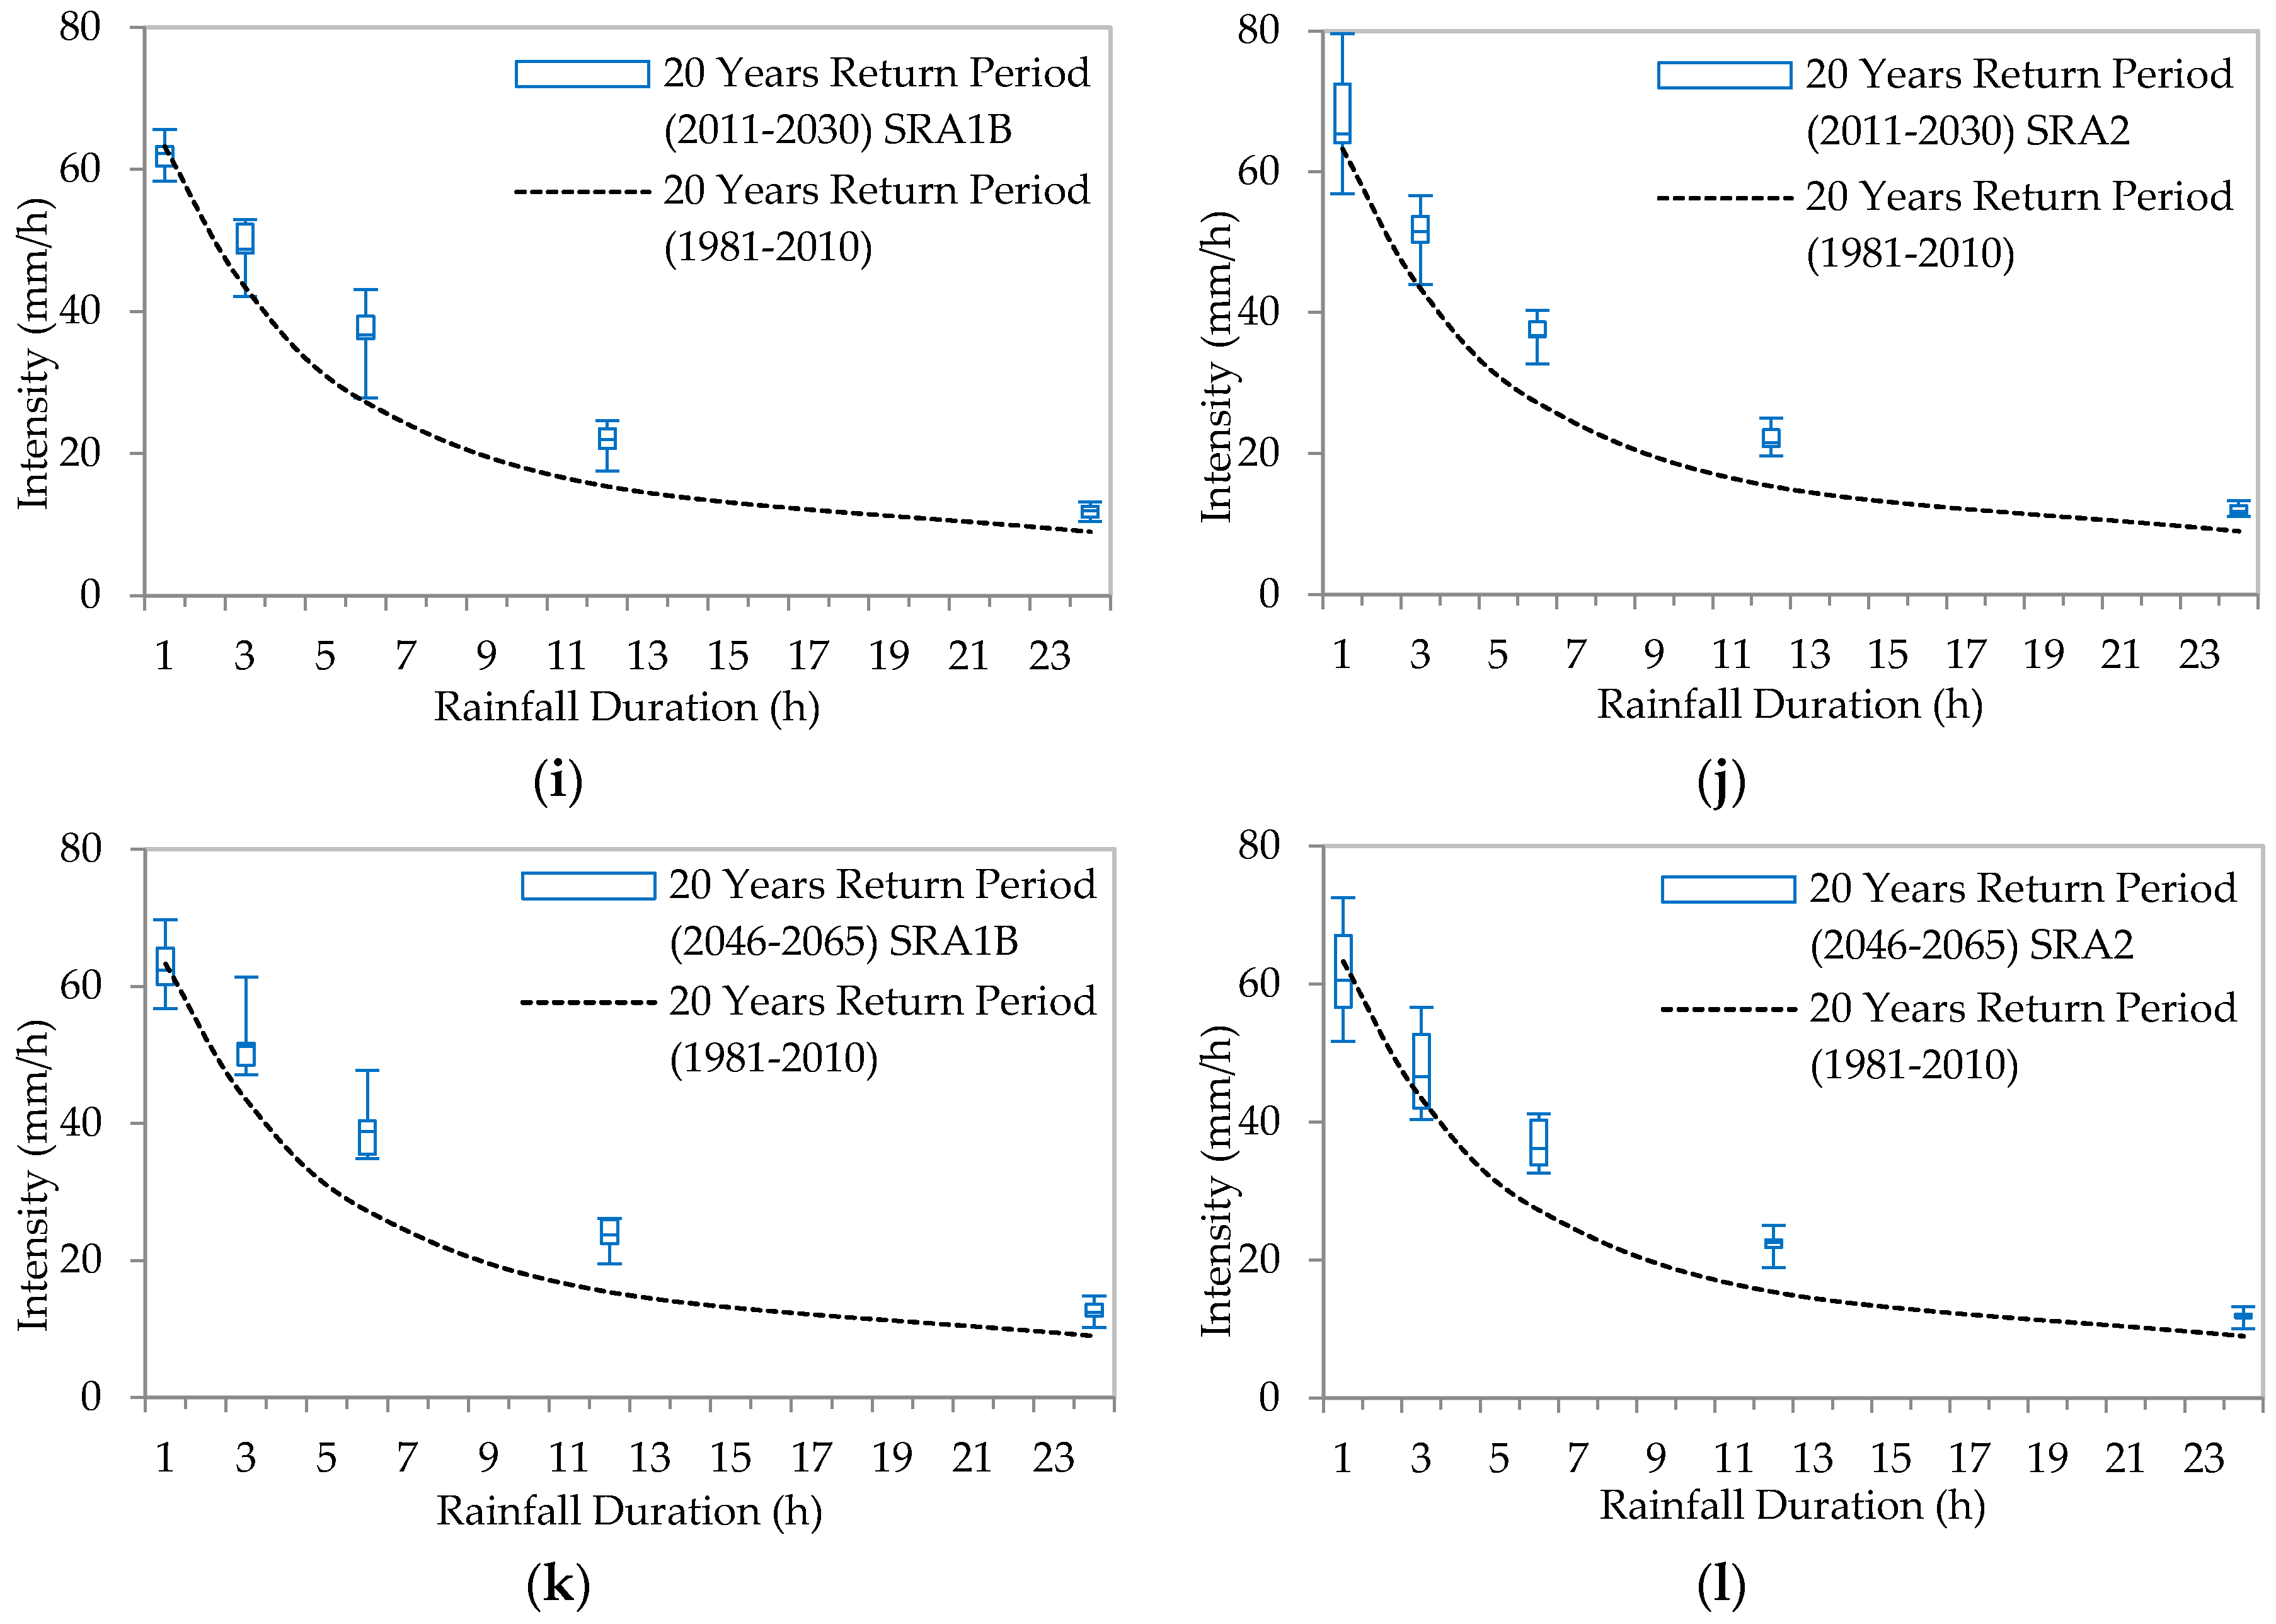
5.3. Generation of IDF Curves

The annual maximum rainfalls at different durations from 1981 to 2010 were fitted into Generalized extreme value (GEV) distribution, Gamma distribution, Gumbel distribution, Log Pearson III distribution and Lognormal distribution. The goodness of fit test (Table 3) using Kolgomorov-Smirnov (K-S) test showed that GEV distribution fits better for annual maximum rainfall at 3 h, 6 h and 24 h durations, while for 12 h duration Log normal distribution fits better, although GEV also fits as closely to Log normal distribution. The Chi-squared (χ2) test results showed GEV fits better for annual maximum rainfall at 12 h and 24 h durations, while GEV and Gamma distribution fits better at 3 h duration and Gumbel distribution fits better at 6 h duration. In overall comparison, GEV seemed to fit better than other distribution so we have considered GEV distribution to generate present and future IDFs. The future annual maximum rainfall for 2011–2030 and 2046–2065 at different rainfall durations of 1 h, 3 h, 6 h, 12 h and 24 h also fit well with GEV distribution, the distribution analysis for future are not shown here due to brevity of the paper. Table 3 also shows the comparison of rainfall intensities at 2-, 5- and 20-years return periods when annual maximum rainfalls are fitted into different distribution. The result showed minimal differences in the rainfall intensities. The standard deviation of rainfall intensities however increases accordingly to higher return periods.
For the comparison of disaggregated rainfall (daily to hourly) with the observed 3 h rainfall, the disaggregated 1 h data were aggregated to 3 h data, from 1981 to 2010, and IDFs were generated. The disaggregated data (i.e., modelled data) showed significant underestimation as compared to the observed data for the duration of 3 h; however, the underestimation was observed to be relatively lower for longer durations (Figure 6). Thus, the correction factors were used to correct the bias for modelled rainfall intensities (Table 4). The differences and ratios between observed and simulated intensities were found to be larger for shorter durations and smaller for durations of longer than 3 h. For all durations, the differences increased with return periods. Nevertheless, the ratio remained almost equal for different return periods for a specific duration of rainfall.
The average ratios of observed to modelled data at different rainfall duration were fitted into a power and polynomial equations and the resulting equations are the function of rainfall duration, which is independent from the return period (Figure 7). Coefficient of Determination (R2) for the fitted polynomial equation showed better accuracy than other equation. Using the equation,
y = 0.0017 x 2 0.0606 x + 1.5417
where y is the correction factor for a specific rainfall duration of x in hours, the downscaled-disaggregated IDFs were graphically corrected. IDFs generated from nine GCMs were corrected using the respective correction factors. The corrected IDFs for 1981–2010 are shown in Figure 6.
The downscaled and disaggregated outputs from nine GCMs under SRA1B and SRA2 scenarios were used to develop IDFs for future periods for a duration varying from 1 h to 24 h and return periods of 2 years, 5 years and 20 years. The return periods of 2 years, 5 years and 20 years are selected which are of practical relevance for design and operation of drainage systems. The comparisons of present and future IDF curves are shown in Figure 8.
Figure 8 presents the future IDFs projections shown by box and whiskers plot for three quartile regions, which is compared with baseline (1981–2010) and Table 5 shows the detail changes in future intensities compared to baseline period. Comparison of present and future IDFs for return periods (2-, 5- and 20-years), showed that intensities increases under climate change at most of the rainfall durations. In comparison to the rainfall intensities the uncertainties among GCMs are found to be higher for smaller duration, which then increases with higher return periods. Even the median of the projected nine GCMs data showed the increases in future rainfall intensities when compared to the present IDFs, in all durations except for 1 h duration in 20 years return period. The maximum projected by some GCMs shows future rainfall intensity increments also in 1 h, while even minimum projected by some GCMs is higher than the present scenario, except at smaller durations in 20 years return period. There is no significant difference among the results from SRA1B and SRA2 scenarios in 2- and 5-years return periods, while SRA2 showed maximum increments in 20 years return period. It can be observed that few of the GCMs in 20 years return period at 1 h duration projected decrease in rainfall intensities. Compared to 1981–2010, during 2011–2030 in 20 years return period, the maximum decrease in 1 h rainfall intensities is projected by NCPCM in SRA1B (−7.8%) and GFCM21 in SRA2 (−10.1%). Similarly, for 2046–2065 in 20 years return period, the maximum decrease in 1 h rainfall intensities are projected by IMCM3 and HADGM3 in SRA1B (−10.2%) and HADGEM in SRA2 (−18.3%). The maximum increase in 1 h rainfall intensities during 2011–2030 are projected by NCCCSM in SRA1B (20.4%) and IMCM3 in SRA2 (20.4%) in 2 years return period, NCCCSM in SRA1B (13.9%) and INCM3 in SRA2 (18.7%) in 5 years return period, GFCM21 in SRA1B (3.7%) and NCCCSM in SRA2 (25.9%) in 20 years return period. The maximum increase in 1 h rainfall intensities during 2046–2065 are projected by NCCCSM in SRA1B (25.6%) and IMCM3 in SRA2 (15.7%) in 2 years return period, NCCCSM in SRA1B (18.7%) and HADCM3 in SRA2 (14.3%) in 5 years return period, IPCM4 in SRA1B (10.2%) and HADCM3 in SRA2 (14.5%) in 20 years return period. Besides, it is noticeable that all GCMs showed only positive increments in rainfall intensities for higher duration in all return periods and scenarios (Figure 8). This is possibly due to the limitation and potential biases in the methods in preserving extreme values of disaggregated data at finer scales and limitation of extrapolating correction factor to 1 h using fitted correction equation.
Since the time of concentration for the case study area is approximately 2.5 h, it becomes relevant to compare intensities/accumulated rainfall for 3 h, in the perspective of urban flood and urban drainage management (see [62]). In 2011–2030, the maximum 3 h rainfall increments are projected by HADCM3 and IMCM3 in SRA1B (15.4%) and NCPCM in SRA2 (27.8%) in 2 years return period, HADCM3 and IMCM3 in SRA1B (20.4%) and NCPCM in SRA2 (24.4%) in 5 years return period, HADCM3 and IMCM3 in SRA1B (21.9%) and HADCM3 in SRA2 (30.4%) in 20 years return period. In 2046–2065, the maximum 3 h rainfall intensities increments are projected by HADGEM in SRA1B (27.0%) and MPEH5 in SRA2 (19.1%) in 2 years return period, NCCCSM in SRA1B (28.8%) and GFCM21 in SRA2 (26.7%) in 5 years return period, IPCM4 in SRA1B (41.2%) and HADCM3 in SRA2 (30.4%) in 20 years return period (Table 5).
Figure 8 showed the range of uncertainty, through box and whisker plots, in agreement among GCMs outputs. By considering multiple GCMs and two future scenarios we quantified the range of future uncertainty. Again considering 3 h rainfall, the future rainfall intensities will increase compared to present condition by 2.4% to 27.8% in 2 years return period and 1.3% to 30.4% in 20 years return period during 2011–2030; and 5.4% to 27.0% in 2 years return period and 8.5% to 41.2% in 20 years return period during 2046–2065. These increments in future rainfall intensities will affect performance of urban drainage systems which increase further challenges in managing urban storm water in Bangkok. The GEV distribution fitted better for annual maximum series in all duration for present as well as future. A study using Gumbel distribution for same station [62], the results of the study which is not presented here showed similar behaviour from the selected GCMs, however with some changes in projected rainfall intensities. The selected future scenarios SRA1B and SRA2 represents medium to high greenhouse gases emission scenarios, and RCP8.5 is broadly comparable to SRA2. However, the individual GCMs outputs, in two scenarios, in term of fitted rainfall intensities showed no precise differences. The highest future increments in rainfall intensities were projected under SRA2 scenario in 2011–2030 and under SRA1B scenario in 2046–2065. The temporal disaggregation of daily to hourly rainfall series is important part of the DDM approach. One of the major advantage of using temporal disaggregation is its ability to support urban hydrological studies and its practical applications, using only short term higher resolution data together with fairly coarser resolution long term data that are available in most cities. The application of robust disaggregation techniques and analysis under newer future climate scenario will further improve this approach. The DDM approach is applicable and relevant to other urban catchments in different climatic conditions where availability of higher resolution data is constraint.

6. Conclusions

The present paper presents an approach based on spatial downscaling—temporal disaggregation method (DDM)—to develop future IDFs using stochastic weather generator, Long Ashton Research Station Weather Generator (LARS-WG) and the rainfall disaggregation tool, Hyetos. The work was carried out for the case of Bangkok, Thailand. The results obtained show that the DDM approach is capable of producing promising results that can be applied to other catchments. Downscaling with LARS-WG gave reasonable results in estimating extreme climate variable (i.e., rainfall series). The downscaled-disaggregated IDFs showed underestimation in intensities, especially for short durations; hence, it was found necessary to correct the bias in IDFs generation.
The results obtained show that IDFs for shorter durations, which exhibit non-linear properties compared to general IDF in higher durations (e.g., 12 h to 24 h) which exhibit linear properties, are corrected using higher order equation. With the availability of only 3 h interval observed rainfall data for the study, the correction factor for 1 h is extrapolated with the same equation. Nine GCMs were analysed which incorporate future projections in SRA1B and SRA2, and all of them projected higher intensities for durations from 3 h to 24 h. The few discrepancies at 1 h rainfall are due to limitations of spatial downscaling and temporal disaggregation method in preserving maxima. The overall findings indicate an increase in future rainfall for Bangkok region. Most of the rainfall stations globally lack long-term higher temporal resolution rainfall data for long periods while most GCMs outputs are in daily time scale. In places where such data availability is an issue, the DDM approach can provide quantified evidence of climate change implication on rainfall intensities. The short term sub-daily scale rainfall at the particular rainfall station or nearby stations is needed for generation of BLRP parameters using Hyetos. However, BLRP parameters will vary in relation to the location and nature of rainfall data. Our future research in this direction will focus on improving temporal disaggregation methods and achieving more robust outputs of future climate downscaling models in higher resolutions. We also intend to incorporate the subsequent IPCC emissions scenarios in our future research work.

Acknowledgments

This study was conducted as a part of the master thesis of the joint double degree program in Urban Water Engineering and Management, 2011–2013 at Asian Institute of Technology and UNESCO IHE Institute for Water Education. Sincere thanks are extended to the advisors and faculties of both the institutions.

Author Contributions

Ashish Shrestha conceived the research methodology, carried research and wrote the paper. Sutat Weesakul, Mukand Singh Babel and Zoran Vojinovic refined the ideas, supervised research experiments and data analysis, and contributed in finalizing this paper.

Conflicts of Interest

The authors declare no conflict of interest.

References

  1. Price, R.K.; Vojinovic, Z. Urban flood disaster management. Urban Water J. 2008, 5, 259–276. [Google Scholar] [CrossRef]
  2. Mynett, A.E.; Vojinovic, Z. Hydroinformatics in multi-colours—Part red: Urban flood and disaster management. J. Hydroinform. 2009, 11, 166–180. [Google Scholar] [CrossRef]
  3. Vojinovic, Z.; van Teeffelen, J. An integrated stormwater management approach for small islands in tropical climates. Urban Water J. 2007, 4, 211–231. [Google Scholar] [CrossRef]
  4. Aerts, J.; Botzen, W.; Bowman, M.; Dircke, P.; Ward, P. Climate Adaptation and Flood Risk in Coastal Cities; Routledge: London, UK, 2013. [Google Scholar]
  5. Vojinovic, Z.; Sanchez, A.; Barreto, W. Optimising sewer system rehabilitation strategies between flooding, overflow emissions and investment costs. In Proceedings of the 11th International Conference on Urban Drainage, Edinburgh, UK, 31 August–5 September 2008.
  6. Barreto, W.; Vojinovic, Z.; Price, R.; Solomatine, D. Multiobjective evolutionary approach to rehabilitation of urban drainage systems. J. Water Res. Plan. Manag. 2010, 136, 547–554. [Google Scholar] [CrossRef]
  7. Vojinovic, Z.; Solomatine, D.; Price, R.K. Dynamic least-cost optimization of wastewater system remedial works requirements. Water Sci. Technol. 2006, 54, 467–475. [Google Scholar] [CrossRef] [PubMed]
  8. Vojinovic, Z.; Sahlu, S.; Torres, A.S.; Seyoum, S.D.; Anvarifar, F.; Matungulu, H.; Barreto, W.; Savic, D.; Kapelan, Z. Multi-objective rehabilitation of urban drainage systems under uncertainties. J. Hydroinform. 2014, 16, 1044–1061. [Google Scholar] [CrossRef]
  9. Vojinovic, Z.; Hammond, M.; Golub, D.; Hirunsalee, S.; Weesakul, S.; Meesuk, V.; Medina, N.; Sanchez, A.; Kumara, S.; Abbott, M. Holistic approach to flood risk assessment in areas with cultural heritage: A practical application in Ayutthaya, Thailand. Nat. Hazards 2016, 81, 589–616. [Google Scholar] [CrossRef]
  10. Alves, A.; Sanchez, A.; Vojinovic, Z.; Seyoum, S.; Babel, M.; Brdjanovic, D. Evolutionary and holistic assessment of green-grey infrastructure for CSO reduction. Water 2016, 8, 402. [Google Scholar] [CrossRef]
  11. Abbott, M.B.; Vojinovic, Z. Applications of numerical modelling in hydroinformatics. J. Hydroinform. 2009, 11, 308–319. [Google Scholar] [CrossRef]
  12. Abbott, M.B.; Tumwesigye, B.M.; Vojinovic, Z. The fifth generation of modelling in Hydroinformatics. In Proceedings of the 7th International Conference on Hydroinformatics, Acropolis, Nice, France, 4–8 September 2006.
  13. Horritt, M.S.; Bates, P.D. Evaluation of 1D and 2D numerical models for predicting river flood inundation. J. Hydrol. 2002, 268, 87–99. [Google Scholar] [CrossRef]
  14. Hunter, N.M.; Bates, P.D.; Horritt, M.S.; Wilson, M.D. Simple spatially-distributed models for predicting flood inundation: A review. Geomorphology 2007, 90, 208–225. [Google Scholar] [CrossRef]
  15. Merz, B.; Thieken, A.H.; Gocht, M. Flood risk mapping at the local scale: Concepts and challenges. In Flood Risk Management in Europe; Begum, S., Stive, M.J.F., Hall, J.W., Eds.; Springer: Dordrecht, The Netherlands, 2007; pp. 231–251. [Google Scholar]
  16. Neal, J.; Villanueva, I.; Wright, N.; Willis, T.; Fewtrell, T.; Bates, P.D. How much physical complexity is needed to model flood inundation? Hydrol. Process. 2012, 26, 2264–2282. [Google Scholar] [CrossRef]
  17. Panayiotis, D.; Aristoteles, T.; Oikonomou, A.; Pagana, V.; Koukouvinos, A.; Mamassis, N.; Koutsoyiannis, D.; Efstratiadis, A. Comparative evaluation of 1D and quasi-2D hydraulic models based on benchmark and real-world applications for uncertainty assessment in flood mapping. J. Hydrol. 2016, 534, 478–492. [Google Scholar]
  18. Vojinovic, Z.; Bonillo, B.; Chitranjan, K.; Price, R. Modelling flow transitions at street junctions with 1D and 2D models. In Proceedings of the 7th International Conference on Hydroinformatics, Acropolis, Nice, France, 4–8 September 2006.
  19. Syme, W. Flooding in urban areas—2D modelling approaches for buildings and fences. In Proceedings of the 9th National Conference on Hydraulics in Water Engineering, Darwin Convention Centre, Darwin City, Australia, 23–26 September 2008.
  20. Abdullah, A.; Rahman, A.; Vojinovic, Z. LiDAR filtering algorithms for urban flood application: Review on current algorithms and filters test. In Proceedings of the Laserscanning09, Paris, France, 1–2 September 2009; Volume 38, pp. 30–36.
  21. Vojinovic, Z.; Tutulic, D. On the use of 1D and coupled 1D-2D approaches for assessment of flood damages in urban areas. Urban Water J. 2009, 6, 183–199. [Google Scholar] [CrossRef]
  22. Seyoum, S.; Vojinovic, Z.; Price, R.K. Urban pluvial flood modeling: Development and application. In Proceedings of the 9th International Conference on Hydroinformatics, Tianjin, China, 7–10 September 2010.
  23. Evans, B. A Multilayered Approach to Two-Dimensional Urban Flood Modelling. Ph.D. Thesis, University of Exeter, Exeter, UK, 2010. [Google Scholar]
  24. Abdullah, A.F.; Vojinovic, Z.; Price, R.K. A Methodology for processing raw LiDAR data to support 1D/2D urban flood modelling framework. J. Hydroinform. 2011, 14, 75–92. [Google Scholar] [CrossRef]
  25. Abdullah, A.F.; Vojinovic, Z.; Price, R.K. Improved methodology for processing raw LiDAR data to support urban flood modelling—Accounting for elevated roads and bridges. J. Hydroinform. 2011, 14, 253–269. [Google Scholar] [CrossRef]
  26. Vojinovic, Z.; Seyoum, S.D.; Mwalwaka, J.M.; Price, R.K. Effects of model schematization, geometry and parameter values on urban flood modelling. Water Sci. Technol. 2011, 63, 462–467. [Google Scholar] [CrossRef] [PubMed]
  27. Vojinovic, Z.; Seyoum, S.; Salum, M.H.; Price, R.K.; Fikri, A.F.; Abebe, Y. Modelling floods in urban areas and representation of buildings with a method based on adjusted conveyance and storage characteristics. J. Hydroinform. 2012, 15, 1150–1168. [Google Scholar] [CrossRef]
  28. Meesuk, V.; Vojinovic, Z.; Mynett, A.; Abdullah, A.F. Urban flood modelling combining top-view LiDAR data with ground-view SfM observations. Adv. Water Resour. 2015, 75, 105–117. [Google Scholar] [CrossRef]
  29. Sanchez, A.; Medina, N.; Vojinovic, Z.; Price, R. An integrated cellular automata evolutionary-based approach for evaluating future scenarios and the expansion of urban drainage networks. J. Hydroinform. 2014, 16, 319–340. [Google Scholar] [CrossRef]
  30. Kumar, D.S.; Arya, D.S.; Vojinovic, Z. Modelling of urban growth dynamics and its impact on surface runoff characteristics. Comput. Environ. Urban Syst. 2013, 41, 124–135. [Google Scholar] [CrossRef]
  31. Singh, R.; Arya, D.S.; Taxak, A.; Vojinovic, Z. Potential impact of climate change on rainfall intensity-duration-frequency curves in Roorkee. Water Resour. Manag. 2016, 30, 4603. [Google Scholar] [CrossRef]
  32. Trenberth, K.E. Conceptual framework for changes of extremes of the hydrological cycle with climate change. Clim. Chang. 1999, 42, 327–339. [Google Scholar] [CrossRef]
  33. Trenberth, K.E. Changes in rainfall with climate change. Clim. Res. 2011, 47, 123–138. [Google Scholar] [CrossRef]
  34. Emori, S.; Brown, S.J. Dynamic and thermodynamic changes in mean and extreme precipitation under changed climate. Geophys. Res. Lett. 2005, 32, L17706. [Google Scholar] [CrossRef]
  35. Boo, K.O.; Kwon, W.T.; Baek, H.J. Change of extreme events of temperature and precipitation over Korea using regional projection of future climate change. Geophys. Res. Lett. 2006, 33, L01701. [Google Scholar] [CrossRef]
  36. Koutsoyiannis, D.; Kozonis, D.; Manetas, A. A mathematical framework for studying rainfall intensity-duration-frequency relationships. J. Hydrol. 1998, 206, 118–135. [Google Scholar] [CrossRef]
  37. Solaiman, T.A.; Siminovic, S.P. Development of Probability Based Intensity-Duration-Frequency Curves under Climate Change; Water Resources Research Report; The University of Western Ontario: London, ON, Canada, 2011. [Google Scholar]
  38. Mailhot, A.; Duchesne, S. Design criteria of urban drainage infrastructures under climate change. J. Water Resour. Plan. Manag. 2010, 136, 201–208. [Google Scholar] [CrossRef]
  39. Guo, Y.P. Updating rainfall IDF relationships to maintain urban drainage design standards. J. Hydrol. Eng. 2006, 11, 506–509. [Google Scholar] [CrossRef]
  40. Rodríguez, R.; Navarro, X.; Casas, M.C.; Ribalaygua, J.; Russo, B.; Pouget, L.; Redaño, A. Influence of climate change on IDF curves for the metropolitan area of Barcelona (Spain). Int. J. Climatol. 2013, 34, 643–654. [Google Scholar] [CrossRef] [Green Version]
  41. Srivastav, R.K.; Schardong, A.; Simonovic, S.P. Equidistance quantile matching method for updating IDF curves under climate change. Water Resour. Manag. 2014, 28, 2539–2562. [Google Scholar] [CrossRef]
  42. Nguyen, V.-T.-V.; Nguyen, T.-D.; Cung, A. A statistical approach to downscaling of sub-daily extreme rainfall processes for climate-related impact studies in urban areas. Water Sci. Technol. Water Supply 2007, 7, 183–192. [Google Scholar] [CrossRef]
  43. Sharma, D.; Gupta, A.D.; Babel, M.S. Spatial disaggregation of bias-corrected GCM precipitation for improved hydrologic simulation: Ping River Basin, Thailand. Hydrol. Earth Syst. Sci. 2007, 11, 1373–1390. [Google Scholar] [CrossRef]
  44. Piani, C.; Weedon, G.P.; Best, M.; Gomes, S.M.; Viterbo, P.; Hagemann, S.; Haerter, J.O. Statistical Bias Correction of Global Simulated Daily Precipitation and Temperature for the Application of Hydrological Models. J. Hydrol. 2010, 395, 199–215. [Google Scholar] [CrossRef]
  45. Piani, C.; Haerter, J.O.; Coppola, E. Statistical bias correction for daily precipitation in regional climate models over Europe. Theory Appl. Climatol. 2010, 99, 187–192. [Google Scholar] [CrossRef]
  46. Hurkmans, R.T.W.L.; Terink, W.; Uijlenhoet, R.; Torfs, P.J.J.F.; Jacob, D.; Troch, P.A. Changes in streamflow dynamics in the Rhine basin under three highresolution climate scenarios. J. Clim. 2010, 23, 679–699. [Google Scholar] [CrossRef]
  47. Sunyer, M.A.; Madsen, H.; Ang, P.H. A comparison of different regional climate models and statistical downscaling methods for extreme rainfall estimation under climate change. Atmos. Res. 2012, 103, 119–128. [Google Scholar] [CrossRef]
  48. Wilby, R.; Dawson, C.; Barrow, E. SDSM—A decision support tool for the assessment of regional climate change impacts. Environ. Model. Softw. 2002, 17, 145–157. [Google Scholar] [CrossRef]
  49. Semenov, M.A.; Barrow, E.M. Use of a stochastic weather generator in the development of climate change scenarios. Clim. Chang. 1997, 35, 397–414. [Google Scholar] [CrossRef]
  50. Wilks, D.S.; Wilby, R.L. The weather generation game: A review of stochastic weather models. Prog. Phys. Geogr. 1999, 23, 329–357. [Google Scholar] [CrossRef]
  51. Semenov, M.A.; Stratonovitch, P. Use of multi-model ensembles from global climate models for impact assessments of climate change. Clim. Res. 2010, 41, 1–14. [Google Scholar] [CrossRef]
  52. Intergovernmental Panel on Climate Change (IPCC). Climate Change 2014: Synthesis Report; Core Writing Team, Pachauri, R.K., Meyer, L.A., Eds.; Contribution of Working Groups I, II and III to the Fifth Assessment Report of the Intergovernmental Panel on Climate Change; IPCC: Geneva, Switzerland, 2014. [Google Scholar]
  53. Intergovernmental Panel on Climate Change (IPCC). IPCC Special Report Emissions Scenarios; Intergovernmental Panel on Climate Change, Working Group III; IPCC: Geneva, Switzerland, 2000; ISBN 92-9169-113-5. [Google Scholar]
  54. Willems, P.; Molnar, P.; Einfalt, T.; Arnbjerg-Nielsen, K.; Onof, C.; Nguyen, V.-T.-V.; Burlando, P. Rainfall in the urban context: Forecasting, risk and climate change. Atmos. Res. 2012, 103, 1–3. [Google Scholar] [CrossRef]
  55. Arnbjerg-Nielsen, K. Quantification of climate change impacts on extreme precipitationused for design of sewer systems. In Proceedings of the 11th International Conference on Urban Drainage Edinburgh, Scotland, UK, 31 August–5 September 2008.
  56. Willems, P.; Arnbjerg-Nielsen, K.; Olsson, J.; Nguyen, V.T.V. Climate change impact assessment on urban rainfall extremes and urban drainage: Methods and shortcomings. Atmos. Res. 2012, 103, 106–118. [Google Scholar] [CrossRef]
  57. Koutsoyiannis, D. Rainfall Disaggregation Methods: Theory and Applications. In Workshop on Statistical and Mathematical Methods for Hydrological Analysis; Sapienza University of Rome: Rome, Italy, 2003. [Google Scholar]
  58. Gyasi-Agyei, Y.; Mahbub, S.M.P.B. A stochastic model for daily rainfall disaggregation into fine time scale for a large region. J. Hydrol. 2007, 347, 358–370. [Google Scholar] [CrossRef]
  59. Koutsoyiannis, D.; Onof, C. Rainfall disaggregation using adjusting procedures on a Poisson cluster model. J. Hydrol. 2001, 246, 109–122. [Google Scholar] [CrossRef]
  60. Kossieris, P.; Makropoulos, C.; Onof, C.; Koutsoyiannis, D. A rainfall disaggregation scheme for sub-hourly time scales: Coupling a Bartlett-Lewis based model with adjusting procedures. J. Hydrol. 2016. [Google Scholar] [CrossRef]
  61. Liew, S.C.; Raghavan, S.V.; Liong, S.-Y. How to construct future IDF curves, under changing climate, for sites with scarce rainfall records? Hydrol Process. 2013, 28, 3276–3287. [Google Scholar] [CrossRef]
  62. Shrestha, A. Impact of Climate Change on Urban Flooding in Sukhumvit Area of Bangkok. Master’s Thesis, Asian Institute of Technology, Khlong Nung, Thailand, 2013. [Google Scholar]
  63. Organization for Economic Co-Operation and Development (OECD). Ranking of the World’s Cities Most Exposed to Coastal Flooding Today and in the Future. 2007. Available online: http://www.oecd.org/env/cc/39721444.pdf (accessed on 15 February 2017).
  64. Klongvessa, P.; Chotpantarat, S. Statistical analysis of rainfall variations in the Bangkok urban area, Thailand. Arab. J. Geosci. 2015, 8, 4207–4219. [Google Scholar] [CrossRef]
  65. World Bank. Climate Change Impact and Adaptation Study for Bangkok Metropolitan Region; Panya Consultants Co. Ltd.: Bangkok, Thailand, 2009; pp. 1–85. [Google Scholar]
  66. Chow, V.T.; Maidment, D.R.; Mays, L.W. Applied Hydrology; McGraw-Hill Book Company: New York, NY, USA, 1988. [Google Scholar]
  67. Hosking, J.R.M. L-moments: Analysis and estimation of distributions using linear combinations of order statistics. J. R. Stat. Soc. B 1990, 52, 105–124. [Google Scholar]
  68. Hosking, J.R.M.; Wallis, J.R. Regional Frequency Analysis: An Approach Based on L-Moments; Cambridge University Press: New York, NY, USA, 1997. [Google Scholar]
Figure 1. Location of the case study area: Bangkok, Thailand.
Water 09 00145 g001
Figure 2. Methodological framework for the spatial downscaling-temporal disaggregation method (DDM) approach.
Water 09 00145 g002
Figure 3. Weather estimation for 1981–2010 (Black: Synthetic, Grey: Observed).
Water 09 00145 g003
Figure 4. Comparison of: (a) mean; (b) variance; (c) lag 1 autocovariance; and (d) proportion of dry periods for synthetic rainfall simulated by Bartlett–Lewis parameters and historical observed data (1986–2000).
Water 09 00145 g004aWater 09 00145 g004b
Figure 5. Comparison of maximum 3 h rainfall from 1981 to 2010 (Black: Disaggregated, Grey: Observed/Historical).
Water 09 00145 g005
Figure 6. Observed, modelled and corrected present IDFs for 1981–2010.
Water 09 00145 g006
Figure 7. Correction factor for modelled rainfall intensities fitted into higher order equations.
Water 09 00145 g007
Figure 8. Results in box and whiskers plot from nine GCMs’ derived IDF curves for 2-, 5- and 20-years return periods: for the SRA1B scenario (a,c,e,g,i,k); and for the SRA2 scenario (b,d,f,h,j,l) for future periods (2011–2030, and 2046–2065) compared with present IDFs (1981–2010).
Water 09 00145 g008aWater 09 00145 g008b
Table 1. Global climate models applied in the study.
ModelResearch CenterGrid ResolutionScenarios
CNCM3Centre National de Recherches Meteorologiques, France1.9° × 1.9°SRA1B, SRA2
GFCM21Geophysical Fluid Dynamics Laboratory, USA2.0° × 2.5°SRA1B, SRB1, SRA2
HADCM3UK Meteorological Office, UK2.5° × 3.75°SRA1B, SRB1, SRA2
HADGEMUK Meteorological Office, UK1.3° × 1.9°SRA1B, SRA2
INCM3Institute for Numerical Mathematics, Russia4.0° × 5.0°SRA1B, SRB1, SRA2
IPCM4Institute Pierre Simon Laplace, France2.5° × 3.75°SRA1B, SRB1, SRA2
MPEH5Max-Planck Institute for Meteorology, Germany1.9° × 1.9°SRA1B, SRB1, SRA2
NCCCSMNational Centre for Atmospheric Research, USA1.4° × 1.4°SRA1B, SRB1, SRA2
NCPCMNational Centre for Atmospheric Research, USA2.8° × 2.8°SRA1B, SRA2
Table 2. Bartlett–Lewis Rectangular Pulse (BLRP) Parameter Estimation.
Monthλ (day−1)Κ = β/η (−)Φ = γ/η (−)α (−)ν (day)μX (mm·day−1)σX (mm·day−1)
January0.11900.02600.0227691.5007070
February0.12000.24000.1500692.3007070
March0.11500.17000.0900863.2008585
April0.19000.17500.0910653.6909090
May0.30000.25000.0910403.7709090
June0.41000.45000.1250692.6007070
July0.29000.14300.0330692.4509090
August0.23500.13600.0150692.3009090
September0.90000.66400.1150902.5007070
October0.16200.31500.0150692.5607070
November0.11500.19000.0900954.3879595
December0.02400.18260.15901001.9606969
Table 3. Goodness of Fit between different distributions for annual maximum precipitation (1981–2010), showing parameters, Kolgomorov-Smirnov (K-S) test and Chi-squared (χ2) test statistics and p-values, and intensities at different return periods for each distribution and different durations.
DurationDistributionParametersK-S Testχ2 TestIntensity (mm/h) at Return Periods:
StatisticpStatisticp2 Years5 Years20 Years
3 hGEVk = 0.08325, µ = 20.652, σ = 76.1380.0980.8992.0130.57027.8635.0943.49
Gammaα = 13.698, β = 6.3132, γ = 00.1020.8691.3830.70928.1335.0942.72
Gumbelα = 18.218, µ = 75.9620.1190.7253.7390.29127.5534.4343.36
Log Pearson IIIα = 1518.3, β = 0.00689, γ = −6.03090.1060.8422.2060.53127.7835.0543.69
Log Normalα = 0.26397, µ = 4.4251, γ = 00.1100.8072.2260.52727.8434.7742.98
Standard Deviation0.210.290.39
6 hGEVk = 0.12065, µ = 22.557, σ = 83.1590.0790.9820.3580.94915.2720.0427.29
Gammaα = 8.8257, β = 11.241, γ = 00.1160.7511.2970.73015.9220.9526.63
Gumbelα = 26.039, µ = 84.1830.0930.9260.1190.99815.6220.5426.92
Log Pearson IIIα = 11.027, β = 0.09135, γ = 3.54290.0850.9660.3450.95115.3020.1027.21
Log Normalα = 0.29842, µ = 4.5502, γ = 00.1050.8480.1450.99715.7820.2825.77
Standard Deviation0.290.370.61
12 hGEVk = 0.20531, µ = 23.843, σ = 86.680.1350.5810.4750.9247.9810.7115.35
Gammaα = 5.3666, β = 19.836, γ = 00.1790.2417.3170.0268.3311.8315.96
Gumbelα = 35.828, µ = 85.7710.1640.3353.0100.3908.2411.6316.02
Log Pearson IIIα = 3.2755, β = 0.18536, γ = 3.99840.1570.3860.8740.8327.8510.7015.74
Log Normalα = 0.33002, µ = 4.6056, γ = 00.1270.6571.0050.8008.3411.0114.35
Standard Deviation0.220.520.69
24 hGEVk = 0.28101, µ = 24.575, σ = 97.1680.1070.8350.5420.7634.445.968.80
Gammaα = 4.7342, β = 25.493, γ = 00.1920.1808.6160.0354.686.809.33
Gumbelα = 43.249, µ = 95.7260.1830.2245.6390.1314.656.699.34
Log Pearson IIIα = 2.0027, β = 0.23836, γ = 4.25070.1260.6613.1610.2934.365.979.07
Log Normalα = 0.33184, µ = 4.7281, γ = 00.1210.7071.2050.7524.716.238.13
Standard Deviation0.160.400.50
Table 4. Ratio and difference between observed and simulated rainfall intensities.
DurationComparison *Return Period
2 Years5 Years10 Years20 Years50 Years100 Years
3 hRatio = O/M1.4261.4261.4061.3771.3321.295
Difference (mm/h) = O − M8.32710.48311.39911.90812.05011.783
6 hRatio = O/M1.0471.0931.1591.2421.3731.489
Difference (mm/h) = O − M0.6841.7053.2355.3108.85812.147
12 hRatio = O/M1.0071.0201.0361.0571.0901.119
Difference (mm/h) = O − M0.0580.2080.4530.8321.5852.393
24 hRatio = O/M1.0131.0251.0351.0451.0601.072
Difference (mm/h) = O − M0.0550.1440.2430.3800.6420.922
Notes: * O = Observed and M = Modelled or from disaggregation.
Table 5. Percentage change (%) of rainfall intensities at 2-, 5-, and 20-years return periods in 1 h, 3 h, 6 h, 12 h and 24 h durations from baseline 1981–2010 to future scenarios of 2011–2030 (I) and 2046–2065 (II) periods.
GCMsFuture PeriodScenarioReturn Period 2 Years
Duration (h)
Return Period 5 Years
Duration (h)
Return Period 20 Years
Duration (h)
136122413612241361224
CNCM3ISRA24.98.919.011.310.35.69.623.019.820.28.515.234.637.831.2
SRA1B9.09.418.211.97.56.911.122.224.817.90.111.334.752.732.9
IISRA29.015.428.716.611.46.916.634.027.621.90.821.449.654.937.9
SRA1B7.35.416.96.77.78.29.618.017.116.76.018.930.245.831.9
GFCM21ISRA26.910.424.913.76.31.69.427.626.514.7−10.11.325.039.822.7
SRA1B0.812.624.412.55.7−0.217.229.821.314.13.718.432.833.123.1
IISRA212.017.630.616.310.513.226.741.730.620.46.028.951.249.229.3
SRA1B14.618.425.117.115.46.918.129.026.224.7−4.814.941.343.629.7
HADCM3ISRA213.216.518.912.110.714.320.527.027.225.414.530.447.962.547.5
SRA1B10.115.422.916.813.06.920.435.230.926.4−1.521.958.159.846.3
IISRA213.216.518.912.110.714.320.527.027.225.414.530.447.962.547.5
SRA1B13.620.829.919.216.64.617.034.036.130.8−10.28.542.569.851.2
HADGEMISRA21.8-0.111.41.11.60.02.217.68.912.31.318.934.927.828.4
SRA1B7.52.410.29.15.91.63.619.819.416.2−4.411.039.942.829.0
IISRA24.511.126.011.99.9−2.35.926.423.621.4−18.3−7.019.741.731.1
SRA1B12.027.047.533.322.57.924.743.045.634.9−1.418.828.050.940.6
IMCM3ISRA220.421.223.111.73.818.722.924.722.012.614.823.642.051.932.1
SRA1B10.115.422.916.813.06.920.435.230.926.4−1.521.958.159.846.3
IISRA215.717.620.012.69.65.19.320.419.317.5−10.5−3.225.040.730.1
SRA1B13.620.829.919.216.64.617.034.036.130.8−10.28.542.569.851.2
IPCM4ISRA27.210.414.34.12.27.49.615.113.011.23.37.120.034.326.7
SRA1B2.25.514.613.710.9−0.50.89.816.016.7−5.2−3.02.114.016.2
IISRA28.414.920.810.05.81.411.224.921.014.7−10.07.332.748.031.2
SRA1B2.215.228.424.116.54.424.140.334.826.210.241.275.356.437.9
MPEH5ISRA210.112.615.54.13.97.715.321.016.618.10.918.736.843.240.1
SRA1B11.612.113.56.03.88.816.521.318.417.40.020.344.445.039.6
IISRA210.619.119.63.4−1.010.821.730.514.57.111.116.643.146.428.2
SRA1B12.414.729.025.821.56.918.334.539.237.8−2.718.051.068.465.0
NCCCSMISRA211.98.816.413.710.715.615.623.327.124.325.925.643.156.442.1
SRA1B20.415.122.115.511.713.914.024.925.322.9−1.68.632.942.736.9
IISRA21.38.118.614.913.90.67.922.025.524.8−4.31.024.046.635.6
SRA1B25.626.029.519.911.618.728.837.833.122.61.526.348.154.436.8
NCPCMISRA219.927.830.914.87.212.824.433.021.913.62.316.634.336.222.7
SRA1B7.414.616.512.99.02.516.015.619.815.1−7.812.320.934.719.0
IISRA28.513.623.412.09.11.96.019.415.313.1−13.0−4.619.723.012.1
SRA1B15.619.021.710.27.213.419.125.215.411.63.611.628.627.014.2

