1. Introduction
1.1. Background to Urban Drainage Models
The urban drainage system is often described by a dual drainage concept formed from the surface and sub-surface domains [
1,
2,
3,
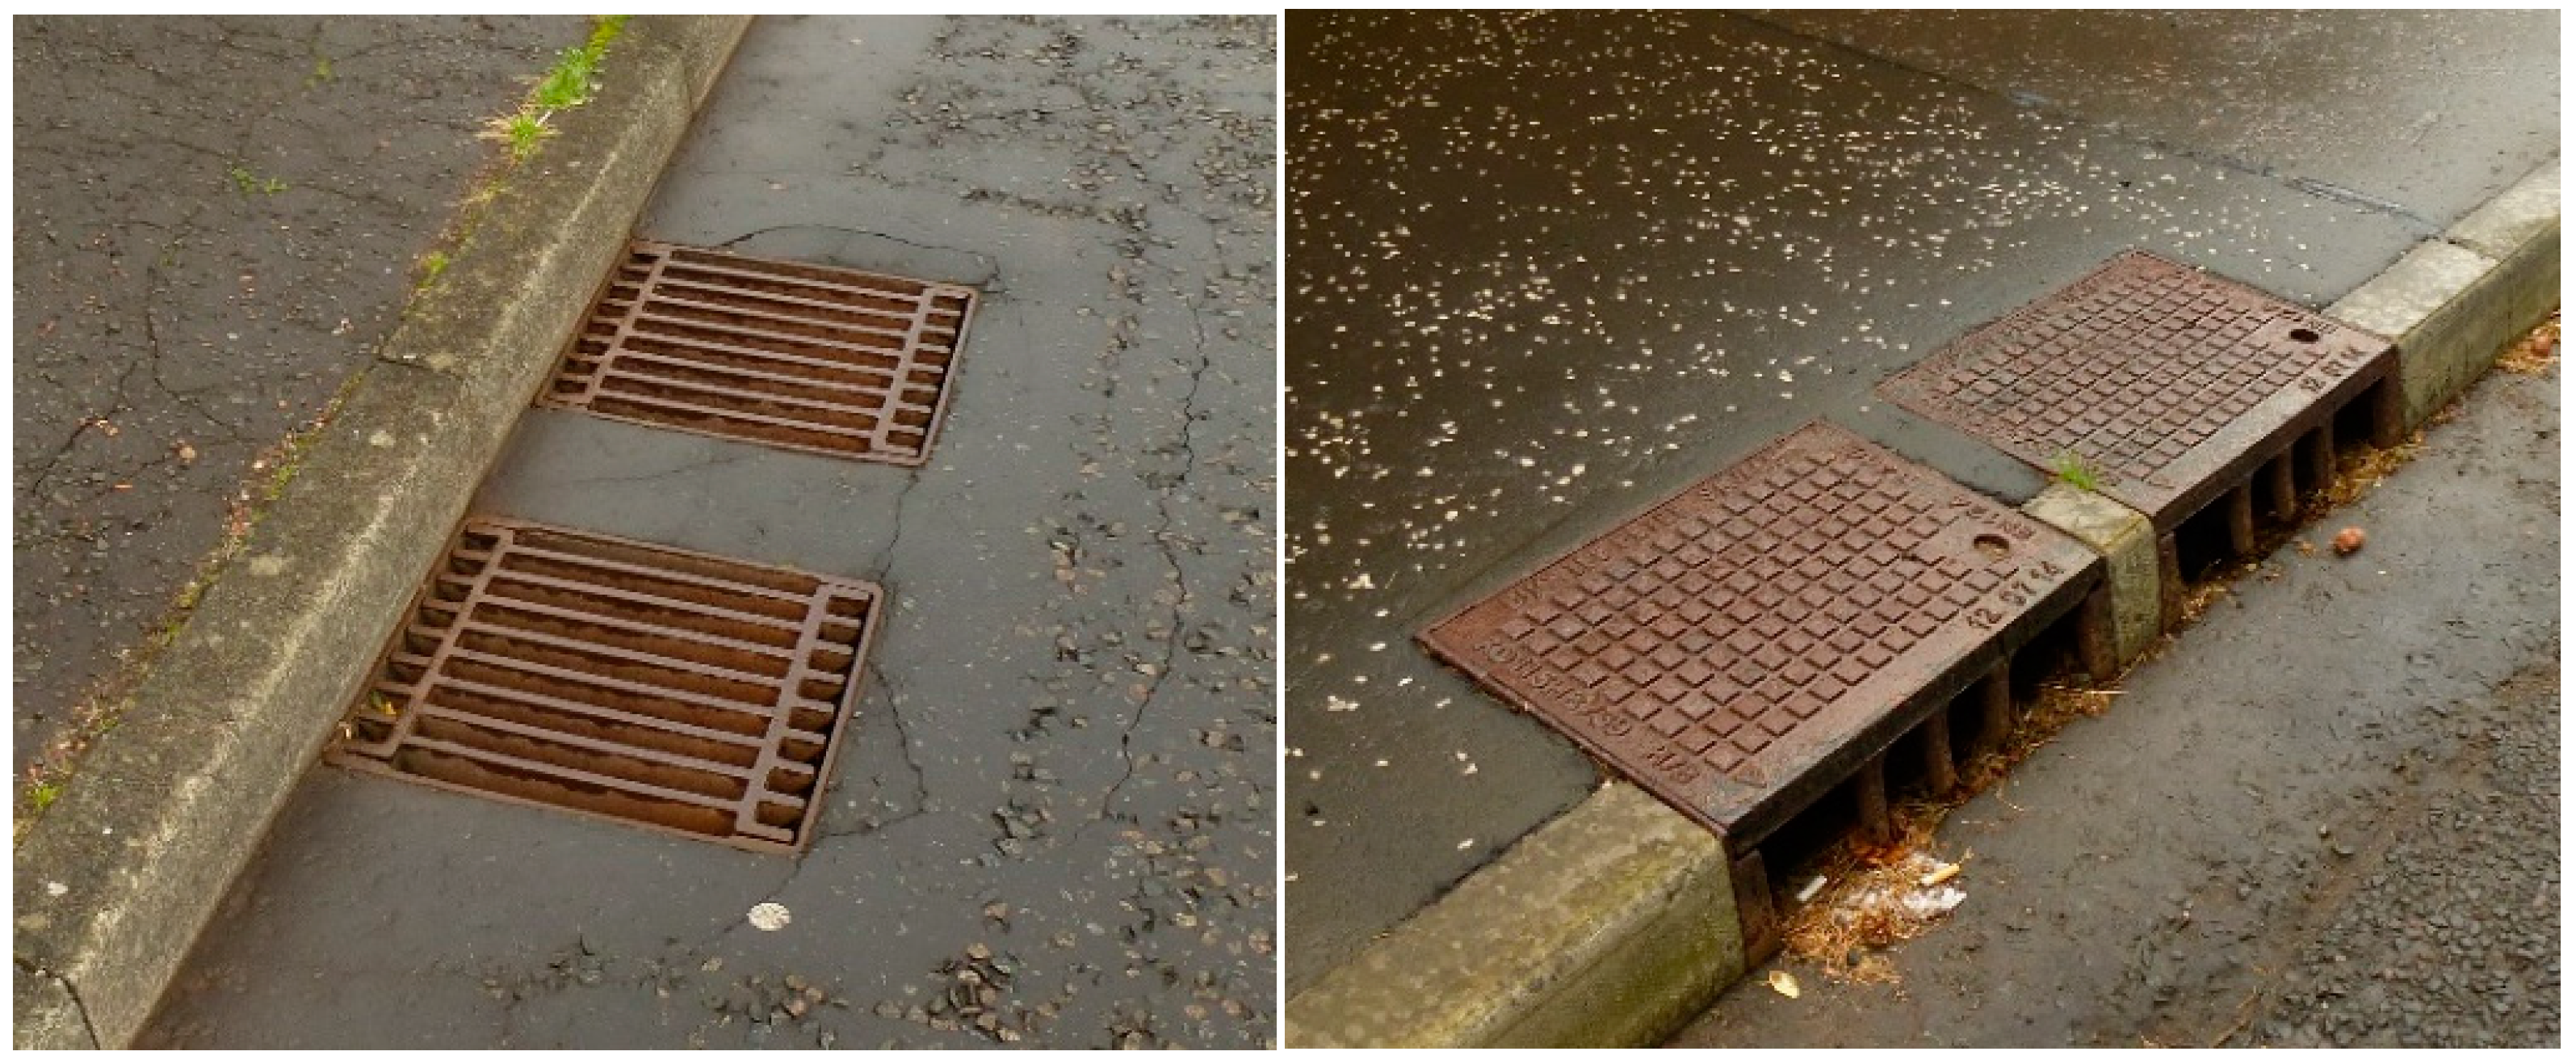
4]. Under normal conditions (i.e., non pressurised sub-surface system), water from the surface drains into the sub-surface domain via storm drain inlets (sometimes referred to as gullies) (
Figure 1). In case of a pressurised sub-surface system, a reverse flow [
5] can lead to surcharging conditions at storm drain inlets and/or manholes. Manholes are located between pipe sections of different diameters, changes in direction or gradient, junctions of pipes, and at designed intervals that are required to provide access to the sub-surface domain for maintenance and inspection purposes [
6].
Modelling the flow dynamics in between the two domains is complex, particularly when the flow is discontinuous. For example, modelling flows where shock waves are present requires the use of advanced numerical techniques and the appropriate system of conservation laws, see [
7,
8]. Additionally, modelling unsteady mixed (free surface—pressurised) flows in pipes is challenging because free surface flows and pressurised flows are described by different equations and the transition between these two flow states is difficult to capture, see [
9].
Therefore, commonly applied software tools for modelling urban drainage and floods, such as Infoworks CS (Collection Systems) or ICM (Integrated Catchment Modelling) [
10] adopt simplifications in two respects. Firstly, the numerical solutions are usually implemented by using the Preissmann slot with free-surface flow to simulate pressurised conditions in a pipe [
11,
12,
13]. Secondly, in the way the drainage system is represented inside the model, where instead of using the storm drain inlets, a selection of nodes (usually manholes) are used to link the sub-surface system with pre-defined sub-catchments. These sub-catchments are usually delineated manually and are assigned a number of parameters to reflect the sub-catchment drainage characteristics. Based on these characteristics, rainfall-runoff hydrographs are established for each sub-catchment to transfer water volumes into the sub-surface domain [
14]. This means that no two-dimensional (2D) surface flow routing is simulated at this stage, but surcharging nodes can be treated differently. For example, Infoworks CS adopts the concept of virtual reservoirs [
15], which assign a pre-defined flood volume to each node. Surcharging water volumes from the nodes are stored in this virtual reservoir without conducting any 2D free surface flow simulations. More recently, Infoworks ICM allows for the coupling of nodes with a TIN (Triangular Irregular Network) mesh, which is derived from a terrain model [
10]. This provides the opportunity to simulate 2D surface flow of the surcharged water volumes.
From a practical perspective, the simplifications outlined are justifiable as they significantly reduce model complexity, computational times, and data requirements. Also, recent versions of commercial modelling tools provide the option to incorporate the storm drain inlets and simulate 2D surface runoff directly from rainfall. However, there is a lack of fully coupling the one-dimensional (1D) sub-surface and the 2D surface domain by explicitly modelling all of the storm drain inlets within the entire urban catchment. This prevents an in-depth understanding of the flow dynamics between the drainage domains, which requires an implementation of all storm drain inlets. Particularly for detailed source-pathway-receptor analysis across the surface and sub-surface domain only fully coupled 1D/2D models provide the necessary results. Research presented by [
1,
16] introduced the multiple-linkage-element concept, which was a first attempt to address the coupling of the surface and sub-surface domain using grouped storm drain inlets. At the same time, the recent advances in cloud computing provide access to sufficient computational power to make city-wide large and complex models, such as CityCAT, practicable [
17].
1.2. CityCAT 1D/2D: Fully Coupled 1D/2D Modelling
CityCAT—City Catchment Analysis Tool [
17]—is a newly developed modelling software for urban drainage and flood modelling purposes. The overland flow component of CityCAT is based on the shallow water equations, and the solution is obtained using high-resolution finite volume shock-capturing schemes [
18]. The pipe flow component of CityCAT is based on the mathematical model for mixed flows in pipes (MFP) presented by [
9]. The MFP uses the St Venant equations and a conservative system of equations for pressurised flows that are derived from the compressible Euler equations. It can model sub-atmospheric pressures and large pressure wave celerities (>1000 m/s). Additionally, the model can capture the transition between the free surface and pressurised flow.
The software does not depend on sub-catchments, but instead entire terrain-derived catchments are simulated along with buildings and green areas, allowing for a physical simulation of roof-drainage and infiltration. Building footprints are removed from the grid to reduce the cell numbers, and hence the run time that is required. Runoff from the roofs, however, is still kept in the system. By automatically generating the final computational grid CityCAT significantly simplifies the model setup process. CityCAT can be deployed on servers or the cloud to access advanced computational resources, and therefore allow for large model domains to be simulated at fine grid resolutions.
By actively simulating all of the storm drain inlets and using high-resolution terrain data CityCAT 1D/2D offers new dimensions of accurately modelling the dynamic dual drainage system in urban areas. This is essential information for assessing the impact of flooding on people and the urban fabric but also for the purpose of planning flood adaptation options. From the perspective of network design and network improvement high-resolution hydraulic models offer the benefit of assessing the performance of individual or a group of storm drain inlets. In this context, storm drain inlets might be added or removed. This would allow, for instance, assessing the potential reduction of drainage efficiency of storm drain inlets as result of clogging or structural changes for instance [
19].
1.3. CityCAT 1D/2D: Linking Storm Drain Inlets With Manholes
CityCAT automatically connects storm drain inlets with the nearest manhole using parametric relations to describe the flow through the inlet. The linking is based on the single-linking element (SLE) approach [
1,
20] where the Bernoulli equation and the energy loss equation are used to calculate the exchange of discharge between the surface and the subsurface. Importantly, this allows for the dimensions and design of various inlets to be included, as well as explicitly modelling the efficiency of the inlets that can be affected by clogging with debris or leaves. For the purpose of this study, uniform dimensions for all inlets (0.3 m × 0.3 m) and linking pipes (90 mm diameter) between the inlet and manhole were applied. CityCAT solves every time step the two-dimensional shallow water equations for the overland flow, the SLE equations for every link between the surface and the subsurface, and the mixed flow equations for the pipes.
1.4. Aim of Study
In order to access the full capabilities of CityCAT, a comprehensive record of storm drain inlet locations is required. Experience shows, however, that such records are not always available. For certain areas, no records exist at all, while other areas have only incomplete or outdated records. Consequently, missing storm drain inlet data prevent a full application of CityCAT. In order to fill this gap, the main aim of this study is to develop and evaluate an automated GIS (Geographic Information System) routine to generate synthetic storm drain inlet locations for the existing pipe networks. For evaluation purposes a detailed field survey was conducted in order to have a record of actual storm drain inlet locations for a catchment. From a practical perspective, the question is whether the routine can provide a straightforward and low cost alternative when compared to resource intensive field work when establishing a network of storm drain inlets.
Missing input data is often one of the biggest challenges when building flood models. Apart from storm drain inlet locations, this may also concern dimensions and locations of manholes and pipes. Taking the idea proposed in this work of using surrogate data and generic methods, the tool that is developed could potentially be extended in future work to assist in generating other crucial information that is required for high-resolution urban flood models.
The study will first outline the assumptions behind the initially developed GIS routine. Based on preliminary hydraulic model results that are obtained from CityCAT 1D/2D simulations, improvements to the GIS routine are presented. Finally, model results for a synthetically generated and surveyed storm drain inlet network are compared in order to validate the GIS routine and to study the sensitivity of the whole network drainage efficiency (for sub-surface and surface) to the density and placement of inlets.
2. Development of GIS Routine
2.1. Background
A variety of methods have been developed over the last decades for the design of sewer systems [
21,
22,
23,
24,
25]. Although these methods vary, they are primarily aimed to provide assistance in the development of new sewer systems in the form of manholes and pipes. This study will focus on the design (location and density) of storm drain inlets for existing sewer systems.
The design and spacing of storm drain inlets in reality takes into account a large number of parameters [
26,
27] for instance: slope and cross-fall of the road, the storm drain inlet grating type and efficiency, surface roughness, flow width and velocity in the kerb channel, maintenance factors, design storm, and contributing catchment area per storm drain inlet. In this context [
19], identify three major factors contributing to the inlet capacity and efficiency: lateral street slope, longitudinal street slope, and pavement roughness. If all of those variables were to be incorporated in a GIS routine, a significant amount of high quality input data would be required that is not usually available.
A further challenge in developing a generic GIS routine for locating storm drain inlets is the change of design criteria over time [
28,
29,
30]. More recent design criteria shifted towards separated drainage systems and the need to accommodate larger runoff volumes. In this context, for example, in Scotland, newly built sustainable drainage systems have to accommodate storm events with return periods of up to 200 years [
31]. Most installed sewer systems however are based on older design manuals, dating back several decades, which adopted return periods between 1 and 30 years [
6]. Therefore, a generic tool to generate storm drain inlet locations for existing sewer systems has to find a balance in terms of the different design criteria over time.
2.2. Initial Assumptions behind Gis Routine
With the above considerations in mind, it has been decided to initially adopt a robust and simplified approach for the GIS routine that is developed. Furthermore, the routine should be universally applicable and therefore rely only on a minimum number of input data. Crucially however, the tool needs to incorporate information on the existing sub-surface system. The three assumptions behind the initial version of the GIS routine are therefore:
Based on those assumptions, two sets of input data are required: (1) a polygon shapefile representing the road network; and (2) a polyline shapefile representing the pipe network. With the above assumptions, no terrain information is accounted for at this stage. The integration of terrain information will be presented after the preliminary results.
2.3. Placement of Storm Drain Inlets
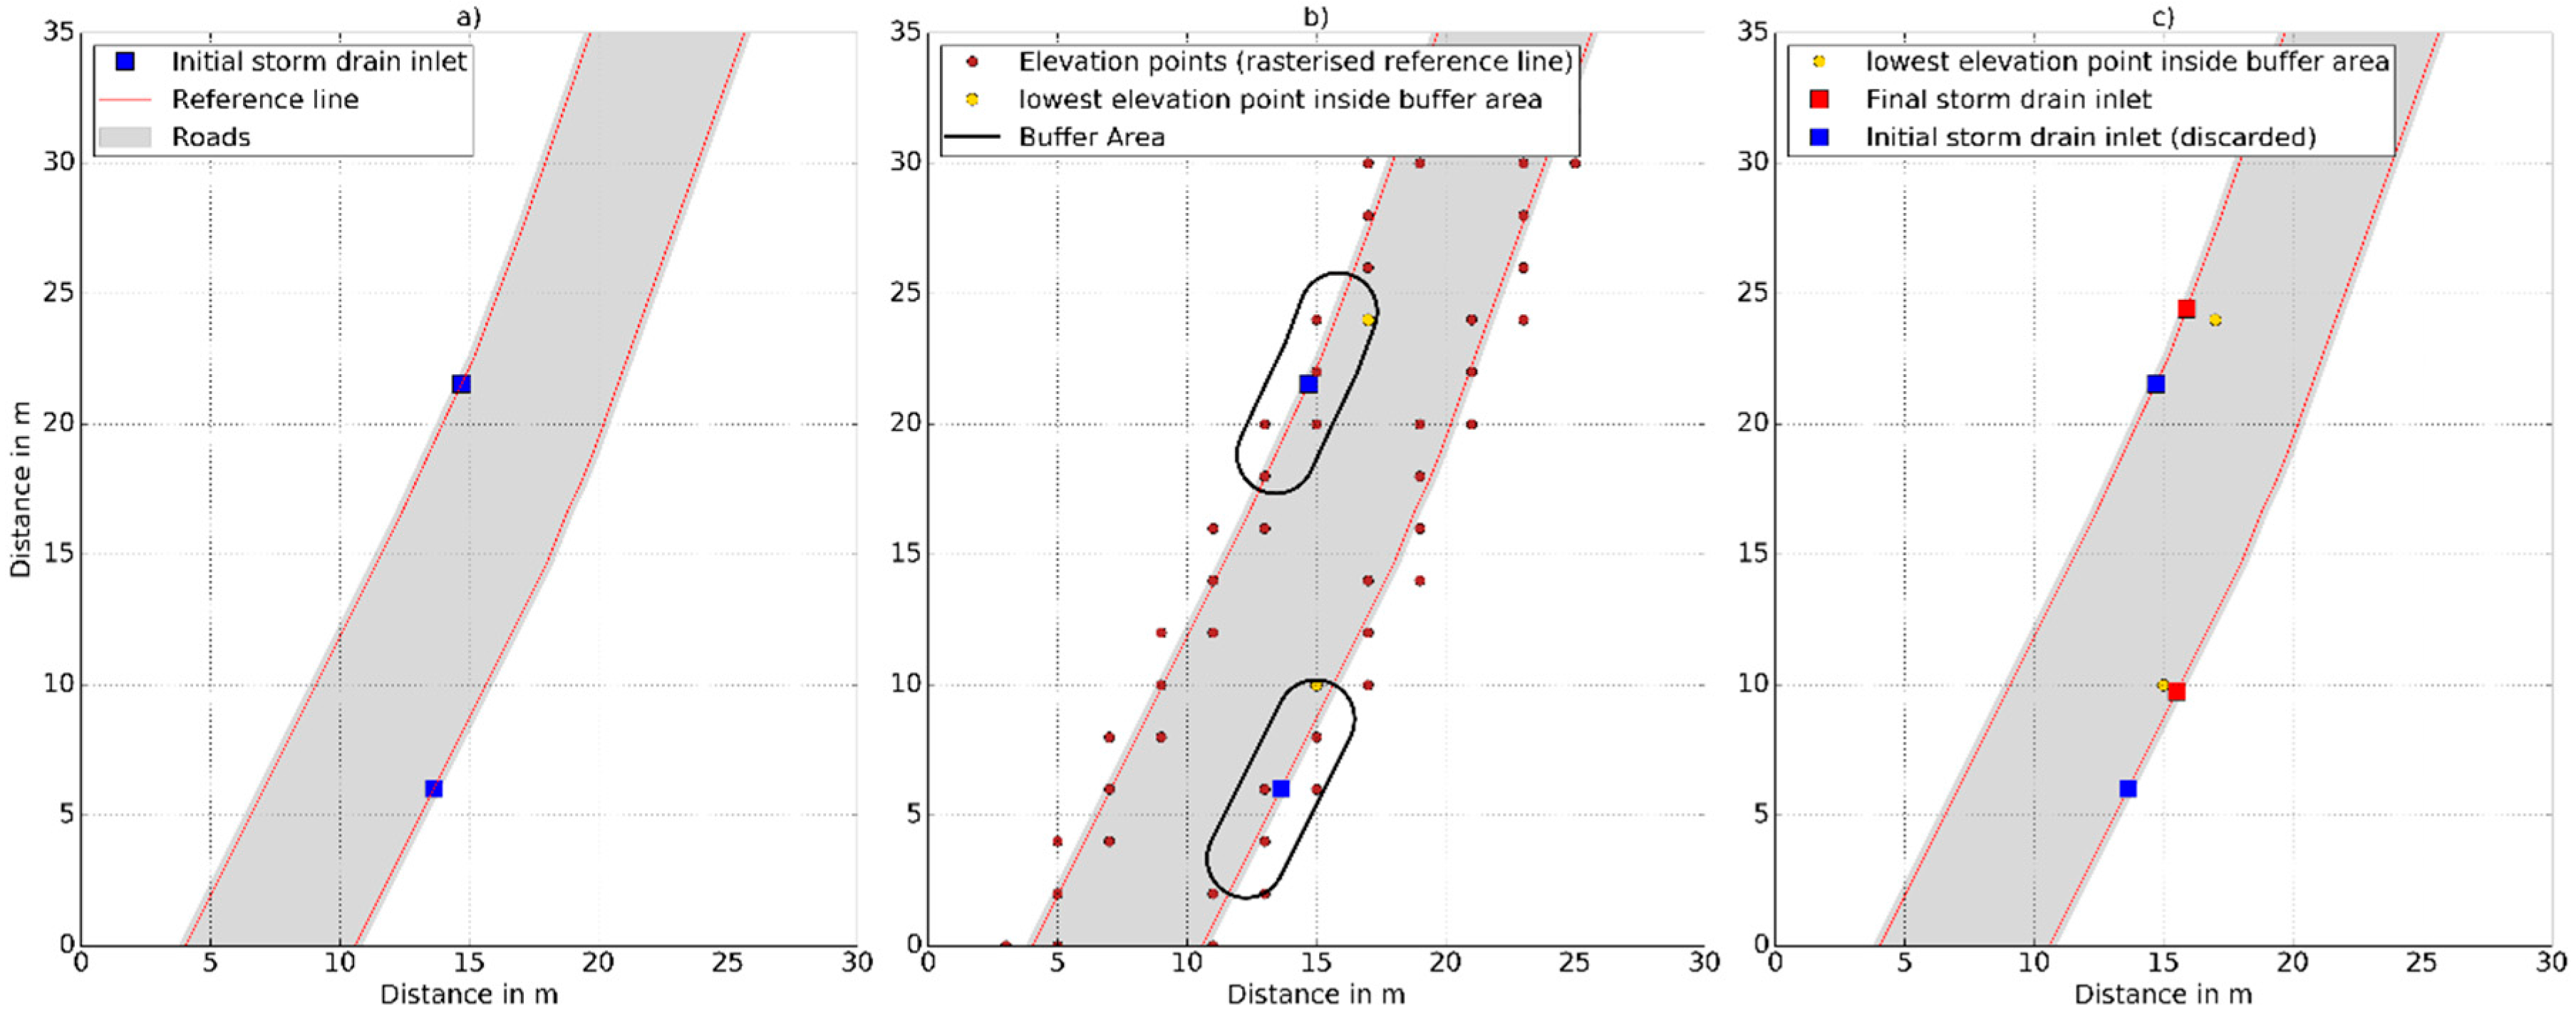
In the first step, the synthetic storm drain inlets are placed along a reference line. For this purpose, the road polygons are dissolved (i.e., no internal boundaries) into one single polygon (
Figure 2a). Inside this polygon a buffer is created applying a distance of 0.25 m in order to assure that all of the storm drain inlets are placed inside the road. The buffer polygon is subsequently converted to a line feature, which is subsequently referred to as the reference line (
Figure 2b). Finally, point features (i.e., storm drain inlets) are placed along the reference line at an equidistant spacing of 50 m (
Figure 2b).
2.4. Alignment of Storm Drain Inlets with Pipe Network
The pipe network is applied next. As shown in
Figure 2c, a 20 m buffer is created around the entire pipe network. Any storm drain inlet that is located outside the 20 m buffer will be discarded (
Figure 2c). Synthetic storm drain inlets in the final layer therefore meet the following conditions: they are located inside the road polygon, 0.25 m inside the kerb and 50 m apart from each other, and they are within 20 m of the pipe network.
3. Case Study
Having outlined the principles behind the initial GIS routine in general, a case study is conducted. For validation purposes, a field study was completed to survey the actual storm drain inlet network. The study area is located in central Scotland. The topography of the area is relatively flat. The drainage network, including pipes and manholes, were obtained from an Infoworks CS model, which was made available by Scottish Water. By incorporating additional drainage network elements from GIS records, the final drainage network that was applied consists of 294 manholes and 10,898 m of pipes. For the purpose of this study, only storm and combined drainage pipes were applied. Furthermore, no base flow or dry weather flow was taken into account.
3.1. Synthetic Storm Drain Inlet Locations: Applying the GIS Routine
Following the workflow of the GIS routine outlined, the first step was to obtain the road data. For this purpose, the OS (Ordnance Survey) MasterMap Topography layer was downloaded from Edina Digimap [
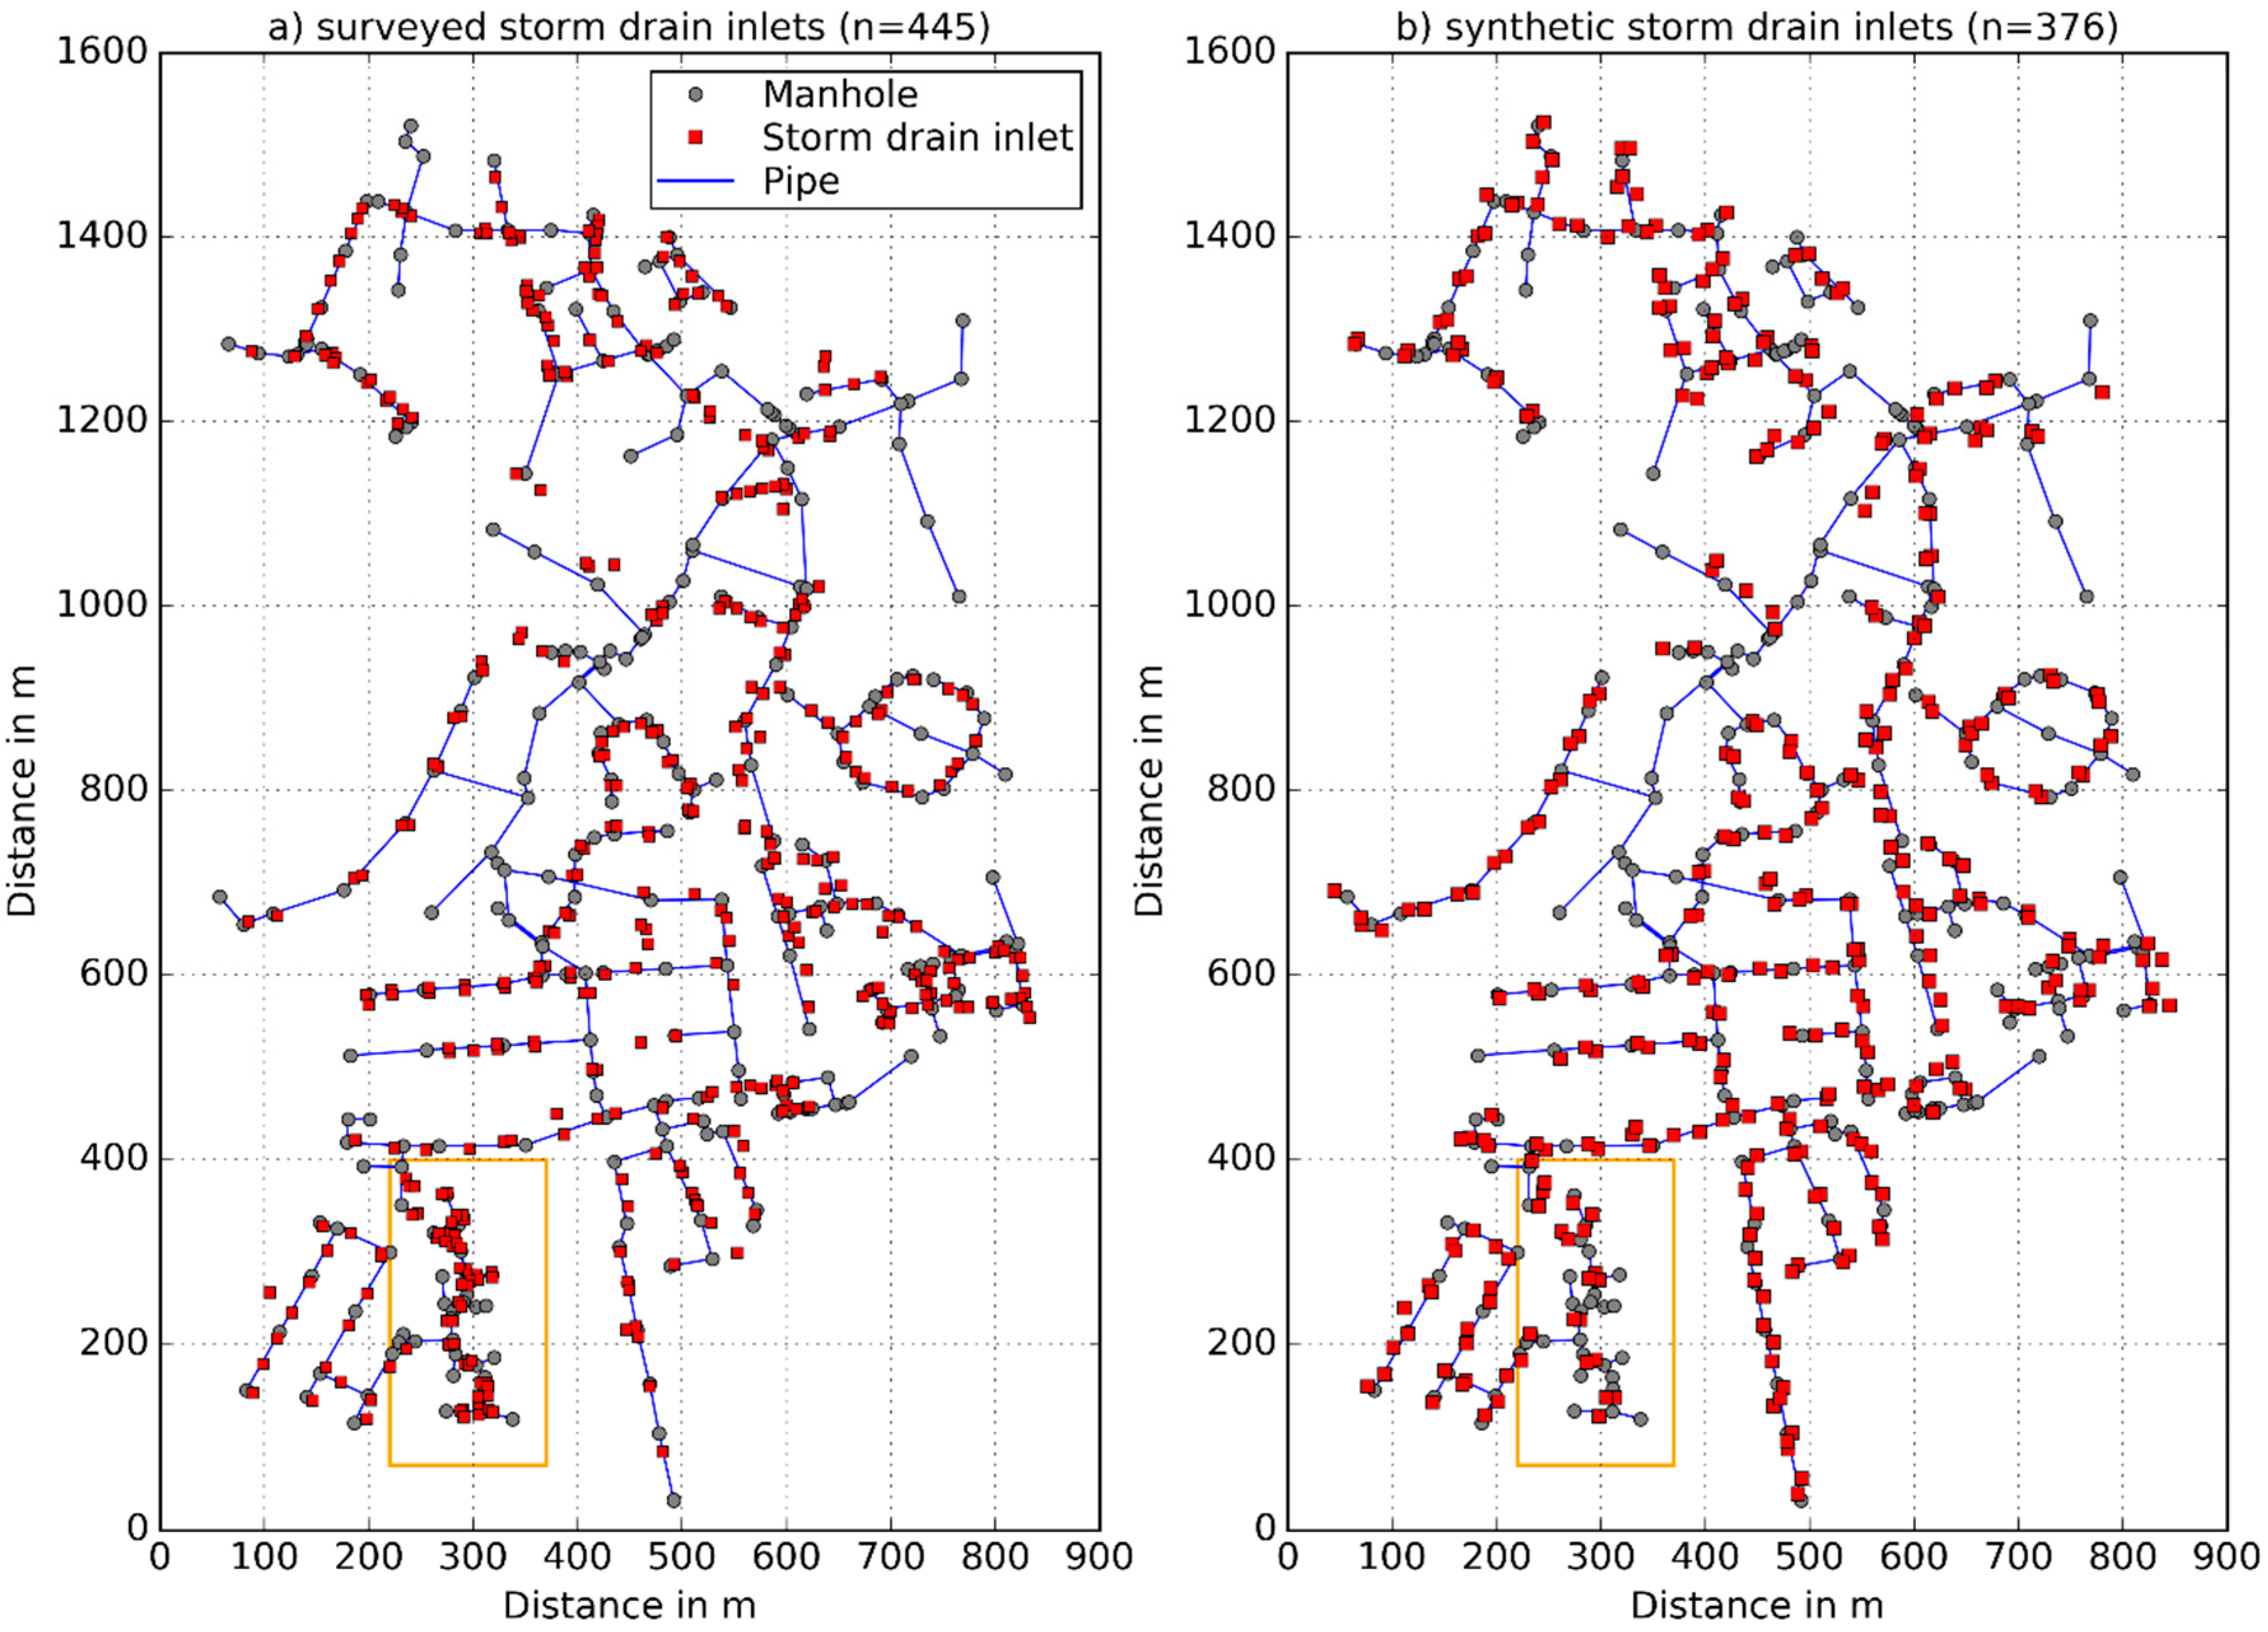
35]. From the initial data set, all of the road polygons (‘featureCod: 10172’) were extracted. Applying the steps of the initial GIS routine, the network generated contained 376 synthetic storm drain inlets (
Figure 3a).
3.2. Surveying of Actual Storm Drain Inlet Locations: Field Work
Approximately 13 km of roads were surveyed, requiring four full working days, including travelling time and post-processing of the data collected. The GPS equipment that was applied to record the storm drain inlet locations was the hand held device Leica GS15 with SMARTNET correction [
36]. The network based Real Time Kinematic (RTK) function of the device combines satellite and GPRS signals to achieve greater accuracy. Overall, the positional accuracy observed during the field work was approximately +/−10 cm, which is thought to be sufficient for the purpose of this study. At a few storm drain inlet locations signal problems were experienced. Those locations were manually highlighted on a map and later added to the RTK-surveyed storm drain inlets in GIS. If a parked vehicle made it impossible to survey the actual inlet, its location was taken at the closest distance possible and subsequently adjusted in GIS.
In a final step, the locations of the surveyed storm drain inlets were aligned with the below ground pipe network. Although a surveyed storm drain inlet would indicate the existence of below ground drainage features, a number of inlets were surveyed in areas without any GIS records of a pipe in close proximity. To avoid unrealistic long connections between those storm drain inlets and a manhole, and not to estimate any pipe dimensions and locations, it was decided to discard those storm drain inlets. This was done applying the same 20 m buffer that has been used for aligning the synthetic storm drain inlet locations (
Figure 2c). As shown in
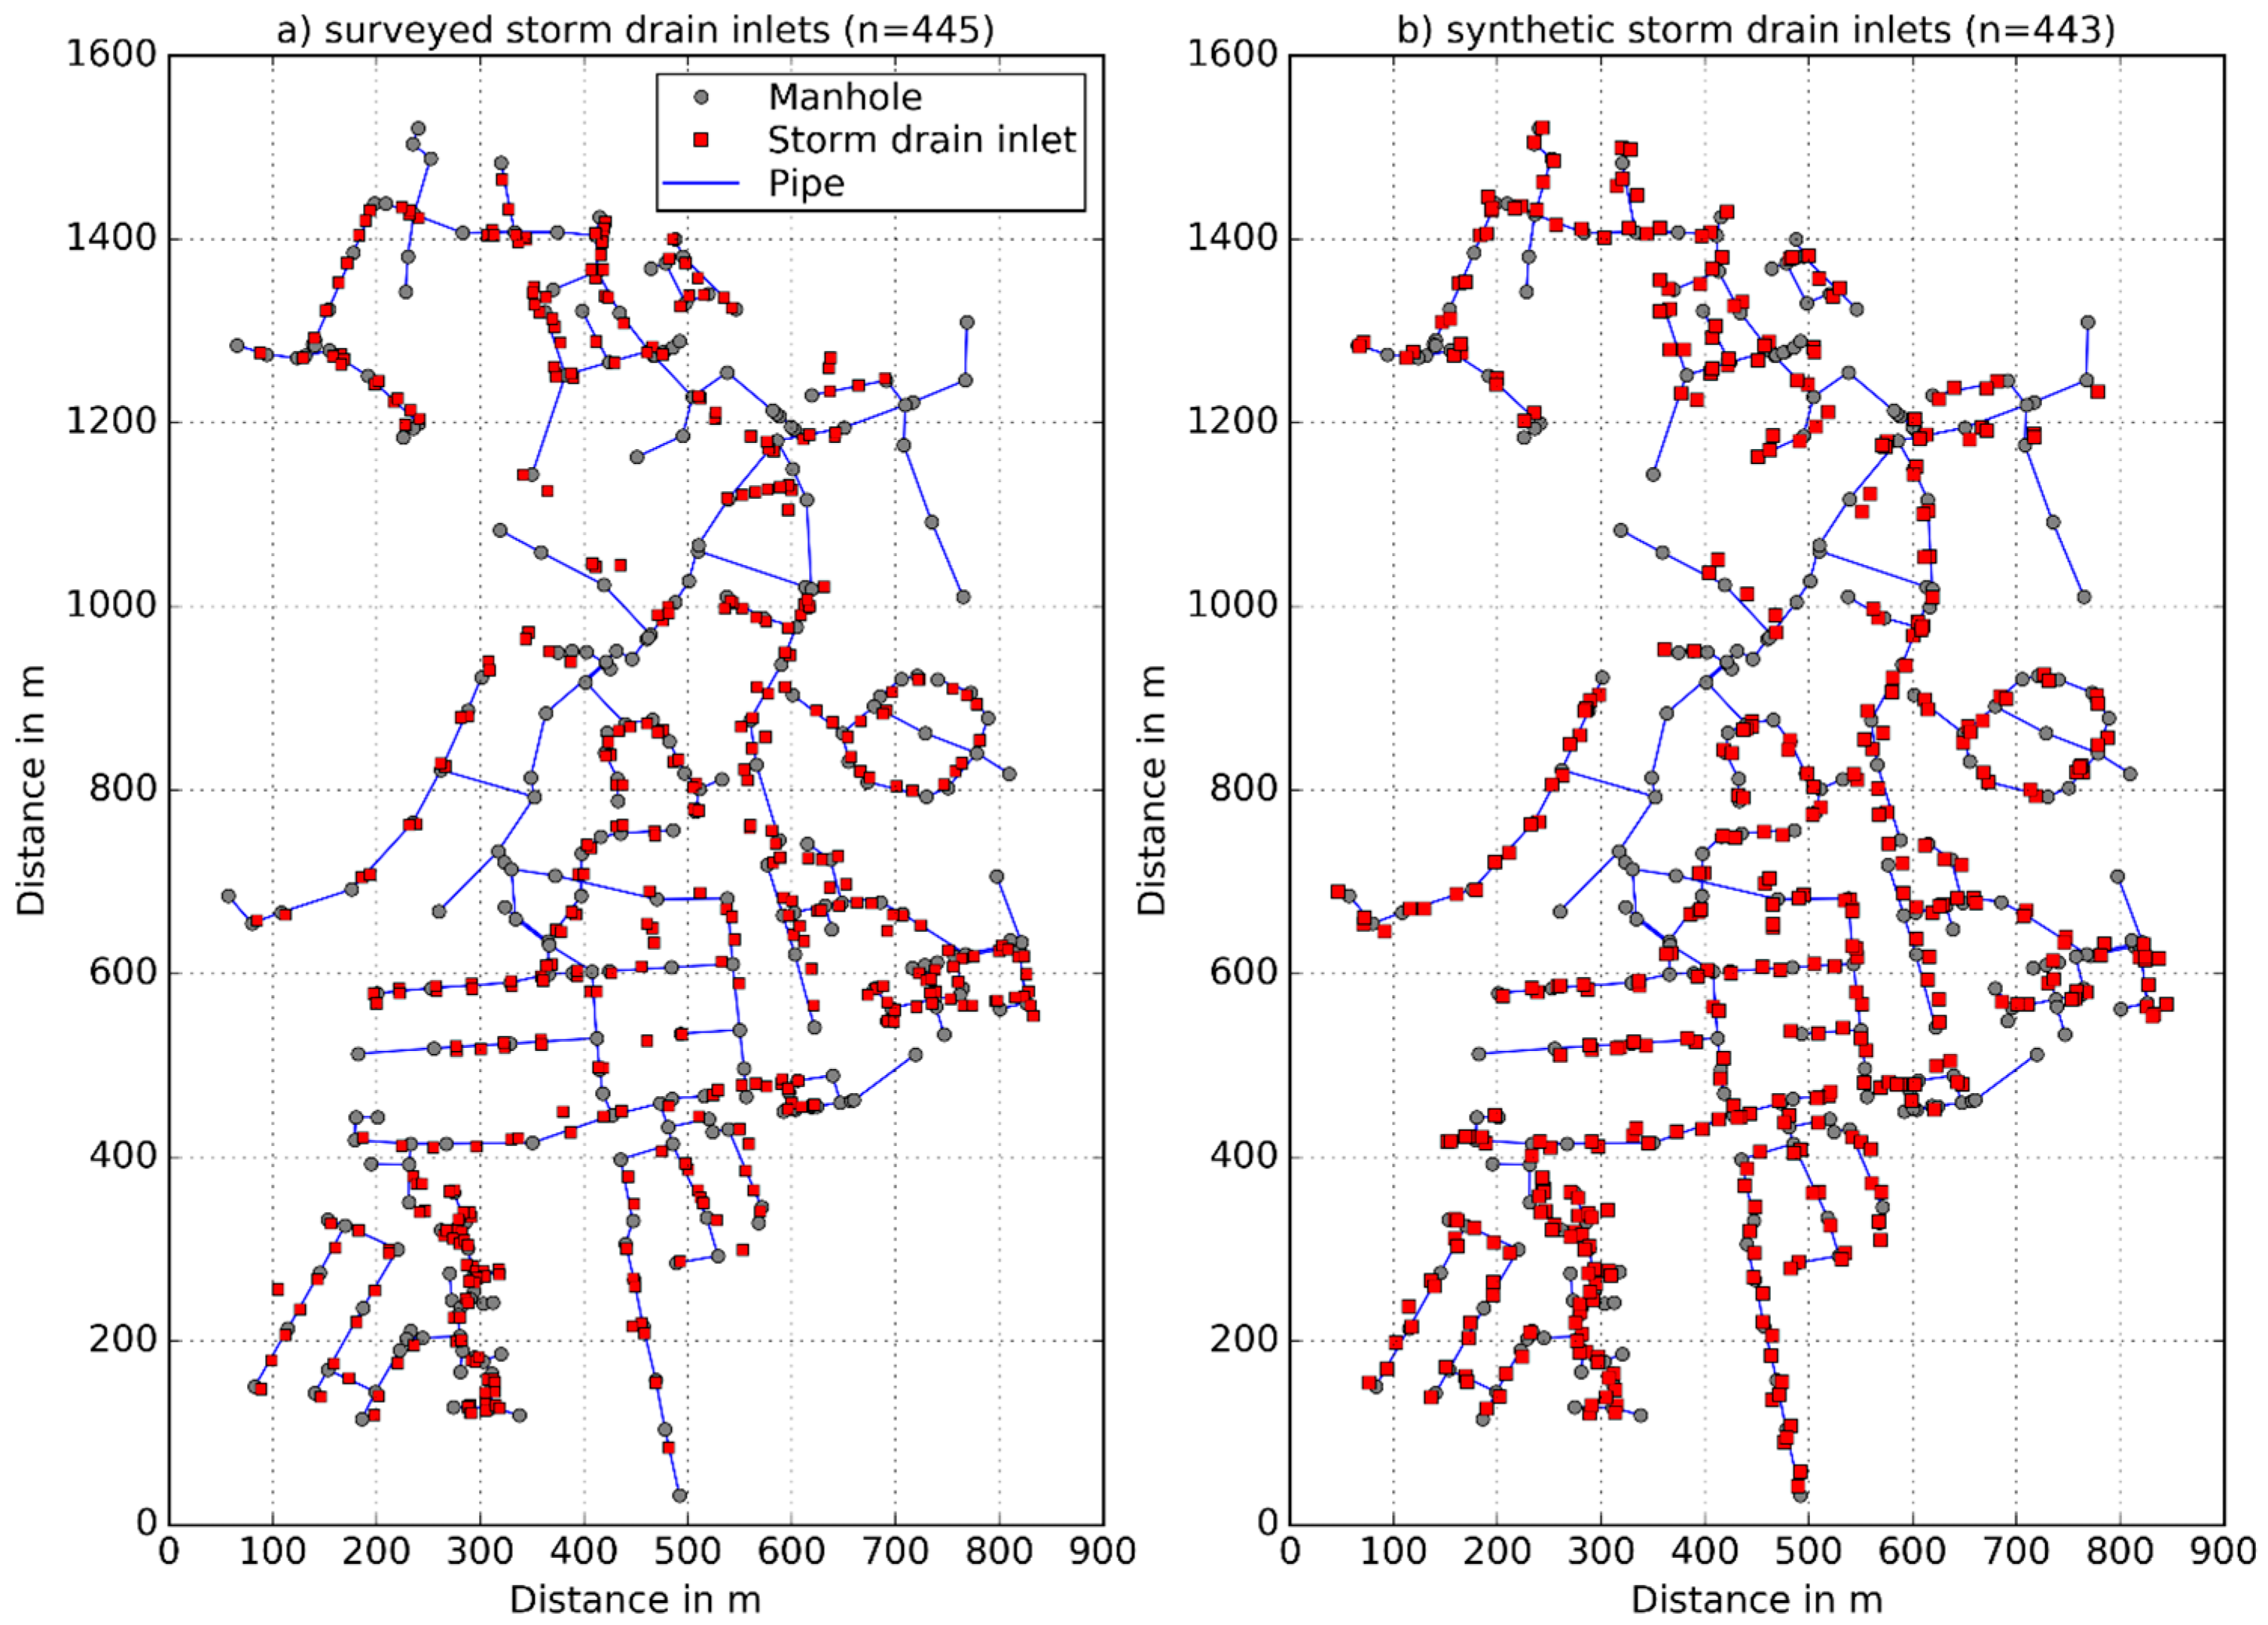
Figure 3, the post-process surveyed network consists of 445 storm drain inlets.
3.3. Hydrodynamic Model for Case Study Area
Finally, the surveyed and synthetically generated storm drain inlet networks were applied in hydrodynamic simulation in the CityCAT 1D/2D software. The drainage network elements applied included the storm drain inlet locations, pipes, and manholes. The simulations were conducted using LiDAR (Light Detection and Ranging) terrain data with a resolution of 2 m × 2 m, and a uniform rectangular numerical grid was generated with Δx = Δy = 2 m. The catchment is made up of 525,554 cells, resulting in a total area of approximately 2.1 km
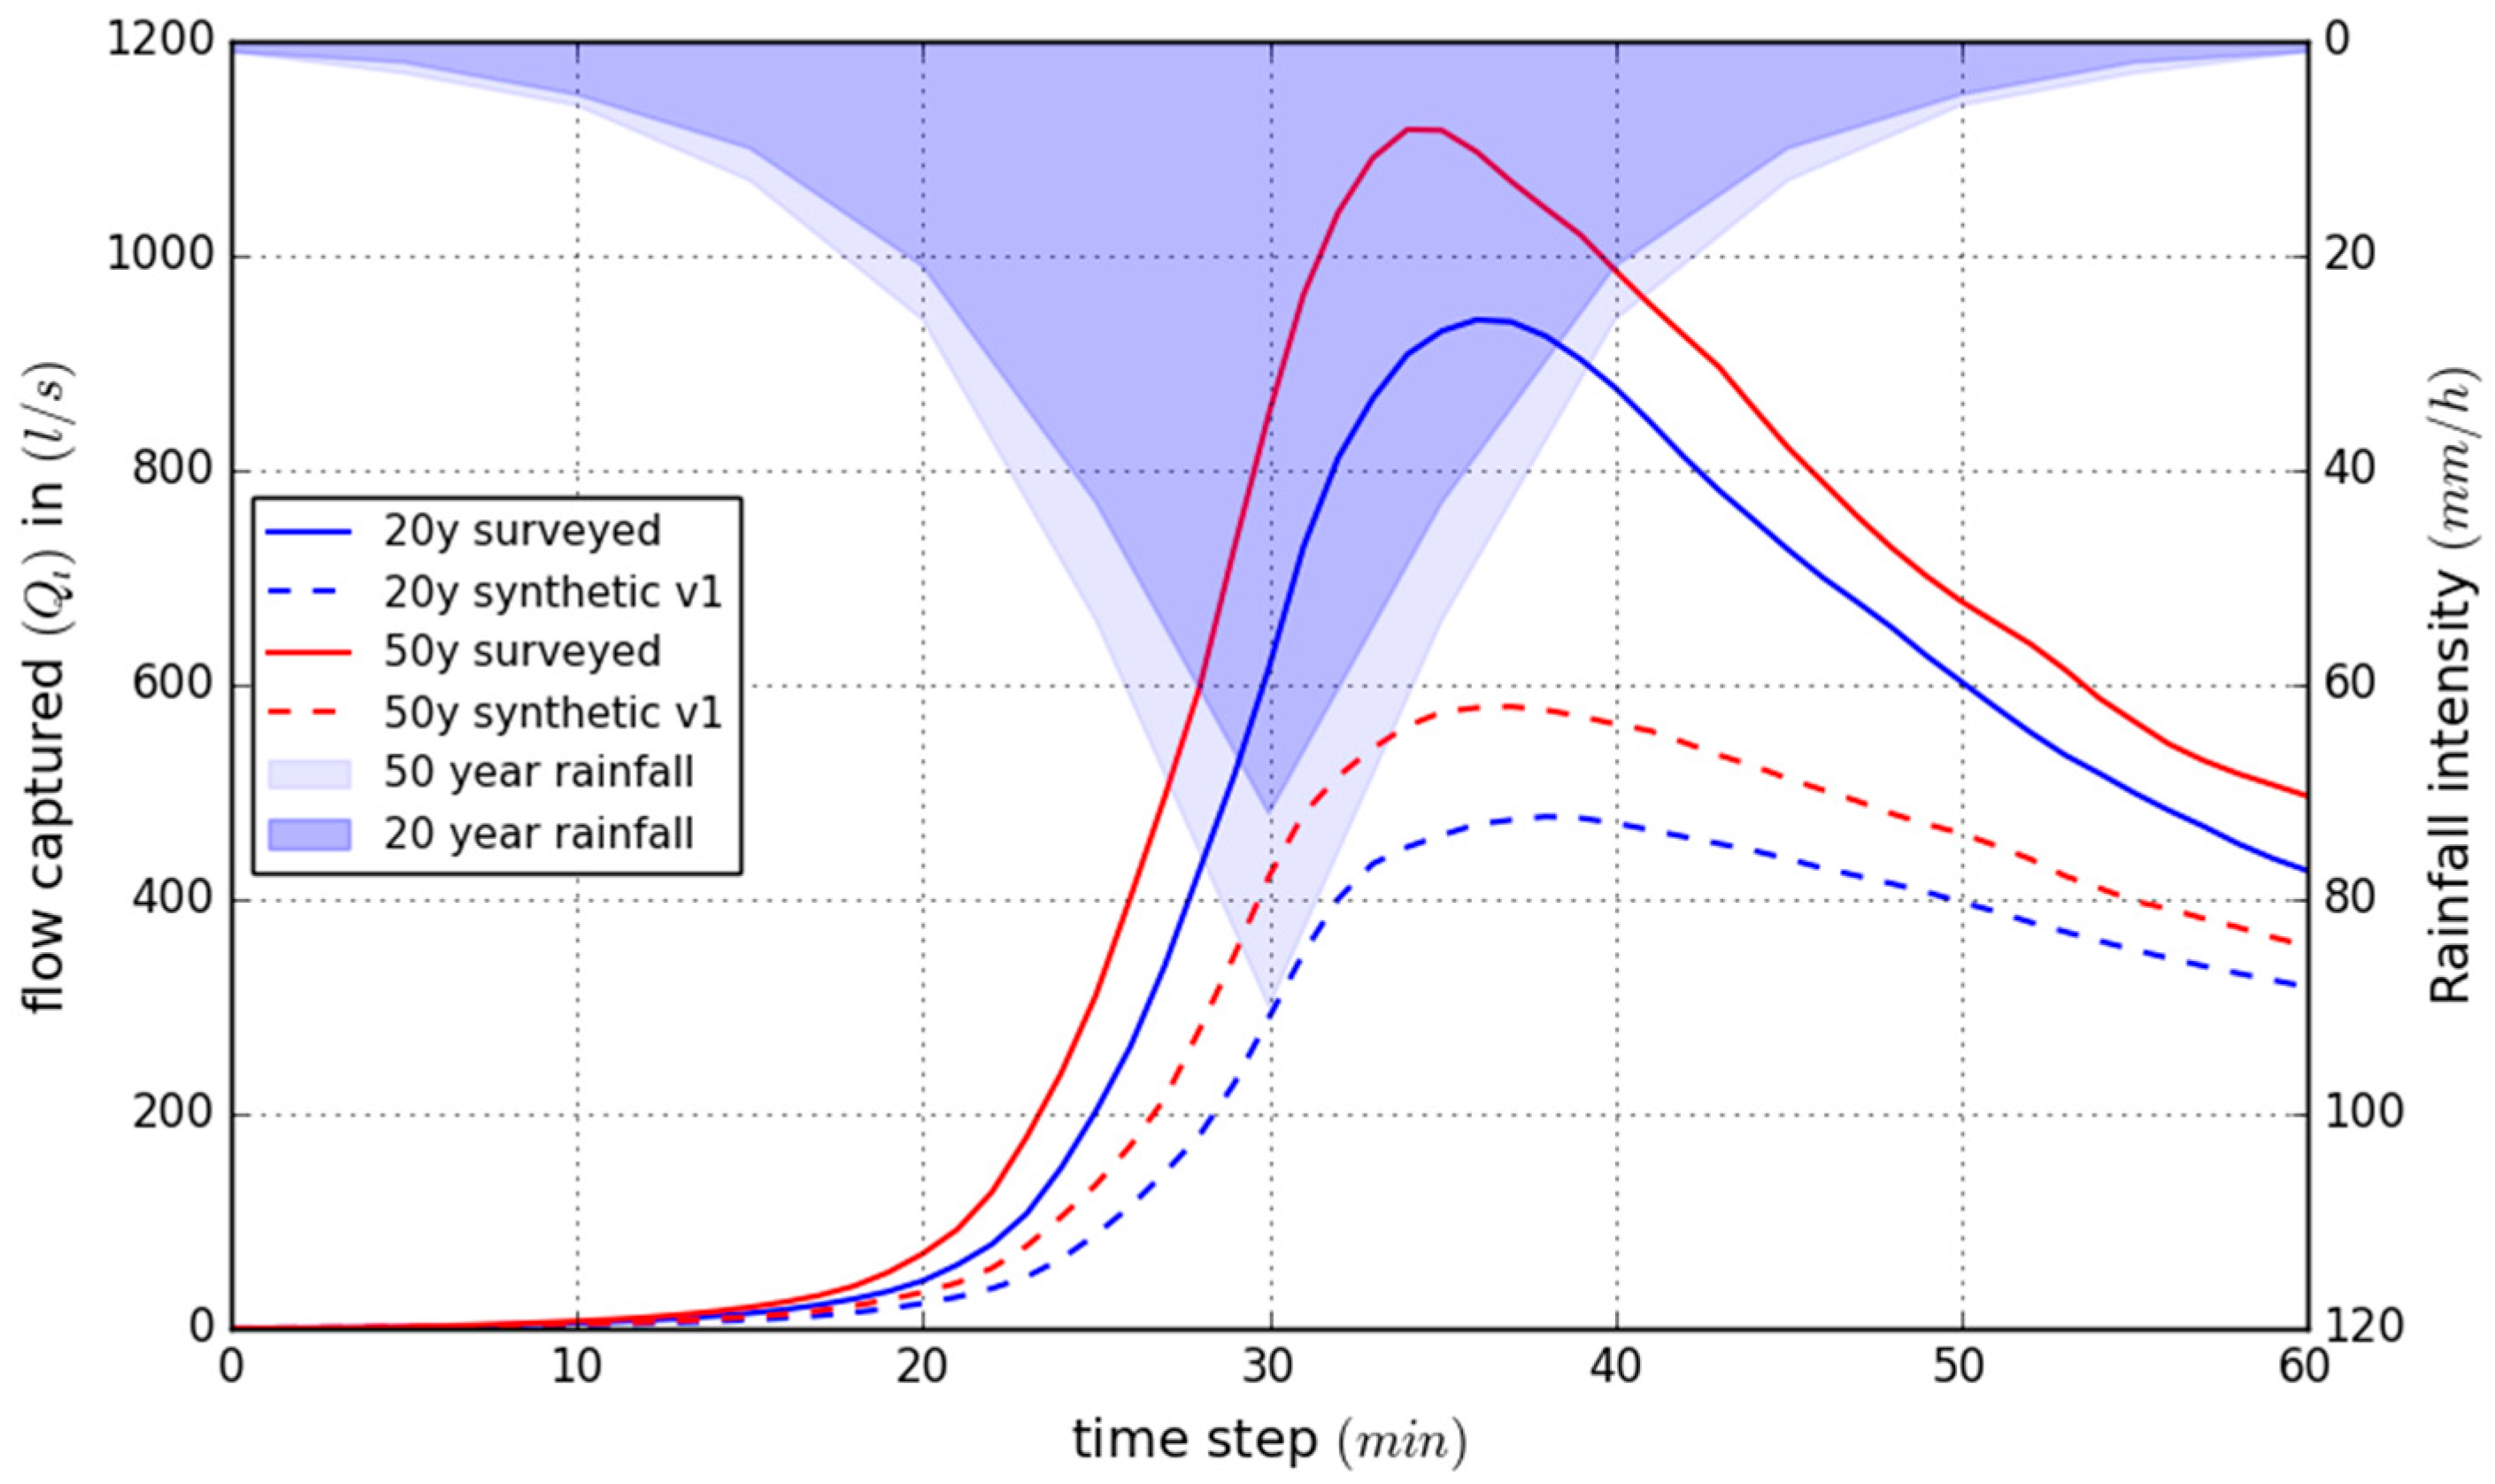
2. Buildings and green areas were extracted from MasterMap topography data. The 20 and 50 year return period storm event of 60 minutes duration applied (
Figure 4) were generated using the Flood Estimation Handbook (FEH) procedure [
37]. Surface roughness coefficients (Manning’s n values) of 0.02 and 0.035 for impermeable, and permeable surfaces were applied, respectively. The model uses an adaptive time step algorithm in order to satisfy the Courant number condition. In this application, the time steps are fractions of a second and each simulation took approximately 29 h to complete on a server with an Intel Xeon processor at 2.6 GHz using 8 cores and DDR4 memory.
Based on interviews with the Local Council, Scottish Water, and residents during the field survey, it was found that the hydrodynamic model results identified most areas that had been affected from pluvial flooding in recent years. Detailed investigations into the simulated and observed inundation depths, however, were limited due to a lack of detailed data, and are therefore not presented in this study.
3.4. Preliminary Results
As shown in
Figure 3, the initial GIS routine produced 376 storm drain inlets in comparison to the 445 surveyed ones. There are two reasons that are thought to be responsible for this difference. As described earlier, newly built area drainage networks are designed to accommodate larger storm runoff volume. The area highlighted in
Figure 3b is a newly built area with a much greater density of storm drain inlets in comparison to the overall catchment. The second reason is the small scale terrain depression, which quickly results in an accumulation of surface water. Those areas are sometimes referred to as in-sag locations [
26], which would see additional inlets installed to cope with the surplus of water.
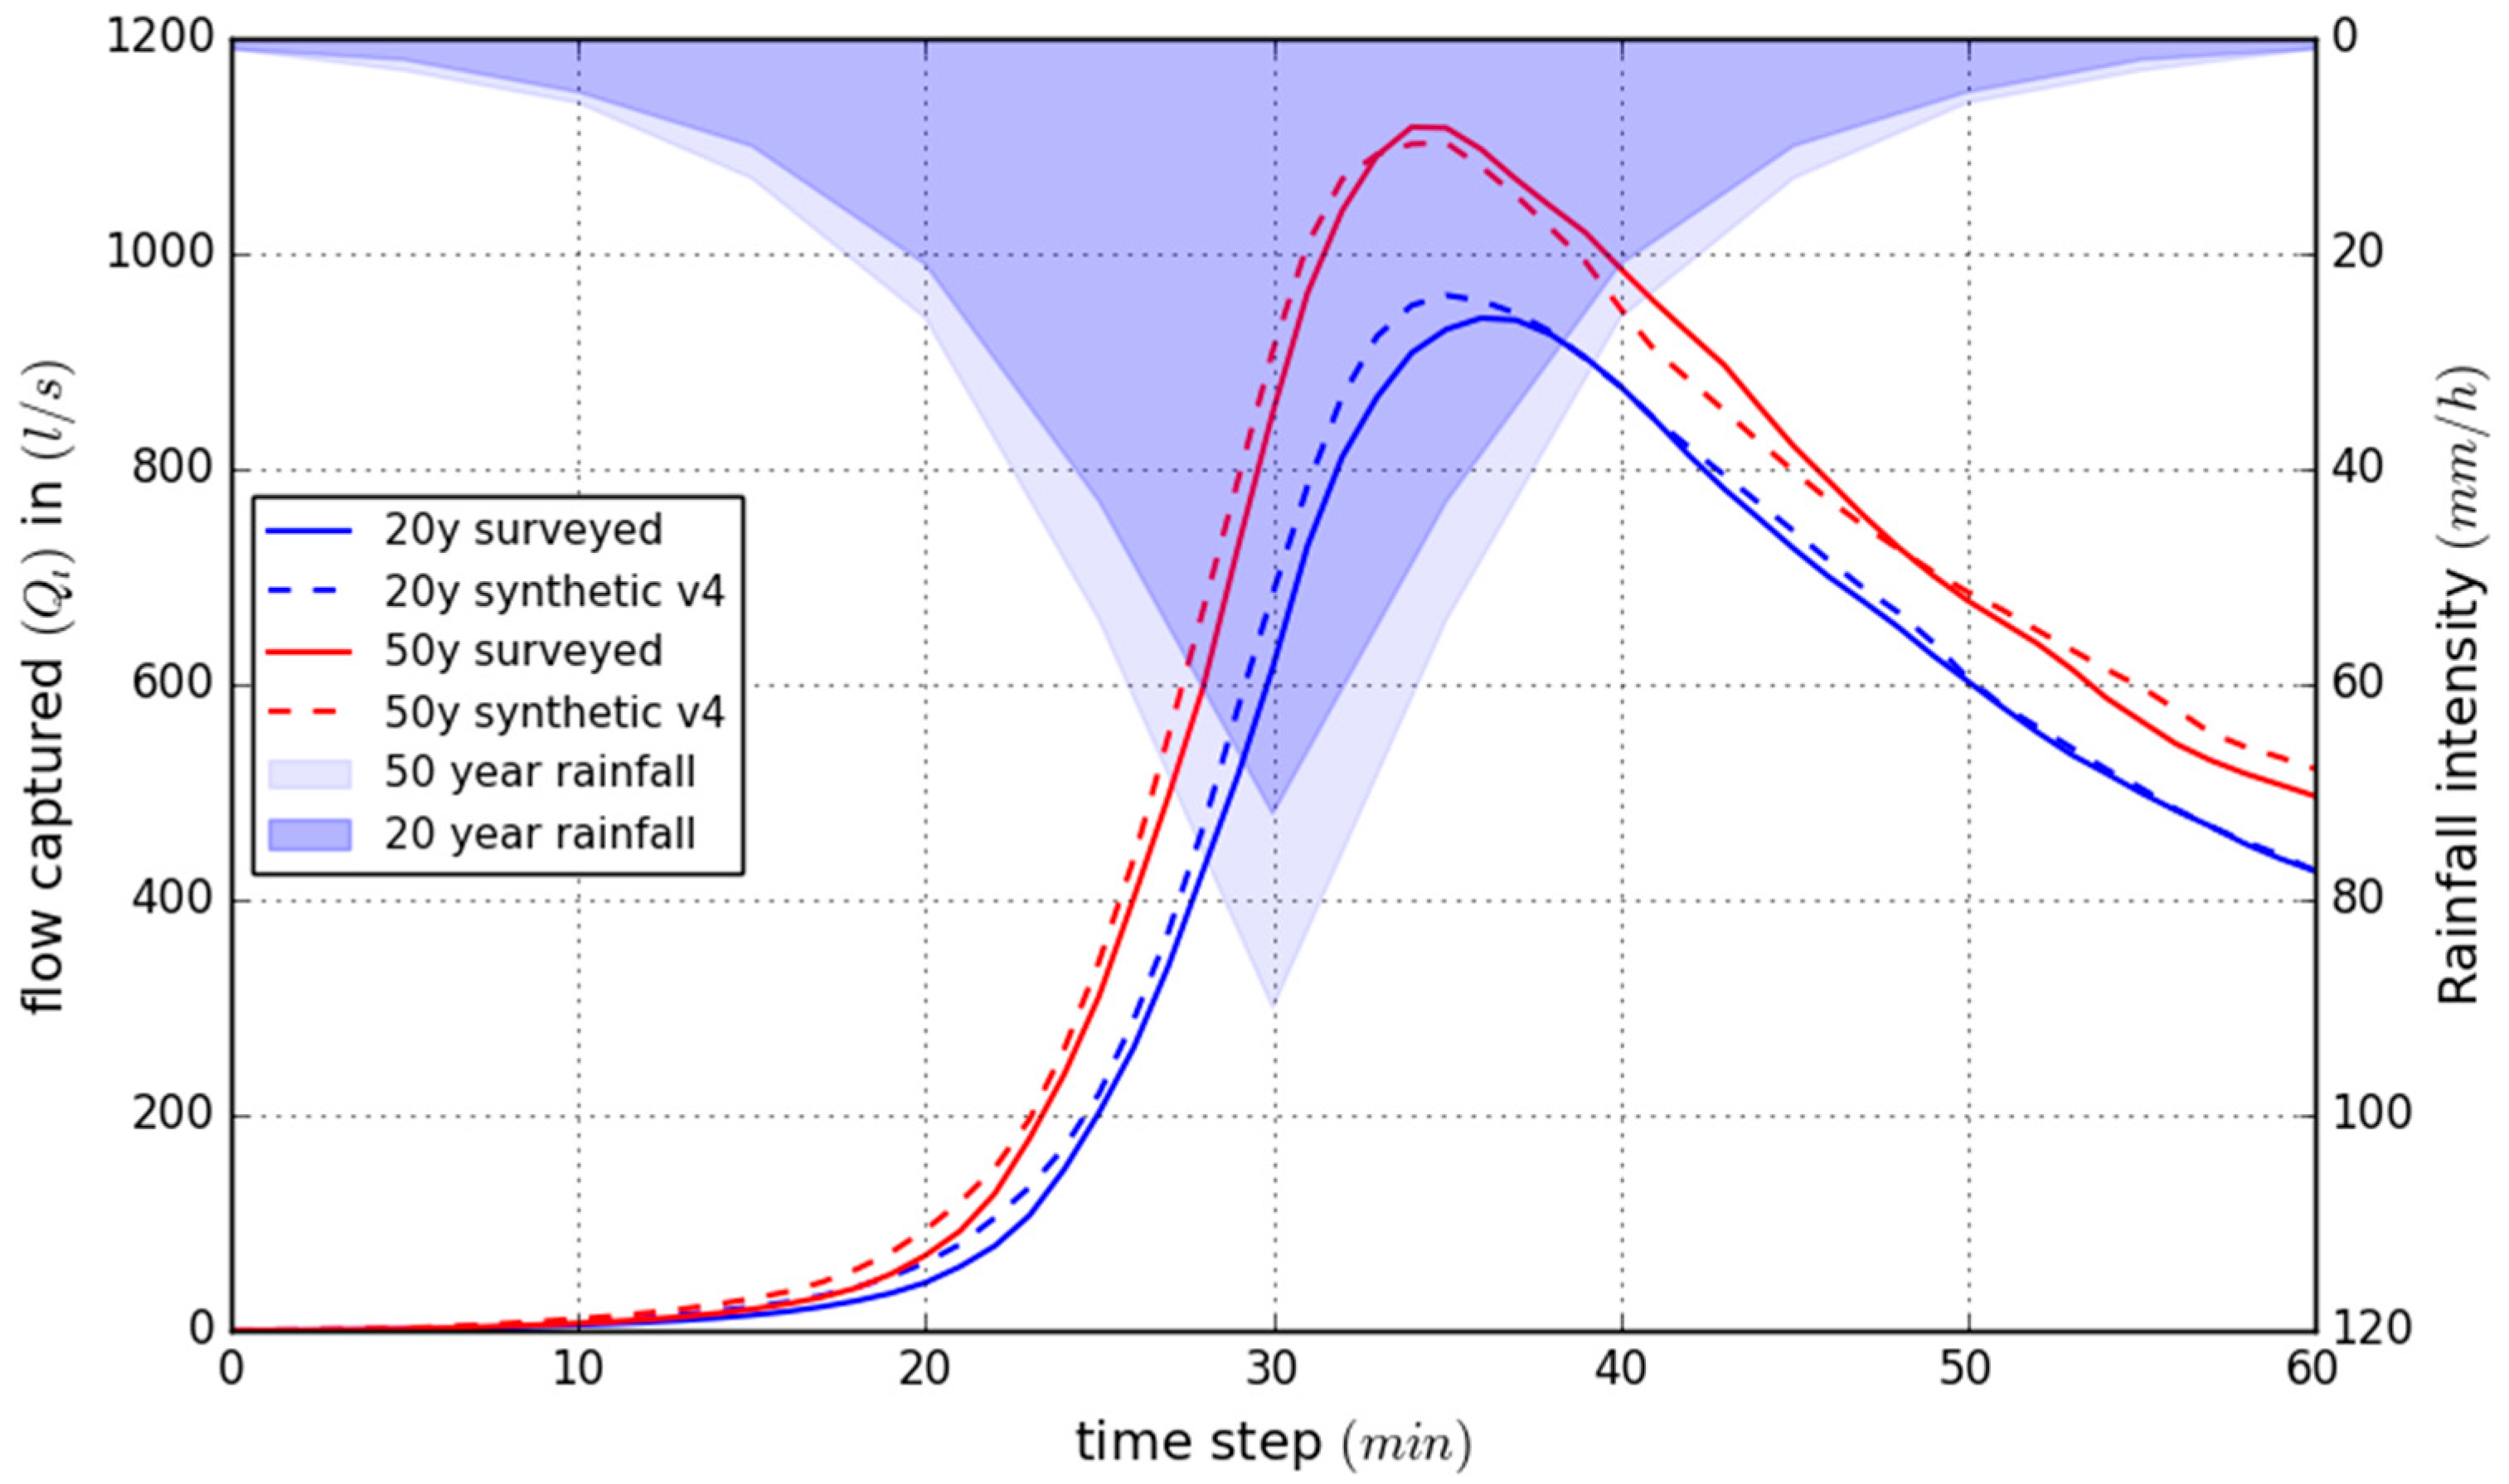
The network drainage efficiency has been assessed by calculating the inflow volumes for the network at each time step in CityCAT. The initial network, with fewer storm drain inlets and not specifically accounting for ponding areas results in a clear under-representation of the captured flow (Qi) by the storm drain inlets (
Figure 4). The flow captured (Qi) represents the portion of flow entering the storm drain inlets and is the difference between the flow approaching a storm drain inlet and the pass-over flow [
19]. The graph in
Figure 4 shows the total volume of water that is drained by all storm drain inlets for the synthetic and surveyed storm drain inlet networks for both of the storm events.
Figure 4 not only shows an under-representation of the captured flow, but also a later onset of drainage when comparing the synthetic storm drain inlets with the actual ones.
4. Adaptations to Initial GIS Routine
Based on the preliminary results, it becomes evident that adaptations to the initial GIS routine are required. Those adaptations should aim to better approximate the total number of storm drain inlets, as well as the drainage performance of a synthetically generated storm drain inlet network. Terrain information is likely to be crucial, so the adaptions made focus on the following aims:
Increase the total number of synthetic storm drain inlets to match the actual number
Increase the drainage efficiency of synthetic storm drain inlets by re-distributing them applying terrain information
Increase the drainage capacity within surface water accumulation areas by adding more synthetic storm drain inlets
4.1. Storm Drain Inlet Density
In order to increase the total number of storm drain inlets, it was decided to specifically address areas that were built under more recent building standard. As outlined initially, the drainage network and its capacity within those areas is likely to have been designed to cope with larger runoff volumes when compared to older ones. It is therefore required to understand which areas across the catchment are relatively newly built. The spacing of storm drain inlets within those areas of interest (AOI) is subsequently reduced in order to increase the storm drain inlet density. For this purpose, the reference line inside the AOI was separated from the rest. Any existing synthetic storm drain inlet from the first network version that was found to be inside the AOI was deleted. Subsequently, new storm drain inlets were placed at a spacing of 20 m. Finally, the storm drain inlets from the AOI were merged with the remaining storm drain inlets from the first version.
4.2. Adjusting the Locations of Storm Drain Inlets
Apart from having too few storm drain inlets, the preliminary model results also suggested that the initially placed storm drain inlets are insufficient in terms of their drainage. It was therefore decided to re-distribute the initially placed storm drain inlets to lower elevated cells within the immediate surrounding of the storm drain inlets. First, a 3 m buffer was created around each storm drain inlet to extract the reference line. Around each of those 6 m long sections a second buffer area with a distance of 1.5 m was created (
Figure 5b). Within each of those buffer areas the lowest terrain point was identified (
Figure 5b). Finally, the shortest distance between the lowest terrain point and the reference line was calculated in order to identify the final location of the adjusted storm drain inlet (
Figure 5c).
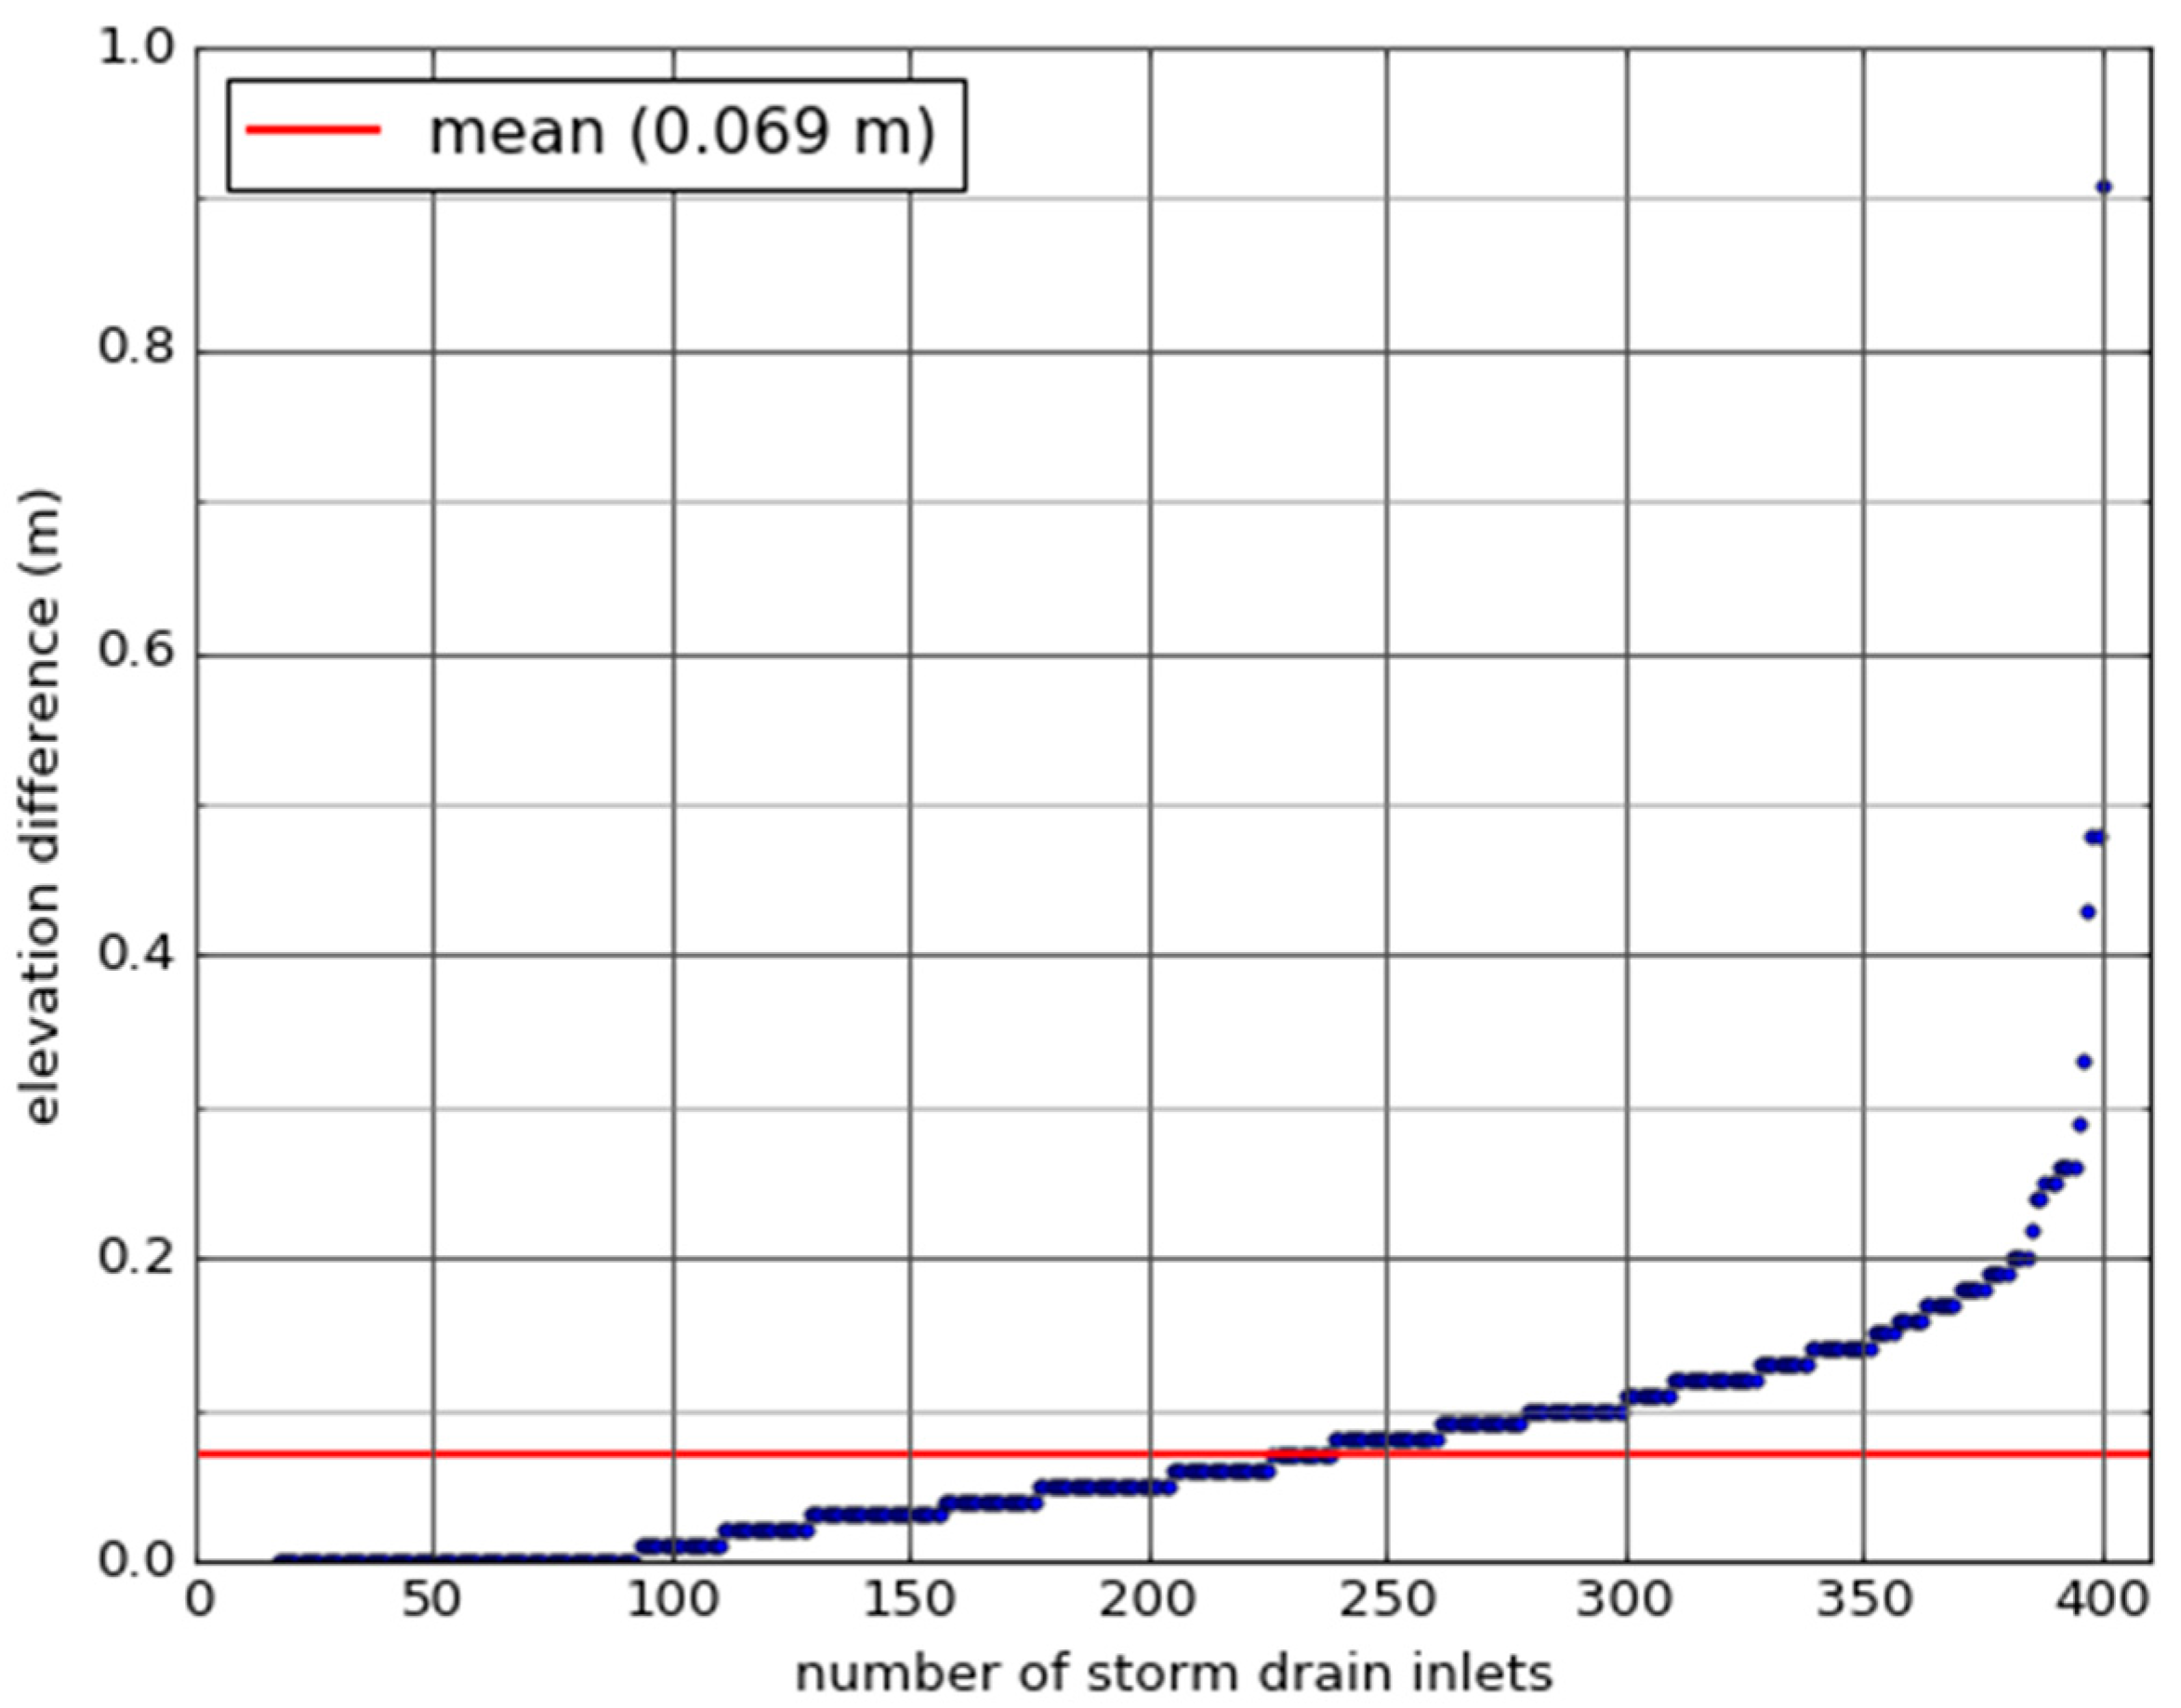
Based on the criteria outlined above an adjusted storm drain inlet can be at a maximum distance of 4.5 m to its initial one. The more important change between the initial and adjusted storm drain inlet, however, is the difference in their elevation. A comparison between the terrain elevation at the initial location and the adjusted one found an average drop in elevation of 6.9 cm (
Figure 6). The maximum drop in elevation between an initial and adjusted inlet is 0.91 m. At that location, the elevation of the initial storm drain inlet was affected by an embankment feature close to the road.
4.3. Surface Water Accumulation Areas
The final improvement made to the initial GIS routine concerns surface water accumulation areas. In reality, those areas of local terrain depressions would likely have more storm drain inlets that are installed to cope with the surplus of water. To add additional storm drain inlets, areas of depression had to be identified first. For this purpose model results obtained from a CityCAT 2D (surface only) simulation were applied. The simulation was run for a 20-year return period on a 2 m LiDAR grid and included buildings as well as green areas. The results of the final time step (after 60 minutes) were subsequently used.
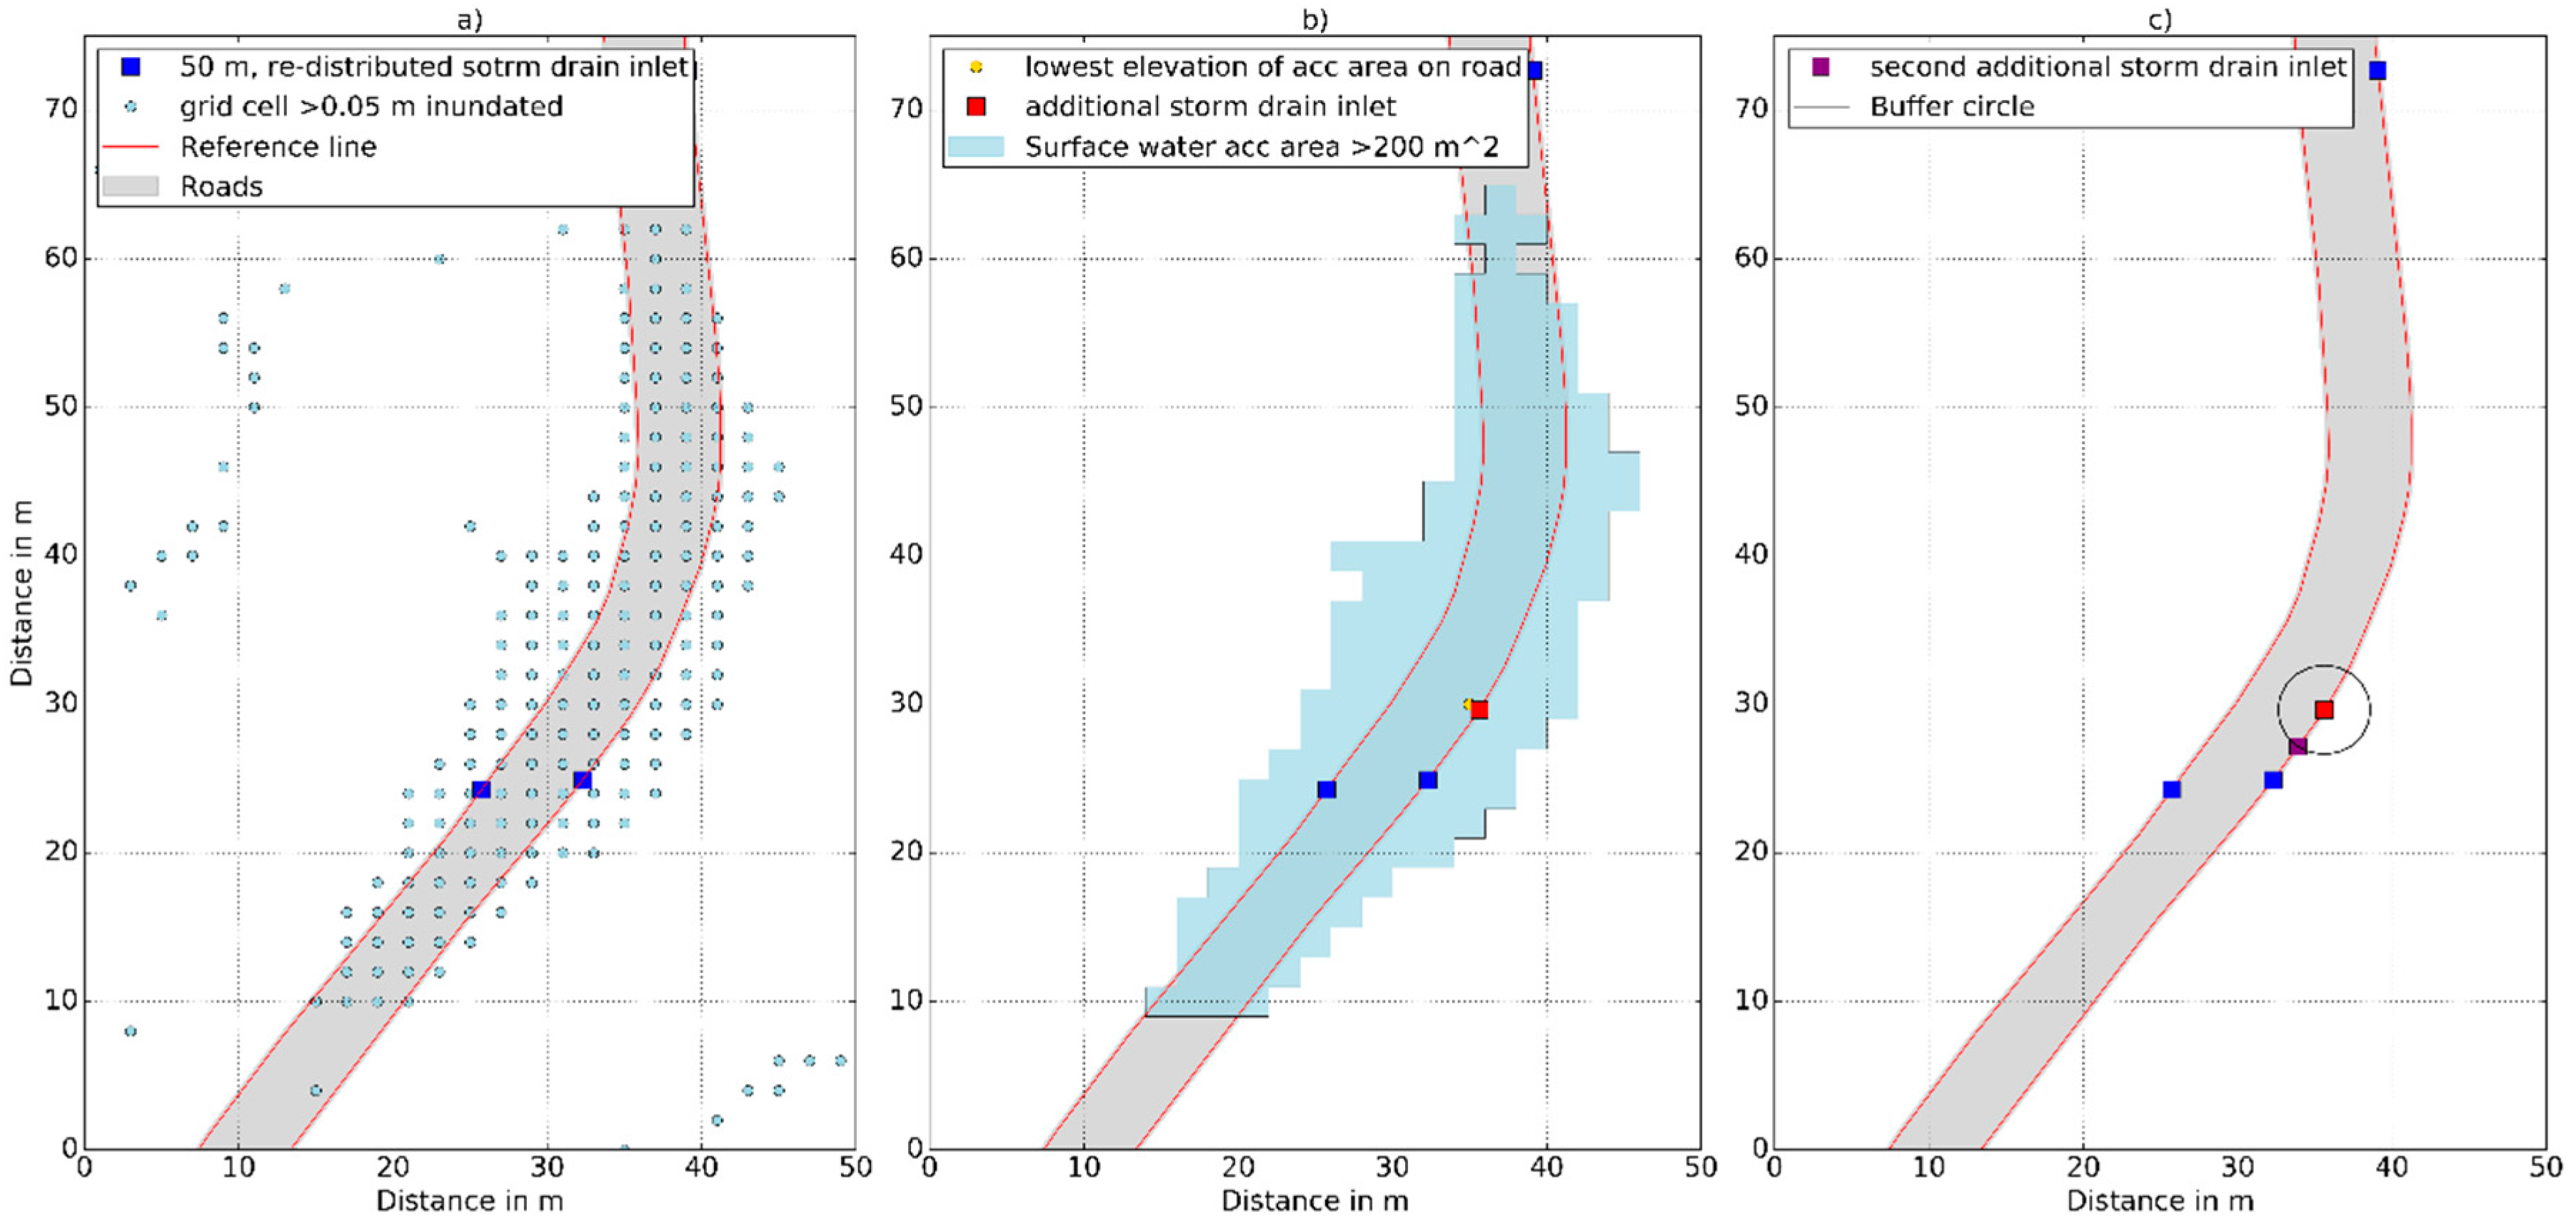
In a first step, all of the cells with an inundation depth ≥0.05 m were merged together to form continuous polygons (
Figure 7a,b). Any polygon with an area < 200 m
2 and not intersecting with the reference line were discarded. For each polygon left the lowest terrain point inside the road polygon was identified (
Figure 7b). The threshold values of 0.05 m and 200 m
2 are thought to be a reasonable combination to reflect the actual surface water ponding areas and not being misguided by potential erroneous terrain data. Subsequently, at the shortest distance between the lowest terrain point and the reference line, an additional storm drain inlet was placed (
Figure 7b). Around this storm drain inlet, a buffer with a distance of 150% of the terrain resolution was created (
Figure 7c). At the lower lying intersection point of this buffer line with the reference line a second additional storm drain inlet was added (
Figure 7c). Adding a second storm drain inlet aims to reflect so called twin-gullies, which are commonly installed in sag locations [
26].
5. Results and Discussion
5.1. Final Synthetic Storm Drain Inlet Network
Applying all of the adaptions outlined to the initially introduced case study area the final synthetic storm drain inlet network presented in
Figure 8 consists of 443 storm drain inlets. In comparison to the 376 and 445 storm drain inlets of the initial synthetic network and surveyed one, respectively, the adaptations show a substantial improvement in terms of the number of storm drain inlets.
In order to compare the hydraulic performance of the synthetic storm drain inlet network against the surveyed, two different sets of results are presented in the following looking at:
5.2. Surface/Sub-Surface Domain Interface: Water Volume Flow in Storm Drain Inlets
In comparison to the preliminary results (
Figure 4), the final synthetic network model shows a significant improvement (
Figure 9) in terms of the drainage efficiency when compared with the surveyed network model, in terms of both the total volume drained and the shape and timing of the inflow hydrograph (Qi). The results shown in
Figure 9 highlight the significance of the adaptions that were made to the GIS routine and especially the incorporation of terrain information to re-position the inlets. As described earlier, the average elevation difference between the initial and adjusted storm drain inlet of 6.9 cm was relatively small, suggesting that together with the 42 storm drain inlets added in surface water accumulation areas, the system drainage performance is quite sensitive to small scale topographical changes and positioning. These issues are also highlighted in other studies [
38,
39].
5.3. Surface Water Domain: Inundation Depth on Grid
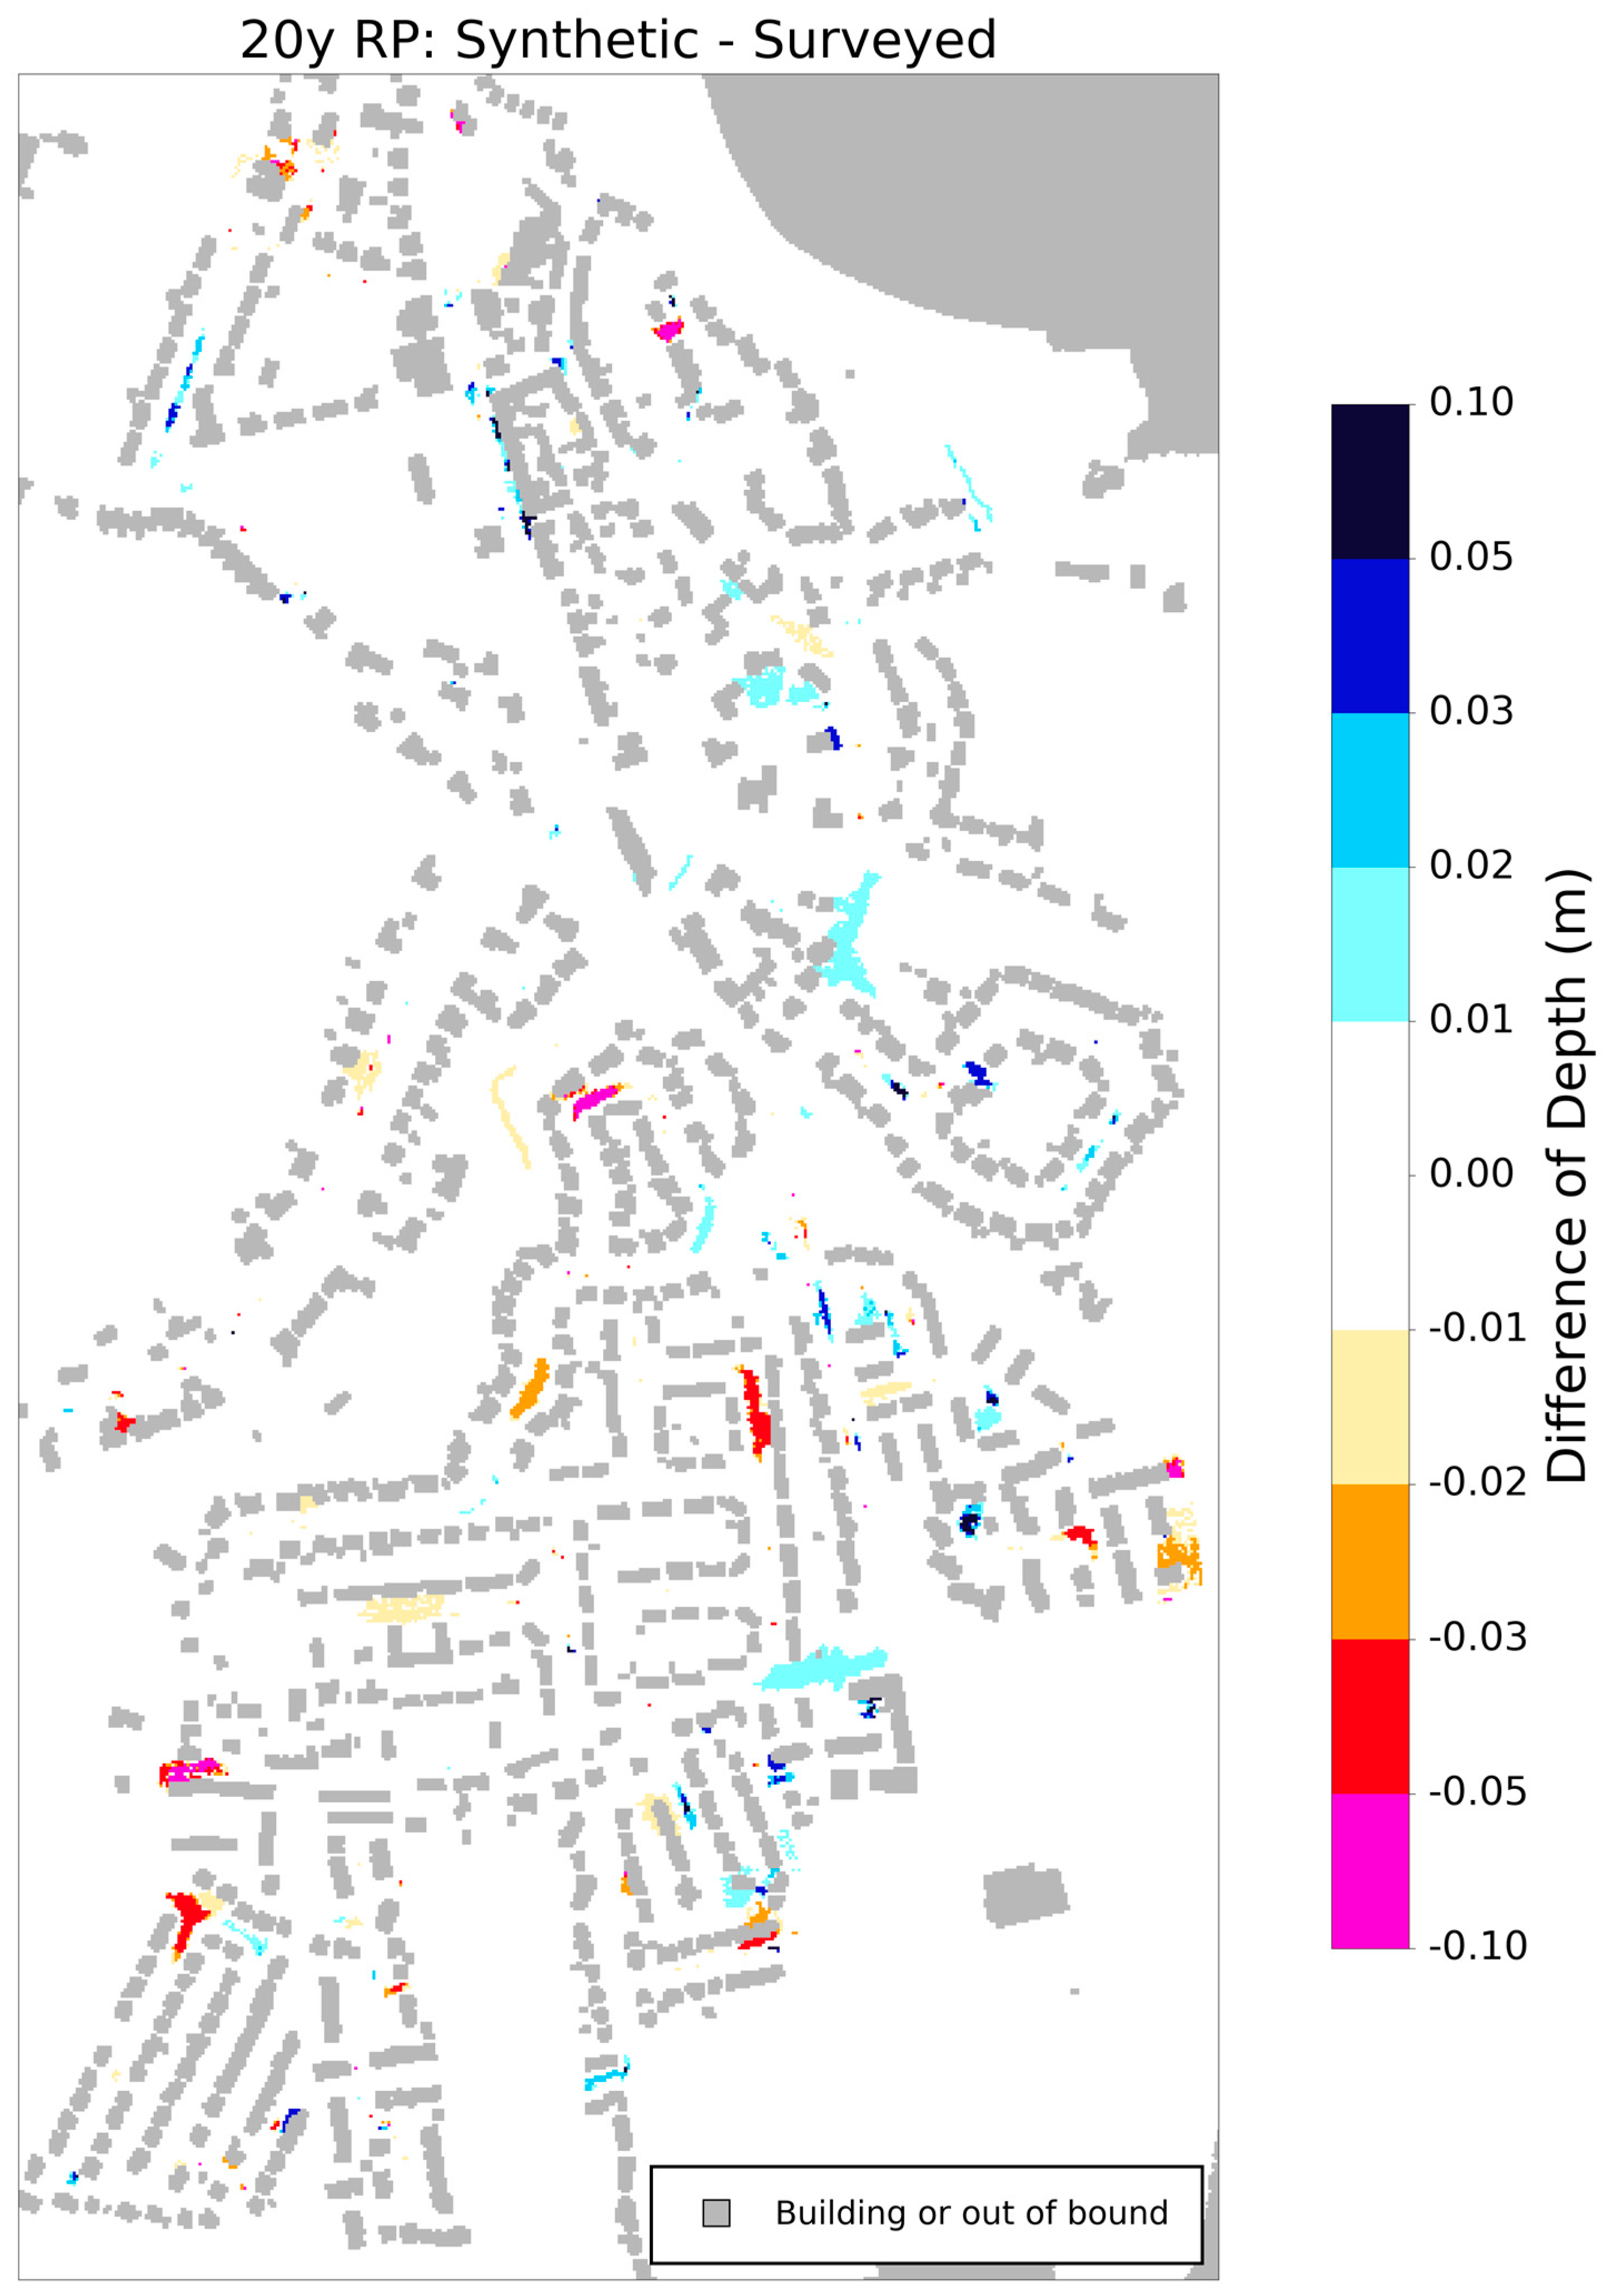
The final results that are presented investigate the impact of the different storm drain inlet networks on the surface water inundation depth. The map in
Figure 10 was produced by subtracting the maximum surface water grid obtained for the simulation using the surveyed storm drain inlet network from that using the synthetic network. Only the results for the 20-year storm event are presented.
A negative difference indicates a greater surface water depth for the simulation based on the surveyed storm drain inlet network when compared to the one that is obtained from the simulation using the synthetic storm drain inlet network. Whereas, a positive difference means a greater surface water depth for the simulation based on the surveyed storm drain inlet network.
Overall, the differences in surface water depth mostly range between −0.01 and 0.01 m, respectively. Areas with a difference in surface water depth beyond −0.01 m and 0.01 m are scattered across the entire catchment. For a majority of those areas, the absolute difference in surface water depth is within 0.05 m. On a catchment level, the results shown in
Figure 10 can be considered satisfactory in terms of the surface water drainage that is achieved by the synthetic storm drain inlet network. The results also underline the significance of storm drain inlets that are situated in surface water accumulation areas. At the same time, this highlights the critical aspect of over-estimating the number of synthetic storm drain inlets added in surface water accumulation areas.
6. Conclusions
A GIS routine was developed, allowing the generation of a synthetic storm drain inlet network for the purpose of fully coupled 1D/2D urban flood modelling using CityCAT [
17]. Simultaneously, actual storm drain inlet locations were surveyed during a field survey for validation and calibration purposes. Preliminary modelling results for a case study in Scotland using the simplest design assumptions based on a synthetic storm drain inlet every 50 m revealed an under-representation of the total flow captured when compared against a surveyed storm drain inlet network (
Figure 4). Consequently, improvements to the GIS routine were made in order to account for higher densities of storm drain inlets in specific areas, but more importantly, to include terrain information. This was achieved in two ways. Firstly, the initially placed storm drain inlets were re-located to lower lying neighboring cells. Secondly, two additional storm drain inlets were added in areas of calculated surface water accumulation.
The updated model results showed significant improvements in terms of the flow that was captured (
Figure 9) and the remaining surface water inundation depths on a catchment level (
Figure 10). The GIS method developed therefore provides a reasonable and robust way of generating synthetic storm drain locations at relatively low costs when compared to field work. The results also stress the significance of having high-resolution terrain data since the re-distribution of storm drain inlet locations was conducted on a micro scale level. The resulting maximum horizontal and average vertical shift of 4.5 and 0.069 m, respectively, led to a considerable increase in the flow that was captured, and therefore highlight the sensitivity of the drainage efficiency to relatively small changes in the location and elevation of storm drain inlets.
Despite the results that were achieved, a synthetically generated storm drain inlet network should only be considered as a first iteration towards the final storm drain inlet network that is applied in a 1D/2D simulation. Particularly for critical locations, such as surface water accumulation areas, or when studying the impact of clogged or blocked storm drain inlets, it is necessary to have the exact location of a storm drain inlet. Also, when conducting detailed surface–sub-surface flow pathway analysis, the application of surveyed storm drain inlets is recommended. Having the capabilities of conducting such detailed analysis in CityCAT underlines at the same time the benefits of having a generic way of generating a synthetic network of storm drain inlets. As shown in this work, different densities of storm drain inlets can be generated for individual areas. Simultaneously, single storm drain inlets could be added or removed. Changing inlet densities and locations together with pipe dimensions could be applied in future work to evaluate not only the hydraulic, but also the cost implications, which was beyond the scope of this work.
Generally, more studies are required in order to validate the hydrodynamic results presented against measured flow data of actual storm events. This would allow for a wider and systematic sensitivity analysis addressing the location and spatial density of storm drain inlets, as well as the impact of their geometry and blockages. Critically, the GIS routine should also be applied and tested on urban catchments with different characteristics in terms of size, topography, etc. to avoid a potential over-calibration towards the catchment tested in this work. In general, further research in this area could focus on two things. Firstly, on improving the GIS routine that is developed in this work. This could range from including additional data or applying different means of placing the storm drain inlets by using more sophisticated statistical analysis tools. Secondly, moving away from the synthetic network to find different ways of recording the actual locations of storm drain inlets. Surveyed inlet locations are preferred in order to replicate the complex hydraulics of the actual urban drainage system. Methods to generate synthetic inlet locations are informed by design standards that may have changed over time and are often unique to specific locations. Furthermore, certain situations in reality might require adaptation of the design and planning standard in order to place storm drain inlets. Such locations are difficult to capture with a generic method for generating synthetic storm drain inlet locations. From a practical perspective, storm drain inlet locations could be collected as part of drainage maintenance work or other regular work that is carried out on roads. Alternatively, an automated process could be developed allowing for a detection of storm drain inlet locations based on photo-interpretation of the application of Google Street View images, similar to algorithms that are applied for face or license plate recognition [
40].
Acknowledgments
This work has been funded by Scottish Water and the Engineering and Physical Science Research council (EPSRC) as part of grant 1368347 of Centre for Doctoral Training in Engineering for the Water Sector (STREAM, EP/L015412/1). Funding was also provided by two EPSRC projects, ITRC MISTRAL: Multi-scale Infrastructure Systems Analytics (EP/N017064/1) and Future Urban Flood Risk Management (EP/P004334/1). The authors gratefully acknowledge Dawn Lochhead, Bob Fleming, Dom McBennett (all Scottish Water) and Russell Stewart, Perth & Kinross Council for providing data and valuable expertise. Martin Robertson, Newcastle University provided invaluable technical support on the surveying aspects.
Author Contributions
R.B., V.G. and C.K. conceived the problem and established the concept behind the tool; R.B. developed the method; V.G. performed the modelling in CityCAT 1D/2D; R.B. analyzed the data; R.B. conducted the field survey of inlets; R.B., V.G. and C.K. wrote the paper.
Conflicts of Interest
The authors declare no conflict of interest.
References
- Leandro, J.; Djordjević, S.; Chen, A.S.; Savić, D. The use of multiple-linking-element for connecting sewer and surface drainage networks. In Proceedings of the 32th Congress of IAHR Harmonizing the Demands of Art and Nature in Hydraulics, Venice, Italy, 1–6 July 2007; Volume 32, p. 204. [Google Scholar]
- Djordjević, S.; Prodanović, D.; Maksimović, Č. An approach to simulation of dual drainage. Water Sci. Technol. 1999, 39, 95–103. [Google Scholar] [CrossRef]
- Schmitt, T.G.; Thomas, M.; Ettrich, N. Analysis and modeling of flooding in urban drainage systems. J. Hydrol. 2004, 299, 300–311. [Google Scholar] [CrossRef]
- Schmitt, T.G.; Thomas, M.; Ettrich, N. Assessment of urban flooding by dual drainage simulation model RisUrSim. Water Sci. Technol. 2005, 52, 257–264. [Google Scholar] [PubMed]
- Leandro, J.; Lopes, P.; Carvalho, R.; Páscoa, P.; Martins, R.; Romagnoli, M. Numerical and experimental characterization of the 2D vertical average-velocity plane at the center-profile and qualitative air entrainment inside a gully for drainage and reverse flow. Comput. Fluids 2014, 102, 52–61. [Google Scholar] [CrossRef]
- Butler, D.; Davies, J.W. Urban Drainage, 3rd ed.; Spon Press: Oxon, UK, 2011; ISBN 978-0-415-45526-8. [Google Scholar]
- Tan, W. Shallow Water Hydrodynamics: Mathematical Theory and Numerical Solution for a Two-Dimensional System of Shallow Water Equations; Tan, W., Ed.; Elsevier Oceanography Series; Elsevier: Amsterdam, The Netherlands, 1992; ISBN 978-0-444-98751-8. [Google Scholar]
- Toro, E.F. Shock-Capturing Methods for Free-Surface Shallow Flows; Wiley: Hoboken, NJ, USA, 2001; ISBN 978-0-471-98766-6. [Google Scholar]
- Bourdarias, C.; Ersoy, M.; Gerbi, S. A mathematical model for unsteady mixed flows in closed water pipes. Sci. China Math. 2012, 55, 221–244. [Google Scholar] [CrossRef]
- Innovyze Infoworks ICM. Available online: http://innovyze.com/products/infoworks_icm/ (accessed on 18 August 2017).
- Preissmann, A. Propagation des intumescences dans les canaux et rivieres. In Proceedings of the First French Association for Computation, Grenoble, France, 14–16 September 1961; pp. 433–442. [Google Scholar]
- Cunge, J.A.; Wegner, M. Intégration numérique des équations d’écoulement de barré de Saint-Venant par un schéma implicite de différences finies. La Houille Blanche 1964, 1, 33–39. [Google Scholar] [CrossRef]
- Innovyze Modelling of Pressurised Pipes within InfoWorks ICM and CS. Available online: http://blog.innovyze.com/wp-content/uploads/2013/02/Modelling_of_Pressurised_Pipes_within_InfoWorks_ICM_and_CS.pdf (accessed on 18 August 2017).
- Pina, R.D.; Ochoa-Rodriguez, S.; Simões, N.E.; Mijic, A.; Marques, A.S.; Maksimović, Č. Semi- vs. Fully-distributed urban stormwater models: Model set up and comparison with two real case studies. Water 2016, 8, 58. [Google Scholar] [CrossRef]
- Maksimovic, C.; Prodanovic, D. Modelling of Urban Flooding—Breakthrough or Recycling of Outdated Concepts. In Urban Drainage Modeling; American Society of Civil Engineers: Reston, VA, USA, 2001; pp. 1–9. [Google Scholar]
- Djordjevic, S.; Prodanovic, D.; Maksimovic, C.; Ivetic, M.; Savic, D. SIPSON—Simulation of Interaction between Pipe flow and Surface Overland flow in Networks. Water Sci. Technol. 2005, 52, 275–283. [Google Scholar] [PubMed]
- Glenis, V.; McGough, A.S.; Kutija, V.; Kilsby, C.; Woodman, S. Flood modelling for cities using Cloud computing. J. Cloud Comput. Adv. Syst. Appl. 2013, 2, 14. [Google Scholar] [CrossRef]
- Glenis, V.; Kutija, V.; Kilsby, C.G. City Catchment Analysis Tool—CityCAT. Environ. Model. Softw. 2017. under review. [Google Scholar]
- Despotovic, J.; Plavsic, J.; Stefanovic, N.; Pavlovic, D. Inefficiency of storm water inlets as a source of urban floods. Water Sci. Technol. 2005, 51, 139–145. [Google Scholar] [PubMed]
- Leandro, J.; Chen, A.S.; Djordjević, S.; Savić, D.A. Comparison of 1D/1D and 1D/2D Coupled (Sewer/Surface) Hydraulic Models for Urban Flood Simulation. J. Hydraul. Eng. 2009, 135, 495–504. [Google Scholar] [CrossRef]
- Argaman, Y.; Shamir, U.; Spivak, E. Design of Optimal Sewerage Systems. J. Sanit. Eng. Div. 1973, 99, 703–716. [Google Scholar]
- Diogo, A.F.; Graveto, V.M. Optimal Layout of Sewer Systems: A Deterministic versus a Stochastic Model. J. Hydraul. Eng. 2006, 132, 927–943. [Google Scholar] [CrossRef]
- Guo, Y.; Walters, G.A.; Khu, S.T.; Keedwell, E. A novel cellular automata based approach to storm sewer design. Eng. Optim. 2007, 39, 345–364. [Google Scholar] [CrossRef]
- Möderl, M.; Butler, D.; Rauch, W. A stochastic approach for automatic generation of urban drainage systems. Water Sci. Technol. 2009, 59, 1137–1143. [Google Scholar] [CrossRef] [PubMed]
- Guo, Y.; Walters, G.; Savic, D. Optimal design of storm sewer networks: Past, Present and Future. In Proceedings of the 11th International Conference on Urban Drainage, Edinburgh, UK, 31 August–5 September 2008. [Google Scholar]
- Highways Agency. Design Manual for Roads and Bridges—Spacing of Road Gullies; Highways Agency: Guildford, UK, 2000; Volume 4. [Google Scholar]
- Spaliviero, F.; May, R.W.P.; Escarameia, M. Spacing of Road Gullies. Hydraulic Performance of BS EN 124 Gully Gratings and Kerb Inlets; Report SR 533; HR Wallingford: Oxfordshire, UK, 2000. [Google Scholar]
- Marsalek, J.; Barnwell, T.O.; Geiger, W.; Grottkert, M.; Huber, W.C.; Saul, A.J.; Schillingt, W.; Tornol, H.C. Urban Drainage Systems: Design and Operation. Water Sci. Technol. 1993, 27, 31–70. [Google Scholar]
- Delleur, J.W. The Evolution of Urban Hydrology: Past, Present, and Future. J. Hydraul. Eng. 2003, 129, 563–573. [Google Scholar] [CrossRef]
- Mailhot, A.; Duchesne, S. Design Criteria of Urban Drainage Infrastructures under Climate Change. J. Water Resour. Plan. Manag. 2010, 136, 201–208. [Google Scholar] [CrossRef]
- Fletcher, T.D.; Shuster, W.; Hunt, W.F.; Ashley, R.; Butler, D.; Arthur, S.; Trowsdale, S.; Barraud, S.; Semadeni-Davies, A.; Bertrand-Krajewski, J.-L.; et al. SUDS, LID, BMPs, WSUD and more—The evolution and application of terminology surrounding urban drainage. Urban Water J. 2015, 12, 525–542. [Google Scholar] [CrossRef]
- Almedeij, J.; Alsulaili, A.; Alhomoud, J. Assessment of grate sag inlets in a residential area based on return period and clogging factor. J. Environ. Manag. 2006, 79, 38–42. [Google Scholar] [CrossRef] [PubMed]
- Gómez, M.; Russo, B. Hydraulic Efficiency of Continuous Transverse Grates for Paved Areas. J. Irrig. Drain. Eng. 2009, 135, 225–230. [Google Scholar] [CrossRef]
- Gómez, M.; Russo, B. Methodology to estimate hydraulic efficiency of drain inlets. Proc. ICE Water Manag. 2011, 164, 81–90. [Google Scholar] [CrossRef]
- OS MasterMap Topography Layer [GML2 Geospatial Data], Scale 1:1250, Updated December 2014, Ordnancce Survey GB. Using: EDINA Digimap Ordnance Survey Service. Available online: https://digimap.edina.ac.uk/ (accessed on 1 June 2015).
- Leica Geosystems. Leica Viva GS15 Data Sheet. Available online: http://w3.leica-geosystems.com/downloads123/zz/gpsgis/viva%20gs15/brochures-datasheet/leica_viva_gs15_ds_en.pdf (accessed on 19 July 2017).
- Reed, D.W.; Robson, A.J. Flood Estimation Handbook; Centre for Ecology and Hydrology: Lancaster, UK, 1999. [Google Scholar]
- Aronica, G.T.; Lanza, L.G. Drainage efficiency in urban areas: A case study. Hydrol. Process. 2005, 19, 1105–1119. [Google Scholar] [CrossRef]
- Palla, A.; Colli, M.; Candela, A.; Aronica, G.T.; Lanza, L.G. Pluvial flooding in urban areas: The role of surface drainage efficiency. J. Flood Risk Manag. 2016. [Google Scholar] [CrossRef]
- Frome, A.; Cheung, G.; Abdulkader, A.; Zennaro, M.; Wu, B.; Bissacco, A.; Adam, H.; Neven, H.; Vincent, L. Large-scale privacy protection in Google Street View. In Proceedings of the 2009 IEEE 12th International Conference on Computer Vision, Kyoto, Japan, 29 September–2 October 2009; pp. 2373–2380. [Google Scholar] [CrossRef]
© 2017 by the authors. Licensee MDPI, Basel, Switzerland. This article is an open access article distributed under the terms and conditions of the Creative Commons Attribution (CC BY) license (http://creativecommons.org/licenses/by/4.0/).
