Abstract
Traditional (technical) concepts to ensure a reliable water supply, a safe handling of wastewater and flood protection are increasingly criticised as outdated and unsustainable. These so-called centralised urban water systems are further maladapted to upcoming challenges because of their long lifespan in combination with their short-sighted planning and design. A combination of (existing) centralised and decentralised infrastructure is expected to be more reliable and sustainable. However, the impact of increasing implementation of decentralised technologies on the local technical performance in sewer or water supply networks and the interaction with the urban form has rarely been addressed in the literature. In this work, an approach which couples the UrbanBEATS model for the planning of decentralised strategies together with a water supply modelling approach is developed and applied to a demonstration case. With this novel approach, critical but also favourable areas for such implementations can be identified. For example, low density areas, which have high potential for rainwater harvesting, can result in local water quality problems in the supply network when further reducing usually low pipe velocities in these areas. On the contrary, in high demand areas (e.g., high density urban forms) there is less effect of rainwater harvesting due to the limited available space. In these high density areas, water efficiency measures result in the highest savings in water volume, but do not cause significant problems in the technical performance of the potable water supply network. For a more generalised and case-independent conclusion, further analyses are performed for semi-virtual benchmark networks to answer the question of an appropriate representation of the water distribution system in a computational model for such an analysis. Inappropriate hydraulic model assumptions and characteristics were identified for the stated problem, which have more impact on the assessments than the decentralised measures.
1. Introduction
Modern urban water management faces challenges like climate change, urban development and aging infrastructure [1]. Restricted water resources and limited budgets force engineers, researchers and decision makers to rethink the way urban water is managed. Traditional (technical) concepts to ensure a reliable water supply, a safe handling of wastewater and flood protection are increasingly criticised as outdated and unsustainable [2]. These so-called centralised or grey urban water systems—encompassing e.g., piped potable water supply and sewer networks—are, furthermore, maladapted to upcoming challenges because of their long life-span in combination with their short-sighted planning and design. Their design and implementation can result in technological and institutional lock-in effects [3]. A combination of (existing) centralised and decentralised infrastructure is expected to be more reliable and sustainable [4] and can more readily be adapted to upcoming challenges. With regard to stormwater management, new, sustainable water management strategies, such as Sustainable Urban Drainage Systems (SUDS), Green Infrastructure (GI), Water Sensitive Urban Design (WSUD), Low Impact Urban Design and Development (LIUDD), Best Management Practice (BMP), etc., have been gaining increasing interest in recent years, particularly in water scarce regions [5]. It is increasingly recognised that the combination of decentralised and centralised solutions can provide required water services and that dispersed solutions can also provide liveability and sustainability benefits to the local community. Especially for potable water supply, water resources can be used more efficiently through e.g., local reuse or treatment and utilisation of local resources (e.g., greywater reuse or rainwater harvesting). These so-called hybrid water supply systems (a combination of centralised and decentralised technologies) are seen to be more sustainable and resilient, but also introduce complexity into the system by further interlinking drainage and supply.
A modern urban water cycle is a strongly interlinked system. However, in traditional management structures the different sub-disciplines in that cycle are often regarded separately, thus neglecting the complex interactions within such systems [6]. These neglected interactions have usually been of less interest because the interfaces between the sub-systems are more or less well-defined. In new management strategies, the consideration of these interactions is becoming more important and plays a crucial role in gaining confidence in the long-term technical operation of hybrid systems and the entire urban water cycle as part of the city [7,8]. The most important driver for urban water demand is the urban form. Bouziotas, et al. [9] developed a framework for linking the dynamics of the urban growth/form with the spatial distribution of the water demand for testing different water management practices following city evolution. This dynamic approach was further enhanced to also to distribute water-aware technologies [10].
In Sapkota, et al. [11], a conceptual framework was developed to assess the interactions between decentralised water supply systems and existing centralised management practices. In a case study application, it was shown how daily water demands are reduced and concentrations in wastewater flow are altered by implementing decentralised technologies. In that study it was also determined that the wastewater concentrations were increased and changes in peak flow (potable water and waste water) were negligible while the daily volumes were reduced.
In Bach, et al. [12,13] it is shown how the urban form and planning regulations interact with the implementation of decentralised systems. For decision-makers, it is important to understand the implications of different planning regulations on aspects like urban drainage or water supply at a local scale. The software tool UrbanBEATS (Urban Biophysical Environments and Technologies Simulator—www.urbanbeatsmodel.com), which emerged from this study, supports decision makers when planning and implementing such water sensitive strategies. The tool combines and processes spatial and non-spatial data (e.g., land use, population, elevation, rainfall/climate). Multiple benefits arise when following a decentralised rainwater handling strategy, such as the reduction or attenuation of stormwater peak discharges, preserving or at least encouraging a more natural water cycle, on-site treatment (i.e., controlling pollution at the source) or positive effects on the urban microclimate [14]. However, despite the multiple benefits, effects of such distributed infrastructures on the existing (mostly central) water infrastructure also need to be understood and accounted for. For combined urban drainage systems, there is generally a positive effect on hydraulic performance during wet weather events, but it is often neglected that a reduction in wastewater flows due to water reuse or water saving might negatively impact the shear stress performance in sewers, causing increased sedimentation and odour nuisance [15]. In Sitzenfrei and Rauch [16], a spatial sensitivity analysis was developed to quantify the potential impact of a reduction in potable water consumption on the shear stress performance in a combined sewer system and the water quality in the water supply network. Nevertheless, the spatial distribution of possible potable water reduction due to the land use has been neglected in that study. For water distribution systems (WDS), the implementation of decentralised rainwater harvesting or greywater reuse measures could strongly influence the water quality performance of the existing centralised system by reducing the water demand and increasing the travel time and, consequently, the water age in the supply system. However, the impact of increasing the implementation of decentralised technologies on the localised technical performance in potable water supply networks (e.g., stagnation, water quality) has not been analysed.
This paper aims to quantify the impact of ‘land use driven’ spatial distribution of decentralised technologies (i.e., hybrid water supply systems) on the technical performance of existing water supply networks. With this newly developed approach, the impact of demand reduction scenarios (i.e., rainwater harvesting to substitute private irrigation and water efficiency measures) determined with UrbanBEATS on the water quality can be simulated and are demonstrated in this paper on a case study. The interaction of the low density urban form (low total demand, minimal pipe diameters in the potable supply network) and the high rainwater harvesting potential (a lot of harvesting area in combination with green space for irrigation) was identified as significantly disadvantageous for the WDS, causing water quality problems in localised areas. In contrast, in high demand areas (the high density urban form), there is less potential for e.g., rainwater or stormwater harvesting due to the limited available space and, therefore, also the impact on the technical performance of the potable water supply network in these regions is less significant.
Furthermore, to establish a more generalised and case-independent conclusion, analyses were performed for semi-virtual benchmark networks [17]. In contrast to entirely virtual systems, semi-virtual systems aim to mimic real boundary conditions [15]. Consequently, the question of an appropriate representation in a computational model of a potable water supply system for this kind of analysis is also addressed. We show that the usage of an inappropriately defined hydraulic model can have even more impact than the actual decentralised measures on the water quality.
2. Materials and Methods
2.1. Hybrid Water Supply Estimation with UrbanBEATS
UrbanBEATS combines spatial Geographic Information Systems (GIS) data (e.g., elevation, land use, population and soil type) and non-spatial data (e.g., rainfall) in an integrated model to assist in the planning and management of decentralised water management structures and sustainable urban water strategies (Figure 1). UrbanBEATS was developed within the context of Water Sensitive Urban Design (WSUD) but can be applied/adapted to assist other sustainable water management strategies like LIUDD, GI or BMP.
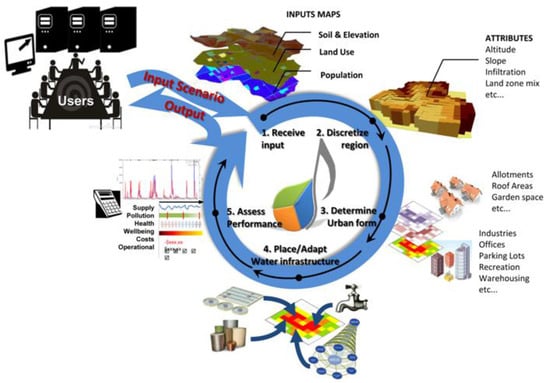
Figure 1.
Overview of the UrbanBEATS model (reprinted from [18] with permission from ASCE).
UrbanBEATS models the planning and implementation of decentralised technologies for stormwater/rainwater treatment under various policy, statutory planning and biophysical constraints. Although UrbanBEATS uses a conceptual approach with a grid-based, spatial representation of the data (each grid cell known as a “Block”), much of the information about the urban environment (e.g., land use mix, household composition, water use behaviour) is retained in each Block. This is necessary, as differentiating between the spatial scale in assessing decentralised options is crucial [19]. The size of a Block is determined on a case-by-case basis by the user depending on the purpose of the modelling study. The urban form in the model is abstracted using procedural algorithms that are based on statutory planning regulations and architectural standards [12]. Using input information about land use and population, a collection of algorithms are called to subdivide the land area into allotments and built features (e.g., building area, road, footpaths, garden and other spaces). The concept is illustrated for residential land use in Bach et al. [12] and has since been more extensively developed and tested [20]. Each procedural algorithm is underpinned by various planning ordinances (e.g., [21,22]) and architectural standards [23].
Using the resulting urban form, which is described by a plethora of characteristics (e.g., impervious areas, street widths, building setbacks, garden and public open space), different water infrastructure strategies can be tested and assessed (e.g., installation of rainwater infiltrations measures depending, for example, on the estimated roof areas, available green space and building occupants). Using the conceptual description of the urban form, potential water use reduction strategies can also be assessed. This creates the opportunity to link this spatially explicit information on variable water consumption rates based on the urban form and demographics, to hydraulic water supply models by altering the water demands accordingly or even changing the planning rules in cases of urban renewal. With this approach, it is possible to investigate and quantify how the broad-scale implementation of rainwater harvesting or the impact of water restrictions and behavioural change can impact the centralised water supply system.
In UrbanBEATS, the four aforementioned input spatial maps (10 m × 10 m raster files) of elevation, soil type, land use and population are required, of which the latter two are used to map water demands spatially to the water distribution systems. Water demands are calculated using ‘end-use analysis’ of typical water use types (e.g., kitchen, toilet, laundry, shower, irrigation) and are then downscaled to sub-daily time steps using seasonal and diurnal scaling patterns. These patterns are stacked and can be varied across different end-use types (which can result in different peak flows at different times of the day). Flow rates are based on typical values for household fixtures taken from the Australian standards AS6400:2016 [24]. Irrigation is applied to garden and public open spaces identified by the model using the spatial input. With this information and the biophysical data in the model, UrbanBEATS can identify suitable layouts of stormwater/rainwater harvesting infrastructure to achieve user-defined demand reduction targets. Alternatively, policy scenarios (e.g., minimum water efficiency compliance or water restrictions) can also be simulated to enact more widespread spatial change. In this study, we specifically explore the latter policy scenarios.
The integration between UrbanBEATS and the water distribution modelling software EPANET 2 [25] is established within UrbanBEATS itself. The model is capable of reading and modifying EPANET 2 input files and considers, explicitly, the spatial variation in water demand at various nodes in the network and across the different diurnal patterns (associated with different end use types). The link between the coarse spatial grid of Blocks (containing demand data) and a detailed network is achieved through a geometric operation, which determines the spatial proportion of a Block area connected to each node in the water distribution system. As such, an alteration of water demand through a policy scenario or the implementation of decentralised infrastructure in UrbanBEATS can then be propagated to the WDS and the modified EPANET 2 input file can be generated and used for external performance assessment.
Currently, the seasonal demand dynamics as, for example, discussed in [26], are only taken into account in a simplified way. A peak day demand is used for network design, an average day with a diurnal demand pattern is used to assess the impact of the decentralised measures and an assumed low consumption day being one third of the average daily demand is used for water quality assessments in the potable water supply network. Analysis for real demand data show that such low demand days occur on at least one or a few days per year [27]. Future development will implement the proposed approach to better represent seasonal demand dynamics.
2.2. Potable Water Supply Design and Hybrid Supply Systems
The potable water supply system should reliably supply water in sufficient quantity and quality. Although there are specific national requirements on how to design and operate them, traditional (technical) water supply follow first principal technical aspects. One might assume that we still face institutional barriers for novel approaches like hybrid water supply, but as long as a community relies on the essential central services, these first principal technical aspects must be fulfilled to avoid system malfunction under regular conditions and, especially, critical conditions.
A major challenge is the design of the layout and the sizing of pipes within the systems. The layouts of the systems are usually looped networks with redundant capacity, able to provide reliable water supply under critical conditions (pipe breaks, source failures, fire-fighting demand, etc.). Pipe-sizing is based on two conflicting requirements: (1) in cases of high demand, there must be sufficient remaining pressure in the system (high diameters to reduce friction losses and ensure that there is sufficient pressure); and (2) in cases of low demand, the residence time in the water supply system should not be too long to ensure water quality (bacterial growth with increasing water age, chlorine decay, etc.) which results in low diameters.
Water demand can considerably vary over the year [28]. Flow velocities in the systems vary accordingly depending on the pipe diameter and range from a maximum of 2.5 m/s to approximately 0.3 m/s. The variations of high demand (hourly peak demand) and an average day can be a factor of five and, for low demand days (depending on the composition of the supply area), even as high as a factor of 10 [27]. In addition to hourly peak demand design, fire-fighting requirements can also be the driving load case for the design, especially in low-density areas (i.e., low demands). In such a case, a minimal diameter requirement (e.g., a smallest pipe diameter of 80 mm or 100 mm) is usually used to ensure that the required fire-fighting demand can be covered. The implementation of the minimal diameter for fire-fighting requirements can already cause stagnation problems but it is nevertheless mandatory and must be handled with appropriate operational measures (e.g., flushing). Decentralised or alternative technologies can be used instead if they adequately supply fire-fighting requirements. In the context of a progressive installation of decentralised water supply schemes, the average water requirements can be reduced, but a reduction of the peak (design) demands is hardly possible and therefore no reductions in construction costs are foreseen. However, a reduction in operational costs due to a reduced volume for water treatment or pumping is feasible. A reliable supply scheme must ensure its resilience especially under drought conditions when no rainwater is available for a longer period. The highest volume reduction for potable demand from decentralised technologies like rainwater harvesting arises during wet weather with potentially lower outside temperatures. For the potable water supply, these are usually low demand days which are critical for stagnation and water quality problems. As such, alternative decentralised water supply schemes would further intensify these low flow conditions.
Rainwater harvesting is most effective, when there is a large enough catchment area to collect rainwater from in relation to the requested water demand. Therefore, it is important to account for the urban form and potable water supply network when developing a hybrid supply system. In this work, different rainwater harvesting and water efficiency measures determined with UrbanBEATS are propagated to the WDS and the modified potable water supply system is subsequently analysed with EPANET 2 [25] in order to identify such critical areas.
2.3. Case Study Description and Scenarios
As a demonstration case study, we selected the Casey Clyde Growth Area (CCGA) in Melbourne, Australia. The area of 48 km2, located along Melbourne’s south-eastern urban fringe, is expected to grow in population to around 150,000 persons (around 51,700 new households) in the next 50 years. The region is of interest as the local water utility has undertaken an options assessment process of various water servicing strategies for the region. Most of the area is currently still undergoing planning. A hydraulic water distribution model has been developed for the planning process, but a detailed all-pipe model only exists for certain areas. Therefore, the WDS hydraulic model reflects what is anticipated at the planning stage. The newly planned district has an expected hourly design/peak water demand of 1436 L/s. The demand in the water distribution model is aggregated in roughly 1000 demand nodes. In Figure 2, different design demand patterns depending on the urban form are shown. Based on these patterns and the actual land use, the diurnal demand variation in the water distribution model are considered.
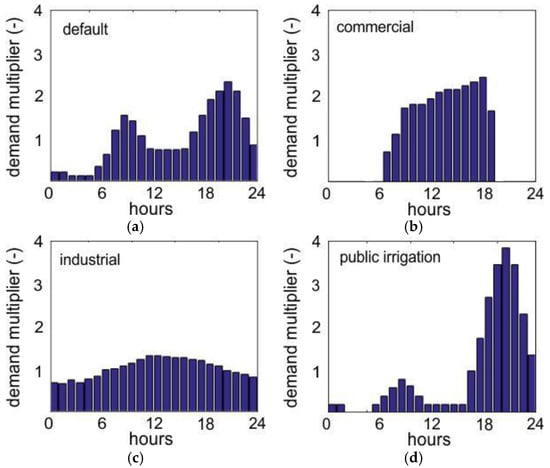
Figure 2.
Diurnal design demand patterns used for the Case Clyde model: (a) default (domestic) indoor pattern; (b) commercial pattern; (c) industrial pattern; (d) (public and private) outdoor irrigation pattern. In the hydraulic model the average daily demand is used for the demand nodes. In addition these patterns are applied as hourly demand multipliers for the average daily demand.
The WDS model is shown in Figure 3a. The initial model was designed as a distribution grid with a grid length of approximately 400 to 600 m. Pipe diameters in this supply grid vary from 100 mm to 150 mm. In areas where more detailed planning information was available (e.g., in the northern section of the WDS), a higher level of detail could be replicated in the WDS model. In this northern area, the WDS adopts a fine grid structure with most pipe diameters around 100 mm and pipe lengths as low as 50 m. The WDS represents one of the many supply zones in the water utility’s network. As such, there are five open connections that connect the CCGA zone to the rest of the network. For this study, these five intakes were modelled as reservoirs that provide the design flow into the CCGA zone. As such, only the relative travel time within our study boundary and not the overall water age from nearest supply tank or reservoir could be calculated. The average pressure in this zone is six bar.
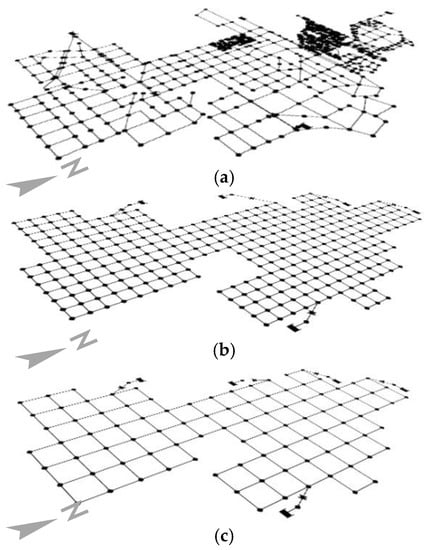
Figure 3.
Water distribution models (a) CCGA model with different levels of detail due to planning stages; (b) semi-virtual model created with the Modular Design System (MDS) for the CCGA zone with a fine grid (MDS1); (c) semi virtual model for the CCGA zone with a coarse grid (MDS2).
For minimum pressure analysis, the peak demand is used. For water quality analysis, an extended period simulation of 10 days is used with the last two days modelled as low consumption days (additional demand factor of 0.5). Besides the travel time in the system (i.e., water age simulations), chlorine decay within the supply zone was also investigated. At the five intakes, chlorine booster stations were modelled. The initial chlorine concentrations in these intakes were set to 1 mg/L. Powell, et al. [29] investigated the chlorine decay coefficients in Melbourne. Based on these investigations, a bulk decay coefficient of 0.435 L/d and wall decay coefficient of 0.027 m/d were used for the modelled first order decay in EPANET 2. The minimum required chlorine concentration in the system was constrained to 0.2 mg/L.
The UrbanBEATS model was set up using a 500 m × 500 m grid (see Blocks in Figure 5a,b). The model was calibrated to agree with the determined design demand and specifications by the urban planners and water utility. We obtained information on the independent assessment of the area that informed the CCGA model. Calibration focussed on the total water demand for the region as well as the sub-daily diurnal demand patterns for different end uses. Subsequently, two different scenarios were investigated. The first scenario, referred to as reduced irrigation (RI), emulates a water restriction or drought period where private and open space irrigation demands were lowered from 2.4 ML/ha/year to 1 ML/ha/year [30]. The suggested irrigation value is also reflective of water that would be typically obtainable from rainwater harvesting. The second scenario, referred to as ‘water efficiency’ (WE), targets widespread demand reduction through forced adoption of six-star water fittings as per Australian standards [24] in all residential households.
2.4. A Case Independent Approach—Network Structure Variations
The CCGA model contains varying levels of network detail due to different levels of detail in spatial planning for the region. To further analyse what impact these planning stages will have on the water quantity and quality simulations and to generalise our findings beyond the CCGA model, we also adopted a case independent approach. We repeated the investigation on different (semi-) virtual water distribution models within the same region. Semi-virtual water distribution models enable us to investigate whether the actual demonstration case study would perform differently if specific characteristics are altered (e.g., topology, level of detail). By analysing these different models, we should gain insight into the questions surrounding model detail, in particular, the granularity of the network and the degree to which it is looped. With the help of the analysed shapes and sizes from the CCGA model, two similar WDS models with different grid sizes and pipe lengths (see Figure 3b,c) were generated using the Modular Design System (MDS) [31]. The MDS is a MATLAB based creation procedure that is freely available (http://www.hydro-it.com/extern/IUT/mds_app/). With this approach, predefined building blocks with a graph-based representation can be used to construct entire water distribution models. These can be entirely virtual with no additional input data needed or semi-virtual, where the information of the supplied area, land use, topography and water demand is included in the model creation [32,33]. Models can be generated with different topological characteristics (e.g., looped/branched layout of the WDS or level of detail in the model) to investigate the impacts of those characteristics on hydraulic or water quality performance. More details on this approach can also be found in [34,35].
We observed a variable grid structure in the CCGA model. The semi-virtual systems have the limitation that only one grid length can be used. Therefore, the two grid sizes of 400 m (Figure 3b) and 800 m (Figure 3c) were used to mimic those, which are most commonly present in the CCGA model.
Water quality degradation frequently takes place in the final sections of the water supply network e.g., in dead end pipes and offtakes to households [36]. Therefore, an additional refinement of the network structure was added to the models MDS1 and MDS2. These additional refinements were investigated in two scenarios: (1) as a looped structure and (2) as a branched structure (see Figure 4). Consequently, a network with a consistent node distribution and level of detail was obtained.
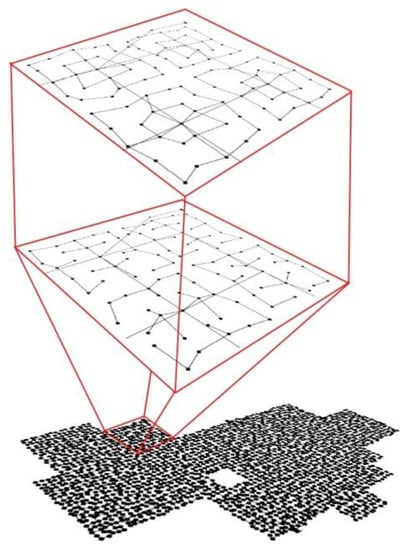
Figure 4.
Different refinement strategies of an MDS model with a looped structure (top) or a branched structure (middle).
To use the four created semi-virtual models in our investigation, a network design was necessary. We adopted similar boundary conditions as for the CCGA model (intakes, demands, topography, design pressure). With assistance from the EPANET 2 add-on WaterNetGen [37], the MDS-models were designed. The smallest diameter used to design the coarse models was 100 mm and the largest diameter of 800 mm was chosen. The design load was chosen to obtain similar velocity distributions as in the CCGA model. This would enable us to evaluate the general structural impact (i.e., level of detail) and the topological impact (loop or branched structure).
To summarise, we investigated two water management scenarios (RI and WE) for the CCGA model and four semi-virtual models differing in grid size and network topology. Specifically, we focussed on quantifying the impact these scenarios have on the pressure distribution, water travel time (stagnation) and chlorine decay within the WDS.
3. Results
The UrbanBEATS simulation was set up and the demand categories for the different Blocks were calibrated to meet proposed design demand and its characteristics (patterns) in the CCGA model (the same demands and patterns are also used for the MDS models). Subsequently, the spatial distribution of the two demand reduction scenarios RI and WE was determined. As a result, the model not only alters the daily average water demands accordingly across the region, but also the corresponding diurnal patterns. Table 1 summarises the results of these reduction scenarios. For the RI scenario, the hourly peak demand was reduced by 15% and the daily average demand was reduced by 9.3%. For the WE scenario, the hourly peak demand was reduced by 10.8% and the daily average demand by 13.7%. Although the RI scenario has more impact on the hourly peak demand than the WE scenario, the actual daily water saving is higher for the WE scenario (see Table 1). This is due to the fact, that the RI scenario primarily affects the evening peak (see Figure 2d). Note that no reduction of the peak design criteria for pipe-sizing (hourly peak demand for a peak day) occurs, because the simulated day is an average day and not a peak day which is used for WDS design.

Table 1.
Summary of the scenarios and simulated the demand reductions.
The spatial impact of both scenarios on water consumption, simulated with UrbanBEATS, is illustrated in Figure 5a for RI and 5b for WE. For areas with more green space available (e.g., single detached dwellings with garden) the RI scenario has a greater impact. Unfavourably for the potable water supply network, these areas are characterised by low building density, where the decisive design criteria is mainly the minimum pipe diameter requirement for fire-fighting. As such, the potable water supply network is over-sized under regular demand conditions, thereby causing low flow velocities and increasing the risk of stagnation (degradation of water quality). The WE scenario has a greater impact in areas with high demand (see Figure 5b—marked area), such as areas with apartment buildings.
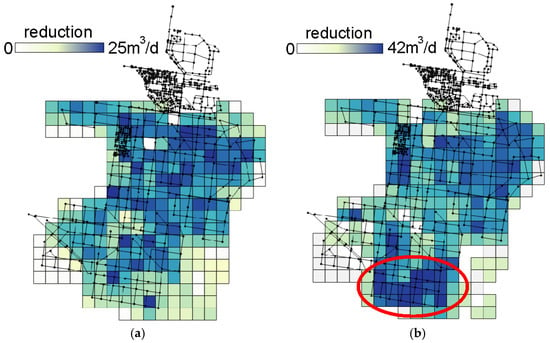
Figure 5.
Spatially-distributed demand reductions for the scenarios reduced irrigation (RI) (a); and water efficiency (WE) (b) (adapted from [18] with permission from ASCE).
In Figure 6, the initial pressure distribution (Figure 6a) and the impact of the two reduction scenarios on the pressure performance (peak hour) are shown (Figure 6b—RI and Figure 6c—WE). It can be observed that with a demand reduction, the pressure increases. A higher pressure in the potable water supply network also increases water losses (losses are approximately proportional to the square root of the pressure head). Nevertheless, in this study the effect of increased water demand due to increasing water losses is neglected.
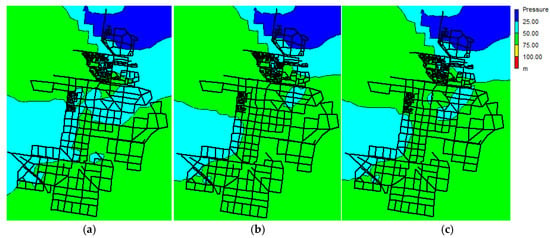
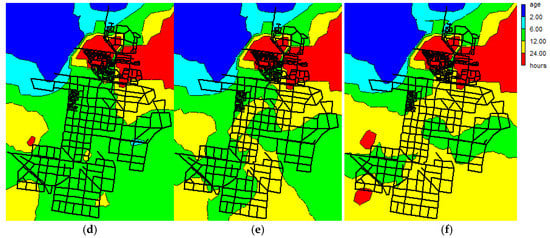
Figure 6.
Pressure and water age distribution for the initial situation and the reduction scenarios: pressure distribution for the (a) initial situation; (b) RI; (c) WE and the residence time in the network (d) initial situation; (e) RI and (f) WE for the last day of a 10-day extended period simulation.
In Figure 6e,f, the residence time in that supply zone is evaluated for the reduction scenarios RI and WE. These results are based on an extended period simulation over 10 days with eight consecutive average days and the last two days assumed as low consumption days with one third of the volume of the average day. The results for water age are evaluated on the last of the 10-day simulation. Analyses for real demand data show that such low demand days occur on at least one or a few days per year [27].
By visually comparing the residence time distributions after demand reduction with the initial situation shown in Figure 6d, the highest increase in water age is obtained for the scenario WE in Figure 6f, especially for the marked area in Figure 5b. Furthermore, a differentiation for the travel time in the network can be observed for the upper and lower part of the network, in which different levels of detail are implemented in the system.
3.1. Results for Water Age and Chlorine Decay for CCGA
In Figure 7, the changes in travel time in the network depending on the water demand reduction scenarios RI (Figure 7a) and WE (Figure 7b) are systematically investigated. On the horizontal axis, the initial travel time without any scenario (initial situation) is shown. On the vertical axes the travel time for the different scenarios is shown. Each dot represents a demand node and gives insight into the change in travel time due to demand reductions, which are indicated by the colour of each dot. No demand reduction (0%) is shown in dark blue and in cases where the demand would be entirely covered by decentralised strategies, a dark red colour is used (see legends in Figure 7). For dots above the first median line (y = x), an increase in the observed parameter is indicated and, below, a decrease. For dots on the first median, no changes occurred and the greater the distance to the first median, the higher the change in the observed parameter.
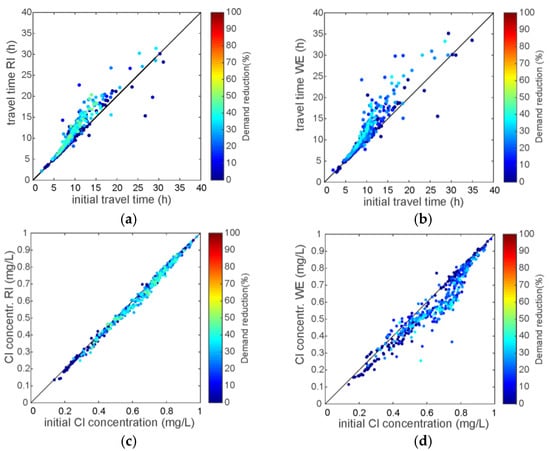
Figure 7.
Systematic node-wise comparison of the initial conditions with the scenarios RI and WE with colours indicating the demand reductions for (a) and (b) travel time in the network; (c) and (d) chlorine concentrations.
When comparing Figure 7a,b, higher node-wise demand reductions can be observed for the RI scenario (light blue and even green dots). Nevertheless, for the WE scenario, higher changes in travel time are observed (more points above the first median also with a greater distance to it). In general, there is an increase in travel time, but there are also noticeable nodes where the travel time decreases. This can be explained by the five intakes to the model. When changing the demand in the WDS, flow redistributions occur and the source node from which a demand node gets its water can be changed.
The results for changes in chlorine concentration are shown in Figure 7c,d. For the RI scenario, there is only a slight drop for all the nodes. On average, a reduction of 2.37% (−0.013 mg/L) in chlorine concentration can be observed. For the WE scenario, there is a greater change in concentration. There is also a higher impact of flow redistribution (12.2% of the nodes/points are above the first median). In general, there is a higher quality decline (average reduction of 8.89%, −0.052 mg/L) although the node-wise reductions are lower.
3.2. Sructural Impact (without Scenarios for Demand Reduction)
In this section, the structural impact of the WDS models is analysed. The semi-virtual models MDS1 and MDS2 are compared with the CCGA model (see Figure 3). Additionally, we also investigate the refinements of MDS1 and MDS2 with a looped and branched structure (see Figure 4).
We first compare the results of the different models without applying any demand reduction scenarios. Figure 8 shows the cumulative distribution functions (CDF) of the node values for the different models for the travel time in the potable supply network and the chlorine concentrations. The blue line shows the results for the CCGA model (with partial refinements), which, according to Figure 8a, is between the results for the initial MDS1 model and branched and looped refinements. The same observation is made for MDS2 in Figure 8b. Therefore, it can be concluded, that in terms of travel time distribution in the network, the semi-virtual systems have comparable properties as the actual system. We can therefore reasonably assume that these are suitable to address the question of what would happen if the level of model detail becomes coarser (less details) or finer (more details) than the baseline CCGA model.
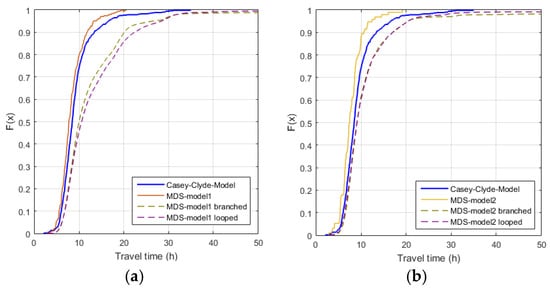
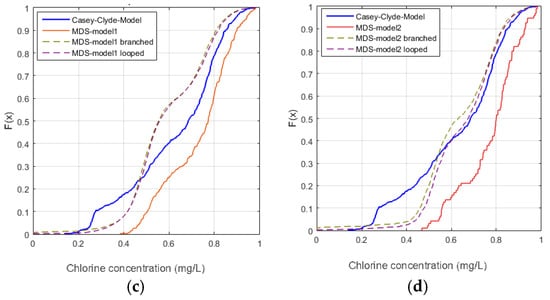
Figure 8.
Cumulative distribution function (CDF) of the simulated node values for (a) travel time in the CCGA model in comparison to the MDS1 models (coarse, branched and looped refinements); (b) travel time in the CCGA model in comparison to the MDS2 models (coarse, branched and looped refinements); (c) chlorine concentrations in the CCGA model in comparison to the MDS1 models (coarse, branched and looped refinements); (d) chlorine concentration in the CCGA model in comparison to the MDS2 models (coarse, branched and looped refinements).
For chlorine concentrations, similar behaviour can be observed with the exception, for low concentrations (for MDS1 in Figure 8c below 0.45 mg/L and MDS2 in Figure 8d below 0.55 mg/L) the semi-virtual systems over-value the concentrations. This is due to the fact that the demand in the semi-virtual systems is more equally distributed compared to the CCGA model. Nevertheless, it is assumed that from MDS1 and MDS2 results, reasonable insights into the impact of the network structural behaviour can be obtained.
3.3. Structural Properites and the Effect of Reductions Scenarios on Water Quality
Figure 9 shows the impact of branched and looped refinements of MDS1 for the scenarios RI and WE on the travel time. Similarly, Figure 10 shows the impact on the chlorine concentrations. All analyses were performed for each model and each parameter, but we have focused our discussion in this paper on the most prevalent and significant cases.
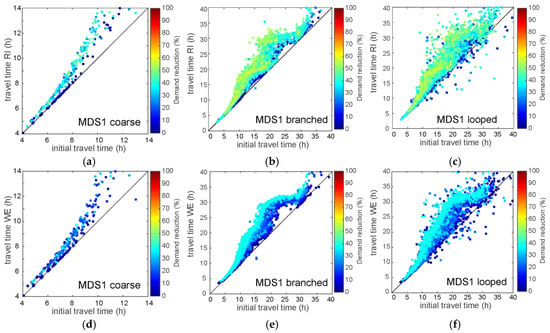
Figure 9.
Investigation of travel time and of the impact of the reduction scenarios RI and WE in comparison to model refinements in the model MDS1 (a) coarse MDS1 model and RI; (b) branched refinement of MDS1 and RI; (c) looped refinements of MDS1 and RI; (d) coarse MDS1 model and WE; (e) branched refinement of MDS1 and WE; (f) looped refinements of MDS1 and WE.
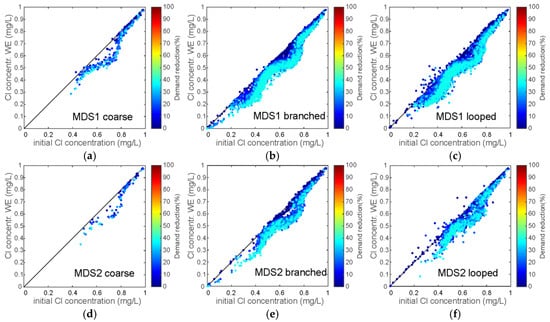
Figure 10.
Investigation of chlorine concentrations and of the impact of the reduction scenarios WE in comparison with model refinements in the model MDS1 and MDS2 (a) coarse MDS1 model; (b) branched refinement of MDS1; (c) looped refinements of MDS1; (d) coarse MDS2 model (e) branched refinement of MDS2; (f) looped refinements of MDS2.
In Figure 9a,d the results for the coarse MDS1 model are shown. The coarse model consists of 315 nodes while the refined models consists of 7765 nodes. Without the finer network structure, one can see that the maximum values for the travel time are much lower compared to the finer networks. The average travel time under initial conditions is 8.4 h, for branched refinement it is 14.4 h and for the looped refinement it is 14.2 h. For the RI scenario without refinements it is 9.7 h, for the branched refinement it is 17.1 h and for the looped refinement it is 16.7 h. In the coarse model, an increase of approximately 1.3 h is caused by scenario RI, whereas for the refined models, an approximately 2.6-h increase occurs (slightly less for the looped system).
The topological impact can clearly be observed when comparing the branched refinements with the looped refinements. In the (almost) fully-branched networks, the effect of flow redistributions cannot be observed. Therefore, a demand reduction in these cases mainly causes an increase in travel time (dots over the first median). In the branched system, the highest demand reduction also corresponds with the highest increase in travel time while for the looped systems this effect is weakened by flow redistributions.
In Figure 10, the chlorine concentrations for MDS1 and MDS2 models and their refinements are shown for the WE scenario. The MDS1 models are the same as in Figure 9. The coarse MDS2 model consists of 95 nodes and the refined models of 2250 nodes. In the coarse models, no chlorine concentrations below 0.4 mg/L were observed, while in the refined models there were values even close to 0 mg/L. Evidently, the branched systems in this case (Figure 10b,e) contain more values below the threshold value of 0.2 mg/L compared to the looped refinement (Figure 10c,f). For chlorine concentrations the effect of loops and, consequently, flow redistribution is less pronounced than for travel time.
The average reduction of chlorine concentrations across all models (Figure 10a,f) is between 0.053 and 0.057 mg/L. However, a reduction up to 0.3 mg/L occurred, and even below the required threshold of 0.2 mg/L.
4. Discussion
To further support the discussion of results, we statistically evaluated and compared the data from Figure 7, Figure 9 and Figure 10. The outcomes are shown in Figure 11 in the form of boxplots depicting the change in node values for water age and chlorine concentrations. The ratio to the initial conditions (without applying any reductions scenarios) are shown. The boxplots show the median value (red horizontal lines), the interquartile range (IQR) from the 25th percentile to the 75th percentile (blue central boxes), 1.5 range of the IQR as whiskers and all values outside that 1.5 IQR as outliers (red crosses). The notches show the 95% confidence interval of the median value. Outliers in this context do not indicate that they are statistically relevant, but that there is a high variation in the values throughout the investigated systems. For chlorine concentration, these outliers above one can be, for example, the impact of the flow redistribution. A value greater than one means an increase for the scenario (e.g., in general for travel time) and a value below one means a reduction of that parameter when applying the demand reduction scenarios (e.g., in general for the chlorine concentrations).

Figure 11.
Statistical comparison of the different scenarios (a) CCGA model; (b) the MDS1 model with different refinement strategies (c) structural impact between MDS1 and MDS2.
In Figure 11a, the results are shown for the CCGA model for the scenarios RI and WE for the travel time and the chlorine concentrations. Although the change in travel time distribution is not significant (the median values and their notches are overlapping), notable differences in the outliers can be seen, predominately for increased values >1. For chlorine concentration, there is a general downward trend and the effects of the scenarios RI and WE are more pronounced. The WE scenario causes a much greater variation in changes (greater and smaller than one) than the RI scenario. The flow redistribution and demand reduction throughout the entire day are likely causes of this behaviour.
In Figure 11b, the boxplots of travel time in the network for the model MDS1 and its branched and looped refinements are plotted for the scenarios RI and WE. For the initial system, in both scenarios, there is no decrease in travel time (except for one outlier) while for the refined system there is a decrease. This means that the effect of flow redistribution primarily occurs in the fine structure of the system. It is also plausible that additional reverse flows in the pipes may be occurring, thereby transporting the water back and forth, which can also usually lead to water quality problems. This was, however, not specifically tested in this study. The networks with branched refinements in Figure 11b show a marginally higher travel time increase than the systems with the looped refinements. However, looped systems have a greater impact on the outliers (in both directions, increase and decrease). The general design principal for water supply systems is to consider a looped layout for redundancy and enhanced reliability. Looped structures are, however, also susceptible to larger variations in travel times and other changes, which is inherent to their nature and flexibility.
In Figure 11c the boxplots of chlorine concentrations in the network for the model MDS1 and its branched and looped refinements are compared to the results obtained with MDS2 for the scenario WE. The two coarse MDS models do not show a great difference. However, noticeably, there is no increase in chlorine concentration. Hence, it can be concluded that the MDS2 model is too coarse for flow redistribution to take place when demand reductions are modelled. Interestingly, for branched refinements, reductions in chlorine are higher for the outliers than in the looped systems (the median values and IQR do not deviate significantly).
The application of different semi-virtual networks provided valuable insights into the effect of different levels of network detail that result from planning of future water services such as the one in the CCGA case study. Despite us using the context of Casey-Clyde as a boundary condition, the obtained model results for MDS1 and MDS2 are more case unspecific. The travel time in the water network is usually used a representative indicator for water quality and is, to some extent, also related to the decrease in chlorine concentration. Nevertheless, in the first order chlorine decay equation, the decay coefficient is inversely proportional to the hydraulic radius of the pipe diameter. With different structural layouts (e.g., branched or looped refinements) and, accordingly, different diameter distributions, unexpected behaviours were observed. Mostly, that in the branched network (which usually have smaller maximum travel time) the decrease in chlorine concentrations is highest. In this study, the temperature of the water was kept constant. With an increasing water temperature, the decay rate also increases. In moderate and warm temperature zones, the potable water usually becomes warmer when its location is closer to the consumer. In this instance, the described effect of water quality degradation in the last section of the potable pipe network even amplifies the diameter-dependent decay. Abokifa, Yang, Lo and Biswas [36] showed that in the traditional modelling approach, as shown in this work, the water quality degradation is significantly underestimated and most of the degradation takes place in the very last sections of the network (i.e., closest to the consumer). This reported effect would even further intensify the water quality degradation determined in this work.
For the management of hybrid water supply systems, chlorine management is a crucial issue. The injection usually occurs at booster stations at e.g., the intakes to the system. In this study, the injected concentrations were already at maximum (1 mg/L) and cannot be increased any further. Despite this, many locations in the network resulted in partly insufficient chlorine concentrations (below 0.2 mg/L). It was observed that the water demand reduction throughout the day had the most severe impact on the potable water supply network. Therefore, a re-chlorination at certain nodes might be required in such cases to offset this adverse impact.
Another observed effect of transitioning from a fully centralised water supply towards a hybrid water supply approach is the increase in network pressures due to less flow and hence less friction losses [38]. Revision or development of smarter pressure management strategies for the potable water supply system may be recommended in such a case (e.g., lower pumping heights, pressure reductions). Otherwise, demand reduction from the implementation of hybrid technologies could be partly compensated by an increase in water losses.
Furthermore, with the increasing water efficiency of household devices (e.g., shower, clothes washer, etc.), the volume which can be used for greywater recycling is reduced. To strike an optimal balance in the design and implementation of hybrid water supply systems, a fully integrated picture of the effects and contribution of different water sources needs to be established and system interactions must be fully considered in the infrastructure choices.
Yet another notable issue is the implementation of a minimal diameter for fire-fighting requirements, which can already cause stagnation problems under regular conditions. As long as no other technology is in place (e.g., decentralised storage with an extra pipe network for fire-fighting), it is mandatory and must be handled with operational measures (e.g., flushing), which in itself causes the loss of water.
In the context of a progressive installation of decentralised supply technology, average water demand can be reduced. However, a reduction of the peak (design) demands is hardly possible. For a reliable supply, it has to be ensured that sufficient water is always available, especially when there are longer periods of no rainfall. This is particularly crucial when available decentralised storages are depleted during the peak water demand days/hours due to high temperatures. As such, we cannot rely solely on rainwater harvesting. To fully simulate such a behaviour, a dynamic approach would be required. A limitation of the presented approach at the current stage of development is that long-term system dynamics (e.g., in rainfall and water demands) are not considered for simplification purposes. However, in the conceptualisation of the developed approach, it was ensured that the model can be enhanced for this capability without changing the method for spatial coupling presented in this paper.
In such a dynamic consideration, it is expected that the highest volume reduction from decentralised technologies like rainwater harvesting will arise when there is wet weather with lower outside temperatures. For the potable water supply, these are usually low demand days, which are critical for stagnation and water quality problems. These low flow conditions would even be further intensified by a hybrid solution. Nevertheless, a subset of extreme situations for water supply performance can already be assessed with the presented approach (e.g., an increase in pressure for the design/peak demand or an increase in water age and water quality).
In terms of practical implications, there are several strategies to overcome these issues such as an extensive decentralised storage volume and increasing chlorine booster stations among others. However, the most efficient strategy is expected to be a more location-sensitive approach, which identifies areas where a demand reduction is reasonable and areas where more drawbacks than benefits can be expected. For existing systems that already operate at maximum capacity, to increase the reliability [39] or the performance in failure mode of the existing system [40], hybrid solutions can provide additional water resources, if required, without costly investment in the central water infrastructure. With the presented approach, such adaption strategies for an existing water supply network can be tested to support the infrastructure planning process.
5. Conclusions
A modern urban water cycle is a strongly interlinked system, but the different sub-disciplines in that cycle are still often regarded separately in traditional management structures and interactions in complex systems are often neglected. For the efficient long-term operation of hybrid water supply systems, these interactions are significant. However, the impact of increasing the implementation of decentralised technologies on the local technical performance in sewer systems and potable water supply networks have rarely been analysed in the scientific literature. Urban form and planning regulations frequently interact with the implementation of such decentralised systems. Therefore, for decision-makers it is important to understand the implications of different planning regulations on aspects like urban drainage or water supply not only at the regional, but also at a local scale.
This paper aimed to quantify impact of the spatial distribution of the implementation of decentralised technologies (i.e., hybrid water supply systems) on the technical performance of existing water supply networks. The impact of demand reduction scenarios (i.e., rainwater harvesting to substitute private irrigation and water efficiency measures) determined with a planning-support tool called UrbanBEATS, which combines spatial and non-spatial data, on the water quality in the potable water network are demonstrated. Most importantly, the very disadvantageous interaction of the low density urban form (low total demand, minimal pipe diameters in the potable supply network) and the high rainwater harvesting potential (a large harvestable area in combination with green space for irrigation) was identified as causing local water quality problems in those areas. In contrast, in high demand areas (e.g., the high density urban form) there is less effect from rainwater harvesting due to the limited available space. The impact on the technical performance of the potable water supply network in these regions is therefore less significant. In these high density areas, water efficiency measures result in the highest savings in water volume but do not cause significant problems for the technical performance of the potable water supply network. A limitation of the presented approach at the current stage of development is that the long-term system dynamics (e.g., rainfall and water demand) are not considered for reasons of simplification. However, in the conceptualisation of the developed approach, it was ensured that the model can be enhanced for that capability without changing the method for spatial coupling presented in this paper.
For a more generalised and case-independent conclusion, further analyses were performed for semi-virtual benchmark networks. We questioned the appropriateness of the water distribution model for such an analysis. It was shown that using an inappropriate level of detail for the computational model of a WDS for determining the hydraulics can have a more pronounced impact on the water quality results than the actual decentralised measures. Currently, seasonal demand dynamics are only considered in a simplified way. An average day with a diurnal demand pattern was used to assess the impact of decentralised measures, with an assumed low consumption day being one third of the average daily demand used for water quality assessments in the potable water supply network. Analysis of real demand data showed that such low demand days occur on at least one or a few days per year. Future model development will implement a more detailed approach to considering the seasonal demand dynamics as well as more detailed feedback loops with decentralised systems such as rainwater/stormwater harvesting measures and even wastewater recycling.
Acknowledgments
This research was funded by the Austrian Research Promotion Agency (FFG) within the research project ORONET (project number: 858557) and Monash University’s Faculty of Engineering SEED Funding Scheme 2015. We also thank South East Water (Melbourne, Australia) for providing us data and information on the proposed urban development and pipe network infrastructure for the Casey-Clyde case study region as well as valuable feedback on this work.
Author Contributions
Robert Sitzenfrei conceived and designed the experiments; Markus Sitzmann and Jonatan Zischg performed the water supply assessments and analysed the data; Peter M. Bach performed the UrbanBEATS simulations; Robert Sitzenfrei wrote the first draft of the paper which all co-authors revised.
Conflicts of Interest
The authors declare no conflict of interest. The founding sponsors had no role in the design of the study; in the collection, analyses, or interpretation of data; in the writing of the manuscript, and in the decision to publish the results.
References
- Larsen, T.A.; Hoffmann, S.; Luthi, C.; Truffer, B.; Maurer, M. Emerging solutions to the water challenges of an urbanizing world. Science 2016, 352, 928–933. [Google Scholar] [CrossRef] [PubMed]
- Sharma, A.; Burn, S.; Gardner, T.; Gregory, A. Role of decentralised systems in the transition of urban water systems. Water Sci. Technol. Water Supply 2010, 10, 577–583. [Google Scholar] [CrossRef]
- Marlow, D.R.; Moglia, M.; Cook, S.; Beale, D.J. Towards sustainable urban water management: A critical reassessment. Water Res. 2013, 47, 7150–7161. [Google Scholar] [CrossRef] [PubMed]
- Sapkota, M.; Arora, M.; Malano, H.; Moglia, M.; Sharma, A.; George, B.; Pamminger, F. An overview of hybrid water supply systems in the context of urban water management: Challenges and opportunities. Water 2015, 7, 153–174. [Google Scholar] [CrossRef]
- Fletcher, T.D.; Shuster, W.; Hunt, W.F.; Ashley, R.; Butler, D.; Arthur, S.; Trowsdale, S.; Barraud, S.; Semadeni-Davies, A.; Bertrand-Krajewski, J.-L.; et al. Suds, lid, bmps, wsud and more—The evolution and application of terminology surrounding urban drainage. Urban Water J. 2015, 12, 525–542. [Google Scholar] [CrossRef]
- Sitzenfrei, R. An Integrated View on the Urban Water Cycle: A Shift in the Paradigm? Postdoctoral Thesis, Unit of Environmental Engineering, University of Innsbruck, Innsbruck, Austria, 2015. [Google Scholar]
- Rozos, E.; Makropoulos, C. Source to tap urban water cycle modelling. Environ. Model. Softw. 2013, 41, 139–150. [Google Scholar] [CrossRef]
- Sitzenfrei, R.; Rauch, W.; Rogers, B.; Dawson, R.; Kleidorfer, M. Modeling the urban water cycle as part of the city. Water Sci. Technol. 2014, 70, 1717–1720. [Google Scholar] [CrossRef] [PubMed]
- Bouziotas, D.; Rozos, E.; Makropoulos, C. Water and the city: Exploring links between urban growth and water demand management. J. Hydroinform. 2015, 17, 176–192. [Google Scholar] [CrossRef]
- Rozos, E.; Butler, D.; Makropoulos, C. An integrated system dynamics—Cellular automata model for distributed water-infrastructure planning. Water Sci. Technol. Water Supply 2016, 16, 1519–1527. [Google Scholar] [CrossRef]
- Sapkota, M.; Arora, M.; Malano, H.; Moglia, M.; Sharma, A.; George, B.; Pamminger, F. An integrated framework for assessment of hybrid water supply systems. Water 2016, 8, 4. [Google Scholar] [CrossRef]
- Bach, P.M.; Deletic, A.; Urich, C.; Sitzenfrei, R.; Kleidorfer, M.; Rauch, W.; McCarthy, D.T. Modelling interactions between lot-scale decentralised water infrastructure and urban form—A case study on infiltration systems. Water Resour. Manag. 2013, 27, 4845–4863. [Google Scholar] [CrossRef]
- Bach, P.M.; McCarthy, D.T.; Urich, C.; Sitzenfrei, R.; Kleidorfer, M.; Rauch, W.; Deletic, A. A planning algorithm for quantifying decentralised water management opportunities in urban environments. Water Sci. Technol. 2013, 68, 1857–1865. [Google Scholar] [CrossRef] [PubMed]
- Wong, T.; Allen, R.; Brown, R.; Deletić, A.; Gangadharan, L.; Gernjak, W.; Jakob, C.; Johnstone, P.; Reeder, M.; Tapper, N.; et al. Blueprint2013—Stormwater Management in a Water Sensitive City; Cooperative Research Centre for Water Sensitive Cities: Melbourne, Australia, 2013. [Google Scholar]
- Sitzenfrei, R.; Möderl, M.; Rauch, W. Assessing the impact of transitions from centralised to decentralised water solutions on existing infrastructures—Integrated city-scale analysis with vibe. Water Res. 2013, 47, 7251–7263. [Google Scholar] [CrossRef] [PubMed]
- Sitzenfrei, R.; Rauch, W. Integrated hydraulic modelling of water supply and urban drainage networks for assessment of decentralized options. Water Sci. Technol. 2014, 70, 1817–1824. [Google Scholar] [CrossRef] [PubMed]
- Mair, M.; Zischg, J.; Rauch, W.; Sitzenfrei, R. Where to find water pipes and sewers?—On the correlation of infrastructure networks in the urban environment. Water 2017, 9, 146. [Google Scholar] [CrossRef]
- Sitzenfrei, R.; Zischg, J.; Sitzmann, M.; Rathnayaka, S.; Kodikara, J.; Bach, P.M. Effects of implementing decentralized water supply systems in existing centralized systems. In World Environmental and Water Resources Congress 2017; Dunn, C.N., Weele, B.V., Eds.; American Society of Civil Engineers (ASCE): Reston, VA, USA, 2017. [Google Scholar]
- Arora, M.; Malano, H.; Davidson, B.; Nelson, R.; George, B. Interactions between centralized and decentralized water systems in urban context: A review. Wiley Interdiscip. Rev. Water 2015, 2, 623–634. [Google Scholar] [CrossRef]
- Bach, P.M. Urbanbeats—A Virtual Urban Water System Tool for Exploring Strategic Planning Scenarios. Ph.D. Thesis, Monash University, Melbourne, Australia, 2014. [Google Scholar]
- Telford, T. Industrial and Commercial Estates–Planning and Site Development; United Kingdom Development Agencies: London, UK, 1986. [Google Scholar]
- Department of Environment, Land, Water and Planning (DELWP). Victorian Planning Provisions; DELWP: Melbourne, Australia, 2017. [Google Scholar]
- De Chiara, J.; Panero, J.; Zelnik, M. Time-Saver Standards for Housing and Residential Development; McGraw-Hill Companies: New York, NY, USA, 1995. [Google Scholar]
- Standards Australia. Water Efficient Products—Rating and Labelling; AS/NZS 6400:2016; Standards Australia: Sydney, Australia, 2016. [Google Scholar]
- Rossman, L.A. EPANET 2 User’s Manual; U.S. Environmental Protection Agency: Cincinnati, OH, USA, 2000.
- Rathnayaka, K.; Malano, H.; Maheepala, S.; George, B.; Nawarathna, B.; Arora, M.; Roberts, P. Seasonal demand dynamics of residential water end-uses. Water 2015, 7, 202–216. [Google Scholar] [CrossRef]
- Sitzenfrei, R.; Anawar, H.M.; Strezov, V. Uncertainty in hydropower system: New approach in design of sustainable hydropower system. In Renewable Energy Systems: Efficiency, Innovation and Sustainability; Strezov, V., Ed.; Productivity Press Publishing: New York, NY, USA, 2017, in press.
- Rathnayaka, K.; Maheepala, S.; Nawarathna, B.; George, B.; Malano, H.; Arora, M.; Roberts, P. Factors affecting the variability of household water use in Melbourne, Australia. Resour. Conserv. Recycl. 2014, 92, 85–94. [Google Scholar] [CrossRef]
- Powell, J.C.; Hallam, N.B.; West, J.R.; Forster, C.F.; Simms, J. Factors which control bulk chlorine decay rates. Water Res. 2000, 34, 117–126. [Google Scholar] [CrossRef]
- Wilkenfeld, G. Water Saving Requirements for New Residential Buildings in Victoria: Options for Flexible Compliance; Department of Sustainability and Environment: Sydney, Australia, 2007.
- Möderl, M.; Sitzenfrei, R.; Fetz, T.; Fleischhacker, E.; Rauch, W. Systematic generation of virtual networks for water supply. Water Resour. Res. 2011, 47. [Google Scholar] [CrossRef]
- Sitzenfrei, R.; Möderl, M.; Rauch, W. Automatic generation of water distribution systems based on gis data. Environ. Model. Softw. 2013, 47, 138–147. [Google Scholar] [CrossRef] [PubMed]
- Zischg, J.; Mair, M.; Rauch, W.; Sitzenfrei, R. Enabling efficient and sustainable transitions of water distribution systems under network structure uncertainty. Water 2017, 9, 715. [Google Scholar]
- Sitzenfrei, R. Stochastic Generation of Urban Water Systems for Case Study Analysis. Ph.D. Thesis, Unit of Environmental Engineering, University of Innsbruck, Innsbruck, Austria, 2010. [Google Scholar]
- Sitzenfrei, R. A review on network generator algorithms for water supply modelling and application studies. In Proceedings of the World Environmental and Water Resources Congress, West Palm Beach, FL, USA, 22–26 May 2016; pp. 907–916. [Google Scholar]
- Abokifa, A.A.; Yang, Y.J.; Lo, C.S.; Biswas, P. Water quality modeling in the dead end sections of drinking water distribution networks. Water Res. 2016, 89, 107–117. [Google Scholar] [CrossRef] [PubMed]
- Muranho, J.; Ferreira, A.; Sousa, J.; Gomes, A.; Marques, A.S. Waternetgen: An EPANET extension for automatic water distribution network models generation and pipe sizing. Water Sci. Technol. Water Supply 2012, 12, 117–123. [Google Scholar] [CrossRef]
- Campisano, A.; Modica, C.; Reitano, S.; Ugarelli, R.; Bagherian, S. Field-oriented methodology for real-time pressure control to reduce leakage in water distribution networks. J. Water Resour. Plan. Manag. 2016, 142, 04016057. [Google Scholar] [CrossRef]
- Pietrucha-Urbanik, K.; Tchórzewska-Cieslak, B. Water supply system operation regarding consumer safety using kohonen neural network. In Safety, Reliability and Risk Analysis: Beyond the Horizon; Steenbergen, R.D.J.M., van Gelder, P.H.A.J.M., Miraglia, S., Vrouwenvelder, A.C.W.M., Eds.; Taylor & Francis Group: London, UK, 2014; pp. 1115–1120. [Google Scholar]
- Tchórzewska-Cieślak, B.; Pietrucha-Urbanik, K.; Urbanik, M. Analysis of the gas network failure and failure prediction using the Monte Carlo simulation method (Analiza awaryjności sieci gazowych oraz prognozowanie awarii z zastosowaniem symulacyjnej metody Monte Carlo). Eksploat. Niezawodn.—Maint. Reliab. 2016, 18, 254–259. [Google Scholar] [CrossRef]
© 2017 by the authors. Licensee MDPI, Basel, Switzerland. This article is an open access article distributed under the terms and conditions of the Creative Commons Attribution (CC BY) license (http://creativecommons.org/licenses/by/4.0/).