
Groundwater and Surface Water Availability via a Joint Simulation with a Double Control of Water Quantity and Ecologically Ideal Shallow Groundwater Depth: A Case Study on the Sanjiang Plain, Northeast China


Abstract
:
1. Introduction
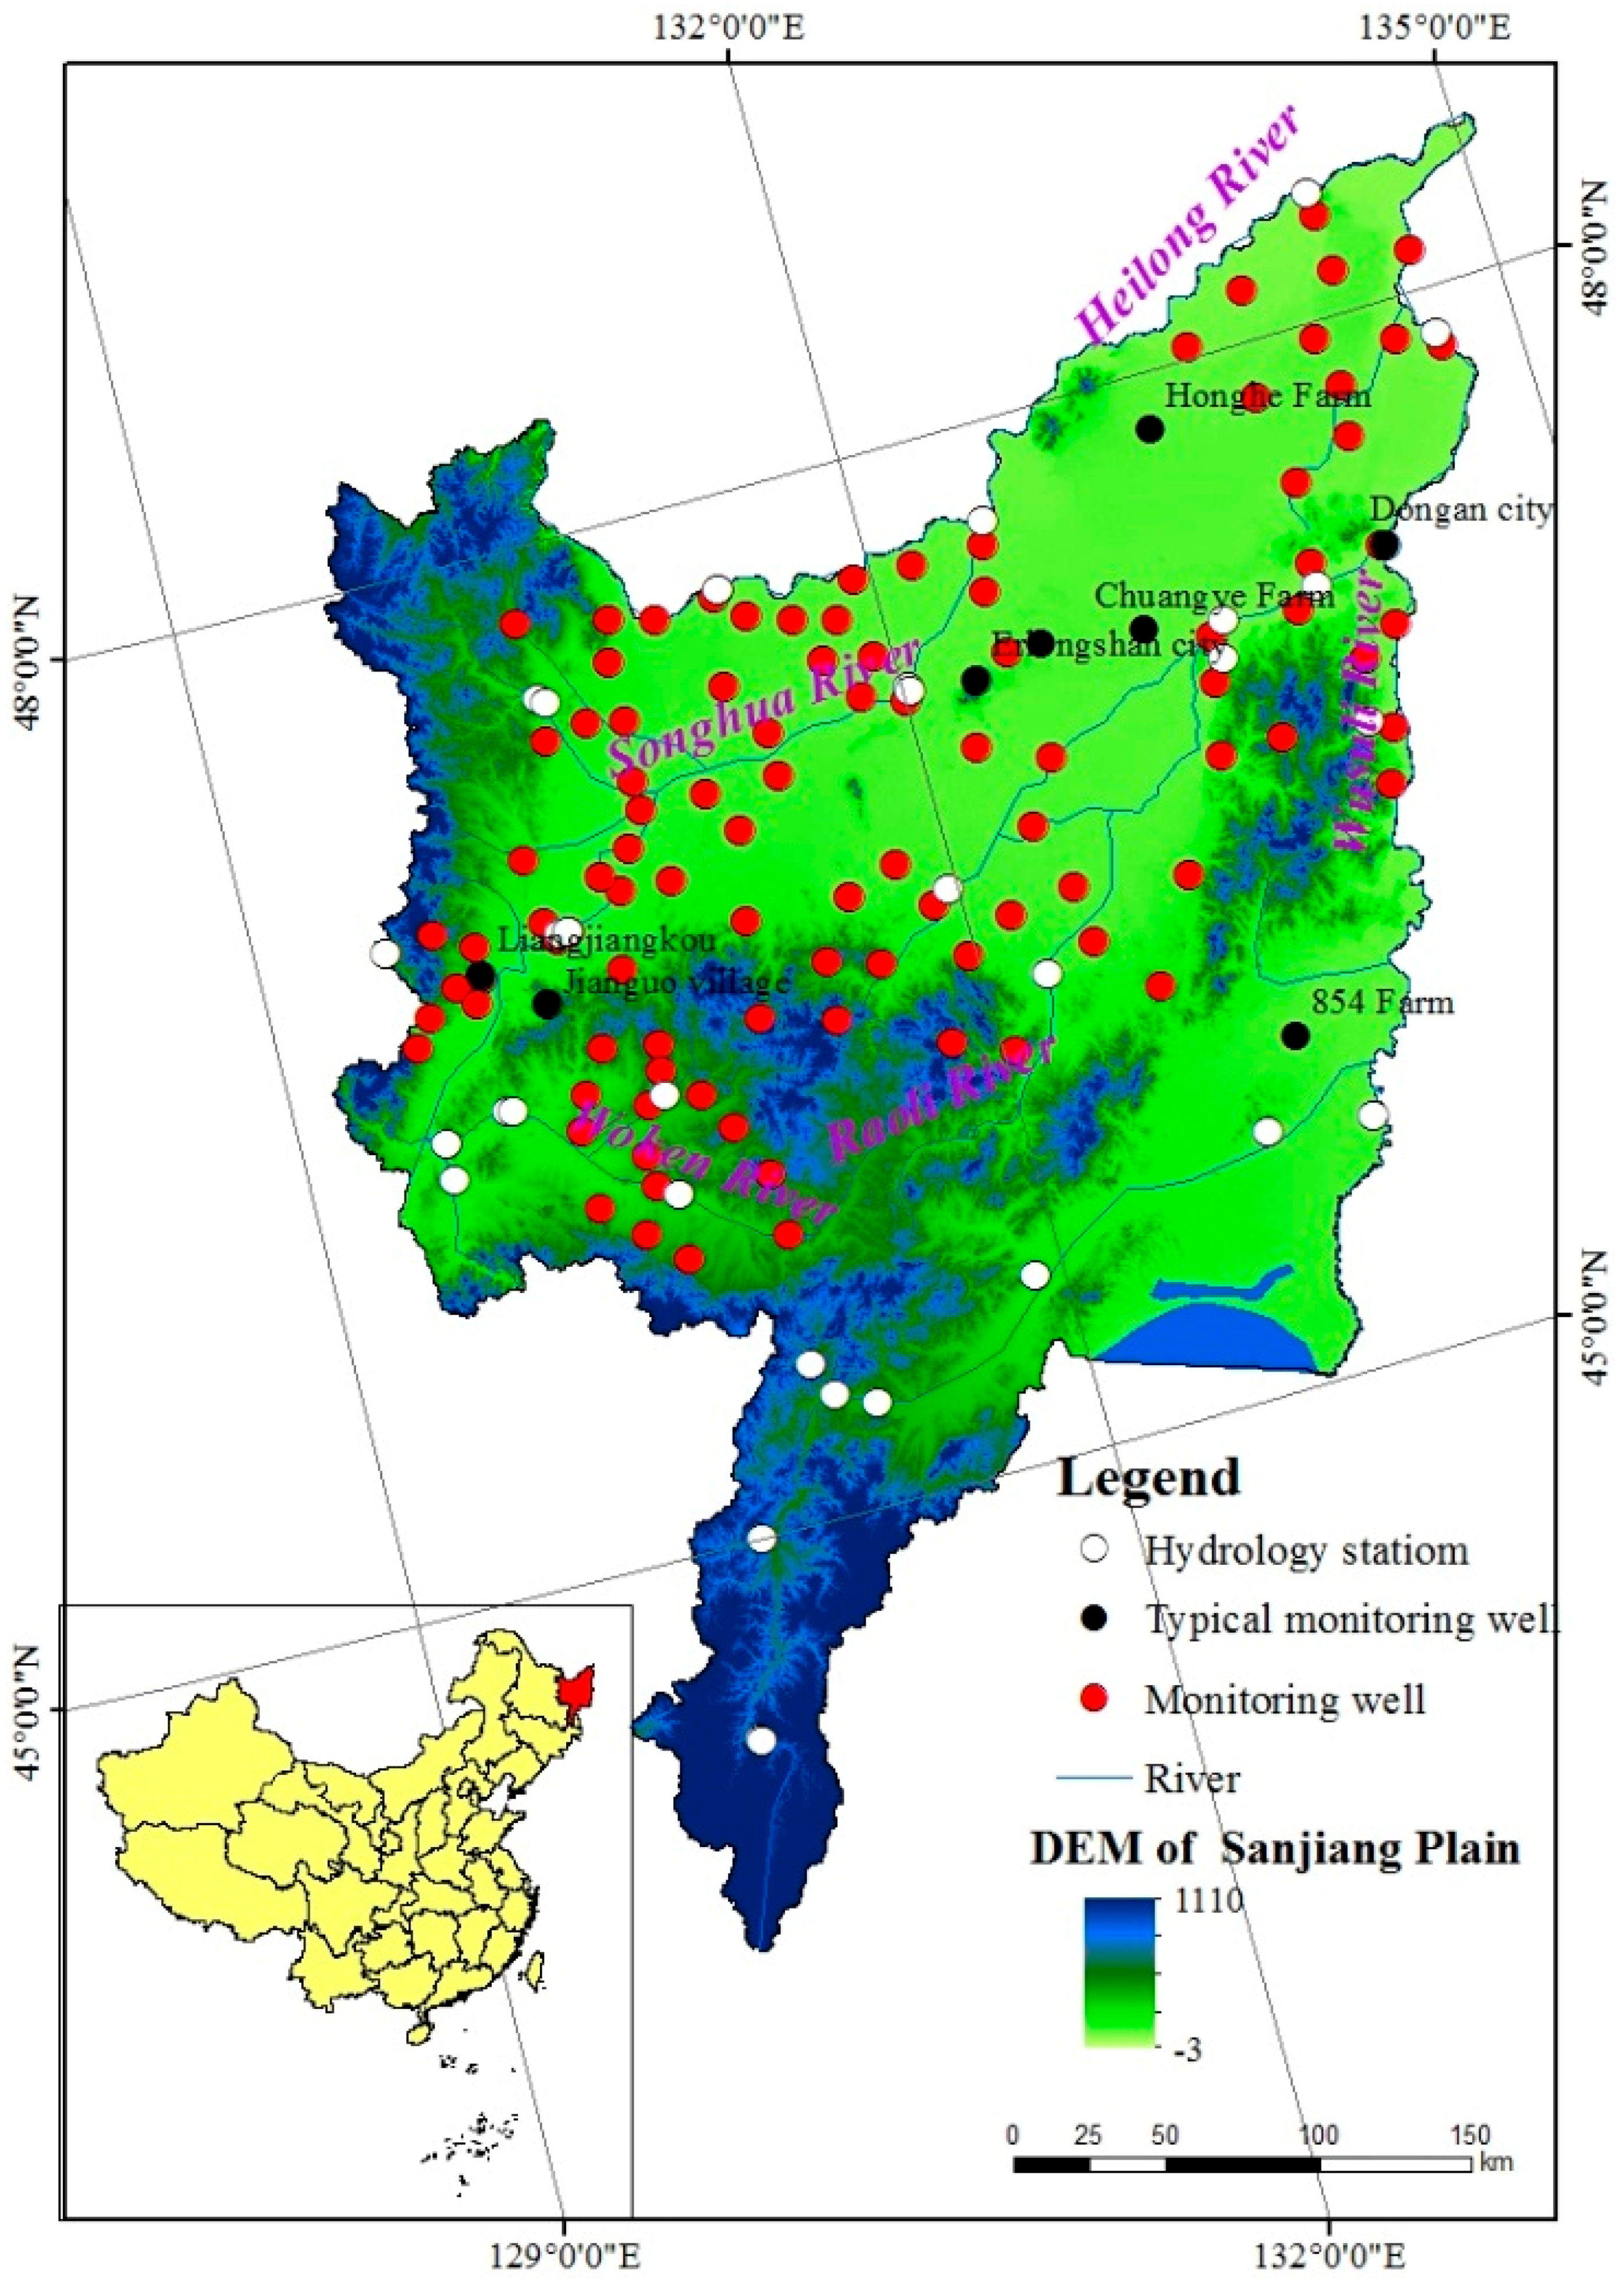
2. Study Area
3. Methodology
3.1. Conceptual Model, Mathematical Model and Joint Model
3.1.1. Surface Water Conceptual Model
3.1.2. Mathematical Model
3.1.3. Groundwater Conceptual Model
3.1.4. Mathematical Model
3.1.5. Joint Model
3.2. Input Data
3.3. Model Discretization, Calibration and Validation
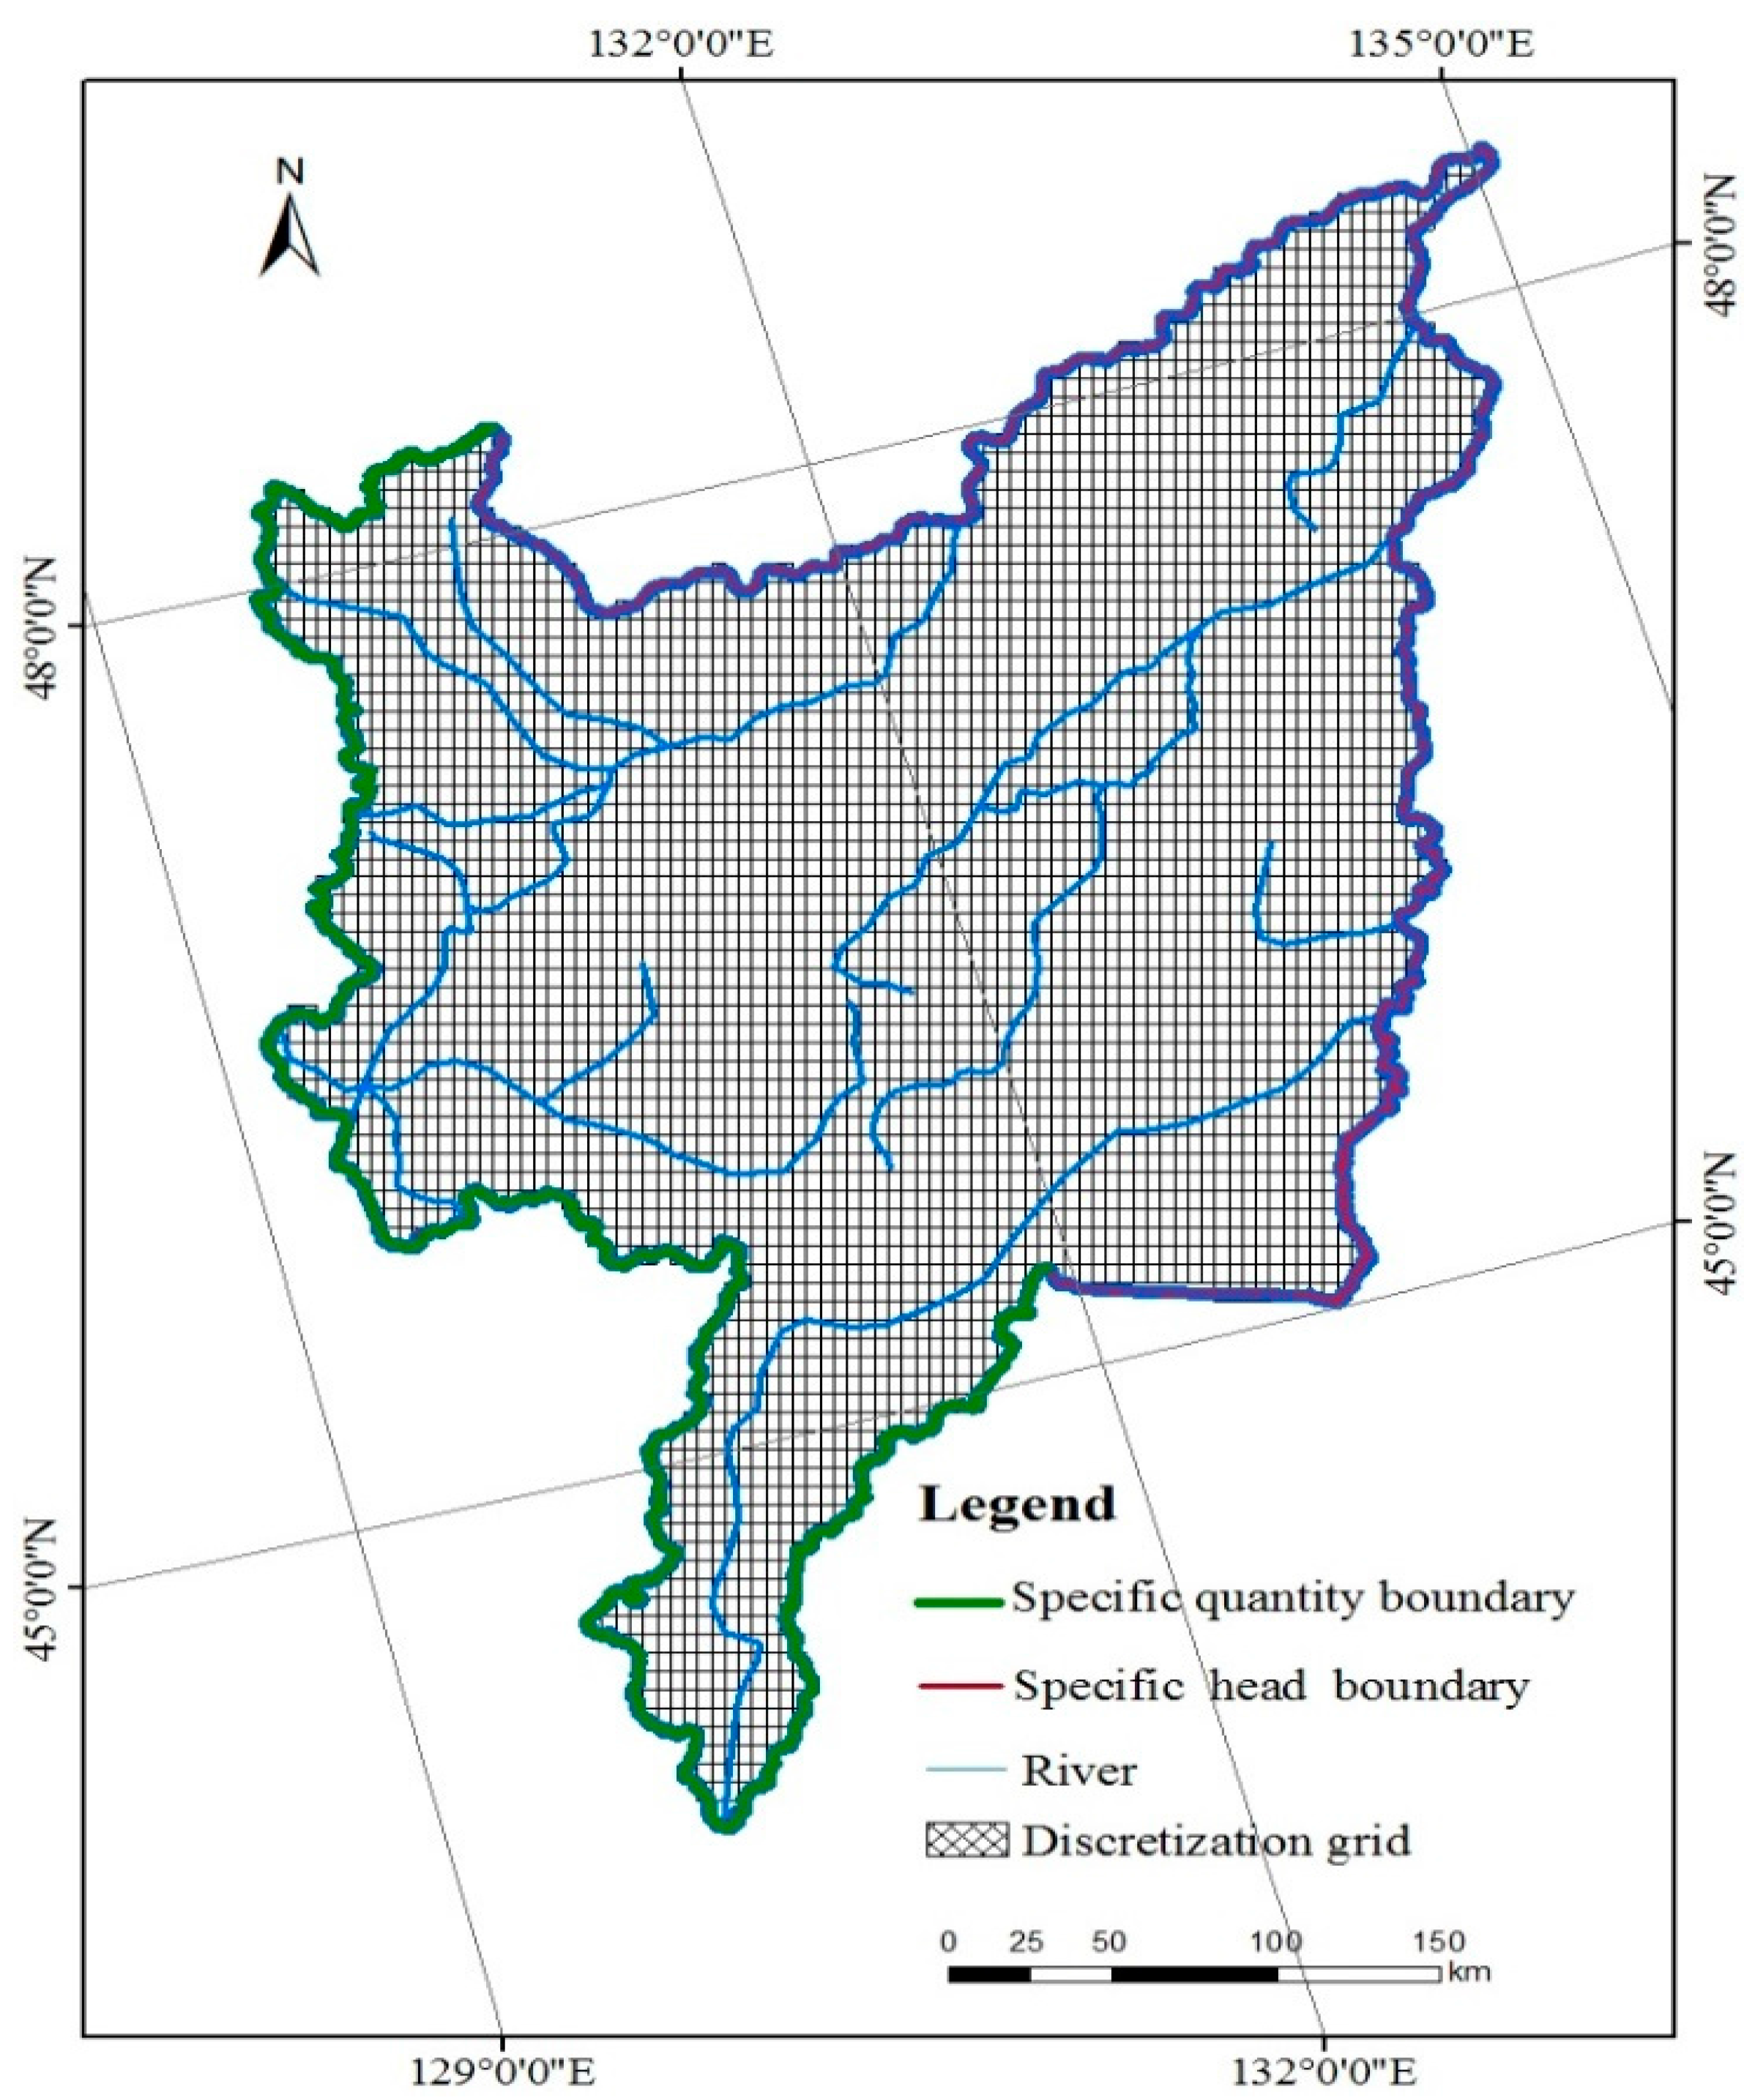
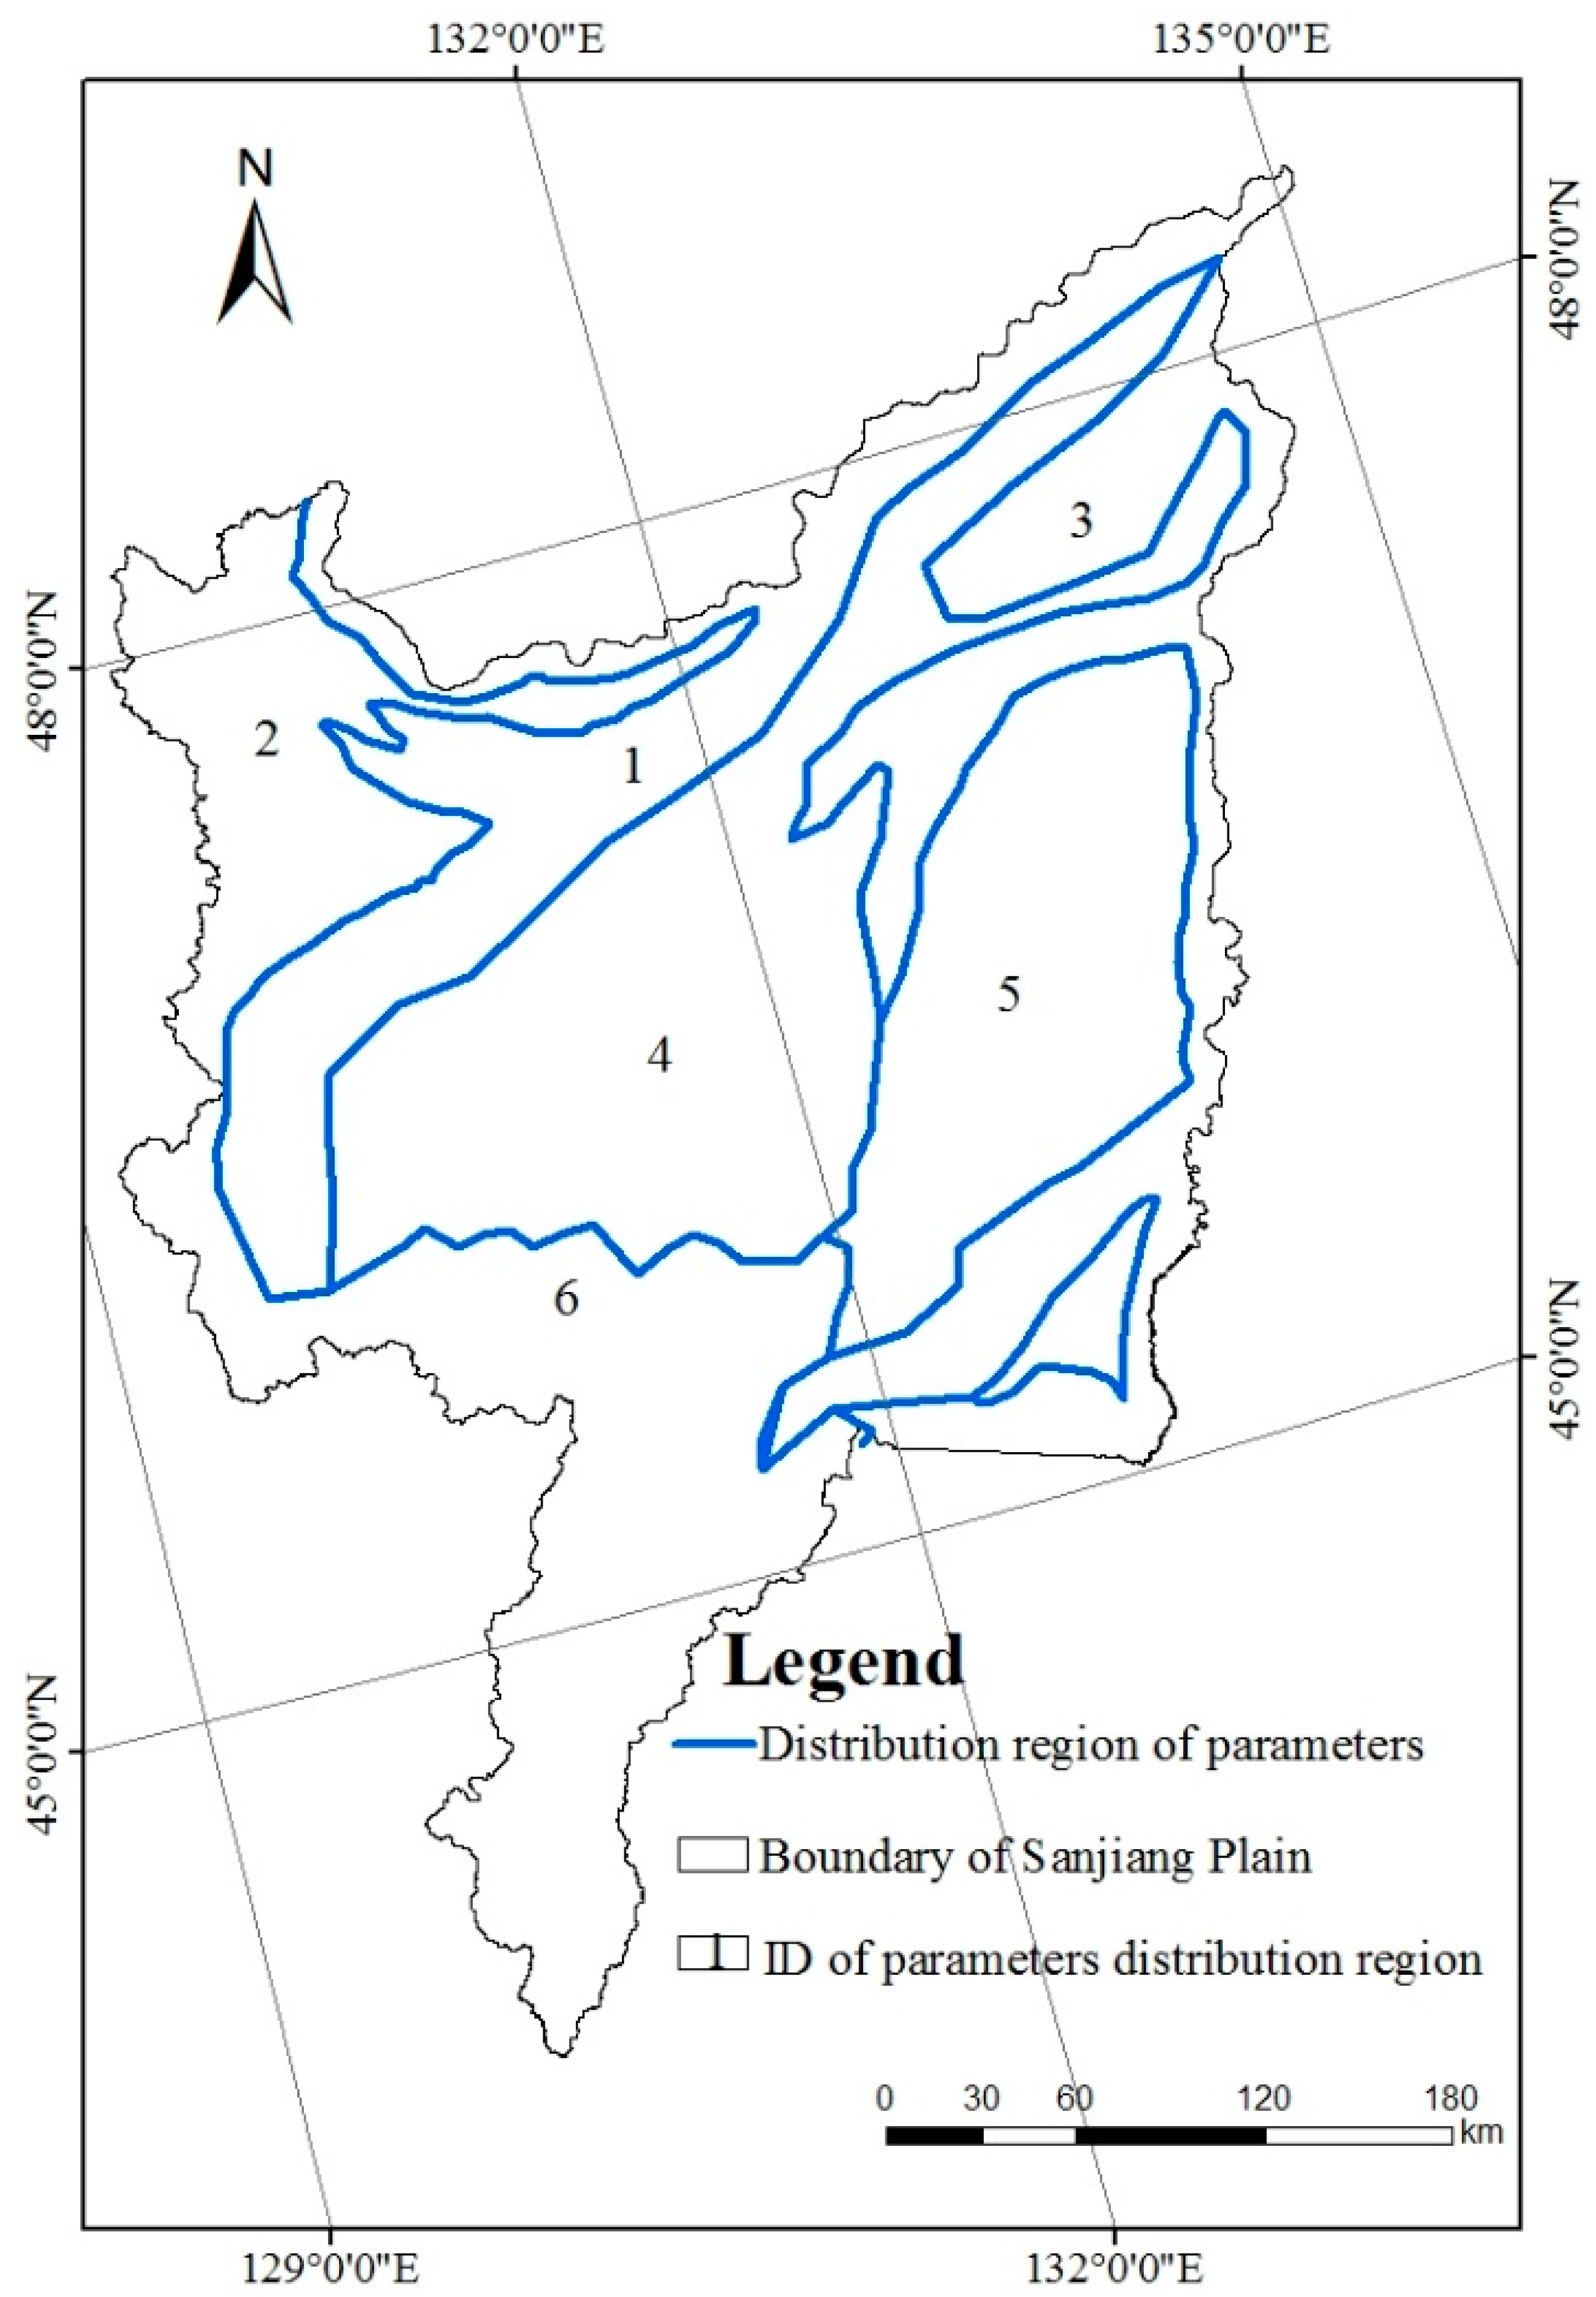
3.3.1. Model Discretization
Spatial Discretization
Temporal Discretization
3.3.2. Model Calibration
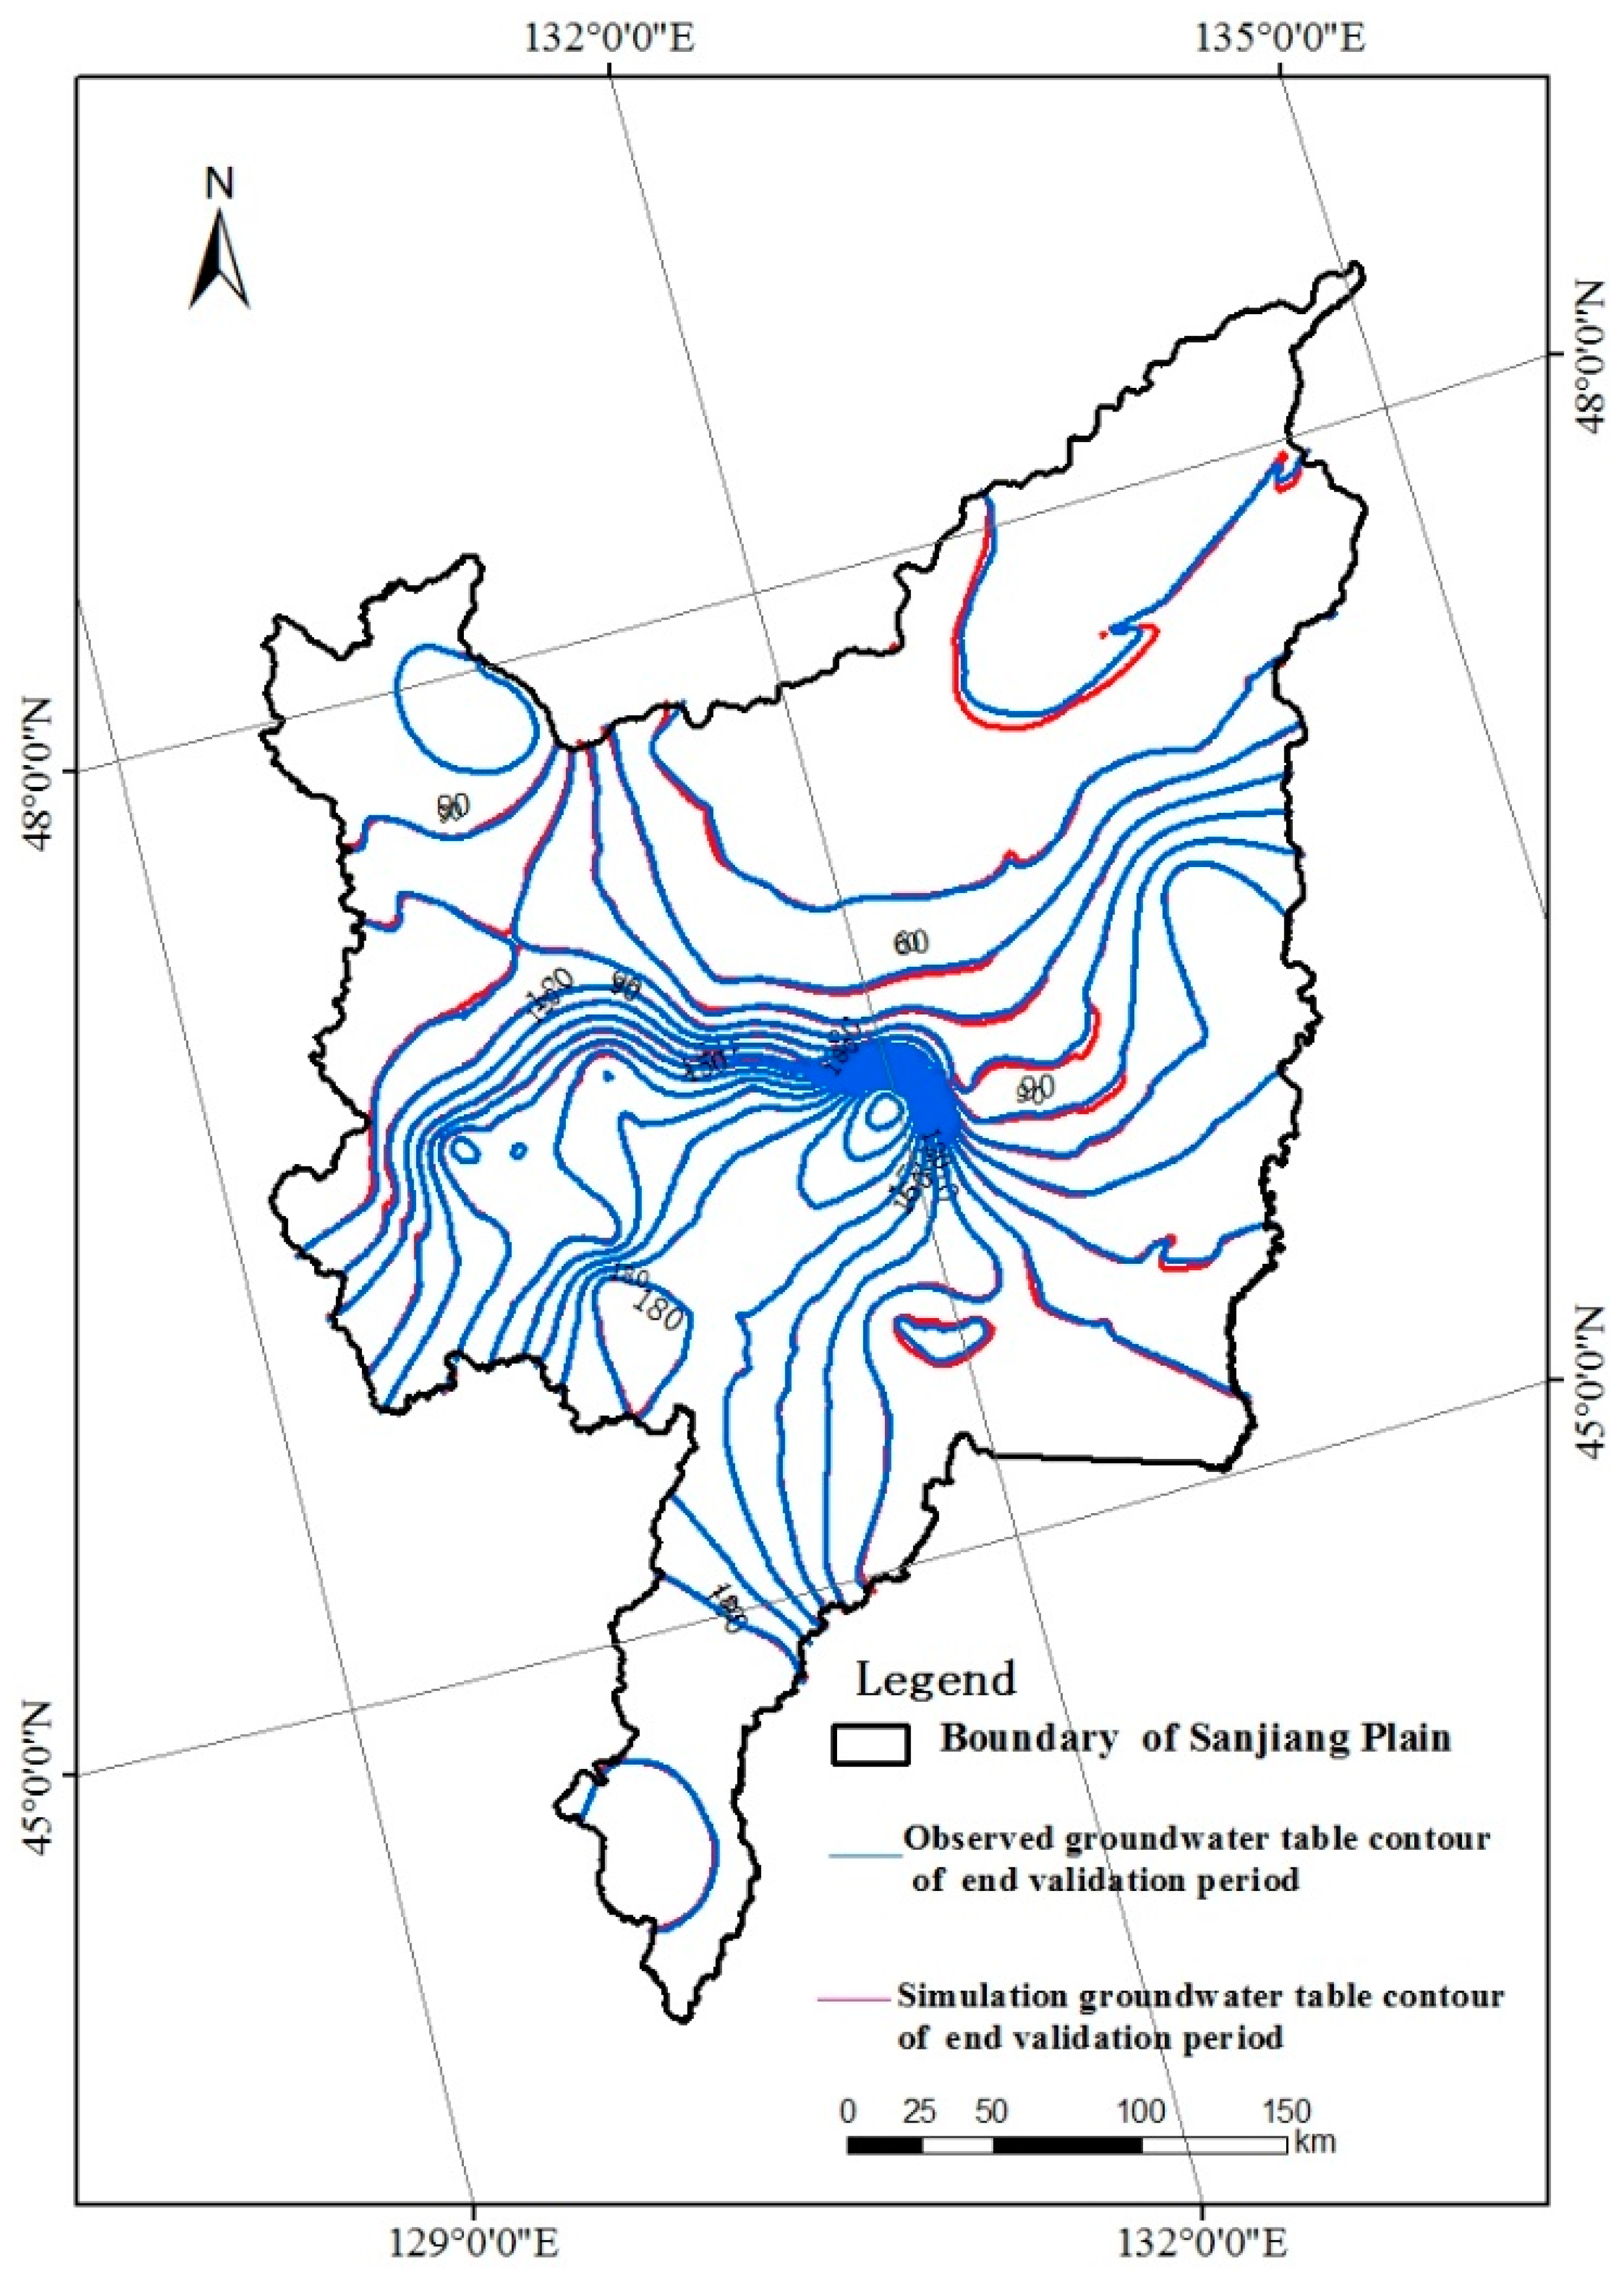
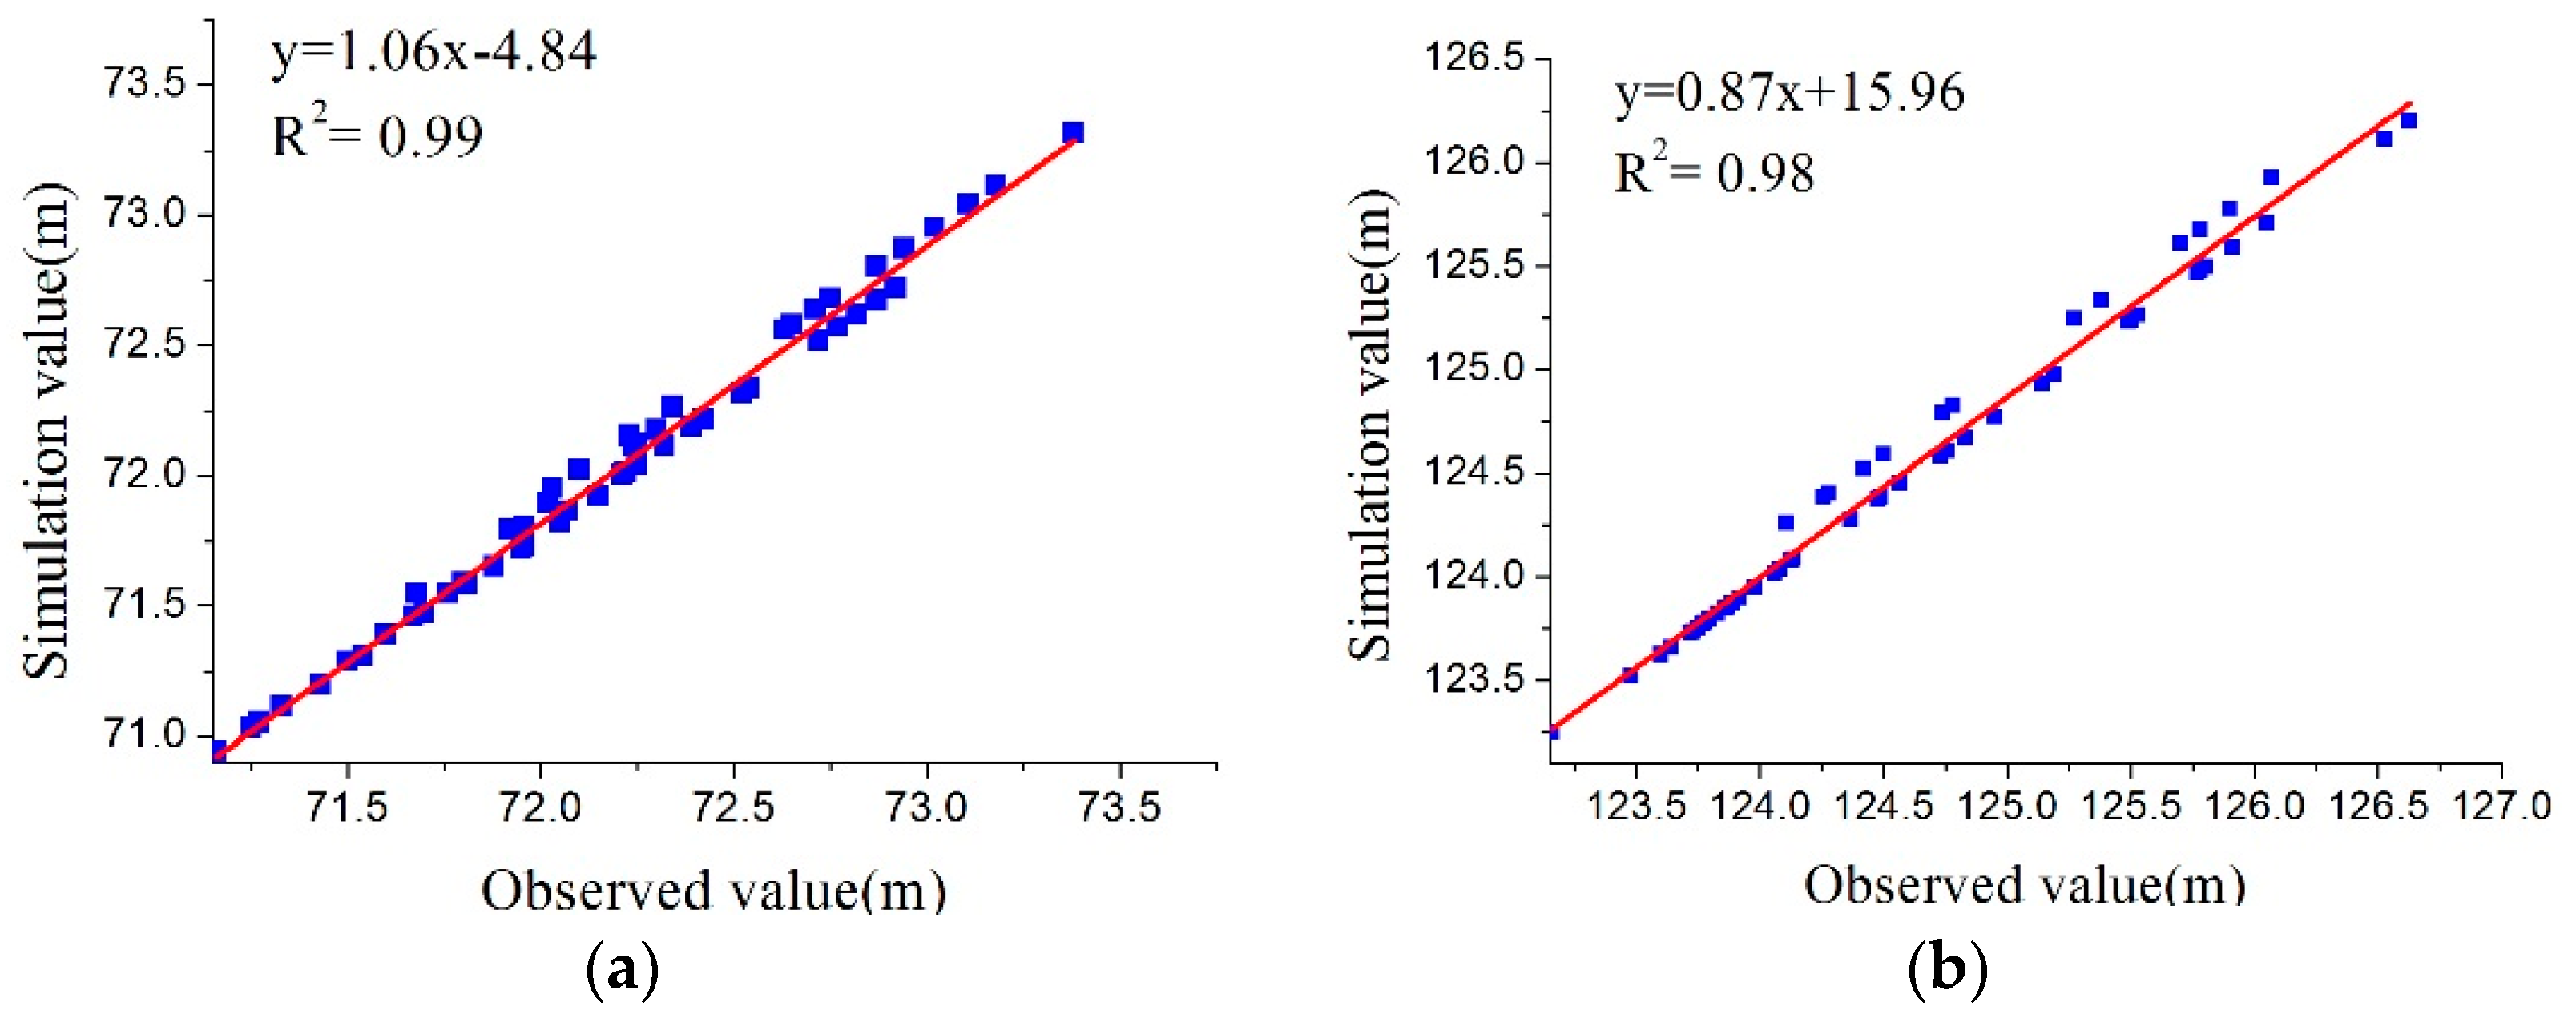
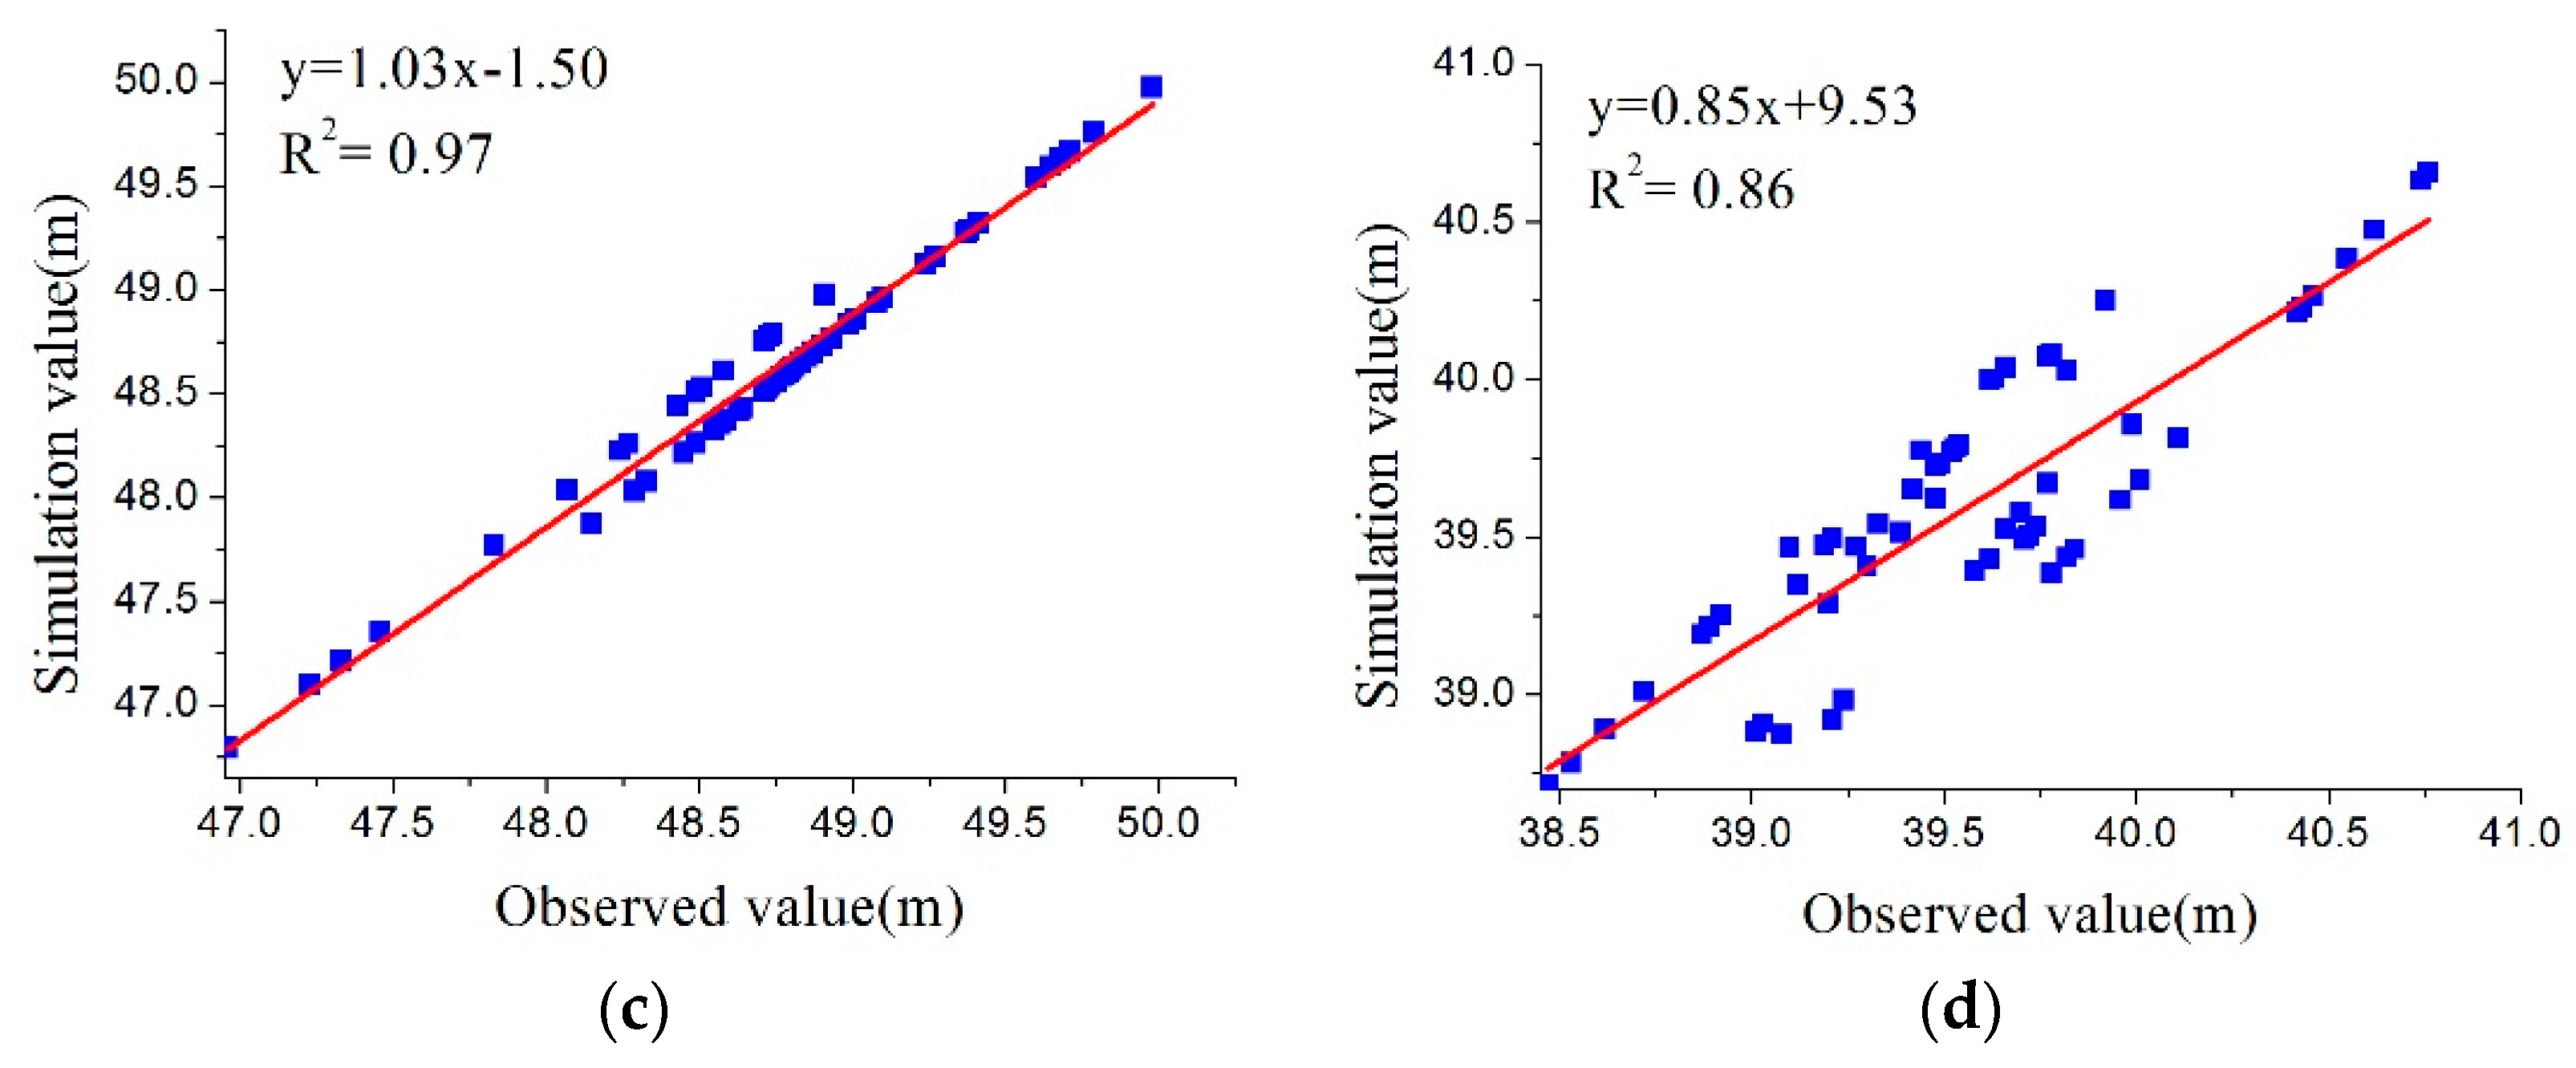
3.3.3. Model Validation
3.4. Simulation Scenarios
4. Results and Discussion
4.1. Current Allowable Groundwater and Surface Water Resources of the Sanjiang Plain
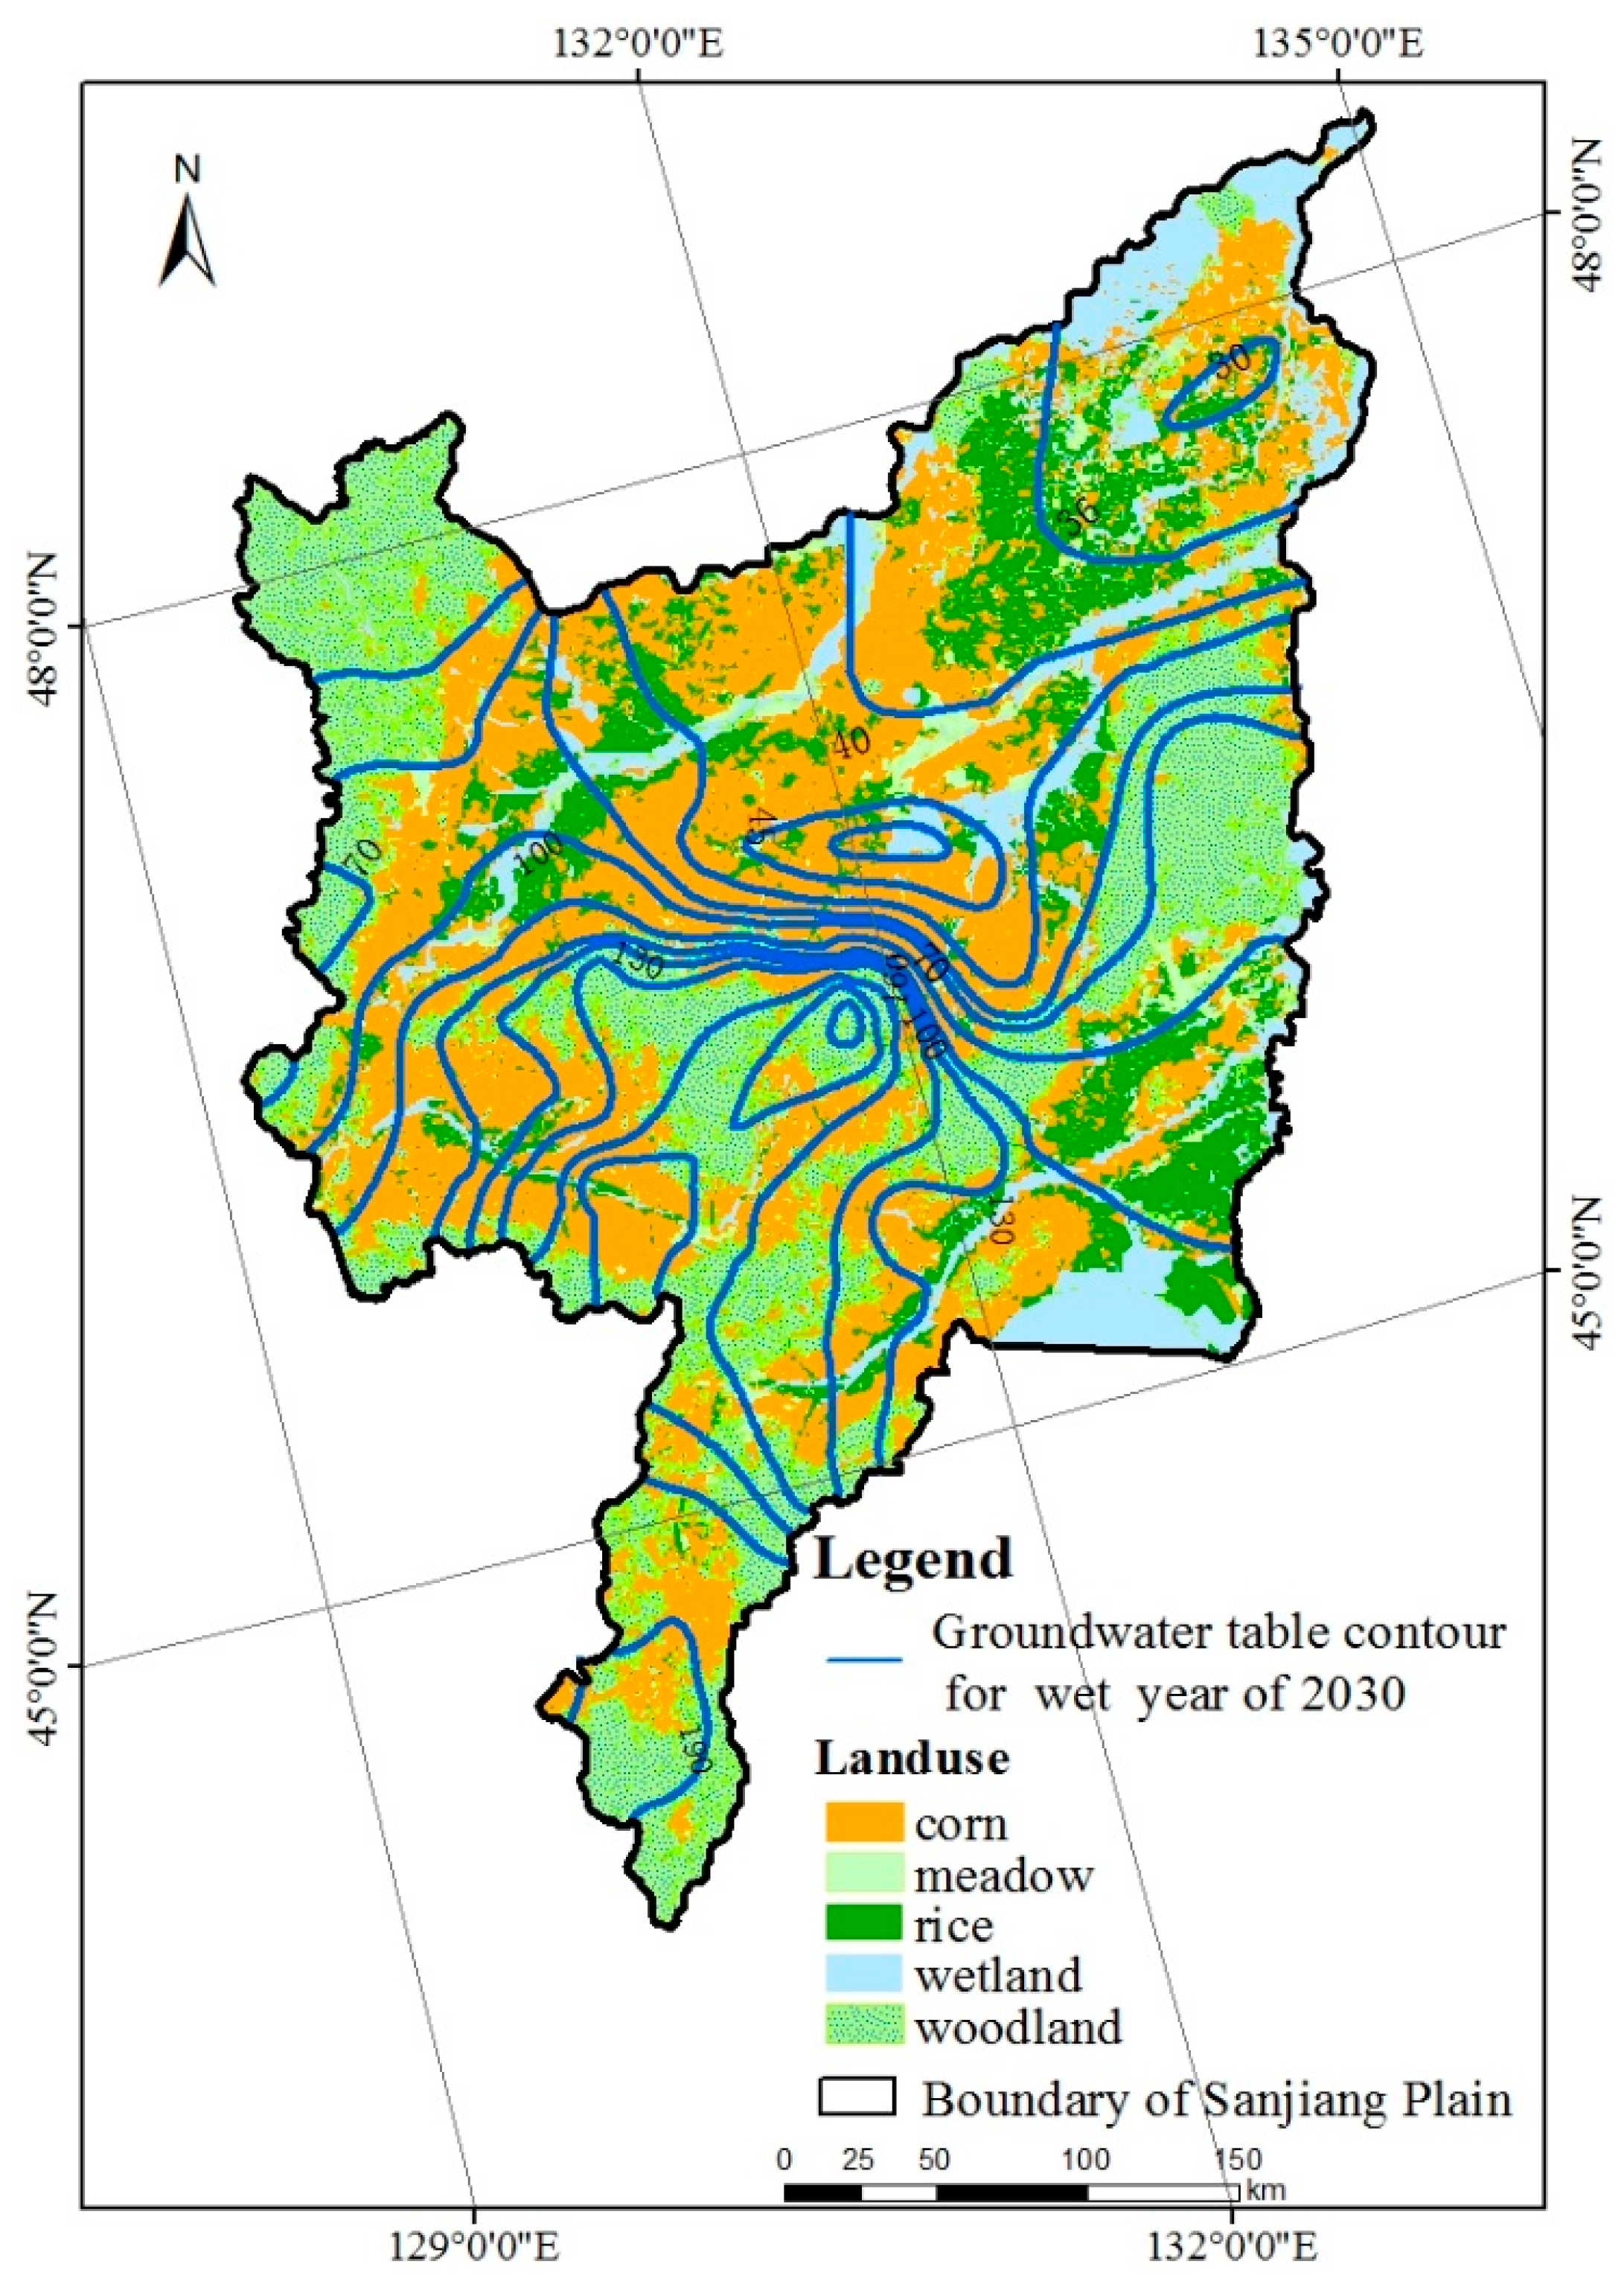
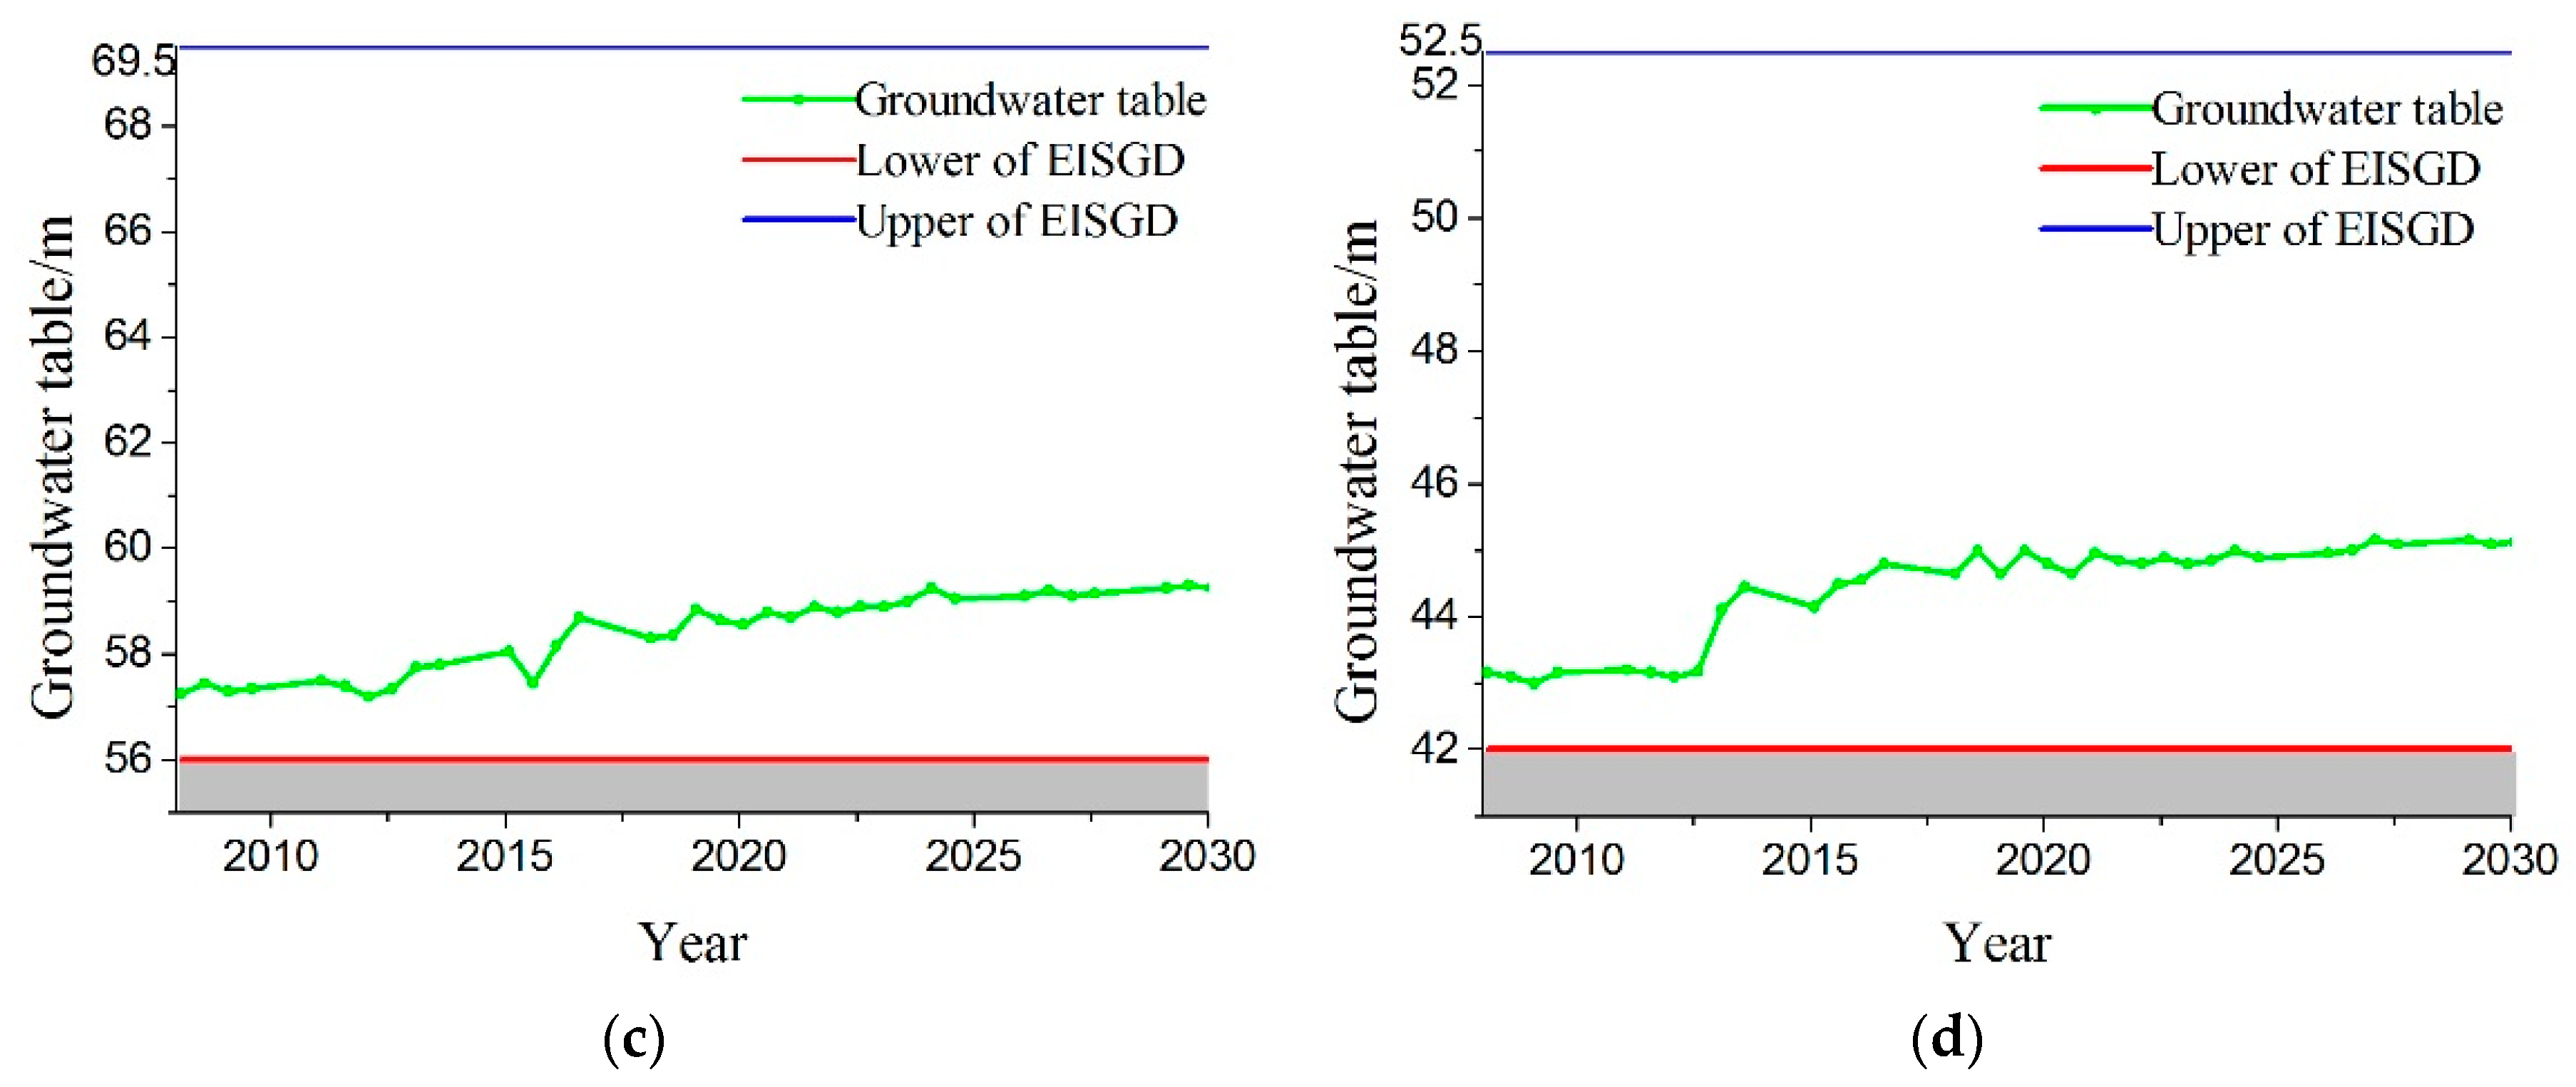
4.2. Projections of Future Groundwater-Surface Water Resources
5. Conclusions
Acknowledgments
Author Contributions
Conflicts of Interest
References
- Winter, T.C. Ground Water and Surface Water: A Single Resource; DIANE Publishing Inc.: Denver, CO, USA, 1998. [Google Scholar]
- Stonestrom, D.A.; Jim, C. Heat as a Tool for Studying the Movement of Ground Water near Streams; U.S. Department of the Interior: Washington, DC, USA; U.S. Geological Survey: Reston, VA, USA, 2003.
- Vandersteen, G.; Schneidewind, U.; Anibas, C. Determining groundwater-surface water exchange from temperature-time series: Combining a local polynomial method with a maximum likelihood estimator. Water Resour. Res. 2015, 51, 922–939. [Google Scholar] [CrossRef]
- Irvine, D.J.; Cranswick, R.H.; Simmons, C.T.; Shanafield, M.A.; Lautz, L.K. The effect of streambed heterogeneity on groundwater-surface water exchange fluxes inferred from temperature time series. Water Resour. Res. 2015, 51, 198–212. [Google Scholar] [CrossRef]
- Wang, W.K.; Dai, Z.X.; Zhao, Y.Q.; Li, J.T.; Duan, L.; Wang, Z.F.; Zhu, L. A quantitative analysis of hydraulic interactin processes in stream-aquifer systems. Sci. Rep. 2016, 6, 1–12. [Google Scholar]
- Herrea-Pantoja, M.; Hiscock, K.M.; Boar, R.R. The potential impact of climate change on groundwater-fed wetlands in Eastern England. Ecohydrology 2012, 5, 401–413. [Google Scholar] [CrossRef]
- Crosbie, R.S.; Scanlon, B.R.; Mpelasoka, F.S.; Reedy, R.C.; Gates, J.B.; Zhang, L. Potential climate change effects on groundwater recharge in the High Plains Aquifer, USA. Water Resour. Res. 2013, 49, 3936–3951. [Google Scholar] [CrossRef]
- Zeng, R.; Cai, X. Analyzing streamflow changes: Irrigation-enhanced interaction between aquifer and streamflow in the Republican River Basin. Hydrol. Earth Syst. Sci. Discuss. 2014, 10, 7783–7807. [Google Scholar] [CrossRef]
- Wang, X.H.; Zhang, G.X.; Xu, Y.J.; Sun, G.Z. Assessing the regional-scale groundwater-surface water interaction on the Sanjiang Plain, Northeast China. Environ. Sci. Pollut. Res. 2015, 22, 16951–16961. [Google Scholar] [CrossRef] [PubMed]
- Quan, J.; Dong, Z.C. Study on the joint regulation model of groundwater-surface water in the Shiyang river, China. Yellow River 2008, 5, 39–40. [Google Scholar]
- Meng, X.M. Couple Simulation and Predicting Study of Groundwater-Surface Water Model in the Jining City, China; Hehai University: Nanjing, China, 2007. [Google Scholar]
- Wang, L. Couple Simulation of Groundwater-Surface Water in the Jilin City, Northeast China; Jilin University: Changchun, China, 2014. [Google Scholar]
- Liu, X.G. Study on the Joint Regulation of Groundwater-Surface Water in the Huangshui River Basin, China; Jinan University: Guangzhou, China, 2010. [Google Scholar]
- Yang, X.; Yang, W.; Zhang, F.; Chu, Y.; Wang, Y. Investigation and Assessment of Groundwater Resources Potential and Eco-Environment Geology in Sanjiang Plain. China Geology Survey; Geological Publishing House: Beijing, China, 2010. [Google Scholar]
- Querner, E.P. The Combined Surface and Groundwater Flow Model MOGROW Applied to the Hupselse Beek Drainage Basin; IAHS Publ.: Maastricht, The Netherlands, 1994. [Google Scholar]
- Fleckenstein, J.; Michael, A.; Graham, F.; Jeffrey, M. Managing Surface Water-Groundwater to Restore Fall Flows in the Cosumnes River. J. Water Resour. Plan. Manag. 2004, 130, 301–310. [Google Scholar] [CrossRef]
- Danie, L.; Hector, M.; Justin, C. Conjunctive Management of Groundwater and Surface Water Resources in the Upper Ovens River Valley. In Proceedings of the Irrigation and Drainage Conference 2009: Irrigation Today—Meeting the Challenge, Swan Hill, Australia, 18–21 October 2009.
- Kevin, B.M.; David, P.A. Model reduction for combined surface water-groundwater management formulations. Environ. Model. Softw. 2016, 8, 102–110. [Google Scholar]
- Hamid, R.S.; Mahdieh, E. Conjunctive Use of Surface Water and Groundwater: Application of Support Vector Machines (SVMs) and Genetic Algorithms. Water Resour. Manag. 2013, 27, 2623–2644. [Google Scholar]
- Zhao, Q.; Han, Y.M. Analysis of stimulated recharge of groundwater on the Jiansanjiang Farming Bureau, Sanjiang Plain. J. Heilongjiang Hydraul. Eng. Coll. 2008, 3, 1–4. [Google Scholar]
- Pan, X.F.; Yan, B.X. Effects of land use and changes in cover on the transformation and transportation of iron: A case study of the Sanjiang Plain, Northeast China. Sci. China Earth Sci. 2011, 54, 686–693. [Google Scholar] [CrossRef]
- Wang, X.; Yan, B.X. The spatial variation and factors controlling the concentration of total dissolved iron in rivers, Sanjiang Plain. Clean Soil Air Water 2012, 40, 712–717. [Google Scholar] [CrossRef]
- Cao, Y.J.; Tang, C.Y.; Song, X.F.; Liu, C.M.; Zhang, Y.H. Characteristics of nitrate in major rivers and aquifers of the Sanjiang Plain, China. J. Environ. Monit. 2012, 14, 2624–2633. [Google Scholar] [CrossRef] [PubMed]
- Song, K.; Liu, D.; Wang, Z.; Zhang, B.; Jin, C.; Li, F.; Liu, H. Land use change in Sanjiang Plain and its driving forces analysis since 1954. J. Geogr. Sci. 2008, 63, 93–104. [Google Scholar]
- Wang, X.H.; Zhang, G.X.; Xu, Y.J. Defining an ecologically ideal shallow groundwater depth for regional sustainable management: Conceptual development and case Study on the Sanjiang Plain, Northeast China. Water 2015, 7, 3997–4025. [Google Scholar] [CrossRef]
- Li, F.P.; Zhang, G.X.; Xu, Y.J. Spatiotemporal variability of climate and streamflow in the Songhua River Basin, Northeast China. J. Hydrol. 2014, 514, 53–64. [Google Scholar] [CrossRef]
- Li, Y.F. Study on the eco-environmental changes in Sanjiang Plain during recent years. Environ. Sci. Manag. 2013, 38, 42–46. [Google Scholar]
- Wang, X.; Zhang, G.; Xu, Y.J. Spatiotemporal groundwater recharge estimation for the largest rice production region in Sanjiang Plain, Northeast China. J. Water Supply Res. Technol. 2014, 63, 630–641. [Google Scholar] [CrossRef]
- Pandy, S.; Huyakorn, P.S. A full coupled physically-based spatially-distributed model for evaluating surface/subsurface flow. Adv. Water Resour. 2004, 27, 361–382. [Google Scholar] [CrossRef]
- Jon, P.J. Simulating Hydrologic System Using a Physically Based, Surface-Subsurface Model: Issues Concerning Flow, Transport and Parameterization. Ph.D. Thesis, University of Waterloo, Toronto, ON, Canada, 2005. [Google Scholar]
- Liggett, J.E.; Werner, A.D.; Simmons, C.T. Influence of the first-order exchange coefficient on simulation of coupled surface–subsurface flow. J. Hydrol. 2012, 414, 503–515. [Google Scholar] [CrossRef]
- Batelaan, O.; Smedt, D.F. WetSpass: A flexible, GIS based, distributed recharge methodology for regional groundwater modelling. In Proceedings of the Sixth IAHS Scientific Assembly on Impact of Human Activity on Groundwater Dynamics, Maastricht, The Netherlands, 18–27 July 2001; pp. 11–18.
- Zhang, X.B. Groundwater modeling system (GMS) software. Hydrogeol. Eng. Geol. 2003, 5, 53256. [Google Scholar]
- Moriasi, D.N.; Arnold, J.G.; Van Liew, M.W.; Bingner, R.L.; Harmel, R.D.; Veith, T.L. Model Evaluation Guidelines for Systematic Quantification of Accuracy in Watershed Simulations. Trans. ASABE 2007, 50, 885–900. [Google Scholar] [CrossRef]
- Peng, S.Z.; Xu, J.Z.; Huang, Q.; Liu, F.L. Controlled irrigation of paddy rice and environmental multifunctionality. J. Shenyang Agric. Univ. 2004, 35, 443–445. [Google Scholar]
- Wang, X.H.; Lu, W.X.; Xu, Y.J.; Zhang, G.X.; Qu, W.; Cheng, W.G. The positive impacts of irrigation schedules on rice yield and water consumption: Synergies in Jilin Province, Northeast China. Int. J. Agric. Sustain. 2016, 14, 1–12. [Google Scholar] [CrossRef]
- Nie, X.; Wang, Y.Y.; Liu, X.T.; Zhao, Z.C.; Ma, T.T. Water consumption and water use efficiency of rice of Sanjiang plain under control irrigation. Syst. Sci. Compr. Stud. Agric. 2011, 27, 228–232. [Google Scholar]
- Sun, D.W.; Yu, H.Y. Effect analysis on water control irrigation technology of rice in Heilongjiang reclamation area. J. Northeast Agric. Univ. 2008, 39, 104–107. [Google Scholar]


| ID | K(m/d) | μ | α(m−1) | β | Sγ | Lp |
|---|---|---|---|---|---|---|
| 1 | 30 (32) | 0.25 (0.3) | 4.23 (4.21) | 1.16 (1.15) | 0.032 (0.046) | 1.42 (0.41) |
| 2 | 15 (18) | 0.14 (0.20) | 4.17 (4.07) | 1.32 (1.28) | 0.025 (0.032) | 1.32 (1.36) |
| 3 | 20 (20) | 0.21 (0.21) | 2.04 (1.78) | 1.21 (1.04) | 0.0.21 (0.024) | 1.26 (0.25) |
| 4 | 16 (20) | 0.11 (0.10) | 1.26 (1.3) | 1.28 (1.30) | 0.096 (0.097) | 1.34 (1.42) |
| 5 | 1 (2) | 0.05 (0.05) | 1.62 (1.56) | 1.04 (1.19) | 0.065 (0.065) | 1.64 (1.82) |
| 6 | 1 (1.5) | 0.03 (0.03) | 2.43 (2.43) | 1.64 (1.64) | 0.042 (0.056) | 1.01 (0.64) |
| Name | Woodland | Meadow | Wetland | Rice | Corn |
|---|---|---|---|---|---|
| Manning roughness coefficient | 0.52 | 0.01 | 0.08 | 0.04 | 0.7 |
| (0.62) | (0.04) | (0.06) | (0.05) | (0.2) | |
| Depression storage (m) | 0.031 | 0.002 | 0.0001 | 0 | 0.008 |
| (0.03) | (0.003) | (0.002) | (0) | (0.002) | |
| Reduced storage (m) | 0.0002 | 0.0001 | 0 | 0 | 0.0001 |
| (0.002) | (0.0002) | (0) | (0) | (0.001) | |
| Coupling length (m) | 0.4 | 0.7 | 0.05 | 0.02 | 0.56 |
| (0.2) | (0.5) | (0.02) | (0.02) | (0.3) |
| Year | 2008 | 2009 | 2010 | ||||||||||
|---|---|---|---|---|---|---|---|---|---|---|---|---|---|
| Station | Month | OBV | SMV | RE (%) | NSE | OBV | SMV | RE (%) | NSE | OBV | SMV | RE (%) | NSE |
| Baoan station | 1 | 0.02 | 0.021 | 5 | 0.99 | 0.23 | 0.19 | 17.4 | 0.99 | 0.019 | 0.022 | 15.8 | 0.99 |
| 2 | 0.1 | 0.11 | 10 | 0.99 | 0.21 | 0.24 | 14.3 | 0.99 | 0.02 | 0.017 | 15 | 0.99 | |
| 3 | 1.54 | 1.78 | 15.6 | 0.99 | 0.012 | 0.01 | 16.7 | 0.99 | 0.053 | 0.045 | 15.1 | 0.99 | |
| 4 | 5.13 | 4.23 | 17.5 | 0.96 | 4.11 | 3.46 | 15.8 | 0.99 | 15.1 | 13.86 | 8.2 | 0.98 | |
| 5 | 11.8 | 12.56 | 6.4 | 0.99 | 2.44 | 2.04 | 16.4 | 0.99 | 31.6 | 29.36 | 7.1 | 0.99 | |
| 6 | 5.22 | 4.63 | 11.3 | 0.98 | 6.04 | 5.89 | 2.5 | 0.99 | 4.69 | 4.15 | 11.5 | 0.90 | |
| 7 | 3.07 | 3.61 | 17.6 | 0.98 | 19.1 | 18.32 | 4.1 | 1.00 | 6.14 | 5.96 | 2.9 | 0.89 | |
| 8 | 1.57 | 1.68 | 7 | 0.98 | 23.6 | 21.56 | 8.6 | 0.99 | 11 | 9.6 | 12.7 | 0.91 | |
| 9 | 1.02 | 1.16 | 13.7 | 0.98 | 7.61 | 7.02 | 7.8 | 0.99 | 3.6 | 3.15 | 12.5 | 0.97 | |
| 10 | 1.2 | 1.36 | 13.3 | 0.98 | 3.12 | 2.98 | 4.5 | 0.99 | 2.65 | 2.34 | 11.7 | 0.99 | |
| 11 | 0.73 | 0.82 | 12.3 | 0.98 | 1.44 | 1.18 | 18.1 | 0.99 | 1.48 | 1.36 | 8.1 | 0.99 | |
| 12 | 0.145 | 0.163 | 12.4 | 0.98 | 0.488 | 0.402 | 17.6 | 0.99 | 0.34 | 0.28 | 17.6 | 0.99 | |
| River | Average Runoff per Year (108 m3) | River Ecological Water Requirement (108 m3) | Allowable Surface Water Resources (108 m3) | Allowable Groundwater Resources (108 m3) | ||
|---|---|---|---|---|---|---|
| Baseflow | Sand Washing | Water Requirement of Aquatic Life | ||||
| Songhua | 69.19 | 13.84 | 6.57 | 27.68 | 38.05 | - |
| Naoli | 34.92 | 6.98 | 3.14 | 13.97 | 19.21 | - |
| Woken | 49.24 | 9.85 | 4.48 | 19.7 | 27.08 | - |
| Total | 153.35 | 30.67 | 14.2 | 61.34 | 47.14 | 46.54 |
| Scenarios | Precipitation Assurance | The Change of Aquifer Water Storage (×108 m3) |
|---|---|---|
| Scenario A | 25% | −38.3 |
| 50% | −53.98 | |
| 75% | −64.84 | |
| Scenario B | 25% | 18.36 |
| 50% | 6.23 | |
| 75% | −5.72 | |
| Scenario C | 25% | 22.61 |
| 50% | 11.2 | |
| 75% | 4.77 |
| Scenario | Precipitation Assurance (%) | Allowable Using Water Resources (108 m3) | Conventional Irrigation | Saving Irrigation | |||||
|---|---|---|---|---|---|---|---|---|---|
| Groundwater | Surface Water | Supporting Rice Area by Groundwater (104 Hectare) | Supporting Rice Area by Surface Water (104 Hectare) | Total | Supporting Rice Area by Groundwater (104 Hectare) | Supporting Rice Area by Surface Water (104 Hectare) | Total | ||
| B | 25 | 53.61 | 43.49 | 72.0 | 59.3 | 131.3 | 121.0 | 98.7 | 219.7 |
| 50 | 48.64 | 45.04 | 65.3 | 61.3 | 126.6 | 110.0 | 102.7 | 212.7 | |
| 75 | 46.34 | 45.04 | 62.7 | 60.7 | 133.4 | 105.3 | 102.0 | 207.3 | |
| Scenario | Precipitation Assurance (%) | Allowable Using Water Resources (108 m3) | Needing More Water Quantity (108 m3) | |
|---|---|---|---|---|
| Groundwater | Surface Water | |||
| C | 25 | 65.01 | 86.1 | 38.96 |
| 50 | 58.46 | 92.65 | 45.51 | |
| 75 | 50.35 | 100.76 | 53.62 | |
© 2016 by the authors; licensee MDPI, Basel, Switzerland. This article is an open access article distributed under the terms and conditions of the Creative Commons Attribution (CC-BY) license (http://creativecommons.org/licenses/by/4.0/).
Share and Cite
Wang, X.; Zhang, G.; Xu, Y.J. Groundwater and Surface Water Availability via a Joint Simulation with a Double Control of Water Quantity and Ecologically Ideal Shallow Groundwater Depth: A Case Study on the Sanjiang Plain, Northeast China. Water 2016, 8, 396. https://doi.org/10.3390/w8090396
Wang X, Zhang G, Xu YJ. Groundwater and Surface Water Availability via a Joint Simulation with a Double Control of Water Quantity and Ecologically Ideal Shallow Groundwater Depth: A Case Study on the Sanjiang Plain, Northeast China. Water. 2016; 8(9):396. https://doi.org/10.3390/w8090396
Chicago/Turabian StyleWang, Xihua, Guangxin Zhang, and Y. Jun Xu. 2016. "Groundwater and Surface Water Availability via a Joint Simulation with a Double Control of Water Quantity and Ecologically Ideal Shallow Groundwater Depth: A Case Study on the Sanjiang Plain, Northeast China" Water 8, no. 9: 396. https://doi.org/10.3390/w8090396
APA StyleWang, X., Zhang, G., & Xu, Y. J. (2016). Groundwater and Surface Water Availability via a Joint Simulation with a Double Control of Water Quantity and Ecologically Ideal Shallow Groundwater Depth: A Case Study on the Sanjiang Plain, Northeast China. Water, 8(9), 396. https://doi.org/10.3390/w8090396