
Analysis of Long-Term Water Level Variation in Dongting Lake, China


Abstract
:1. Introduction
2. Materials and Methods
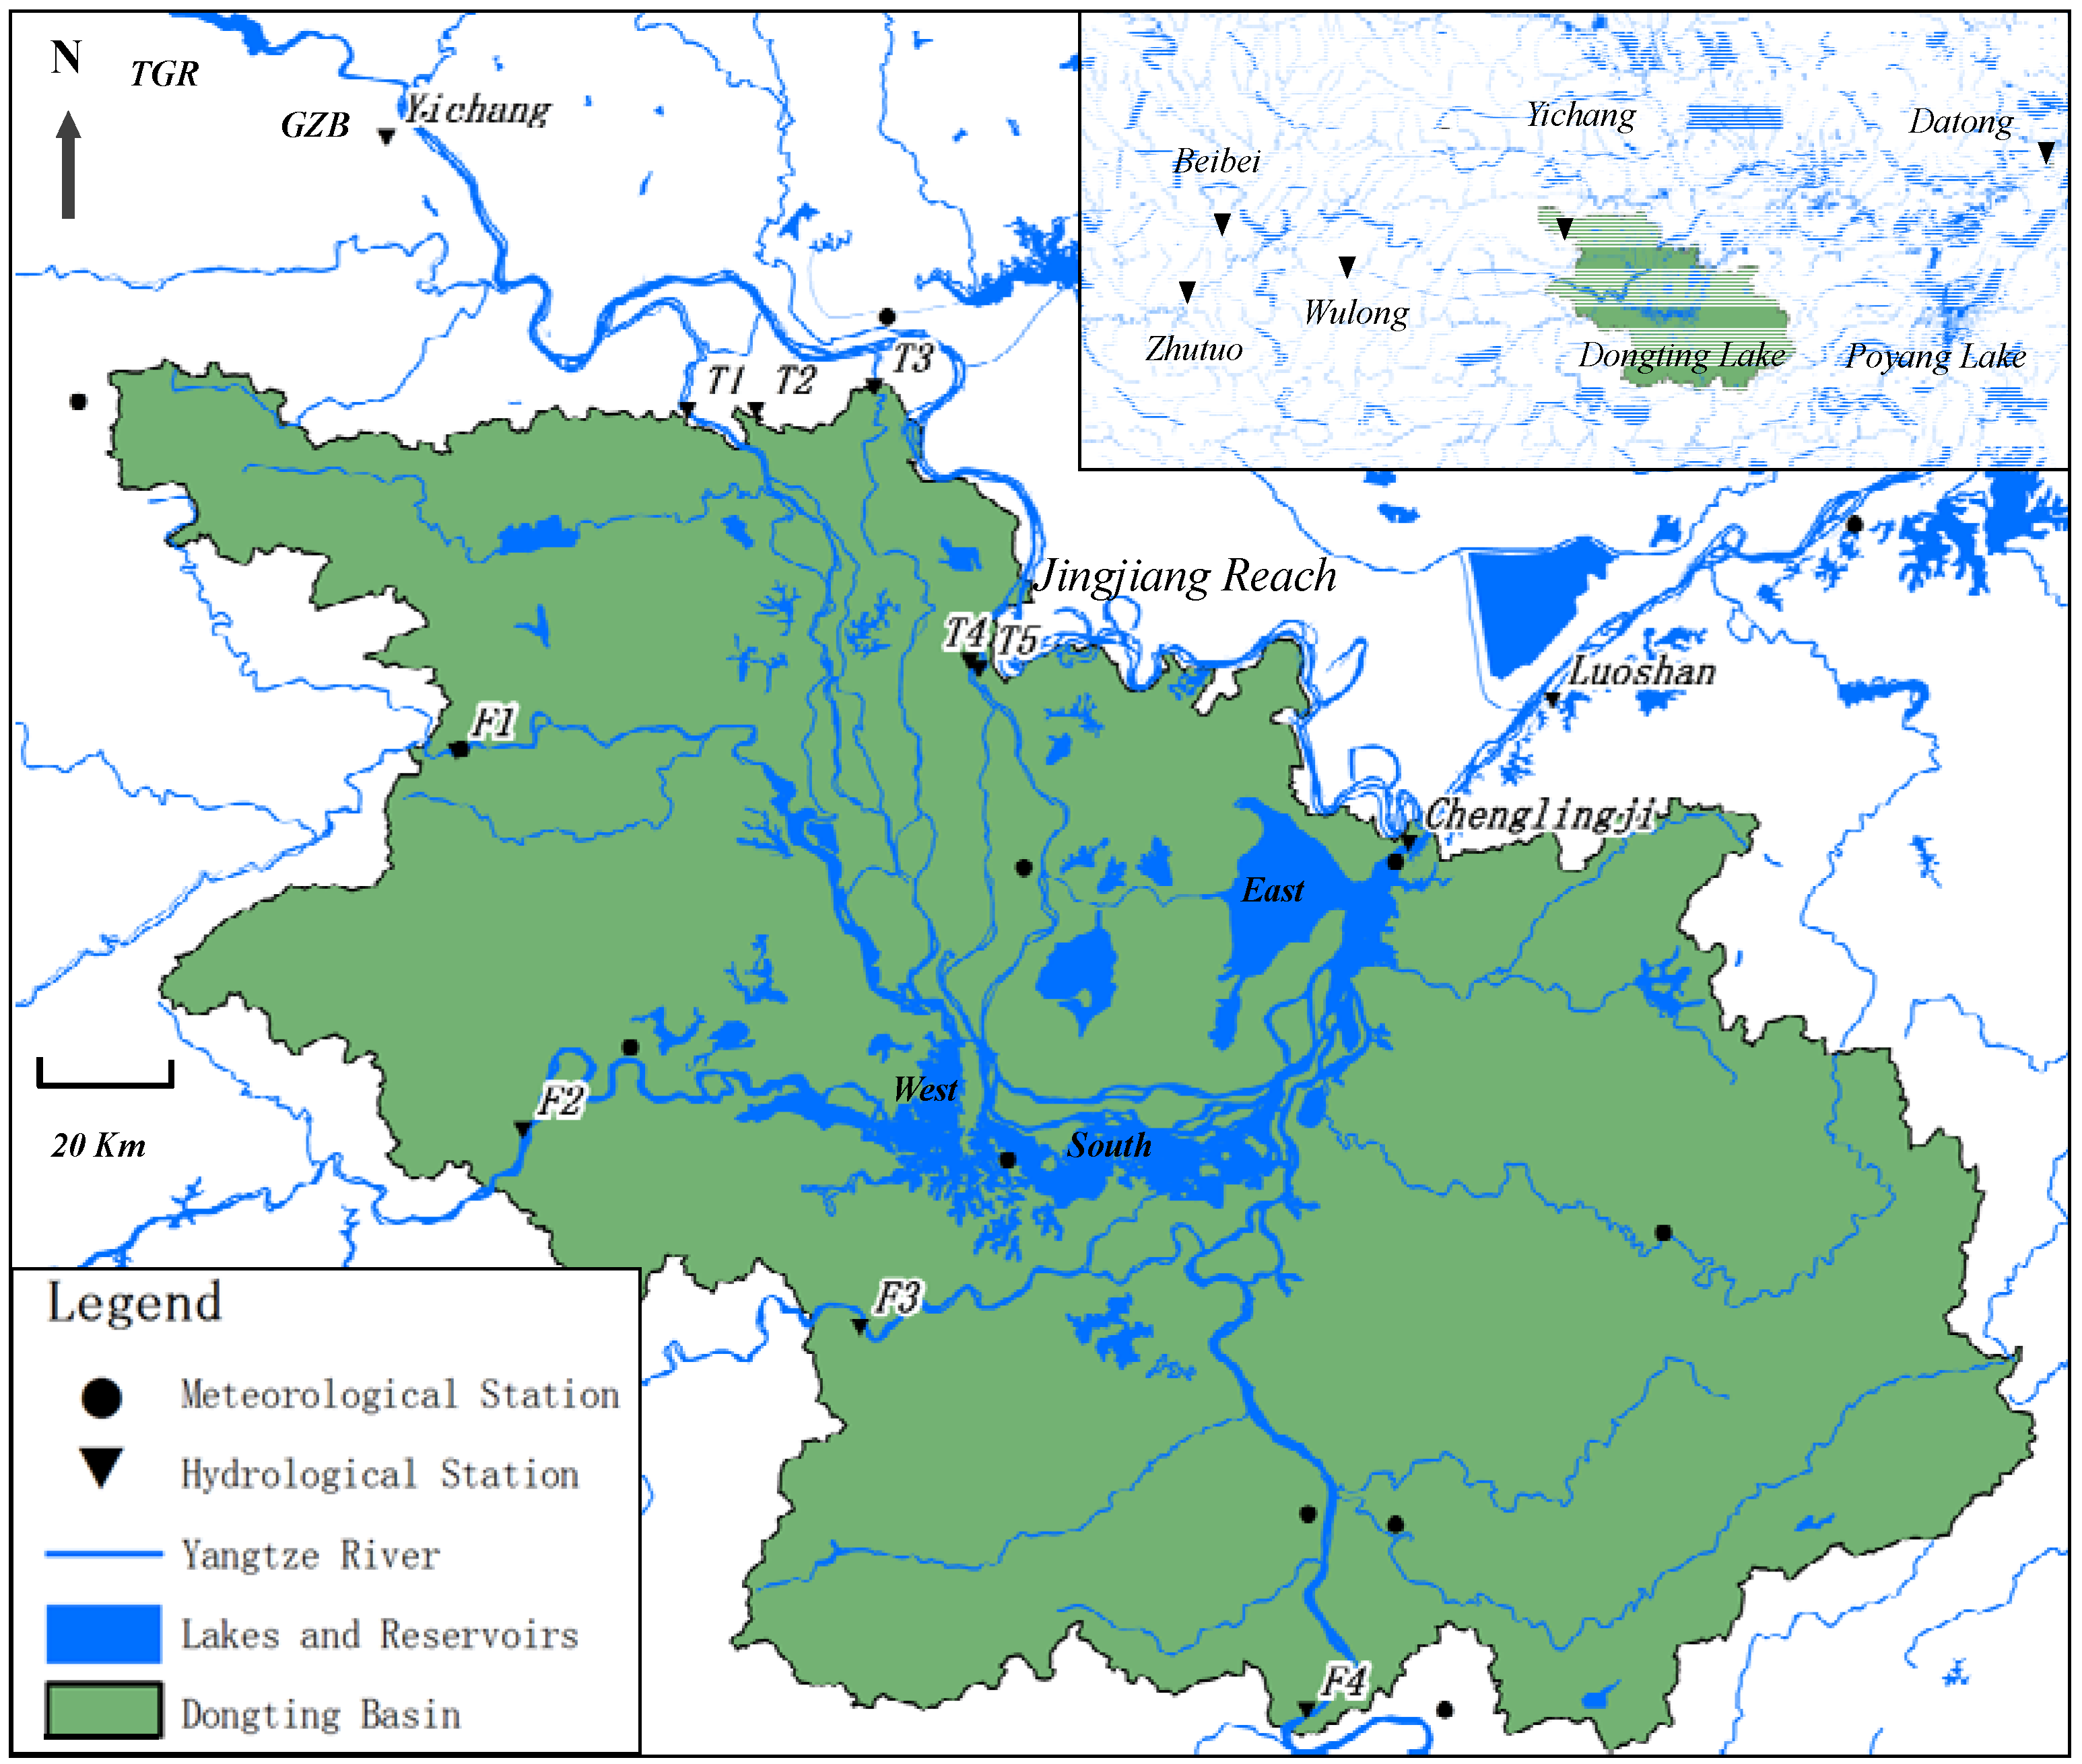
2.1. Study Area and Data
2.2. Methodology
2.3. Determining the Hydrological Variables
3. Results of Water Level Variation at Dongting Lake
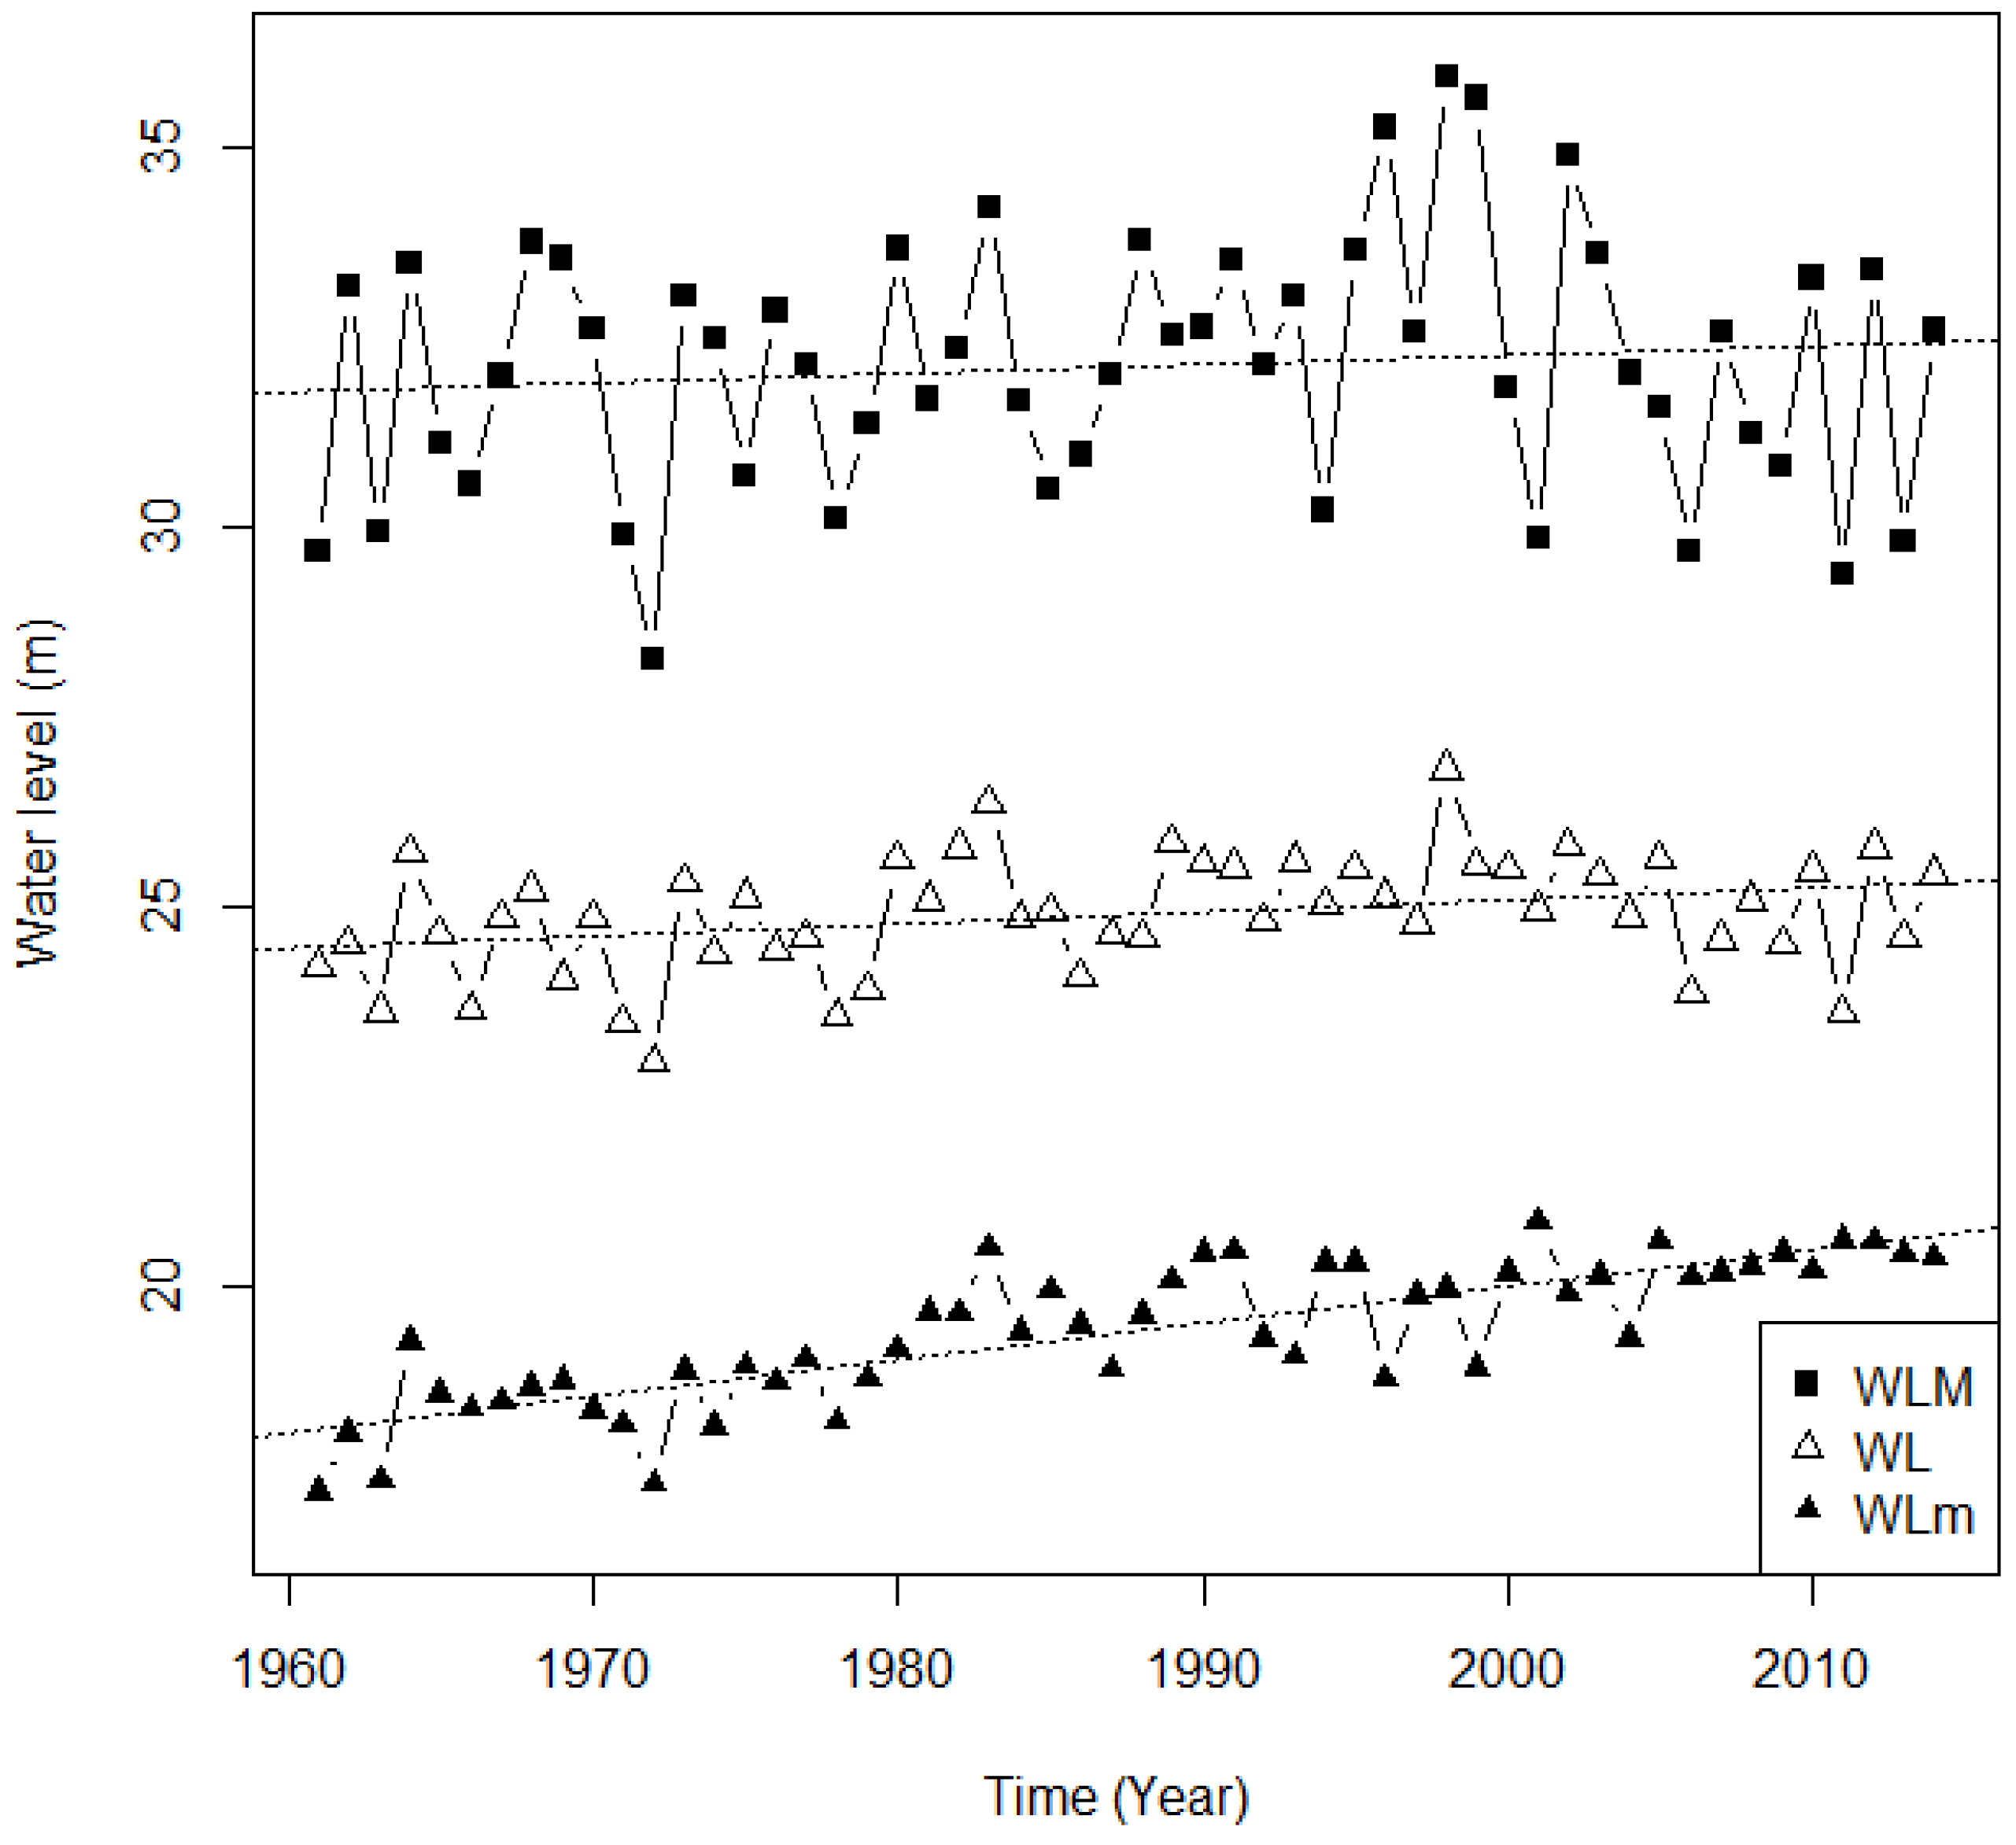
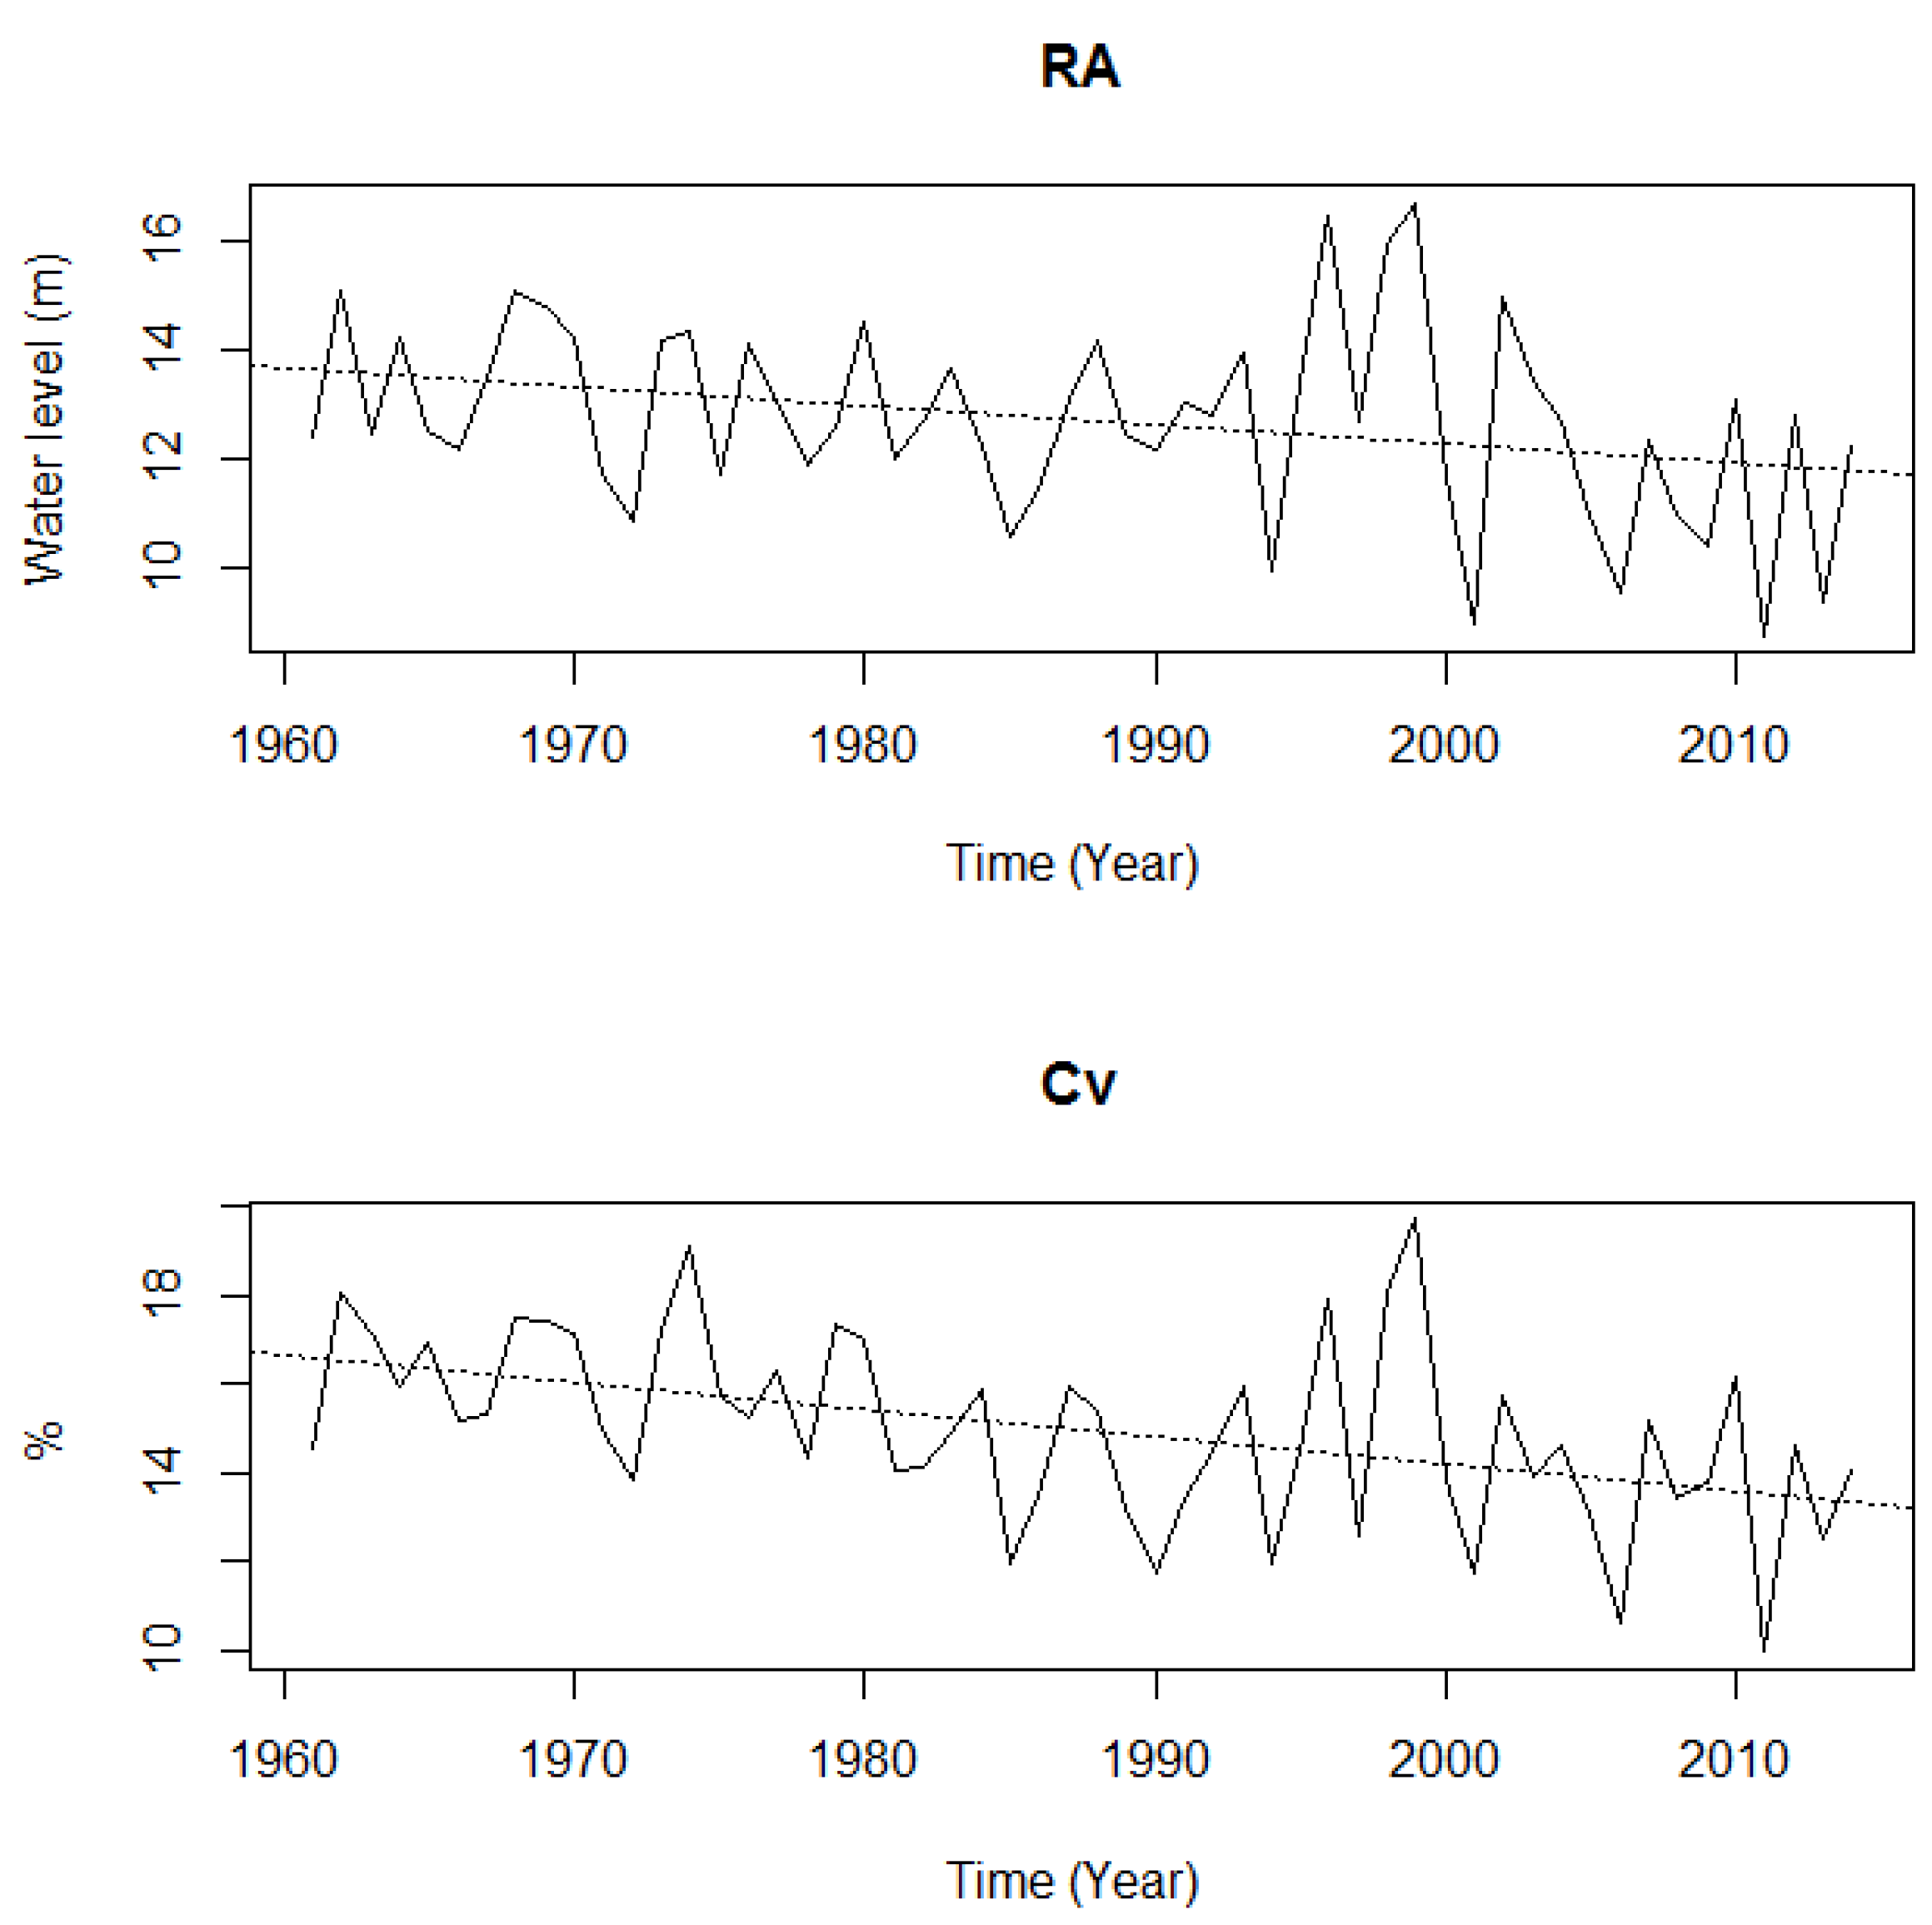
3.1. The Results of Lake Water Level from 1961 to 2014
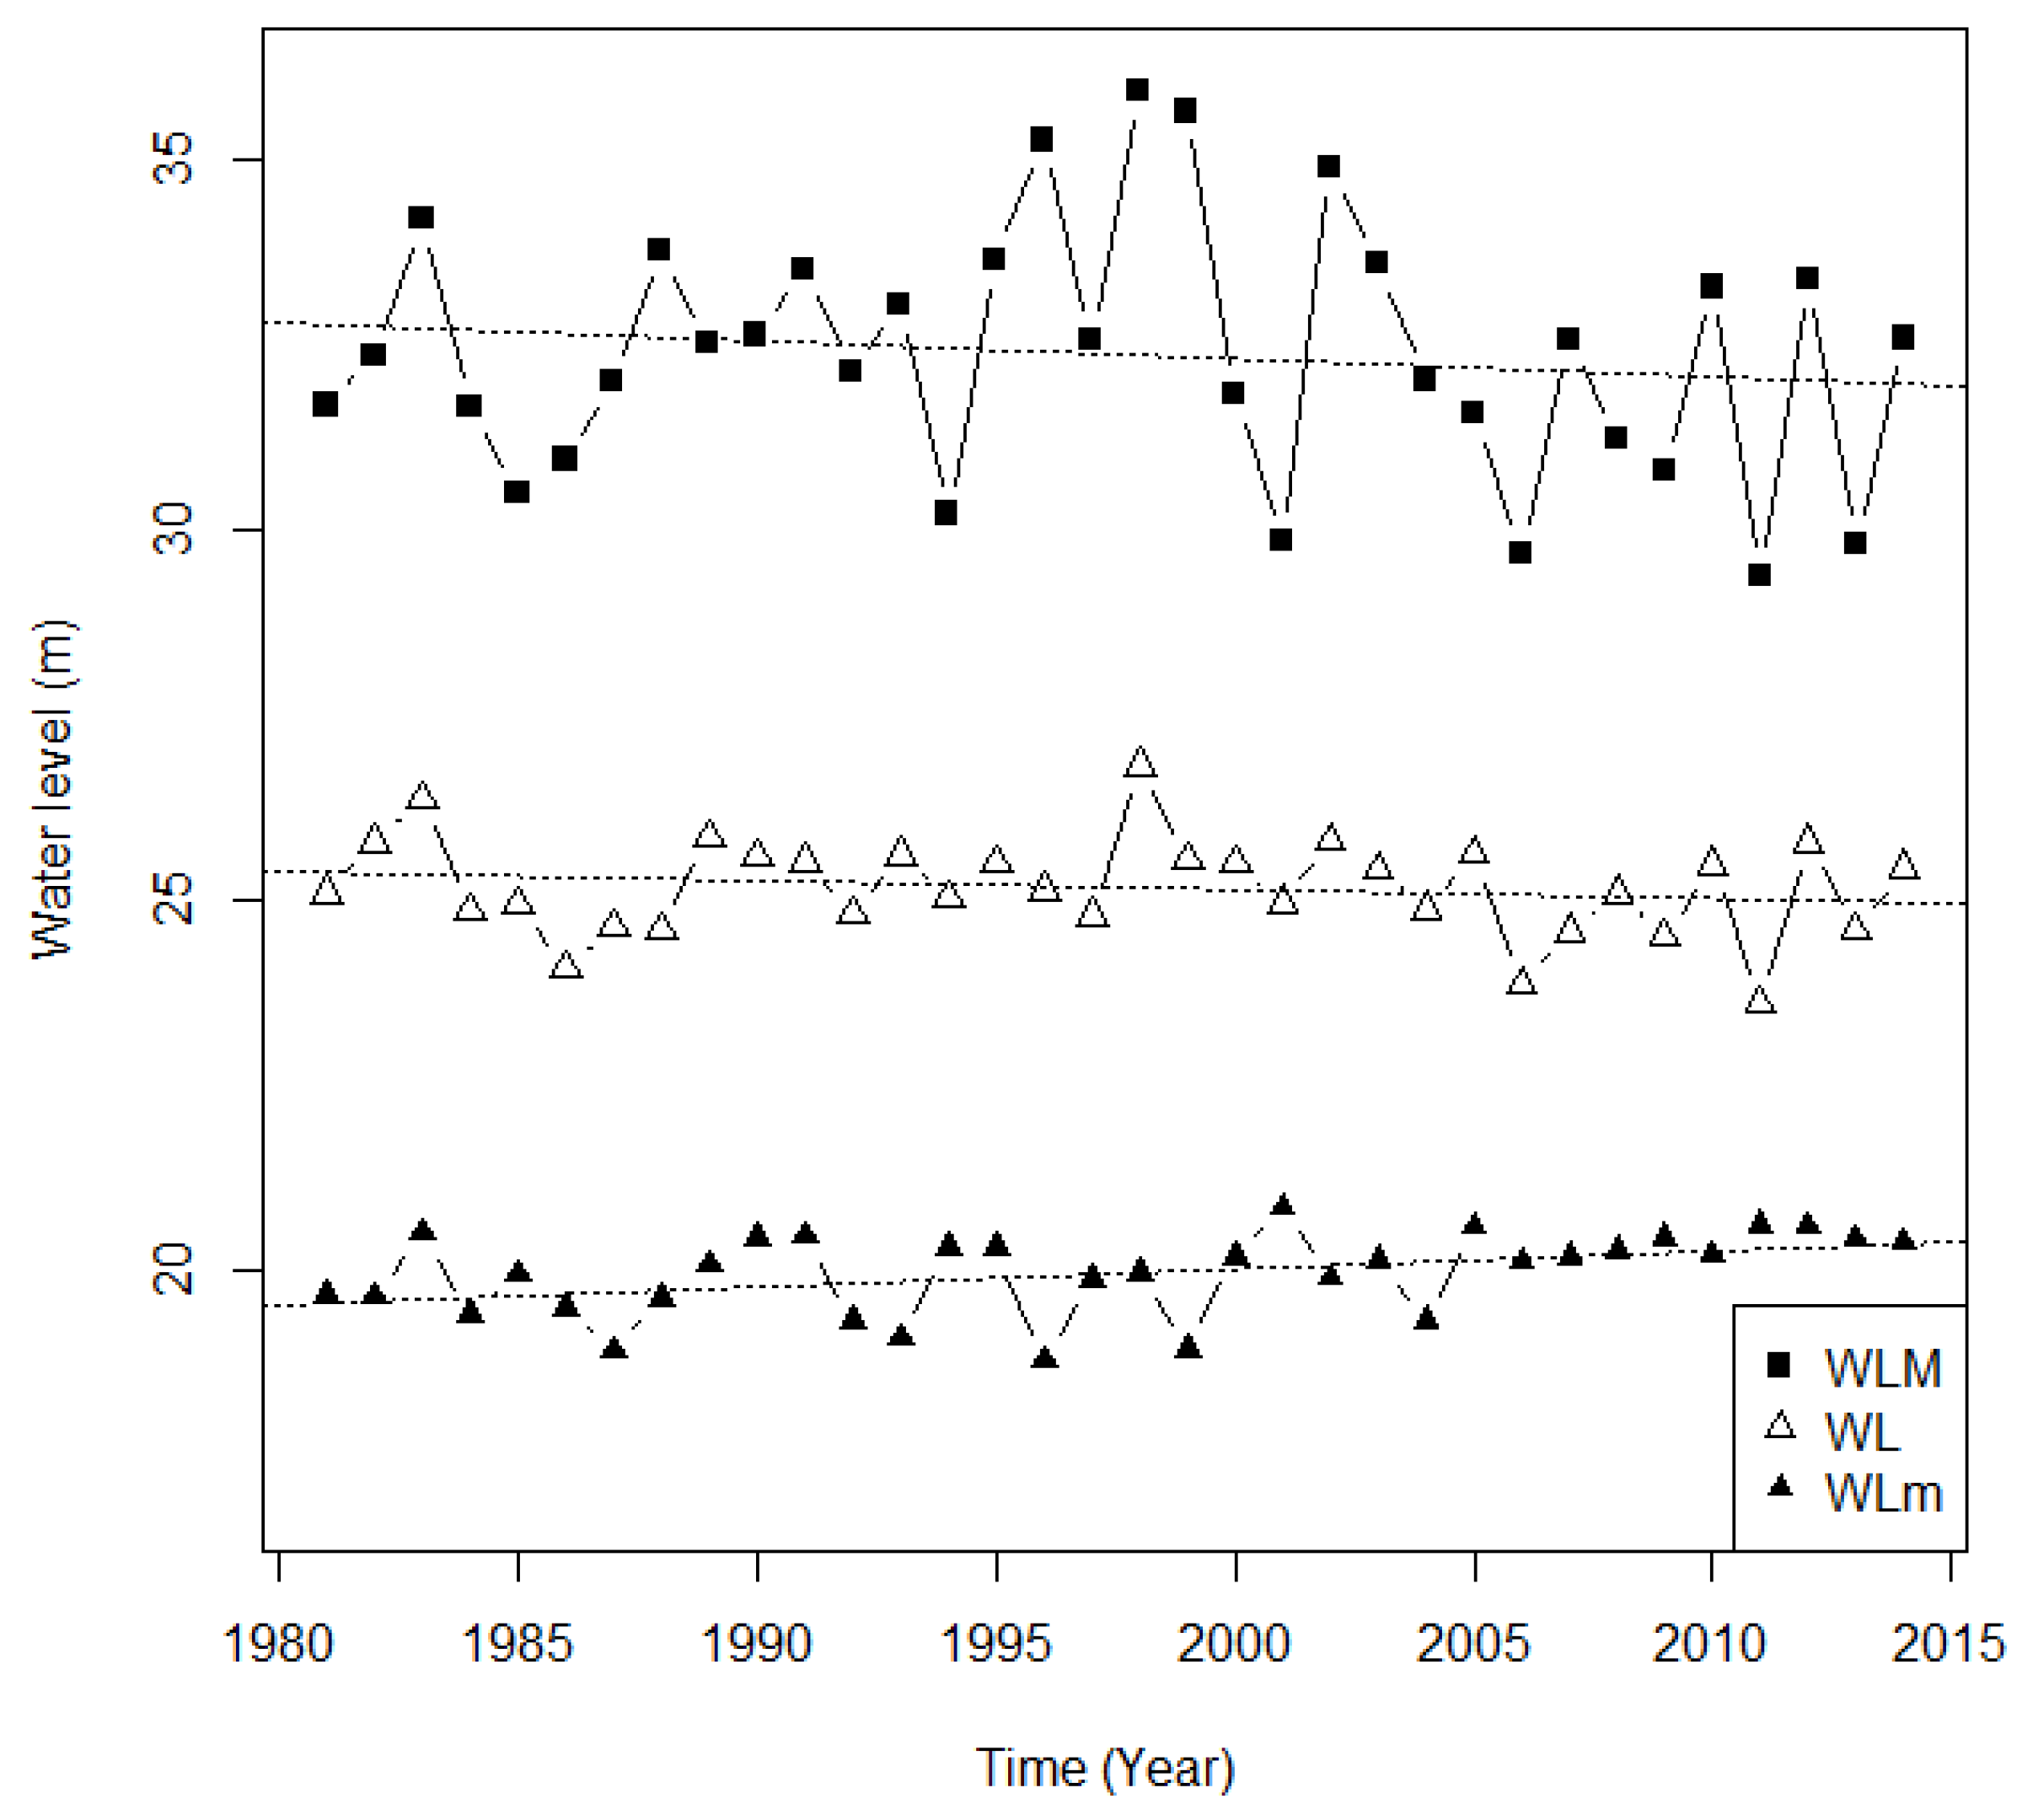
3.2. The Results of Lake Water Levels from 1981 to 2014
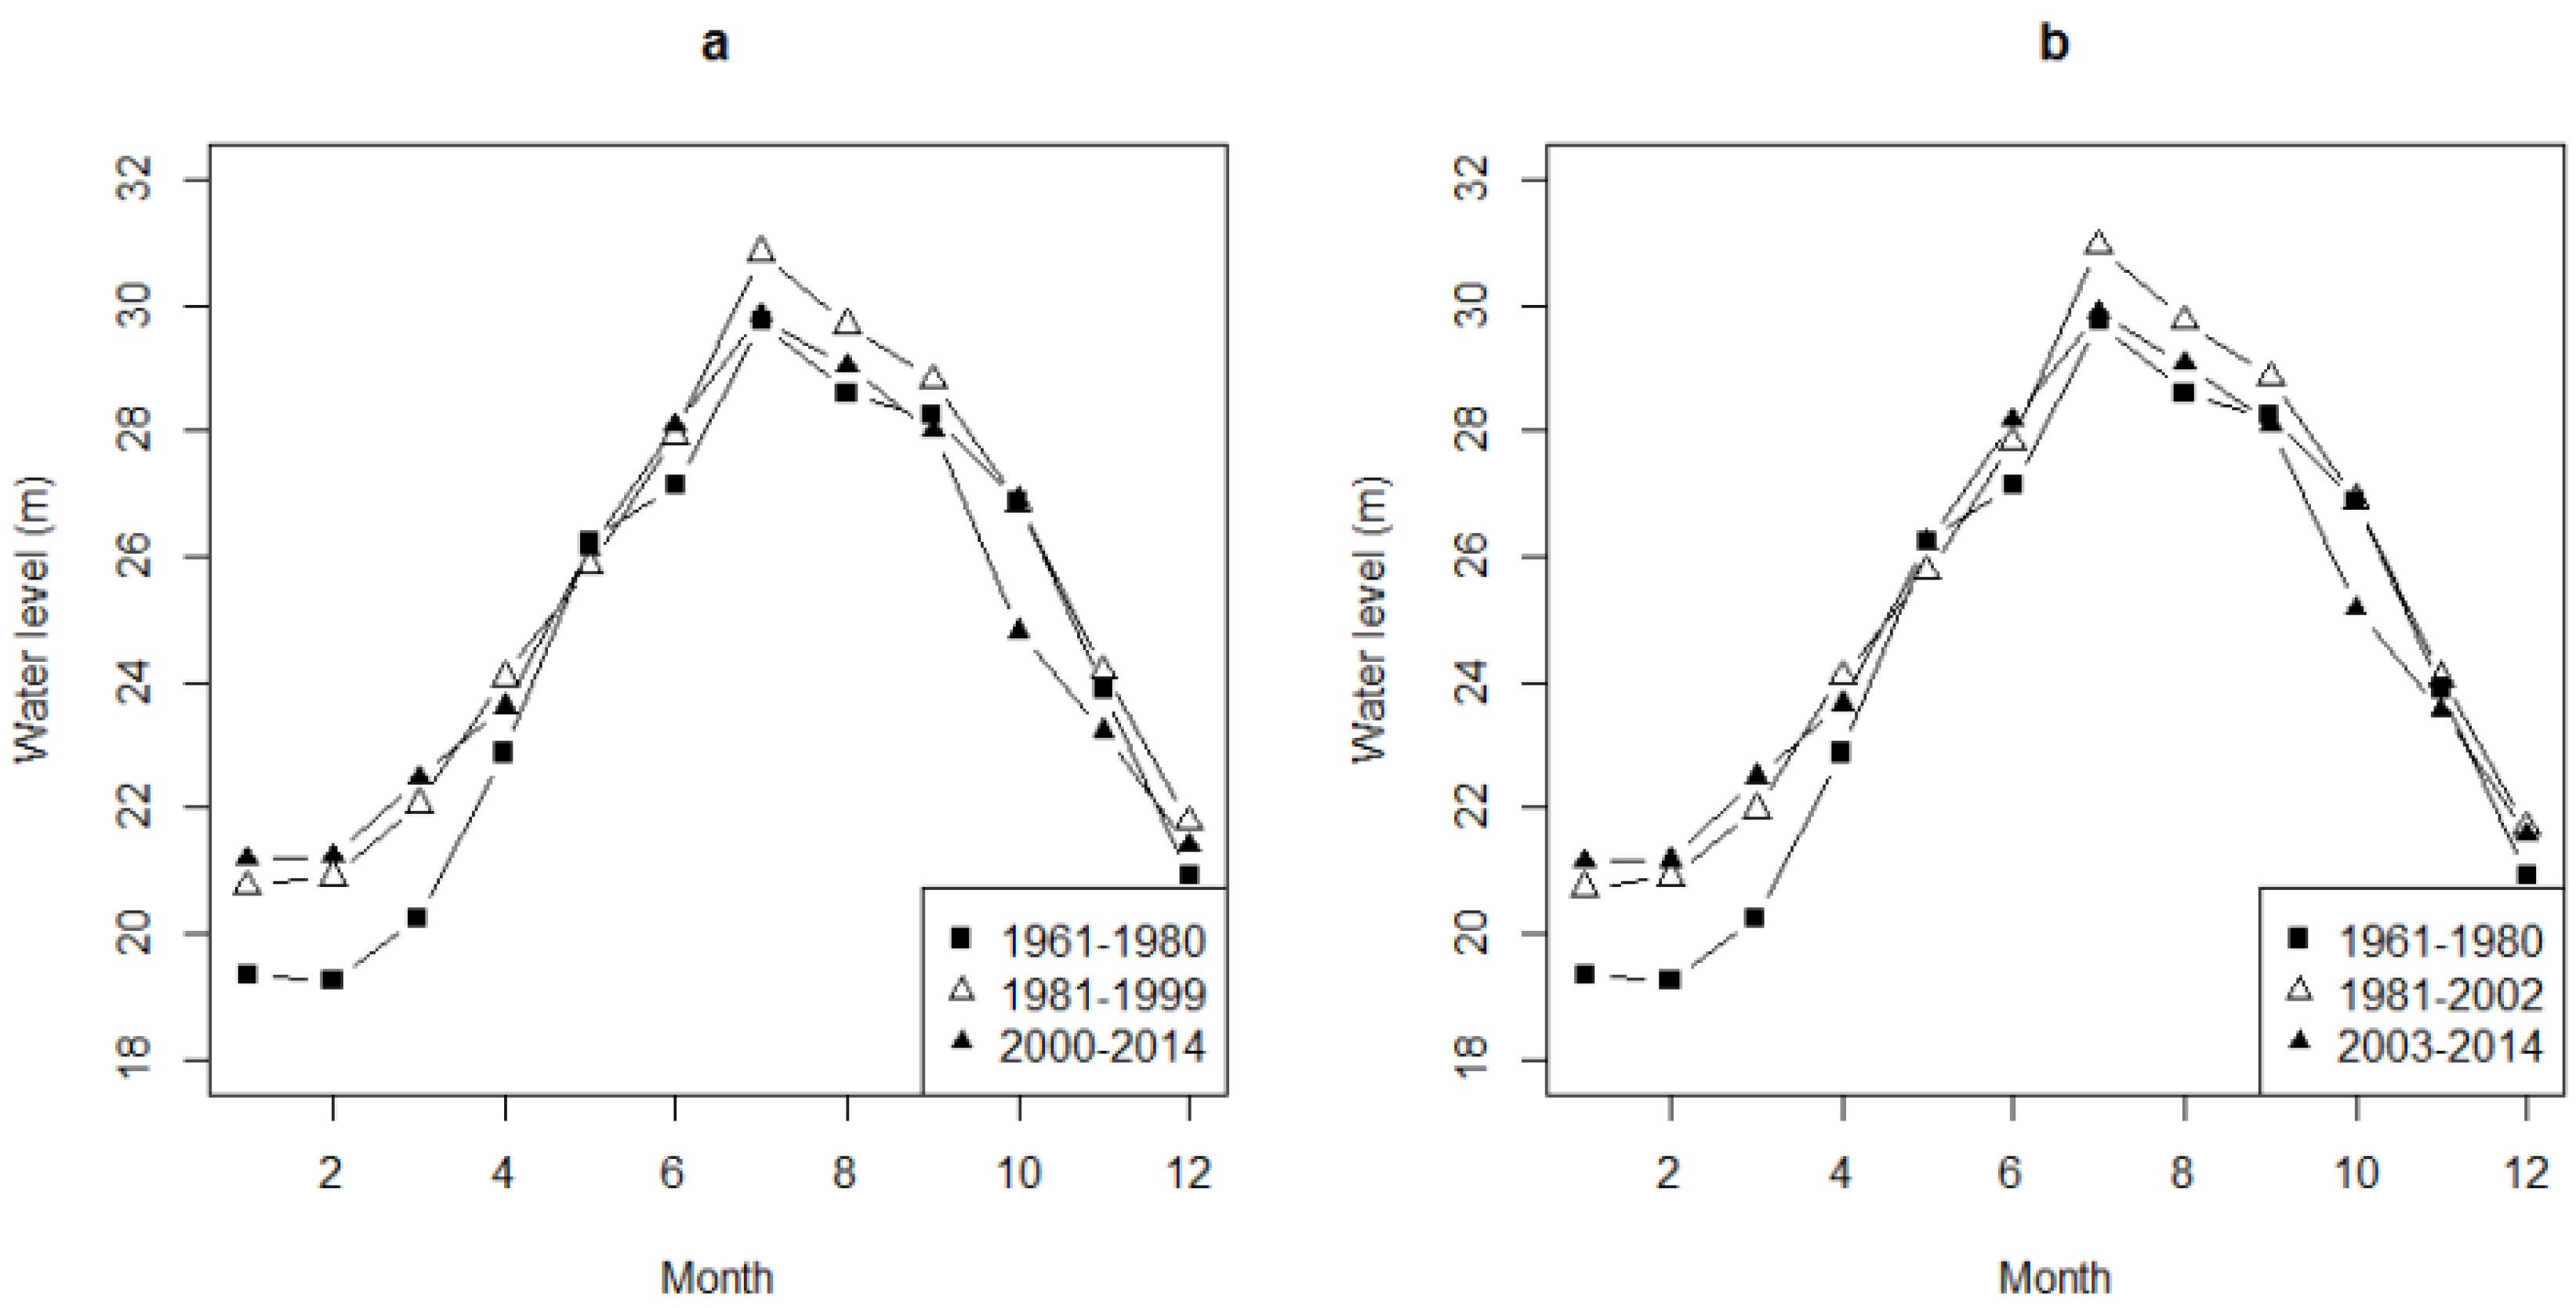
3.3. Comparisons of Water Levels between Three Time Periods
4. Impacted Factors Analysis for the Water Level Variations
4.1. Impacted Factors Identification and Analysis for the Inter-Annual Variations of Water Level
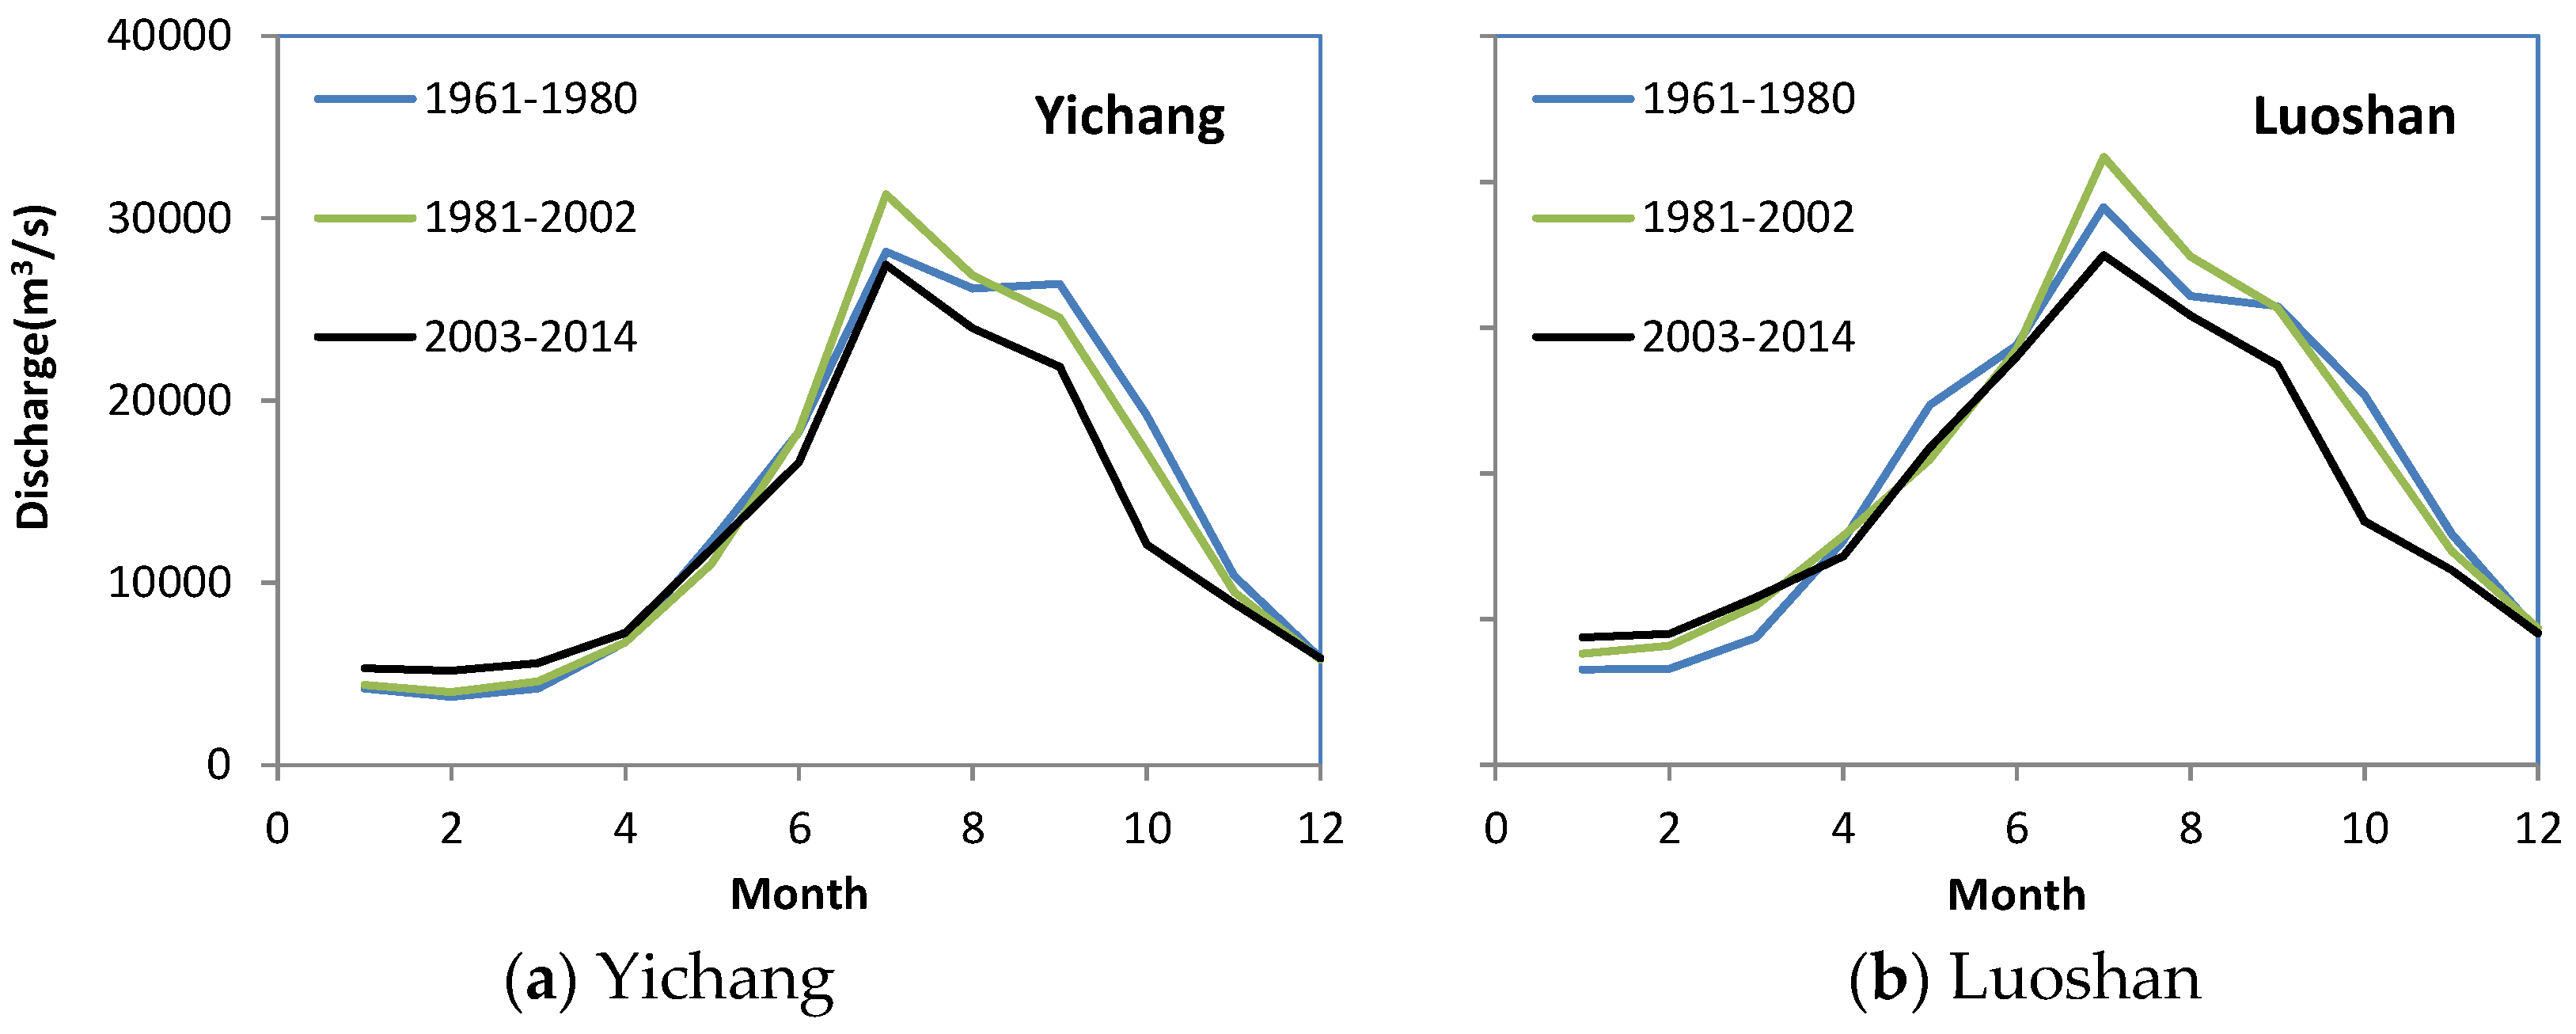
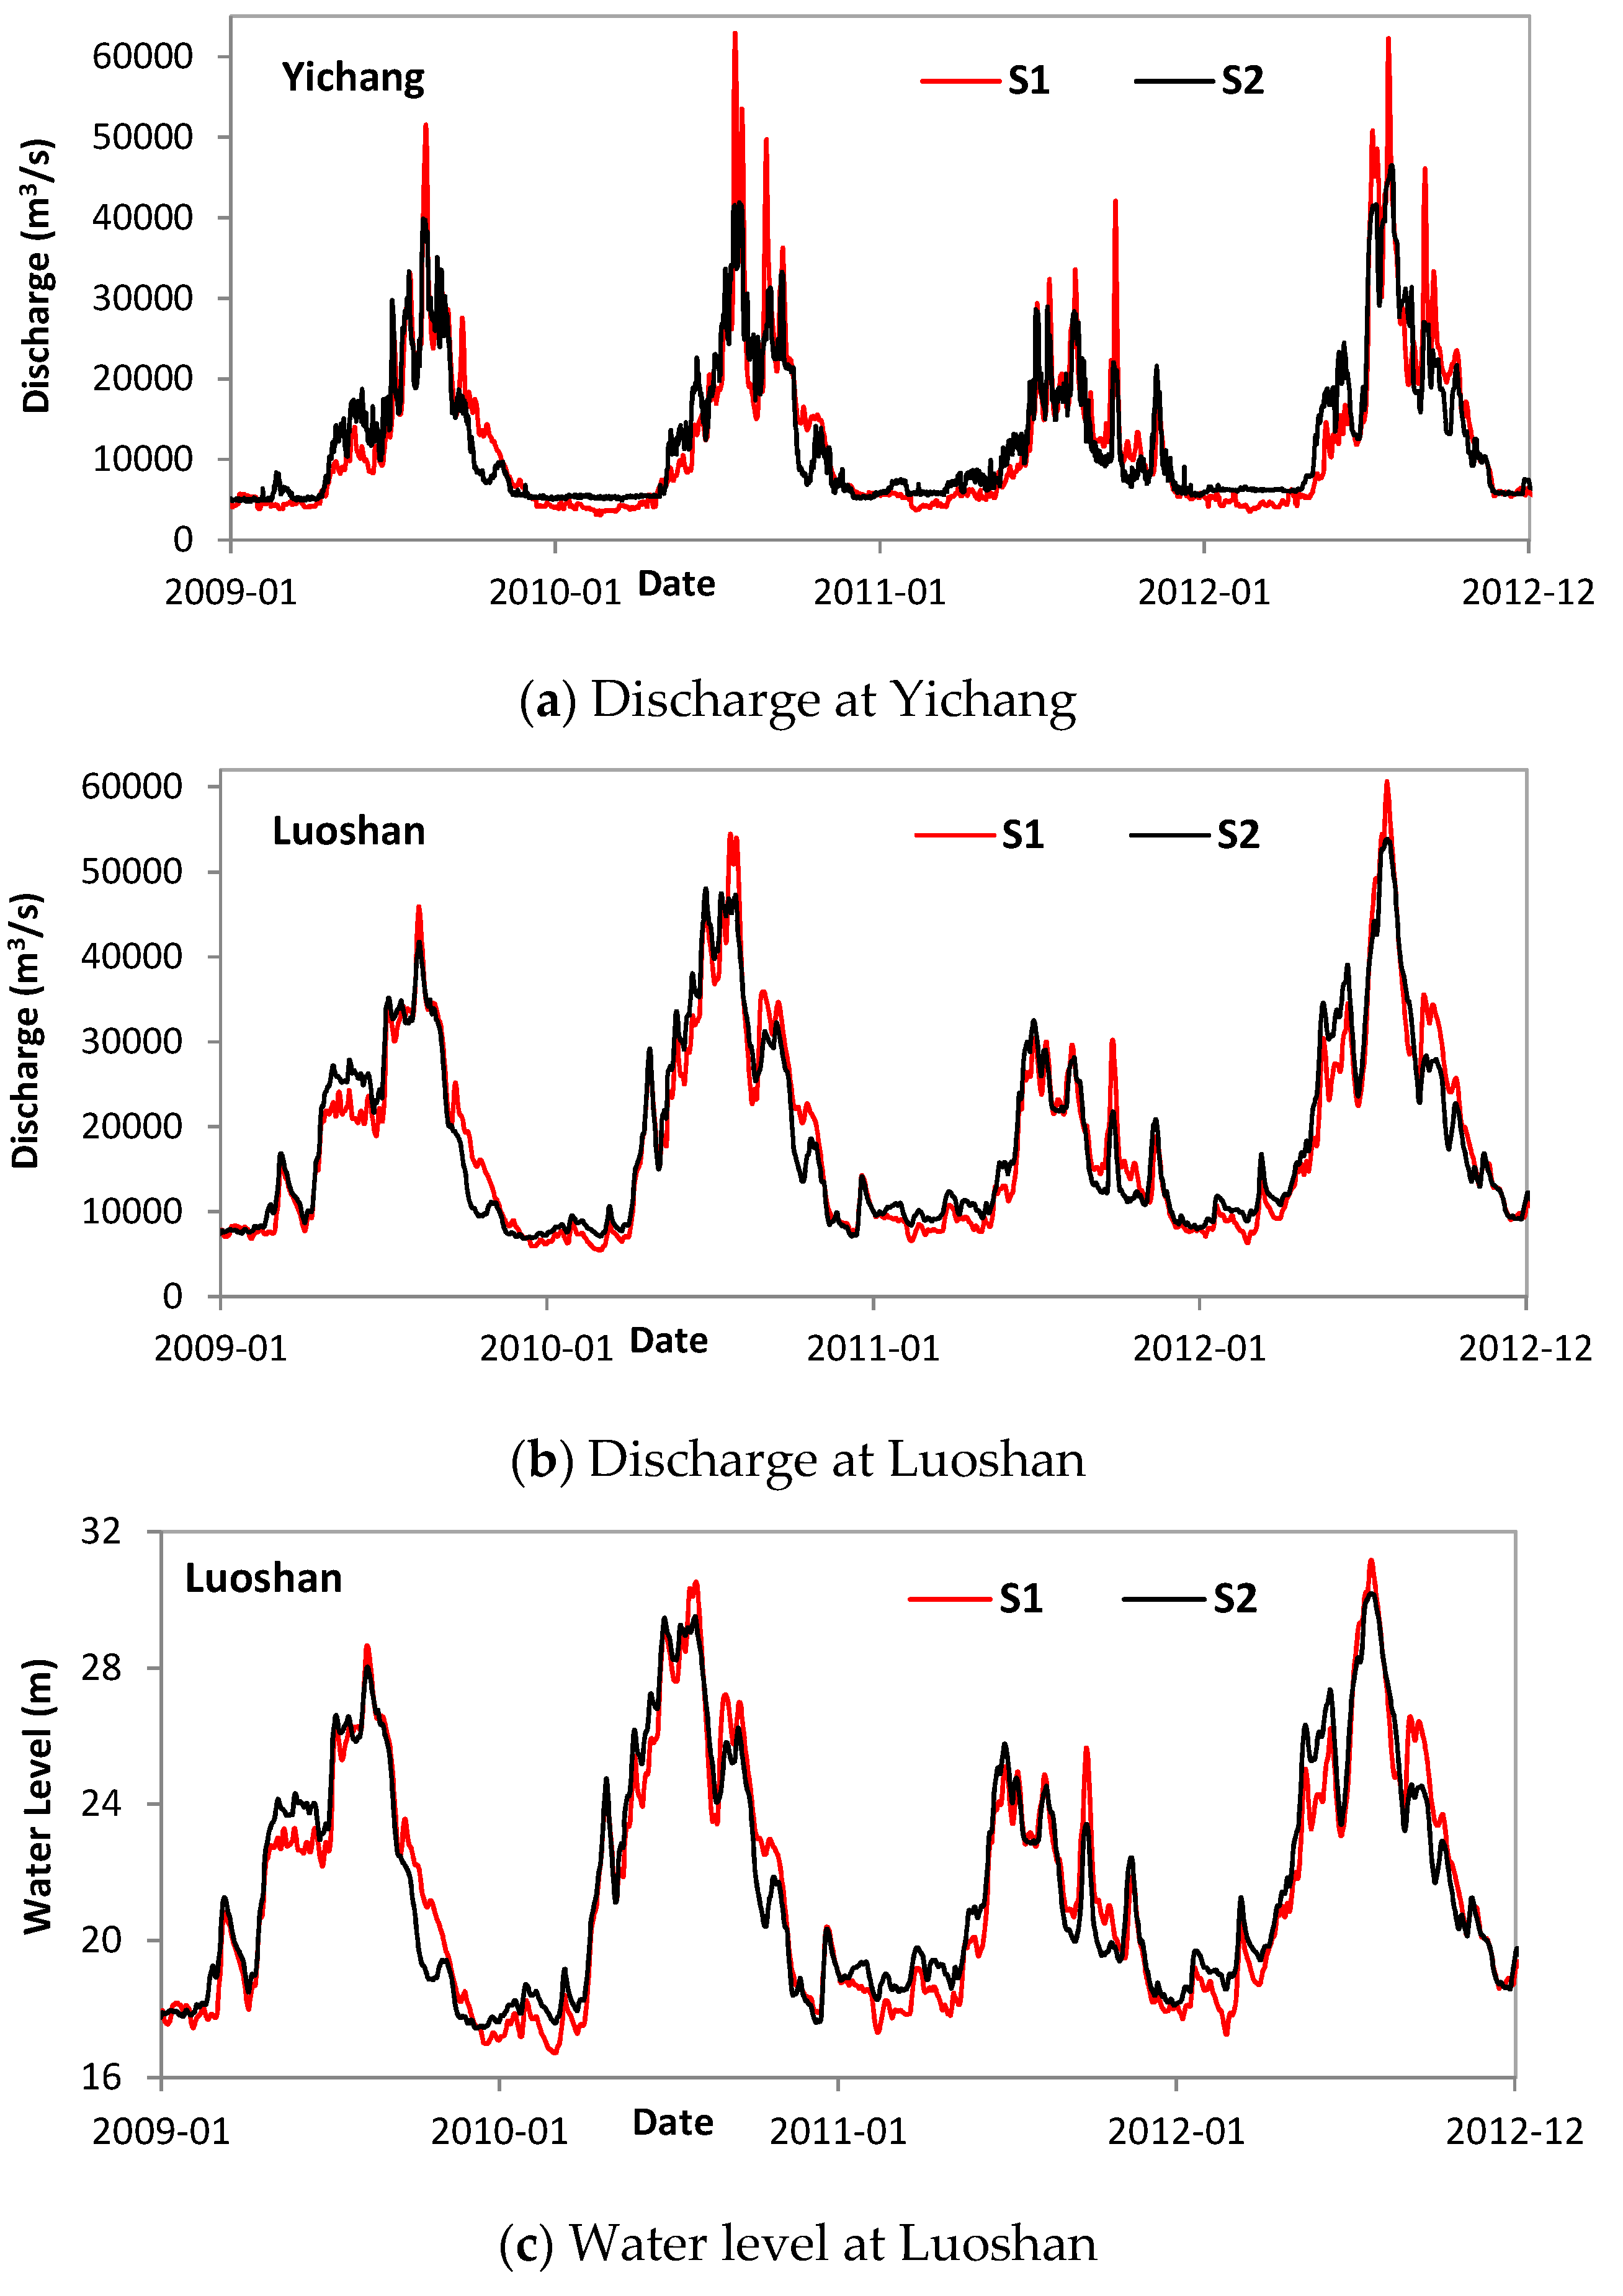
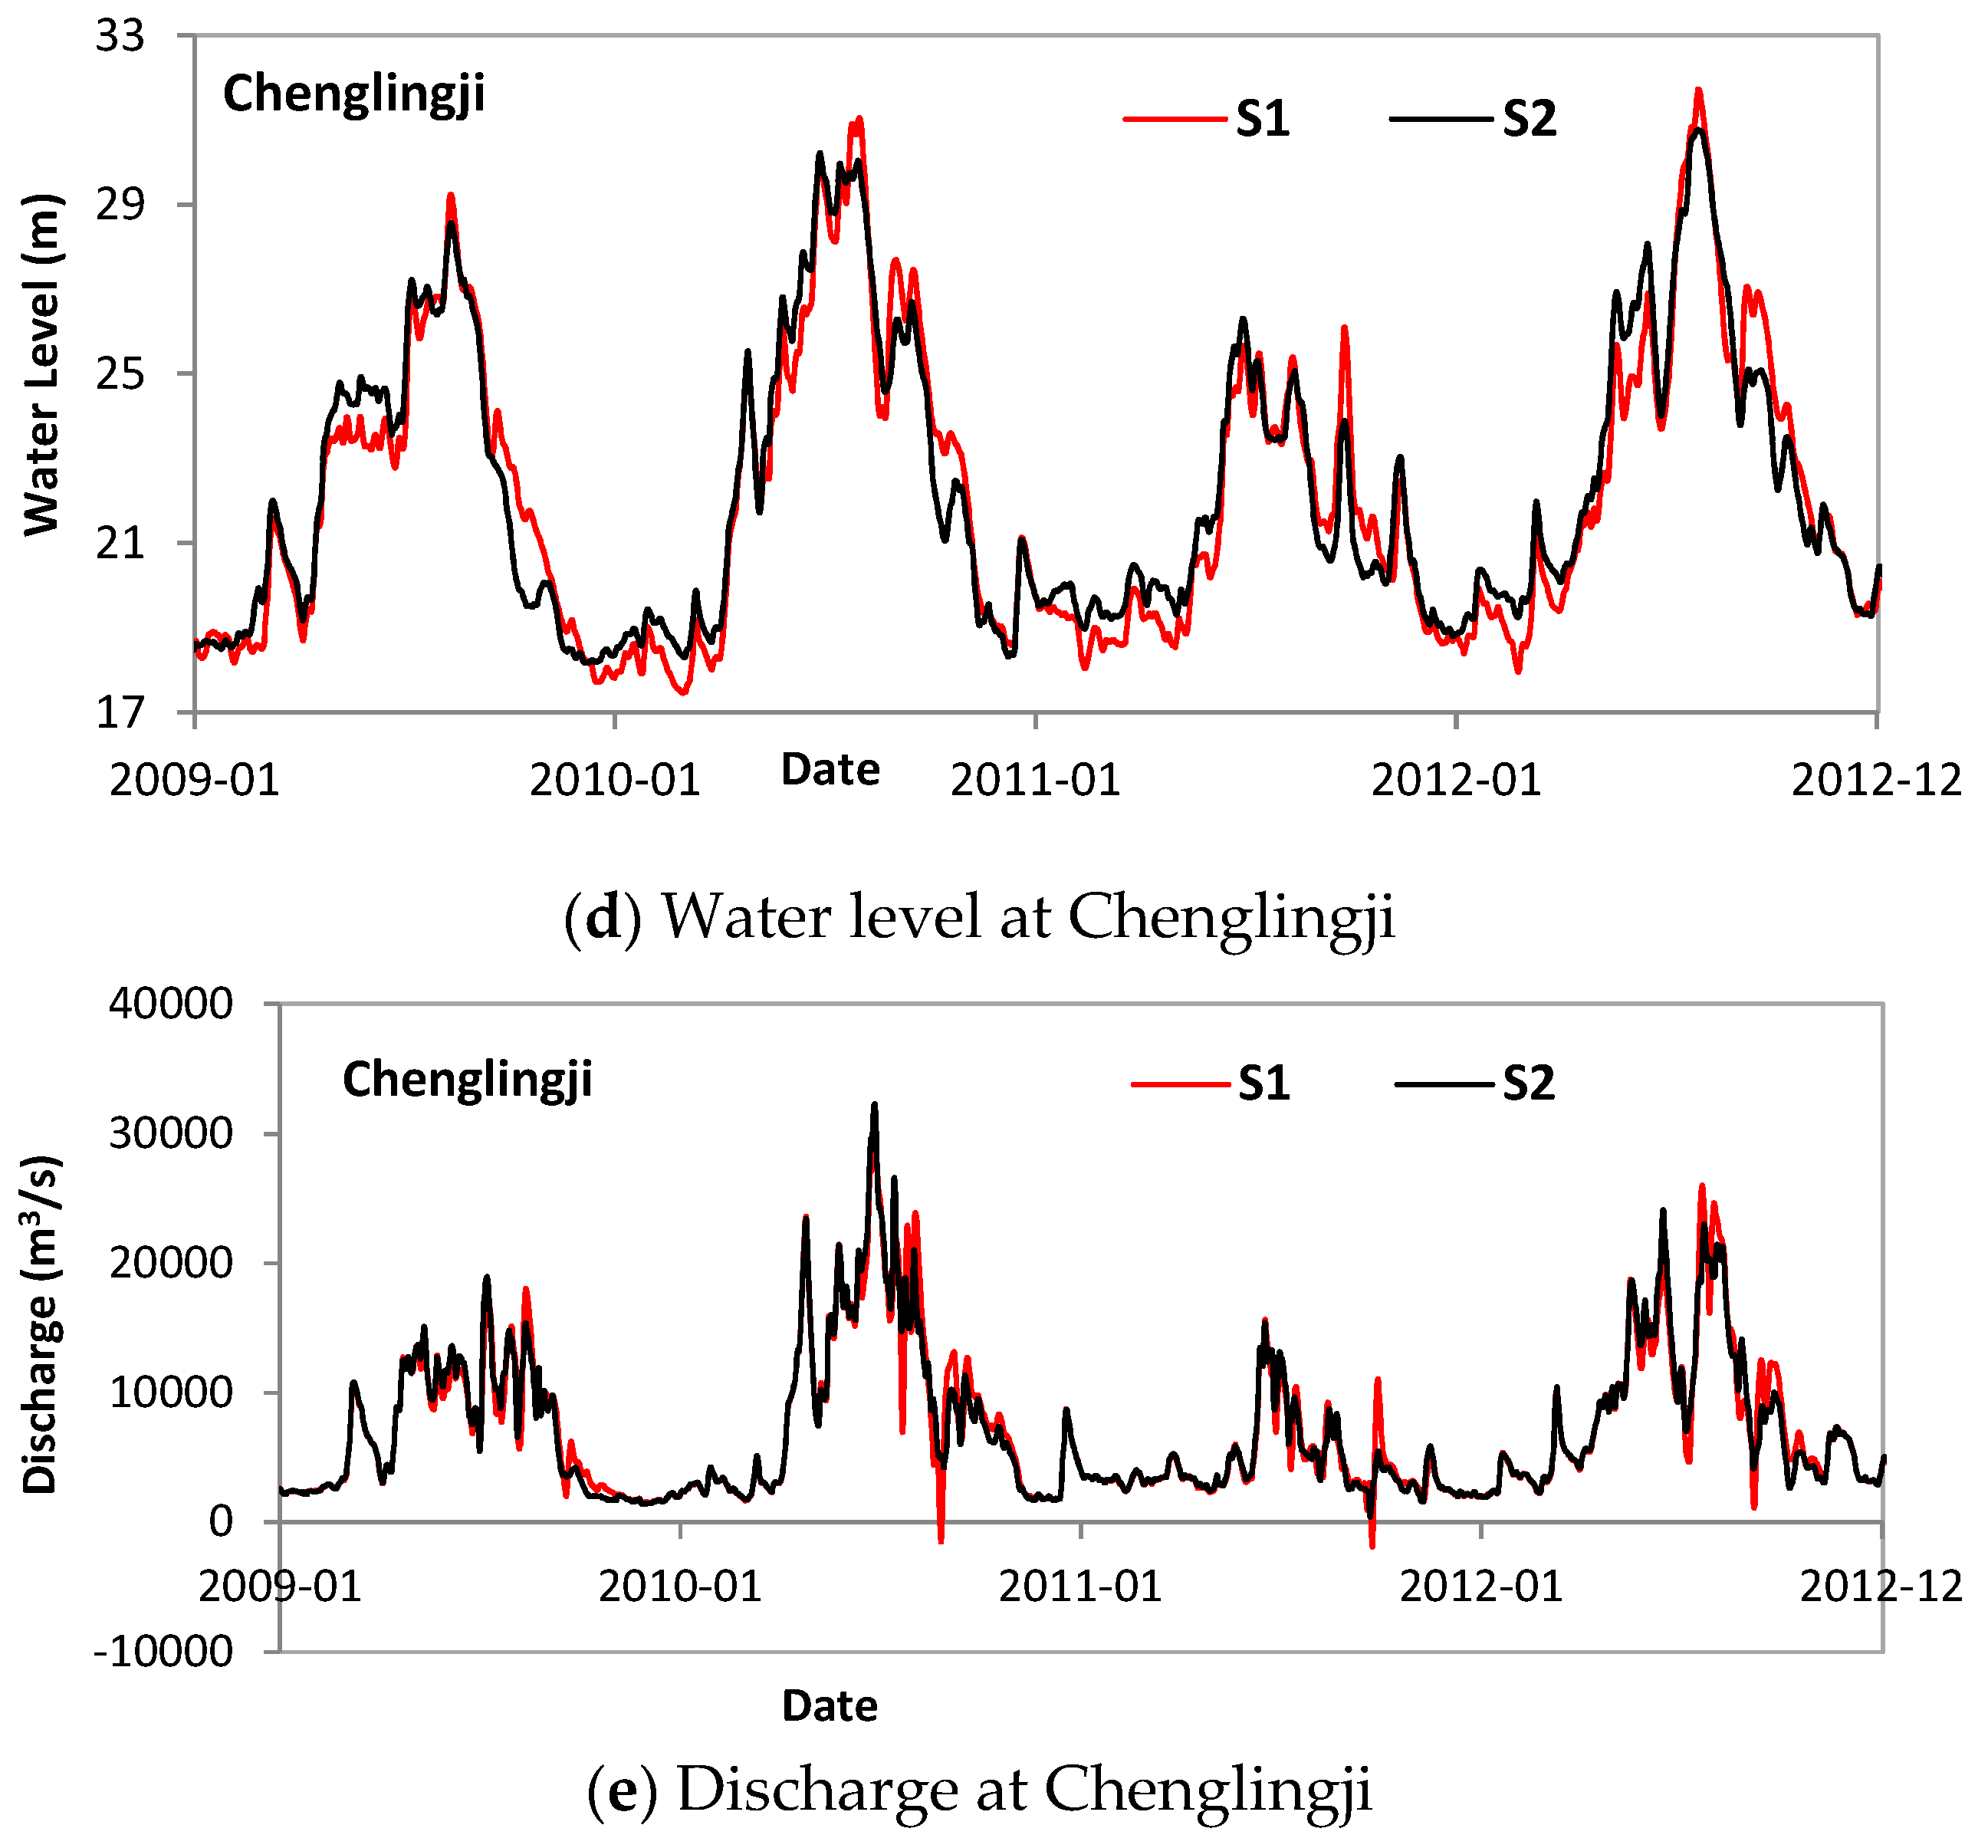
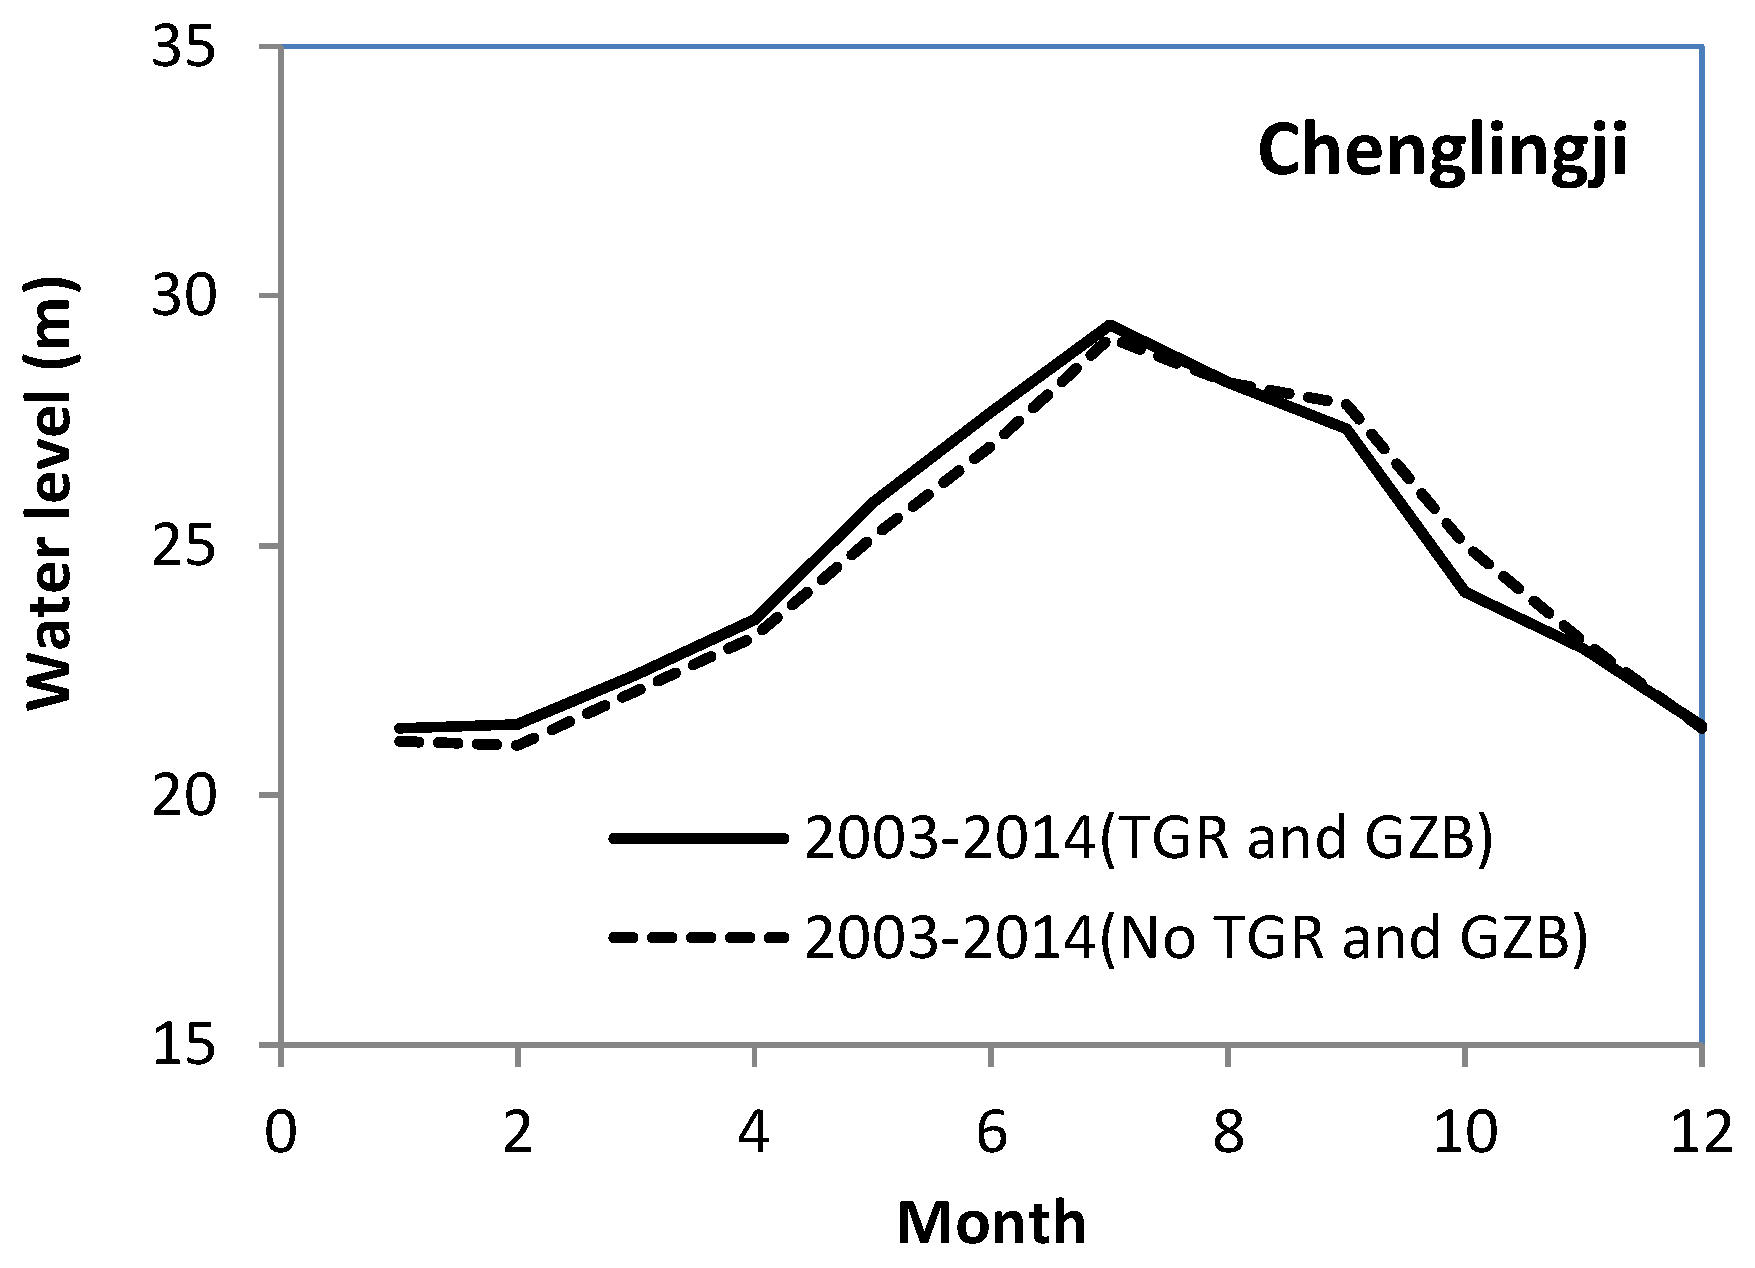
4.2. Quantitive Identification on the Hydrological Variation Linked to TGD and GZB
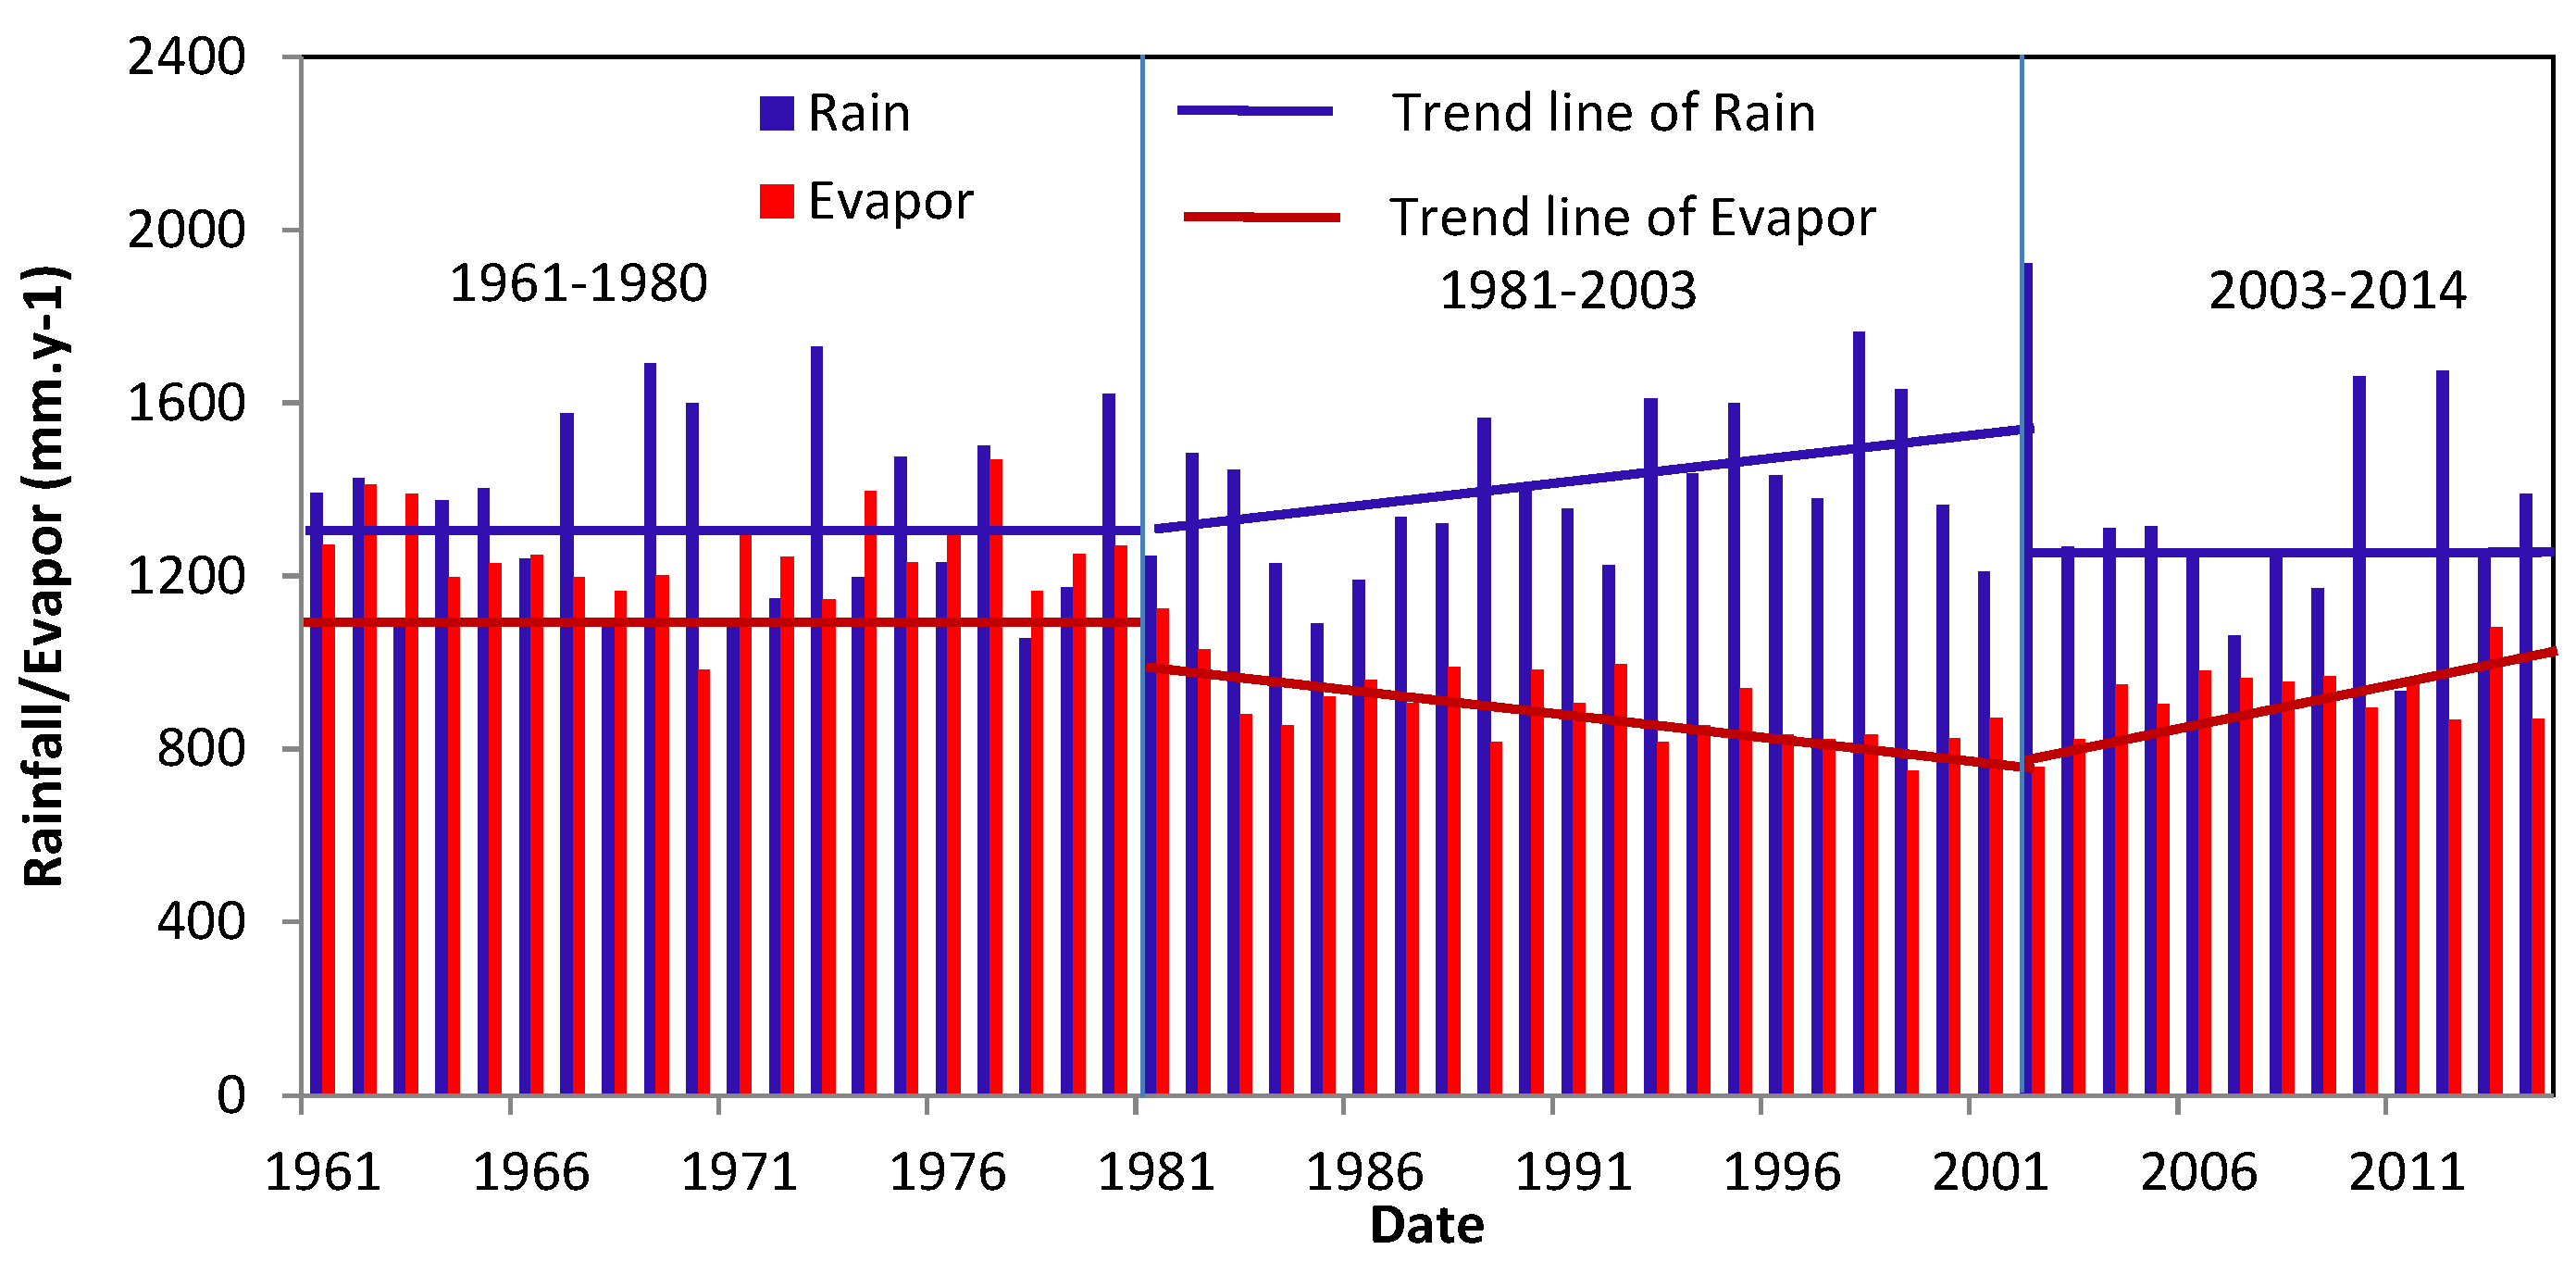
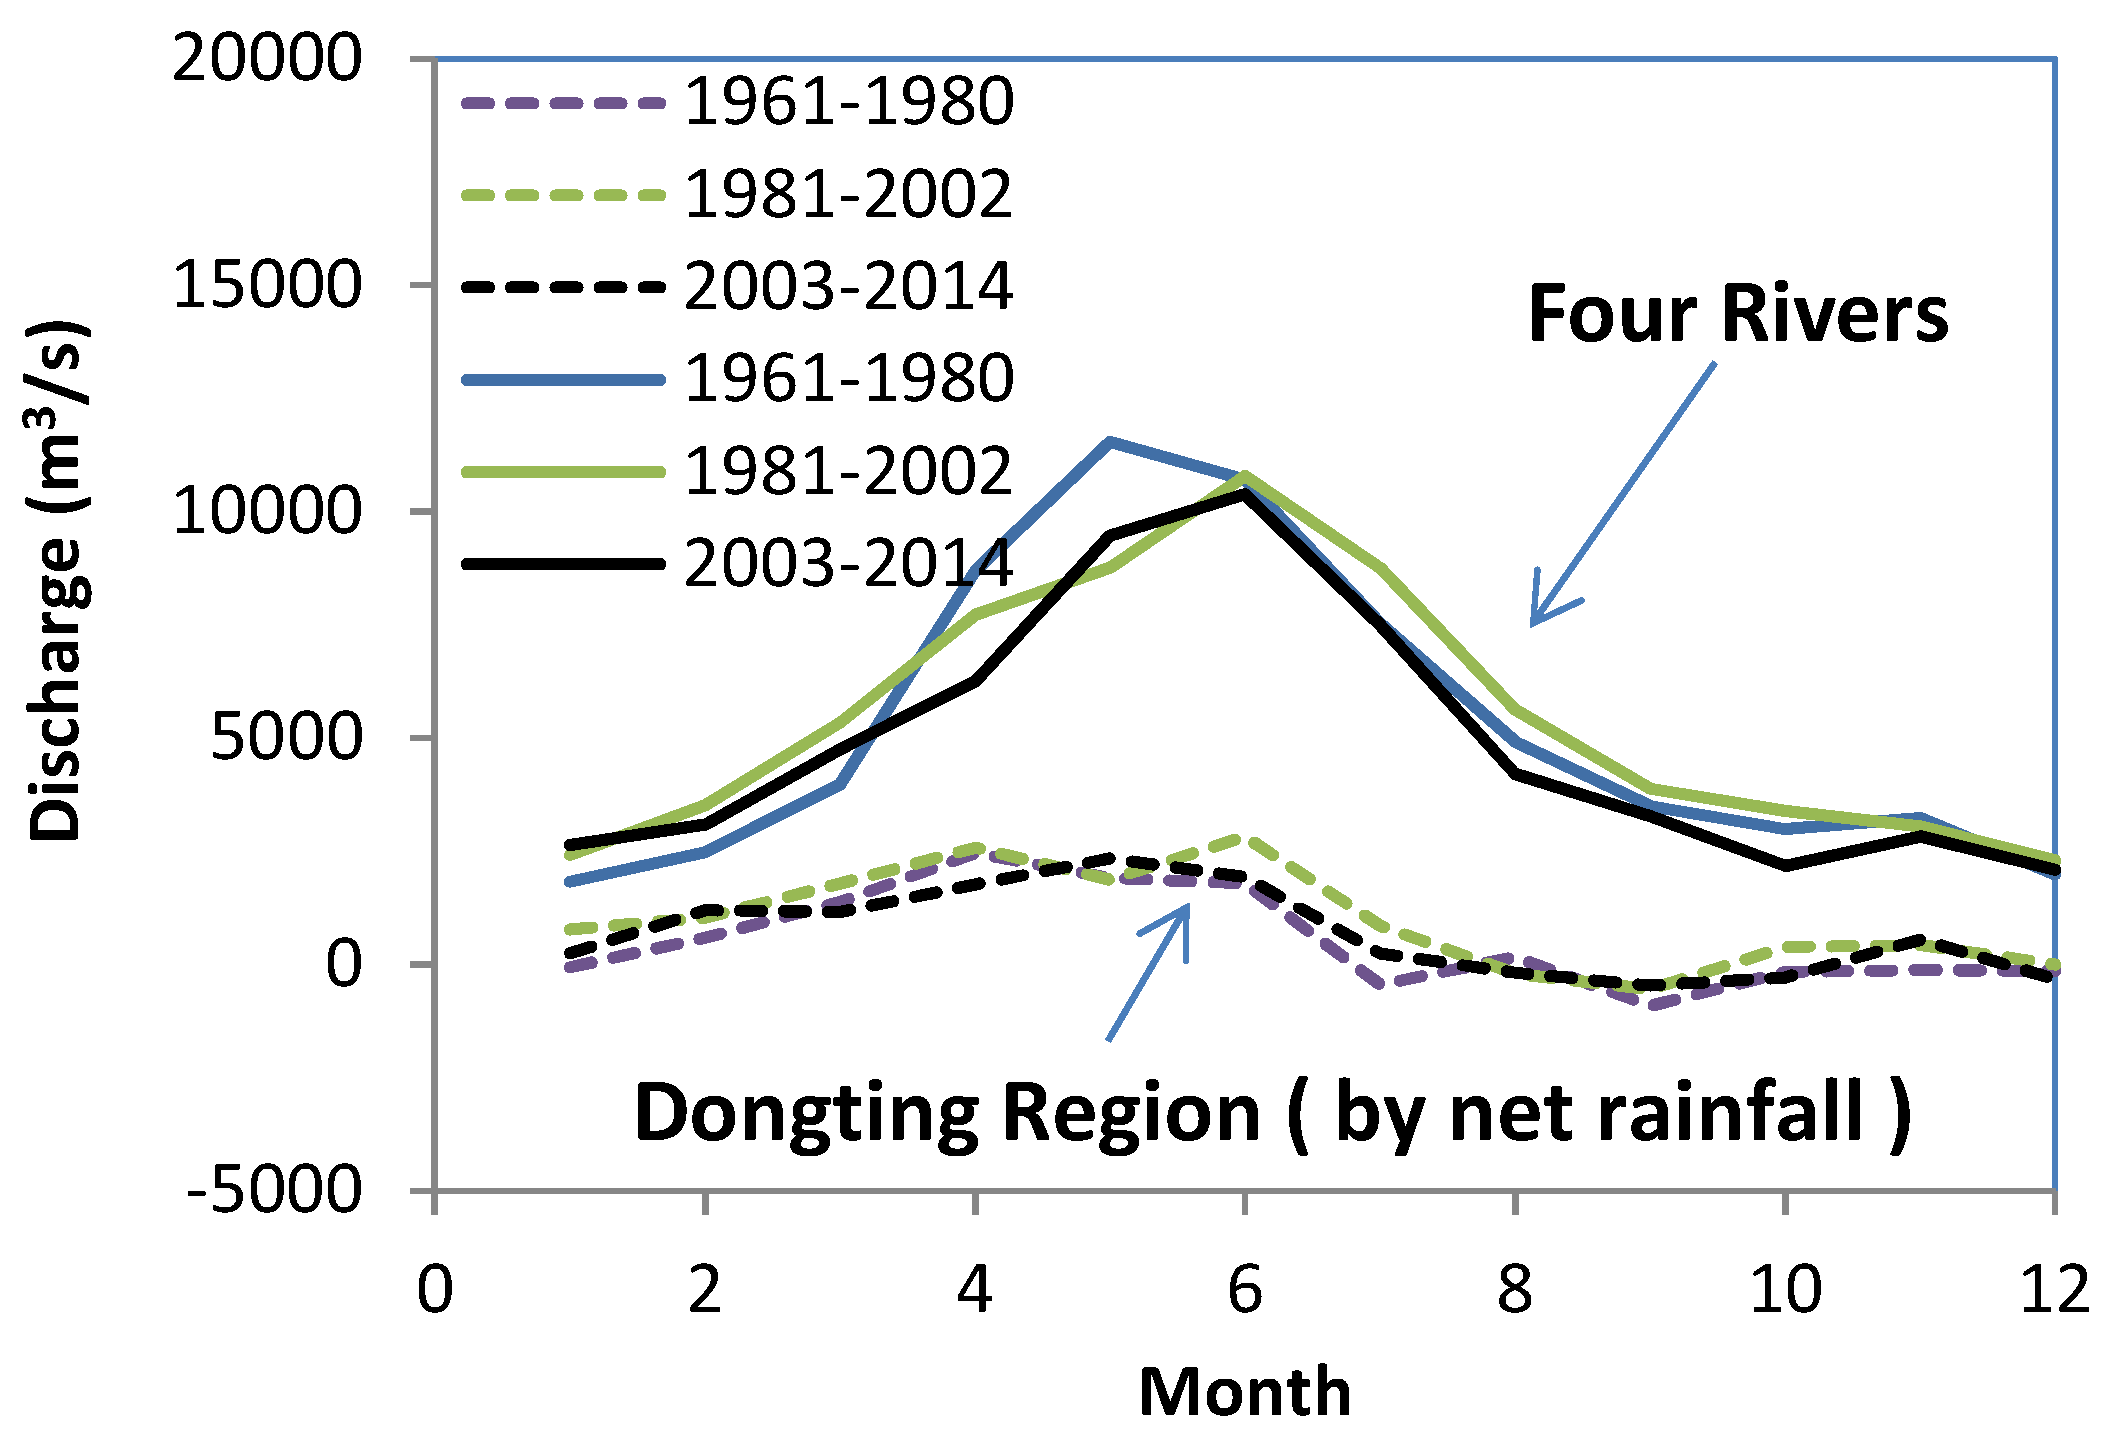
4.3. Relationships between the Hydrological Processes and Net Rainfall around the Dongting Lake Region
5. Discussion
5.1. The Analysis on Water Level Changing Trend
5.2. Identification on the Hydrological Variation Linked to TGR and GZB
5.3. Further Evaluation on the Hydrological Variation Linked to Anthropogenic and Climate Factors
6. Conclusions
Acknowledgments
Author Contributions
Conflicts of Interest
References
- Beeton, A.M. Large freshwater lakes: Present state, trends, and future. Environ. Conserv. 2002, 29, 21–38. [Google Scholar] [CrossRef]
- Brönmark, C.; Hansson, L.-A. Environmental issues in lakes and ponds: Current state and perspectives. Environ. Conserv. 2002, 29, 290–306. [Google Scholar] [CrossRef]
- Wantzen, K.M.; Rothhaupt, K.-O.; Mörtl, M.; Cantonati, M.; László, G.; Fischer, P. Ecological Effects of Water-Level Fluctuations in Lakes: An Urgent Issue. Hydrobiologia 2008, 613, 1–4. [Google Scholar] [CrossRef]
- Williamson, C.E.; Saros, J.E.; Vincent, W.F.; Smold, J.P. Lakes and reservoirs as sentinels, integrators, and regulators of climate change. Limnol. Oceanogr. 2009, 54, 2273–2282. [Google Scholar] [CrossRef]
- Coe, M.T.; Foley, J.A. Human and natural impacts on the water resources of the Lake Chad basin. J. Geophys. Res. Atmos. 2001, 106, 3349–3356. [Google Scholar] [CrossRef]
- Schindler, D.W. The cumulative effects of climate warming and other human stresses on Canadian freshwaters in the new millennium. Can. J. Fish. Aquat. Sci. 2001, 58, 18–29. [Google Scholar] [CrossRef]
- Hampton, S.E.; Izmest, E.; Lyubov, R.; Moore, M.V.; Katz, S.L.; Dennis, B.; Silow, E.A. Sixty years of environmental change in the world’s largest freshwater lake—Lake Baikal, Siberia. Glob. Chang. Biol. 2008, 14, 1947–1958. [Google Scholar] [CrossRef]
- Ariztegui, D.; Anselmetti, F.S.; Robbiani, J.-M.; Bernasconi, S.; Brati, E.; Gilli, A.; Lehmann, M. Natural and human-induced environmental change in southern Albania for the last 300 years—Constraints from the Lake Butrint sedimentary record. Glob. Planet. Chang. 2010, 71, 183–192. [Google Scholar] [CrossRef]
- Coops, H.; Beklioglu, M.; Crisman, T.L. The role of water-level fluctuations in shallow lake ecosystems—Workshop conclusions. Hydrobiologia 2003, 506, 23–27. [Google Scholar] [CrossRef]
- Aroviita, J.; Hämäläinen, H. The impact of water-level regulation on littoral macroinvertebrate assemblages in boreal lakes. Hydrobiologia 2008, 613, 45–56. [Google Scholar] [CrossRef]
- Baumgärtner, D.; Mörtl, M.; Rothhaupt, K.-O. Effects of water-depth and water-level fluctuations on the macroinvertebrate community structure in the littoral zone of Lake Constance. Hydrobiologia 2008, 613, 97–107. [Google Scholar] [CrossRef]
- Van der Valk, A.G. Water-level fluctuations in North American prairie wetlands. Hydrobiologia 2005, 539, 171–188. [Google Scholar] [CrossRef]
- Zhang, F.; Tiyip, T.; Johnson, V.C.; Ding, J.-L.; Sun, Q.; Zhou, M.; Kelimu, A.; Nurmuhammat, I.; Chan, N.W. The influence of natural and human factors in the shrinking of the Ebinur Lake, Xinjiang, China, during the 1972–2013 period. Environ. Monit. Assess. 2015, 187, 4128–4141. [Google Scholar] [CrossRef] [PubMed]
- Huang, Q.; Jiang, J. Analysis of the Lake Basin Change and the Rushing silting Features in the Past Decades of Dongting Lake. J. Lake Sci. 2004, 3. [Google Scholar] [CrossRef]
- Du, Y.; Xue, H.-P.; Wu, S.-J.; Ling, F.; Xiao, F.; Wei, X.-H. Lake area changes in the middle Yangtze region of China over the 20th century. J. Environ. Manag. 2011, 92, 1248–1255. [Google Scholar] [CrossRef] [PubMed]
- Liu, X.; Xu, C. Role and Protection of Dongting Lake. Agric. Sci. Technol. 2014, 15, 2220–2225. [Google Scholar] [CrossRef]
- Lai, X.; Jiang, J.; Huang, Q. Effects of the normal operation of the Three Gorges Reservoir on wetland inundation in Dongting Lake, China: A modelling study. Hydrol. Sci. J. 2013, 58, 1467–1477. [Google Scholar] [CrossRef]
- Cui, M.; Zhou, J.; Huang, B. Benefit evaluation of wetlands resource with different modes of protection and utilization in the Dongting Lake region. Procedia Environ. Sci. 2012, 13, 2–17. [Google Scholar] [CrossRef]
- Zhao, S.; Fang, J.; Miao, S.; Gu, B.; Tao, S.; Peng, C.; Tang, Z. The 7-decade degradation of a large freshwater lake in Central Yangtze River, China. Environ. Sci. Technol. 2005, 39, 431–436. [Google Scholar] [CrossRef] [PubMed]
- Leira, M.; Cantonati, M. Effects of water-level fluctuations on lakes: An annotated bibliography. Hydrobiologia 2008, 613, 171–184. [Google Scholar] [CrossRef]
- Keddy, P.; Reznicek, A. Great Lakes vegetation dynamics: The role of fluctuating water levels and buried seeds. J. Gt. Lakes Res. 1986, 12, 25–36. [Google Scholar] [CrossRef]
- Keough, J.R.; Thompson, T.A.; Guntenspergen, G.R.; Wilcox, D.A. Hydrogeomorphic factors and ecosystem responses in coastal wetlands of the Great Lakes. Wetlands 1999, 19, 821–834. [Google Scholar] [CrossRef]
- Casanova, M.T.; Brock, M.A. How do depth, duration and frequency of flooding influence the establishment of wetland plant communities? Plant Ecol. 2000, 147, 237–250. [Google Scholar] [CrossRef]
- Wilcox, D.A. Implications of hydrologic variability on the succession of plants in Great Lakes wetlands. Aquat. Ecosyst. Health Manag. 2004, 7, 223–231. [Google Scholar] [CrossRef]
- Gafny, S.; Gasith, A.; Goren, M. Effect of water level fluctuation on shore spawning of Mirogrex terraesanctae (Steinitz), (Cyprinidae) in Lake Kinneret, Israel. J. Fish Biol. 1992, 41, 863–871. [Google Scholar] [CrossRef]
- Gafny, S.; Gasith, A. Spatially and temporally sporadic appearance of macrophytes in the littoral zone of Lake Kinneret, Israel: Taking advantage of a window of opportunity. Aquat. Bot. 1999, 62, 249–267. [Google Scholar] [CrossRef]
- Wantzen, K.M.; de Arruda Machado, F.; Voss, M.; Boriss, H.; Junk, W.J. Seasonal isotopic shifts in fish of the Pantanal wetland, Brazil. Aquat. Sci. 2002, 64, 239–251. [Google Scholar] [CrossRef]
- Bond, N.R.; Lake, P.; Arthington, A.H. The impacts of drought on freshwater ecosystems: An Australian perspective. Hydrobiologia 2008, 600, 3–16. [Google Scholar] [CrossRef]
- Yin, Y.; Chen, Y.; Yu, S.; Xu, W.; Wang, W.; Xu, Y. Maximum water level of Hongze Lake and its relationship with natural changes and human activities from 1736 to 2005. Quat. Int. 2013, 304, 85–94. [Google Scholar] [CrossRef]
- Pasquini, A.I.; Lecomte, K.L.; Depetris, P.J. Climate change and recent water level variability in Patagonian proglacial lakes, Argentina. Glob. Planet. Chang. 2008, 63, 290–298. [Google Scholar] [CrossRef]
- Motiee, H.; McBean, E. An assessment of long-term trends in hydrologic components and implications for water levels in Lake Superior. Hydrol. Res. 2009, 40, 564–579. [Google Scholar] [CrossRef]
- Haghighi, A.T.; Kløve, B. A sensitivity analysis of lake water level response to changes in climate and river regimes. Limnol. Ecol. Manag. Inland Waters 2015, 51, 118–130. [Google Scholar] [CrossRef]
- Li, X.; Zhang, Q.; Xu, C.-Y.; Ye, X. The changing patterns of floods in Poyang Lake, China: Characteristics and explanations. Nat. Hazards 2015, 76, 651–666. [Google Scholar] [CrossRef]
- Yuan, Y.; Zeng, G.; Liang, J.; Huang, L.; Hua, S.; Li, F.; Zhu, Y.; Wu, H.; Liu, J.; He, X.; et al. Variation of water level in Dongting Lake over a 50-year period: Implications for the impacts of anthropogenic and climatic factors. J. Hydrol. 2015, 525, 450–456. [Google Scholar] [CrossRef]
- Wang, X.; Yan, D.; Xiao, W.; Zhu, W.; Yuan, Y. Evolution of the Hydrological and Hydrodynamic Characteristics in the Outlet Reach of Xiangjiang River. J. Environ. Ecol. 2012, 3, 137–148. [Google Scholar] [CrossRef]
- Hayashi, S.; Murakami, S.; Xu, K.-Q.; Watanabe, M. Effect of the Three Gorges Dam Project on flood control in the Dongting Lake area, China, in a 1998-type flood. J. Hydro-Environ. Res. 2008, 2, 148–163. [Google Scholar] [CrossRef]
- Mann, H.B. Nonparametric tests against trend. Econom. J. Econom. Soc. 1945, 13, 245–259. [Google Scholar] [CrossRef]
- Kendall, M.G. Rank Correlation Methods; Griffin: London, UK, 1975; p. 202. [Google Scholar]
- Pettitt, A. A non-parametric approach to the change-point problem. Appl. Stat. 1979, 28, 126–135. [Google Scholar] [CrossRef]
- Sen, P.K. Estimates of the regression coefficient based on Kendall’s tau. J. Am. Stat. Assoc. 1968, 63, 1379–1389. [Google Scholar] [CrossRef]
- Hirsch, R.M.; Slack, J.R.; Smith, R.A. Techniques of trend analysis for monthly water quality data. Water Resour. Res. 1982, 18, 107–121. [Google Scholar] [CrossRef]
- Theil, H. A rank-invariant method of linear and polynomial regression analysis. In Henri Theil’s Contributions to Economics and Econometrics; Springer: London, UK, 1992; pp. 345–381. [Google Scholar]
- Adler, J. R in a Nutshell: A Desktop Quick Reference; O’Reilly Media, Inc.: Sebastopol, CA, USA, 2010. [Google Scholar]
- Burn, D.H.; Elnur, M.A.H. Detection of hydrologic trends and variability. J. Hydrol. 2002, 255, 107–122. [Google Scholar] [CrossRef]
- Von Storch, H. Misuses of Statistical Analysis in Climate Research; Springer: New York, NY, USA, 1999; pp. 11–26. [Google Scholar]
- Gocic, M.; Trajkovic, S. Analysis of changes in meteorological variables using Mann-Kendall and Sen’s slope estimator statistical tests in Serbia. Glob. Planet. Chang. 2013, 100, 172–182. [Google Scholar] [CrossRef]
- Sayemuzzaman, M.; Jha, M.K. Seasonal and annual precipitation time series trend analysis in North Carolina, United States. Atmos. Res. 2014, 137, 183–194. [Google Scholar] [CrossRef]
- Pohlert, T. Non-Parametric Trend Tests and Change-Point Detection. CC BY-ND 4.0. Available online: http://creativecommons.org/licenses/by-nd/4.0/ (accessed on 25 March 2015).
- Villasenor Alva, J.A.; Estrada, E.G. A generalization of Shapiro–Wilk’s test for multivariate normality. Commun. Stat. Theory Methods 2009, 38, 1870–1883. [Google Scholar] [CrossRef]
- Bartlett, M.S.; Kendall, D. The statistical analysis of variance-heterogeneity and the logarithmic transformation. Suppl. J. R. Stat. Soc. 1946, 8, 128–138. [Google Scholar] [CrossRef]
- Qasim, A.; Nisar, S.; Shah, A.; Khalid, M.S.; Sheikh, M.A. Optimization of process parameters for machining of AISI-1045 steel using Taguchi design and ANOVA. Simul. Model. Pract. Theory 2015, 59, 36–51. [Google Scholar] [CrossRef]
- Gupta, N.K.; Jethoo, A.; Gupta, S. Rainfall and surface water resources of Rajasthan State, India. Water Policy 2016, 18, 276–287. [Google Scholar] [CrossRef]
- Hoaglin, D.C.; Welsch, R.E. The hat matrix in regression and ANOVA. Am. Stat. 1978, 32, 17–22. [Google Scholar]
- Zhang, R.; Zhang, S.-H.; Xu, W.; Wang, H. Flow regime of the three outlets on the south bank of Jingjiang River, China: An impact assessment of the Three Gorges Reservoir for 2003–2010. Stoch. Environ. Res. Risk Assess. 2015, 29, 2047–2060. [Google Scholar] [CrossRef]
- Huang, G.; Zhou, J.; Lin, B.; Xu, X.; Zhang, S. Modelling hydrographic processes of large lowland river networks: With the middle and lower Yangtze River as an example. Water Manag. 2016, 1–12. [Google Scholar] [CrossRef]
- Huang, G.; Zhou, J.; Lin, B.; Chen, Q.; Falconer, R. Distributed Numerical Hydrological and Hydrodynamic Modelling for Large River Catchment. In Proceedings of the 35th IAHR World Congress, Chengdu, China, 9–13 September 2013; pp. 1–12.
- Huang, G. Development and Application of the Flow Model for the Complex River Networks in the Middle Yangtze River; Post-Doctor Reprot; Department of Hydraulic Engineering, Tsinghua University: Beijing, China, 2008; pp. 1–99. (In Chinese) [Google Scholar]
- Zhu, L.; Chen, J.; Yuan, J.; Dong, B. Sediment erosion and deposition in two lakes connected with the middle Yangtze River and the impact of Three Gorges Reservoir. Adv. Water Sci. 2014, 25, 348–357. (In Chinese) [Google Scholar]
- Jiang, C.; Li, C.; Li, Z.; Long, Y. Study of fluvial processes in Xiangtan-Haohekou Section of Xiangjiang River. J. Sediment Res. 2013, 3, 19–26. (In Chinese) [Google Scholar] [CrossRef]
- Li, S.; Xiong, L.; Dong, L.; Zhang, J. Effects of the Three Gorges Reservoir on the hydrological droughts at the downstream Yichang station during 2003–2011. Hydrol. Process. 2013, 27, 3981–3993. [Google Scholar] [CrossRef]
- Huang, G.; Jin, Y.; Zhou, J.; Chen, Q. Quantitative Calculation of Hydrological Variation in Middle and Lower Yangtze River (MLYR) Under the Action of Large Cascade Reservoirs (LCR). In Proceedings of the 3rd International Conference on Estuaries & Coasts, ICEC, Sendai, Japan, 14–16 September 2009; pp. 569–576.
- Hollis, G.; Stevenson, A. The physical basis of the Lake Mikri Prespa systems: Geology, climate, hydrology and water quality. Hydrobiologia 1997, 351, 1–19. [Google Scholar] [CrossRef]
- Wang, X.; Gong, P.; Zhao, Y.; Xu, Y.; Cheng, X.; Niu, Z.; Luo, Z.; Huang, H.; Sun, F.; Li, X. Water-level changes in China’s large lakes determined from ICESat/GLAS data. Remote Sens. Environ. 2013, 132, 131–144. [Google Scholar] [CrossRef]
- Mei, X.; Dai, Z.; Du, J.; Chen, J. Linkage between Three Gorges Dam impacts and the Dramatic Recessions in China’s Largest Freshwater Lake, Poyang Lake. Sci. Rep. 2015, 5, 1–9. [Google Scholar] [CrossRef] [PubMed]
- Lai, X.; Shankman, D.; Huber, C.; Yesou, H.; Huang, Q.; Jiang, J. Sand mining and increasing Poyang Lake’s discharge ability: A reassessment of causes for lake decline in China. J. Hydrol. 2014, 519, 1698–1706. [Google Scholar] [CrossRef]
- Yang, T.; Zhang, Q.; Chen, Y.D.; Tao, X.; Xu, C.Y.; Chen, X. A spatial assessment of hydrologic alteration caused by dam construction in the middle and lower Yellow River, China. Hydrol. Process. 2008, 22, 3829–3843. [Google Scholar] [CrossRef]
- Hassanzadeh, E.; Zarghami, M.; Hassanzadeh, Y. Determining the main factors in declining the Urmia Lake level by using system dynamics modeling. Water Resour. Manag. 2012, 26, 129–145. [Google Scholar] [CrossRef]


| Number | Variable | Definition | Unit |
|---|---|---|---|
| 1 | WLM | Annual maximum lake water level | m |
| 2 | WL | Annual mean lake water level | m |
| 3 | WLm | Annual minimum lake water level | m |
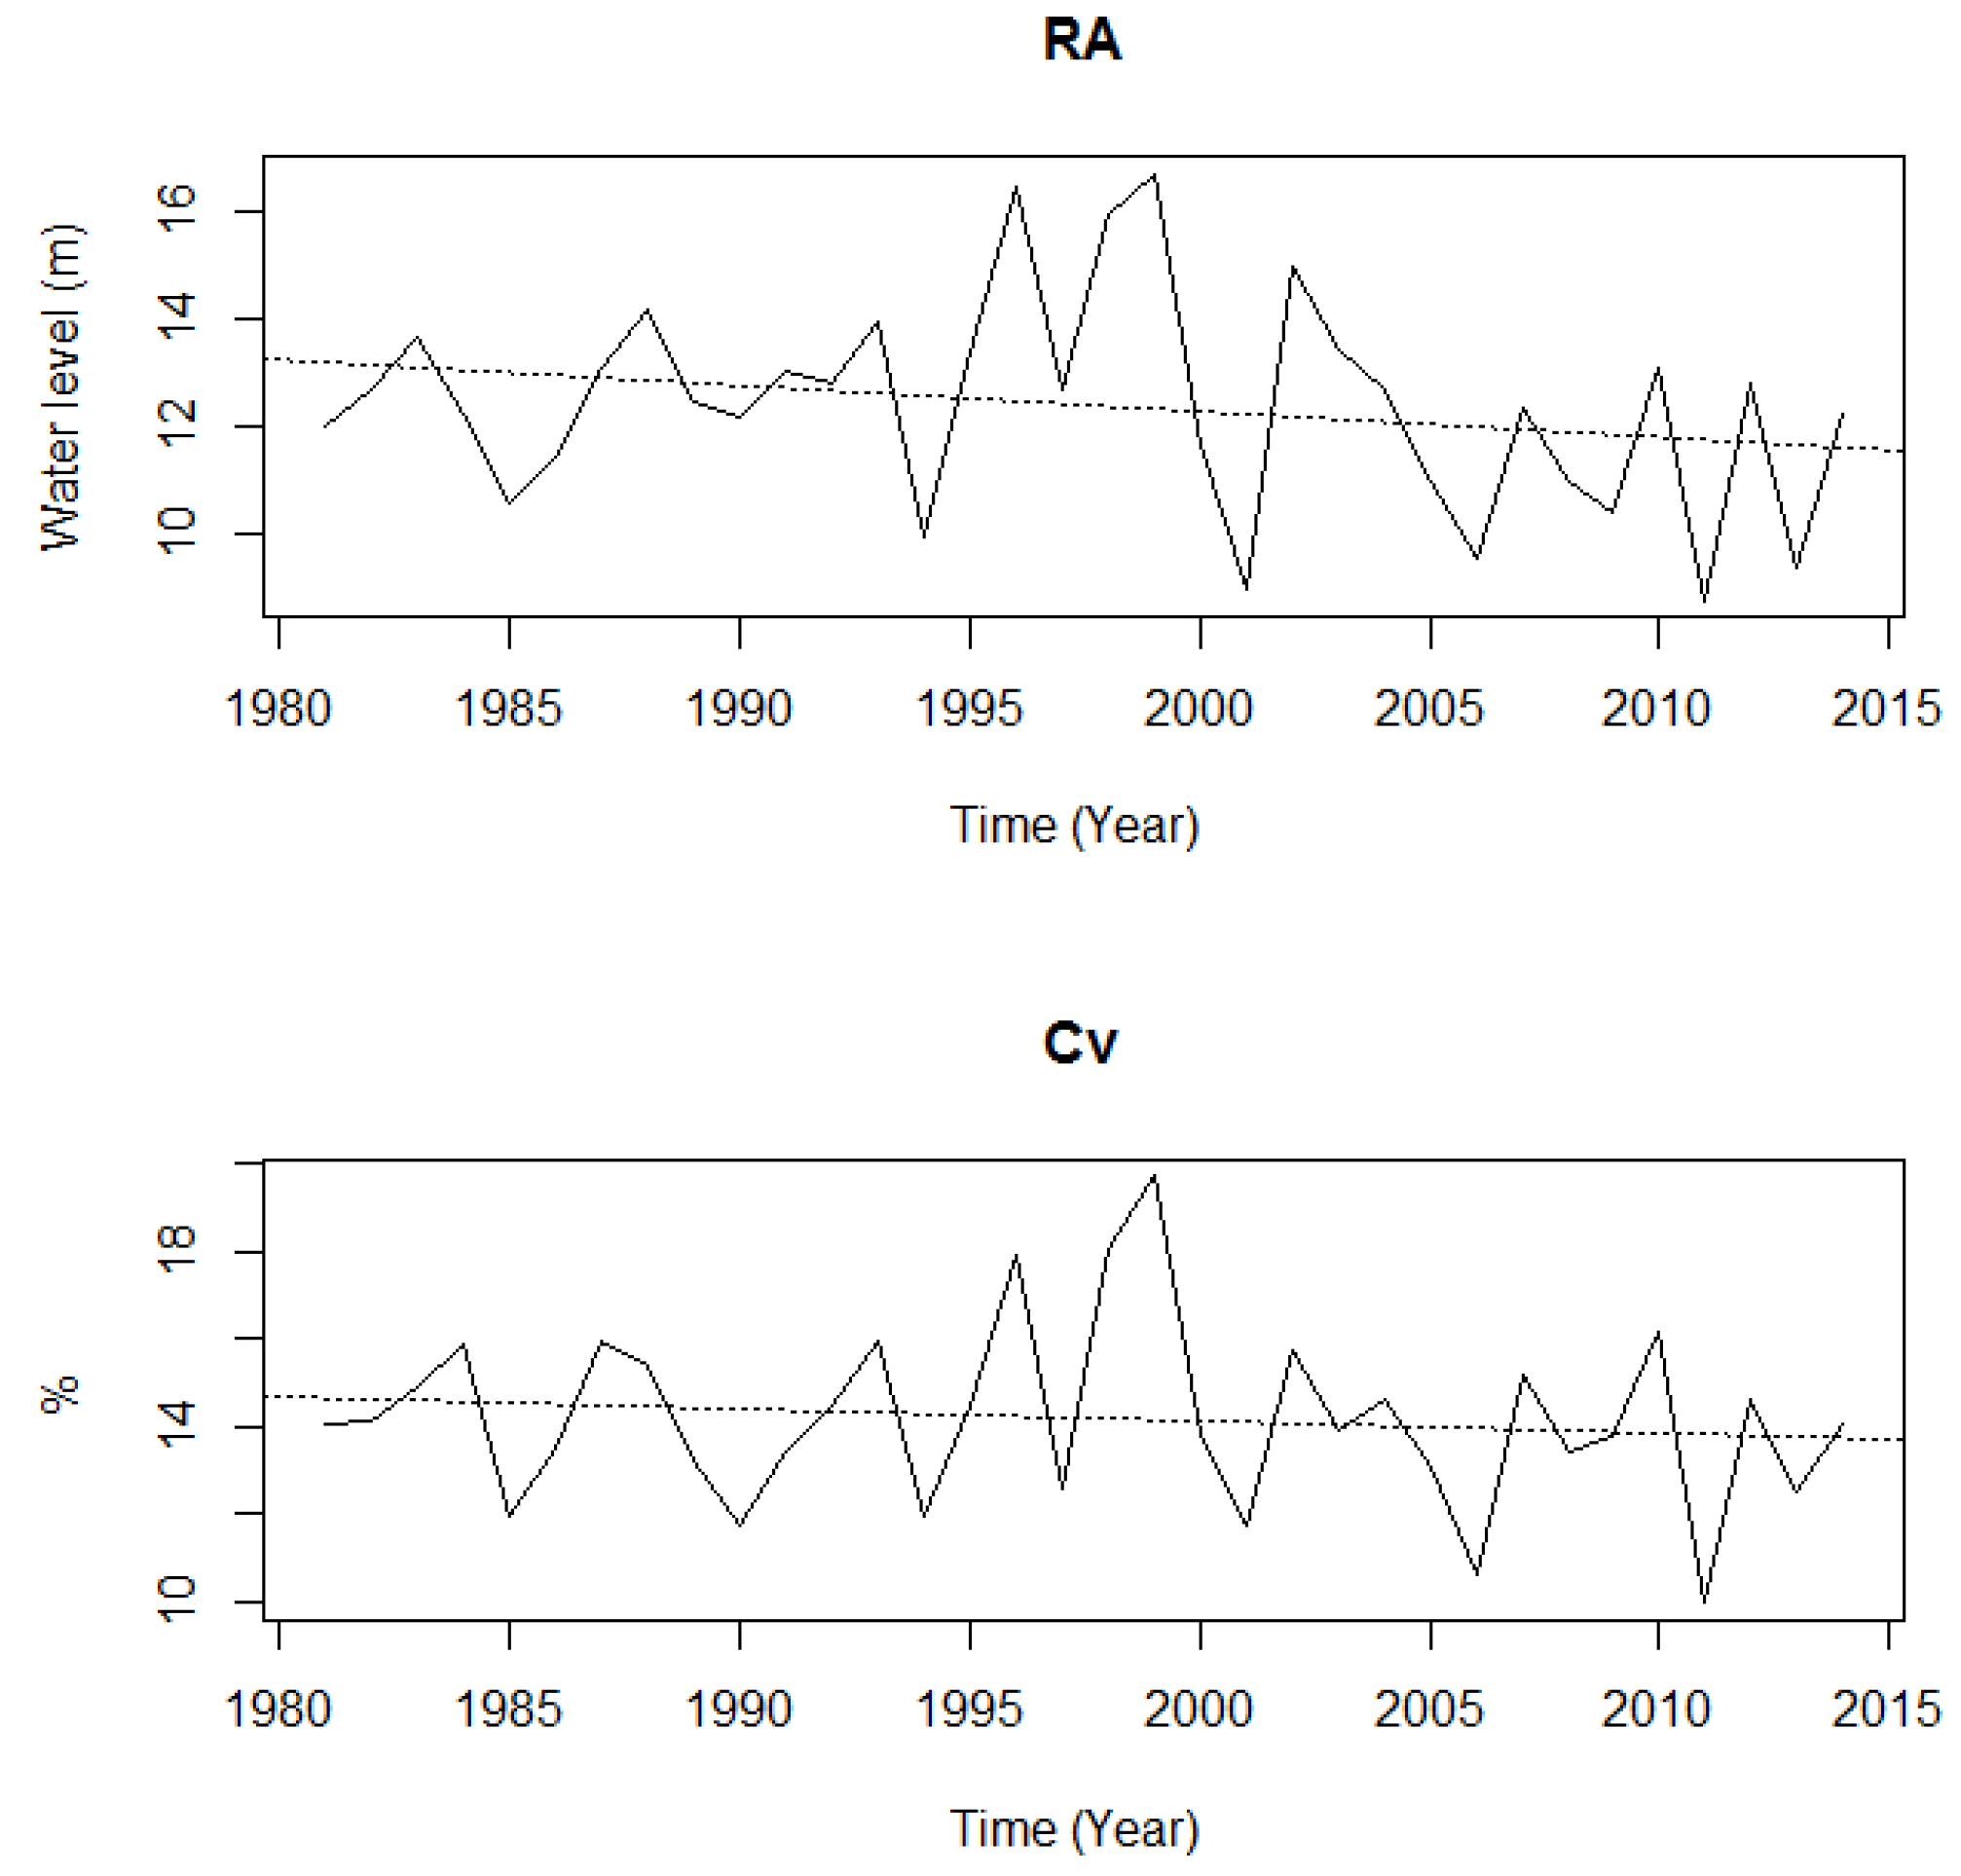
| 4 | RA | Range between maximum and minimum water level | m |
| 5 | Cv | Coefficient of variation | % |
| 6 | JAN | Monthly lake water level in January | m |
| 7 | FEB | Monthly lake water level in February | m |
| 8 | MAR | Monthly lake water level in March | m |
| 9 | APR | Monthly lake water level in April | m |
| 10 | MAY | Monthly lake water level in May | m |
| 11 | JUN | Monthly lake water level in June | m |
| 12 | JUL | Monthly lake water level in July | m |
| 13 | AUG | Monthly lake water level in August | m |
| 14 | SEP | Monthly lake water level in September | m |
| 15 | OCT | Monthly lake water level in October | m |
| 16 | NOV | Monthly lake water level in November | m |
| 17 | DEC | Monthly lake water level in December | m |
| Variable | Z (MK Test) | Sen’s Slope (cm/year) |
|---|---|---|
| WL | 2.1 ★ | 1.65 |
| WLM | 0.6 | 0.90 |
| WLm | 2.5 ★ | 4.58 |
| RA | −2.3 ★ | −0.37 |
| Cv | −3.5 ★ | |
| JAN | 4.1 ★ | 3.53 |
| FEB | 3.5 ★ | 3.07 |
| MAR | 2.9 ★ | 4.29 |
| APR | 1.6 | |
| MAY | 0.6 | |
| JUN | 2.1 ★ | 2.68 |
| JUL | 0.8 | |
| AUG | 1.3 | |
| SEP | −0.1 | |
| OCT | −1.7 | |
| NOV | −1.4 | |
| DEC | 1.5 |
| Variable | Z (MK Test) | Sen’s Slope (cm/year) |
|---|---|---|
| WL | −1.0 | −0.79 |
| WLM | −0.7 | −2.27 |
| WLm | 2.6 ★ | 2.56 |
| RA | −1.3 | |
| SD | −0.7 | |
| Cv | −0.6 | |
| HR | −1.5 | |
| JAN | 2.3 ★ | 2.62 |
| FEB | 0.8 | |
| MAR | 0.3 | |
| APR | −0.9 | |
| MAY | 1.7 | |
| JUN | 0.8 | |
| JUL | −0.5 | |
| AUG | 0.0 | |
| SEP | −0.9 | |
| OCT | −3.8 ★ | −9.39 |
| NOV | −1.8 | |
| DEC | −0.7 |
| Parameters | Element | Sum of Squares | df | Mean Square | F | p Value |
|---|---|---|---|---|---|---|
| 1 | Months | 346.08 | 11 | 31.46 | 9.71 | 4.18 × 10⁻⁶ |
| Sub-periods | 0.61 | 2 | 0.31 | 0.09 | 0.91 | |
| 2 | Months | 349.04 | 11 | 31.73 | 9.66 | 4.36 × 10⁻⁶ |
| Sub-periods | 0.75 | 2 | 0.38 | 0.11 | 0.89 |
| 1961–1980 | 1981–2002 | 2003–2014 | 1981–1999 | 2000–2014 | |||||
|---|---|---|---|---|---|---|---|---|---|
| Mean (m) | Mean (m) | % | Mean (m) | % | Mean (m) | % | Mean (m) | % | |
| WLM | 31.72 | 32.76 | 3.29 | 31.66 | −0.19 | 32.85 | 3.56 | 31.77 | 0.16 |
| WL | 24.44 | 25.32 | 3.58 | 24.91 | 1.91 | 25.30 | 3.52 | 25.02 | 2.37 |
| WLm | 18.45 | 19.81 | 7.38 | 20.28 | 9.92 | 19.73 | 6.94 | 20.29 | 9.97 |
| JAN | 19.34 | 20.75 | 7.29 | 21.18 | 9.52 | 20.73 | 7.16 | 21.13 | 9.26 |
| FEB | 19.23 | 20.90 | 8.68 | 21.21 | 10.30 | 20.89 | 8.66 | 21.15 | 10.00 |
| MAR | 20.22 | 22.06 | 9.10 | 22.46 | 11.08 | 21.98 | 8.69 | 22.48 | 11.20 |
| APR | 22.87 | 24.07 | 5.25 | 23.60 | 3.18 | 24.10 | 5.37 | 23.65 | 3.42 |
| MAY | 26.23 | 25.88 | −1.33 | 26.13 | −0.36 | 25.76 | −1.79 | 26.23 | 0.00 |
| JUN | 27.14 | 27.94 | 2.95 | 28.09 | 3.48 | 27.84 | 2.58 | 28.19 | 3.85 |
| JUL | 29.77 | 30.85 | 3.63 | 29.84 | 0.23 | 30.97 | 4.03 | 29.89 | 0.41 |
| AUG | 28.59 | 29.70 | 3.88 | 29.02 | 1.51 | 29.77 | 4.13 | 29.06 | 1.66 |
| SEP | 28.24 | 28.83 | 2.09 | 27.99 | −0.88 | 28.87 | 2.23 | 28.11 | −0.45 |
| OCT | 26.87 | 26.87 | 0.00 | 24.80 | −7.69 | 26.90 | 0.12 | 25.18 | −6.30 |
| NOV | 23.90 | 24.19 | 1.21 | 23.22 | −2.84 | 24.08 | 0.76 | 23.55 | −1.48 |
| DEC | 20.93 | 21.78 | 4.06 | 21.40 | 2.23 | 21.71 | 3.71 | 21.56 | 3.00 |
© 2016 by the authors; licensee MDPI, Basel, Switzerland. This article is an open access article distributed under the terms and conditions of the Creative Commons Attribution (CC-BY) license (http://creativecommons.org/licenses/by/4.0/).
Share and Cite
Han, Q.; Zhang, S.; Huang, G.; Zhang, R. Analysis of Long-Term Water Level Variation in Dongting Lake, China. Water 2016, 8, 306. https://doi.org/10.3390/w8070306
Han Q, Zhang S, Huang G, Zhang R. Analysis of Long-Term Water Level Variation in Dongting Lake, China. Water. 2016; 8(7):306. https://doi.org/10.3390/w8070306
Chicago/Turabian StyleHan, Qiaoqian, Shuanghu Zhang, Guoxian Huang, and Rui Zhang. 2016. "Analysis of Long-Term Water Level Variation in Dongting Lake, China" Water 8, no. 7: 306. https://doi.org/10.3390/w8070306
APA StyleHan, Q., Zhang, S., Huang, G., & Zhang, R. (2016). Analysis of Long-Term Water Level Variation in Dongting Lake, China. Water, 8(7), 306. https://doi.org/10.3390/w8070306