Article

Navigating towards Decoupled Aquaponic Systems: A System Dynamics Design Approach

1
Biobased Chemistry and Technology, Wageningen University, P.O. Box 17, Wageningen 6700 AA, The Netherlands
2
Aquaponik Manufaktur GmbH, Geldener Str. 139, Issum 47661, Germany
3
LandIng Aquaculture, Evenheuvel 4, 5688 LZ Oirschot, The Netherlands
4
Integrated and Urban Plant Pathology Laboratory, Université de Liége, Avenue Maréchal Juin 13, Gembloux 5030, Belgium
5
Institute for Natural Resource Sciences, Zurich University of Applied Science (ZHAW), Grüental, Wädenswil 8820, Switzerland
6
IGB, Ecophysiology and Aquaculture, Müggelseedamm 310, Berlin 12587, Germany
*
Author to whom correspondence should be addressed.
Water 2016, 8(7), 303; https://doi.org/10.3390/w8070303
Submission received: 24 February 2016 / Revised: 13 June 2016 / Accepted: 12 July 2016 / Published: 21 July 2016
(This article belongs to the Special Issue Aquaponics: Toward a Sustainable Water-Based Production System?)

Abstract

:
The classical working principle of aquaponics is to provide nutrient-rich aquacultural water to a hydroponic plant culture unit, which in turn depurates the water that is returned to the aquaculture tanks. A known drawback is that a compromise away from optimal growing conditions for plants and fish must be achieved to produce both crops and fish in the same environmental conditions. The objective of this study was to develop a theoretical concept of a decoupled aquaponic system (DAPS), and predict water, nutrient (N and P), fish, sludge, and plant levels. This has been approached by developing a dynamic aquaponic system model, using inputs from data found in literature covering the fields of aquaculture, hydroponics, and sludge treatment. The outputs from the model showed the dependency of aquacultural water quality on the hydroponic evapotranspiration rate. This result can be explained by the fact that DAPS is based on one-way flows. These one-way flows results in accumulations of remineralized nutrients in the hydroponic component ensuring optimal conditions for the plants. The study also suggests to size the cultivation area based on P availability in the hydroponic component as P is an exhaustible resource and has been identified one of the main limiting factors for plant growth.

1. Introduction

Aquaponics may be defined as an integrated quasi closed-loop multi-trophic food production system comprising a recirculating aquaculture system (RAS) and a hydroponic unit. In an aquaponic system, the nutrient-enriched water derived from the fish is directed to the hydroponic unit providing nutrients for plant growth. The appeal of aquaponics lies on its capacity to produce aquatic animals (e.g., fish, crayfish, etc.) and plants (e.g., vegetables, herbs, medical plants, fruits, etc.) in an environmentally-friendly way, ensuring high levels of water reuse [1] and nutrient recycling [2,3]. Despite varying water quality requirements in both RAS and hydroponic production units, the traditional aquaponics practice has been based on compromising the needs of plants and fish within a single water process loop, thereby reducing the efficiency of aquaponic systems compared to the sum of single crop production, fish and plant, respectively [4]. Although many aquaponics systems are constructed and operated as a recirculating loop, commercial growers and researchers carry on expanding this initial aquaponics system design towards an independent control over each system unit (i.e., RAS, hydroponics, and nutrient recovery via sludge remineralization). Systems where fish, plants and, if applicable, remineralization are integrated as separate functional units comprising individual water cycles that can be controlled independently, are called decoupled aquaponic systems (DAPS). Still, as a matter of fact, system design aims at a high degree of self-sufficiency of the entire system. Components are consequently designed and sized in the way that the required manipulation to adjust conditions within the cycle can be minimized. Recently, Kloas et al. [5] presented a DAPS comprising a RAS and a hydroponic unit arranged as two individual water cycles, where water loss due to evapotranspiration of the plants was replaced on demand via a one way valve from the RAS, which in turn was refilled with tap water. Thereby, an improved control of the nutrient flows as well as optimized species-specific water conditions in both units were achieved. The fate of this approach is that the water consumption (i.e., mainly evapotranspiration rate) is the decisive factor of DAPS, as it defines the water replacement and water quality in the RAS as well as the nutrient supply for the plants, if no additional supplementation/fertilization is carried out. Consequently, understanding the impact of water and nutrient flows within such systems is crucial for determining their conceptual framework.
Growth advantages of DAPS have been observed in lab-scale experiments [6,7]. Jijakli et al. [6] observed an increased plant growth of 39% compared to a pure hydroponic control nutrient solution when supplementing the hydroponic component with additional fertilizer. Moreover, Goddek [7] showed that anaerobic digestates also increased plant growth. To our knowledge, the concept of DAPS has not yet been applied to systems comprising more than two units. In this study, we extended the concept by integrating a third functional unit for the remineralization of RAS derived sludge. Similar to a food web, a number of functional units representing different trophic levels such as autotrophic producers (plant crops), heterotrophic consumers (fish, crustaceans, molluscs) and decomposers (remineralization unit) could be arranged in individual, though communicating water cycles, providing a better control of the nutrient flows and increasing the efficiency of the production and reducing emissions further. Most importantly, such concept may allow for better fine tuning of nutrient flows between several units and may add stability with regard to imbalances or disturbances.
Nutrient dynamics in one-loop integrated aquaculture-hydroponic systems have first been investigated by Seawright et al. [8]. However, nutrient flows and accumulations were not comprehensible due to unreported nutrient supplementations. A nitrogen (N) balance study for one-loop aquaponic systems was conducted by Graber and Junge [2] and Licamele [9], who observed that growth of hydroponic and aquaponic lettuce was similar even though the lettuce in the hydroponic system was exposed to a solution with a higher nutrient concentration. Another mass balance study has been conducted by Neto and Ostrensky [10] who estimated the nutrient load and waste productions in tilapia cage production systems. Regarding the nutrient flow from RAS to the plants in one-loop systems, several authors have made examinations of this issue and observed low levels of P, potassium, magnesium, manganese, iron, and sulphur [1,2,9,11,12,13]. Consequently, the plant growth performance could probably even be improved by providing a sufficient amount of nutrients, which can either be achieved by supplementation [4,14], or remineralization of fish sludge as observed in several studies comprising mass balance approaches [15,16,17].

2. Objectives and Scope

Typically, models are created to understand, predict, and control complex dynamic systems [18]. The scope of this study is to develop a system dynamics model for N, phosphorus (P), water, fish, plants, and sludge (aquacultural biosolids), based on a decoupled system approach. The reason why the macronutrient P is used in this paper is due to the fact that it is an exhaustible resource [19]. Even though it is mostly sufficiently available in the fish feed, other more available nutrients can be supplemented to the hydroponic component. The system dynamics model of this study can be used to design and further optimize systems. The main objective of this paper is to present a theoretical design approach for DAPS by addressing the scope’s conceptual criteria, and coping with design drawbacks based on the model’s outcome. The model elaborated in this paper assesses the system’s organic loading rates to achieve optimal conditions for both hydroponic and RAS components of the system under given conditions. This will lead to a perspective that covers the evaluation regarding the need for further studies that have to be pursued to develop and improve a plant-wide model for decoupled aquaponic systems.

3. Methodology and Data Sources

3.1. Dynamic Systems Analysis

Dynamic systems analysis was used to evaluate the N, P, fish (i.e., tilapia), plant (i.e., lettuce plant), and water balance within DAPS. This method also enabled us to assess the impact of a remineralization component on the overall system’s performance, as well as sizing the hydroponic part depending on different evapotranspiration rates. However, as a basis for physically-based dynamic modeling, as opposed to data-driven modeling, well-grounded flow charts and causal loop diagrams (CLD) are required [18]. Whereas flowcharts provide an overview of all procedures considered necessary in the context of a comprehensive diagnostic process, CLDs represent a fundamental tool to understand and illustrate complex systems. Both served as foundation plans and constituted the basis for the software computer model.
Although CLDs are a good tool to identify causal relationships between activities or events and their latent effects, they need to be combined with the factor time to simulate and reveal short to long term impact factors and changes due to e.g., accumulations, fluctuations in temperature and fish biomass, etc. The resulting system dynamics models allow analyzing the interplay of key factors in order to reveal key leverage points and optimal conditions and system settings. Here, the specific system modeling software AnyLogic was used [20]. For the CLDs (that can be seen in Figure B1, Figure B2 and Figure B3) the following choices were made: (1) RAS, hydroponics, and sludge remineralization are displayed independently to constitute the need for different conditions in each sub-system; and (2) in the RAS component, a nitrifying biofilter is included in the model. Laying the basis for the models, assumptions for the flow charts are: (1) there is no need to exchange water in addition to the water replacement as consequence of evapotranspiration; (2) it is provided that the RAS components contain biofilters of adequate size to fully transform total ammonia nitrogen (TAN) into nitrate; and (3) nutrient supplementations for the hydroponic units are not taken into account.
The system dynamics model simulations were based on a decoupled system with four fish tanks. The modeling procedure was divided into four steps: (1) Before N, P, water, tilapia, lettuce, and sludge flows were simulated, a parameter variation experiment was run in order to estimate the amount of fish that needed to be incorporated to the system to have a maximum stocking density of 50 kg·m−3. For higher densities the use of pure oxygen could be required; (2) Given this data, the plant cultivation area for maximum nitrogen-nitrate (N-NO3) water concentration for sensitive and resistant fish species (i.e., trout and tilapia) was simulated using a parameter variation experiment depending on crop evapotranspiration rates (ETc) under natural and artificial light conditions. For trout the limit was set to 40 mg·L−1 N-NO3 [21,22,23], for tilapia to 200 mg·L−1 N-NO3; (3) P was used as an alternative design parameter to size the hydroponic component since it is often limiting plant growth and global mineral resources are finite. However, if the obtained size suggestion does not correspond with the needed water exchange rates, active denitrification in the RAS is required. For this study, an optimization step was conducted, which determined the amount of lettuce that can be produced with RAS-derived nutrients and remineralized P inflow from an anaerobic nutrient remineralization component (ANRC). In this study, the ANRC was composed by an upflow anaerobic sludge blanket (UASB) reactor. UASB reactor performance parameters were used to determine the remineralization rates; (4) Given the P parameter the flow of the UASB was determined.

3.2. FAO Penman-Monteith Equation

The evapotranspiration rate is dependent on net radiation, temperature, wind velocity, relative humidity, and crop species [24,25]. Net solar radiation can be determined using the FAO Penman-Monteith equation [25]. This equation is initially developed for outdoor environments, but can be adjusted for greenhouse crop production [24,26]. Instead of a total dependency on nature, both greenhouse characteristics and climate control equipment have a high impact on the evapotranspiration [27,28]. Fernández et al. [29] report a reduced reference evapotranspiration (ETo) by 21.4%, when using plastic greenhouses in Spain. Greenhouses also reduce the wind speed considerably, which has a reducing impact on the reference evapotranspiration [29,30]. Surface covers as they are used, for instance in nutrient flow techniques (NFT) or deep water culture (DWC) methods are reported to reduce the single crop coefficient (Kc) [25] that is multiplied with the reference evapotranspiration to receive the crop evapotranspiration. Licamele [9] reported that plant density of 32 lettuce plants m−2 required 1 L of water each. These findings were consistent with the estimated covered single crop coefficient (Figure 1). Therefore a comparative analysis was conducted with AnyLogic to estimate the range of expected evapotranspiration rates under constant lighting conditions of 200 W·m−2 for 16 h·day−1 and the sole use of natural light.
Knowing both ETo and Kc, the crop evapotranspiration in m3 per m2·day−1, and typically expressed in mm·day−1, was estimated as follows:
ET c = ET o × K c
where ETc is the crop evapotranspiration (mm·day−1), Eto the reference evapotranspiration (mm·day−1), and Kc the plant coefficient for lettuce (dimensionless).
The reference evapotranspiration for the natural light option has been estimated based on measured hourly solar radiation data for Köln-Bonn (Table 1), Germany (50°47′ N; 7°5′ E) of 2014 [31] representative for the Central European region. The temperature range within the greenhouse was determined at 20–24 °C, the relative humidity set between 60% and 80%. It was assumed that the greenhouse glazing transmittance reduces incident radiation by 10%. The shading factor due to construction and surrounding reduced it by another 15%, which made us assume that the net radiation of natural light under greenhouse conditions decreased by 25%. Figure 2 shows the estimated ETo difference under natural and artificial lighting. The natural lighting reference evapotranspiration can be expressed in to the following formula, which refers to the natural lighting curve in Figure 2 (r2 = 0.994; statistical measure of how close the data are to the fitted regression line):
ET o   =   2.758 × exp   ( 0.5 × ( ( X 6.14 ) / 2.36 ) 2 )
where X is the time in months.

3.3. Input Data and Parametrization for RAS

The modelled RAS comprised four fish tanks with a volume of 1 m3 each. Additional RAS components (i.e., biofilter, drum filter, sump, etc.) add another 3 m3 of volume. The RAS water temperature is held stable at about 28 °C. Temperature is an important factor for fish growth and its influence on tilapia growth (cm·month−1) can be predicted given the following formula for a maximum temperature of 29.5 °C [32]:
G r o w t h   ( cm · month 1 ) =   T 18.3 3.28
where T is the average temperature (in °C) of the RAS.
Knowing the fish length allows to calculate the fish weight [32]:
W T   =   2.08 × L   3 3.28
where WT is the weight of the tilapia (in g), and L the length of tilapia (in cm).
In the model, fingerlings 10 cm in size were sequentially added to the fish tanks. The total fish growth cycle was set at 200 days. Thus, every 50 days fish were harvested and re-added to one of the fish tanks. The fish were fed with species specific feed with a protein content of 35%, of which 9.2% of proteins become TAN [32]. The feeding rate was calculated based on a percentage of body weight that, in turn, was depending on the feed conversion ratio (FCR) [32]. It was assumed that the optimal FCR is 1.1–1.3 for tilapia depending on their growth stage [32], even though in aquaponics FCRs of 1.7–1.8 have been observed [33]. It was also assumed that water quality parameters of the RAS lie within acceptable limits (Table 2) and did not have any impact on the mortality rate. The main factor for the fish’s survival rate was thus the density [34]. The passive denitrification rate was 10% [32]. The fish feed uptake rate (i.e., the percentage of feed the fish actually consume) was assumed being 95% [32].
Given these parameters, the optimization experiment that has been conducted with AnyLogic with the decision variable “amount of fish” suggested to start with 60 fingerlings to gain a fish biomass of approximately 50 kg·m−3 fishes per tank after 200 days.

3.4. Input Data and Parametrization for Hydroponics

The growth cycle for lettuce was set at 35 days. They were grown in DWC systems with a depth of 30 cm. The inflow from the RAS to the DWC was determined by the evapotranspiration rate, that is ETc times area of the hydroponic system, and is given by:
Hydroponic inflow from RAS = Evapotranspiration − inflow from ANRC
where ANRC represents the anaerobic nutrient remineralization component.
Under optimal conditions, lettuce head weights of 150 g can be achieved 4 weeks after transplanting the seedlings into the hydroponic system [33,41]. 16 lettuce plants were cultivated per m2, each of which takes up 6 g of N and 50 mg of P within the growth cycle [9].

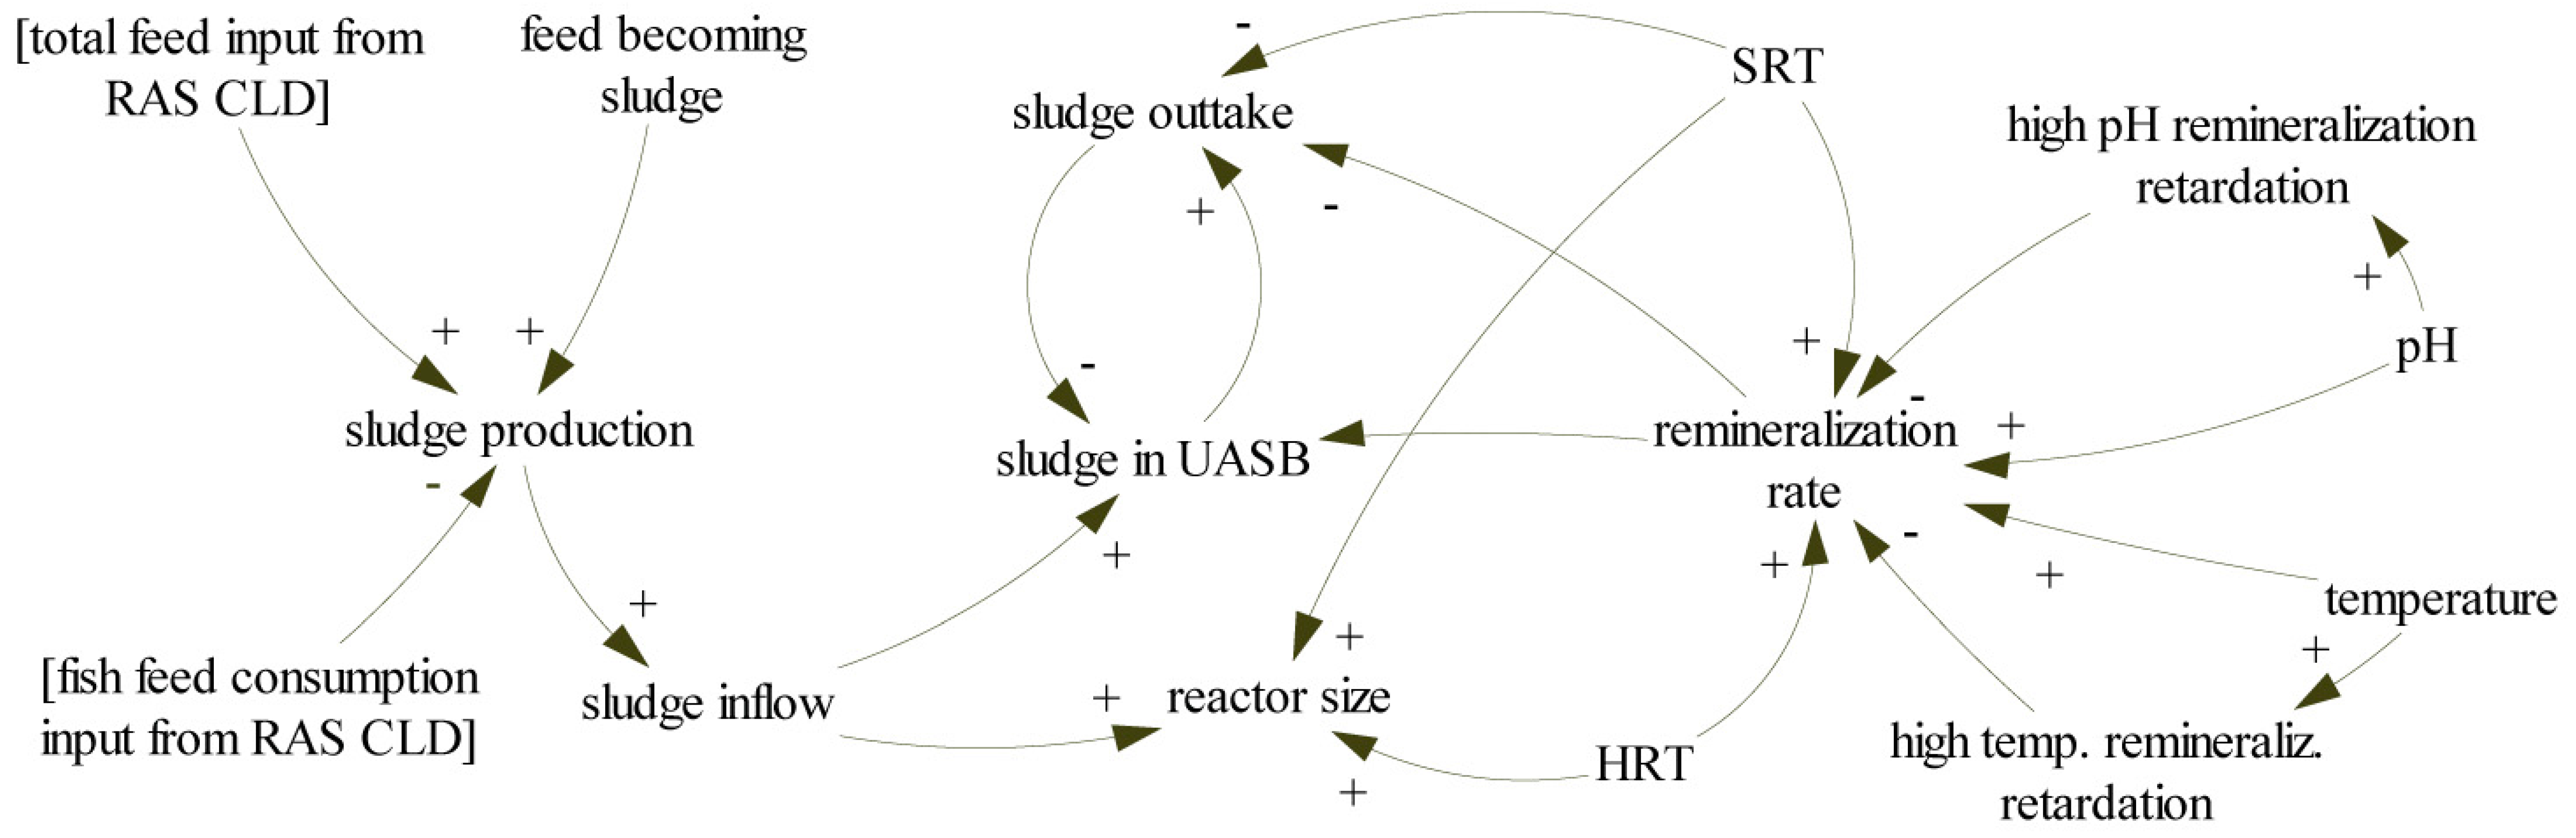
3.5. Input Data and Parametrization for Remineralization

Nitrate and nitrite are degraded to ammonia and dinitrogen gas under anaerobic conditions [42]. Both Zhao et al. [43] and Cuervo-López et al. [44] observed nitrate and nitrite degradation efficiencies of approx. 99% in UASB reactors operating with an hydraulic retention time (HRT) of 9–12 days and 2 days, respectively. Mirzoyan and Gross [17] show similar nitrate and nitrite removal rates. However, in their work, the effluent consisted of 17.7 mg·L−1 TAN (for every 102 g·kg−1 entering the UASB reactor) at an HRT of 8 days and a total suspended solids sludge concentration of 3.8%. The N composition of the inflowing sludge is a sum of N water content and N in dry matter sludge. The composition of the latter has been shown by Neto and Ostrensky [10], who report an N content of approximate 15% of dry sludge for a feed N content of 5.3%, and a P feed content of 1.5% [10,12].
The volume of the UASB reactor has been determined by the following HRT formula:
HRT   ( h ) =   Reactor Volume  ( m 3 ) Flow Rate  ( m 3 ·h 1 )
where HRT is the hydraulic retention time in hours.
The desired HRT was 10 days, because it showed best digestion performance recently [17]. Since an HRT of 10 days cannot practically fulfill this requirement, an additional circulation pump was required for each UASB reactor. The flow rate going into the reactor has been determined by the amount of daily sludge produced by the fish, which has been recovered from the settling basin (see Figure 3) with a specific TSS. In our case the sludge retention time (SRT) was 80 days considering that the sludge blanket occupied 60% of the volume of the reactor with a TSS of 3%. The amount of sludge withdrawn on a daily basis has been assumed to be 10% of the organic loading rate (ORL); i.e., of the added fresh sludge. Mirzoyan and Gross [17] showed a fresh sludge TSS removal of 90%. The same TSS removal has been assumed in this study.
SRT   ( day )   =   Total sludge present in reactor  ( kg ) sludge withdraw  ( kg·day 1 )
An upflow velocity of 0.5 m·h−1 must be maintained to keep the sludge blanket in suspension [45]. The upflow velocity formula is as follows.
V u p =   H HRT
where Vup is the upflow velocity (m·h−1), H is the reactor height (m), and HRT is the hydraulic retention time (h).

4. Theory

4.1. Decoupled System Design

4.1.1. Justification for Decoupled Systems

Nitrate concentrations in aquaponic systems can be controlled either by water exchange, plant uptake, and/or denitrification through anoxic bacterial reduction. Water exchange rates can be determined via mass balance, whilst N removal by denitrification or plant uptake must be calculated using available information on N removal rates by different plants and denitrification reactor configurations. Unlike N, which is present in aquaponics mostly in dissolved forms that tend to accumulate, several important plant nutrients are found almost exclusively in biosolids originating from uneaten food and feces.
Until recently, the principal focus of publications in the field of aquaponics was mostly on the availability, concentration, and accumulation of nitrate, which has been considered the most important macronutrient for vegetative growth. Even though it increases the complexity of the overall process and is not a focus of this paper, it is inevitable to address the accumulation of all micro- and macronutrients that are necessary for optimal growth conditions. This becomes more relevant given the fact that in DAPS the nutrient accumulation in the hydroponic component results from several sources (i.e., inflow from RAS, inflow from remineralization component, and nutrient supplementation) and reduces dilution due to the fact that the ANRC outflows only dilutes in the hydroponic component instead of system-wide. As the specific nutrient needs of fish and plants depend on a large number of dependencies and interactions, design trade-offs towards best practicable means need to be made, to achieve best possible conditions for both the fish and the plant and thus the optimization of the sub-systems with regard to the use/recycling of nutrients. These heterogeneous conditions of the respective sub-systems and their impact on nutrient accumulation have a significant effect on the overall system performance.
The advantages of independently controllable components are underlined in the Table 3 and Table 4. The in Table 3 given examples of optimal conditions for different plant and fish species, as well as the bio filtration and ANRC components are cases in point. The more the conditions of RAS and hydroponics deviate from their optimal conditions, the lower the production efficiency that can be expected. Instead of accounting for trade-offs between those component parts, the objective should be to provide the best practicable conditions for each component and combination of species. Even though similar growth performances between aquaponics and hydroponics have been observed, optimizing the respective conditions could lead to an enhanced fish and plant growth [6]. This is only achievable in independently controlled and running sub-systems. This concurs with Table 4. Here too, one can see major differences in environmental and nutritional factors. The significant difference in terms of nutrient concentration can be explained by the fact that trade-offs have to be made with respect to plants’ and fish’ specific needs, which is the reason for these gaps.
With respect to nutrient dynamics, the flow of each nutrient depends upon many factors including species, system design, biofilter performance, remineralization method, feed composition, etc. Around 25% of feed (dry matter) becomes sludge [32,73]. Neto and Ostrensky [10] analyzed the nutrient compositions of sludge (Table 5). They report that 55% of the P that entered the system via the fish feed accumulates in sludge. The sludge is composed of 37% feces and 18% non-consumed feed. The percentage of non-consumed feed, however, must be treated with caution as the data is collected from RAS cage breeding systems. Even though the values of Neto and Ostrensky [10] base on cage breeding systems, our observed values (Table 5) are closer to these values, than to observations made by Refiee and Saad [74] in RAS. We observed similar concentrations, using fish feed consisting of 9.7% N and 1.7% P. However, more P accumulated in the fish than in the sludge. Yet, the implementation of remineralization technology has great potential to recycling a high proportion of macronutrients such as P, K, and N (i.e., if carried out under anaerobic conditions) etc. [15,16,75].
As compared to one-loop aquaponics, the nutrient flow in DAPS is slightly different. As exemplified in Section 4.2, the extent to which the sludge remineralization process can add to the development of an integrated system approach. Apart from nutrient supplementation, nutrient remineralization can be used to accumulate nutrients in the hydroponic component. This may have a commercial advantage, as the root:shoot ratio (i.e., the ratio between the edible parts and the residuals) of plants is dependent on nutrient concentration in the plant. According to Lambers et al. [76] the root:shoot ratio of plants is decreased under sufficient presence of N, P, and very likely sulfate deficiency, which is the case in one-loop aquaponics systems.
The most important principle in aquaponics design states that the nutrient load of the system can be balanced between both the nutrient load, as a function of fish biomass and feeding rate, metabolic conversion and subsequent excretion as well as uneaten feed and feces, and the nutrient requirement of the plants [9]. Consequently, the determination of fish:plant ratios has become the most commonly used design approach for balancing the systems. However, as every plant and fish species have different nutritional needs that are also dependent on the growth stage/life-cycle and external factors (including system design), the exact determination of this ratio is complex, system-dependent and commonly carried out with empirical data. The more system designs are studied, the more accurately fish:plant ratios can be estimated and, as a consequence, the more efficient nutrient flows and yields can be managed. Although specific estimations might apply to a particular system setup, adopting this practice to size or balance entirely new designs without experimental evaluation can be problematic.
Irrespective of the system’s input and the specific optimized nutrient solution, the nutrient uptake of plants is highly dependent on nutrient availability, illumination, temperature, pH, etc. These deviating optimal conditions are reflected by plant specific coefficients. Being able to select the best combination of plants and fish as well as feed that achieves the best possible water quality and thus growth performance provides a good argument for DAPS. Achieving the best possible water quality still remains a minor criterion in system design engineering. However, when both fish and plant species and their specific nutritional needs are known, it will be possible to predict the plant component size based on the estimation of the RAS nutrient loading as well as the remineralization capacity of the used digestion method. Several mathematical N-uptake models have been developed [77,78,79] and can provide a good estimation for the plants’ N-consumption. However, the nutrient removal performance for different plant species and life stages under aquaponic conditions remains to be studied in order to be able to model the flows for all important nutrients within DAPS.

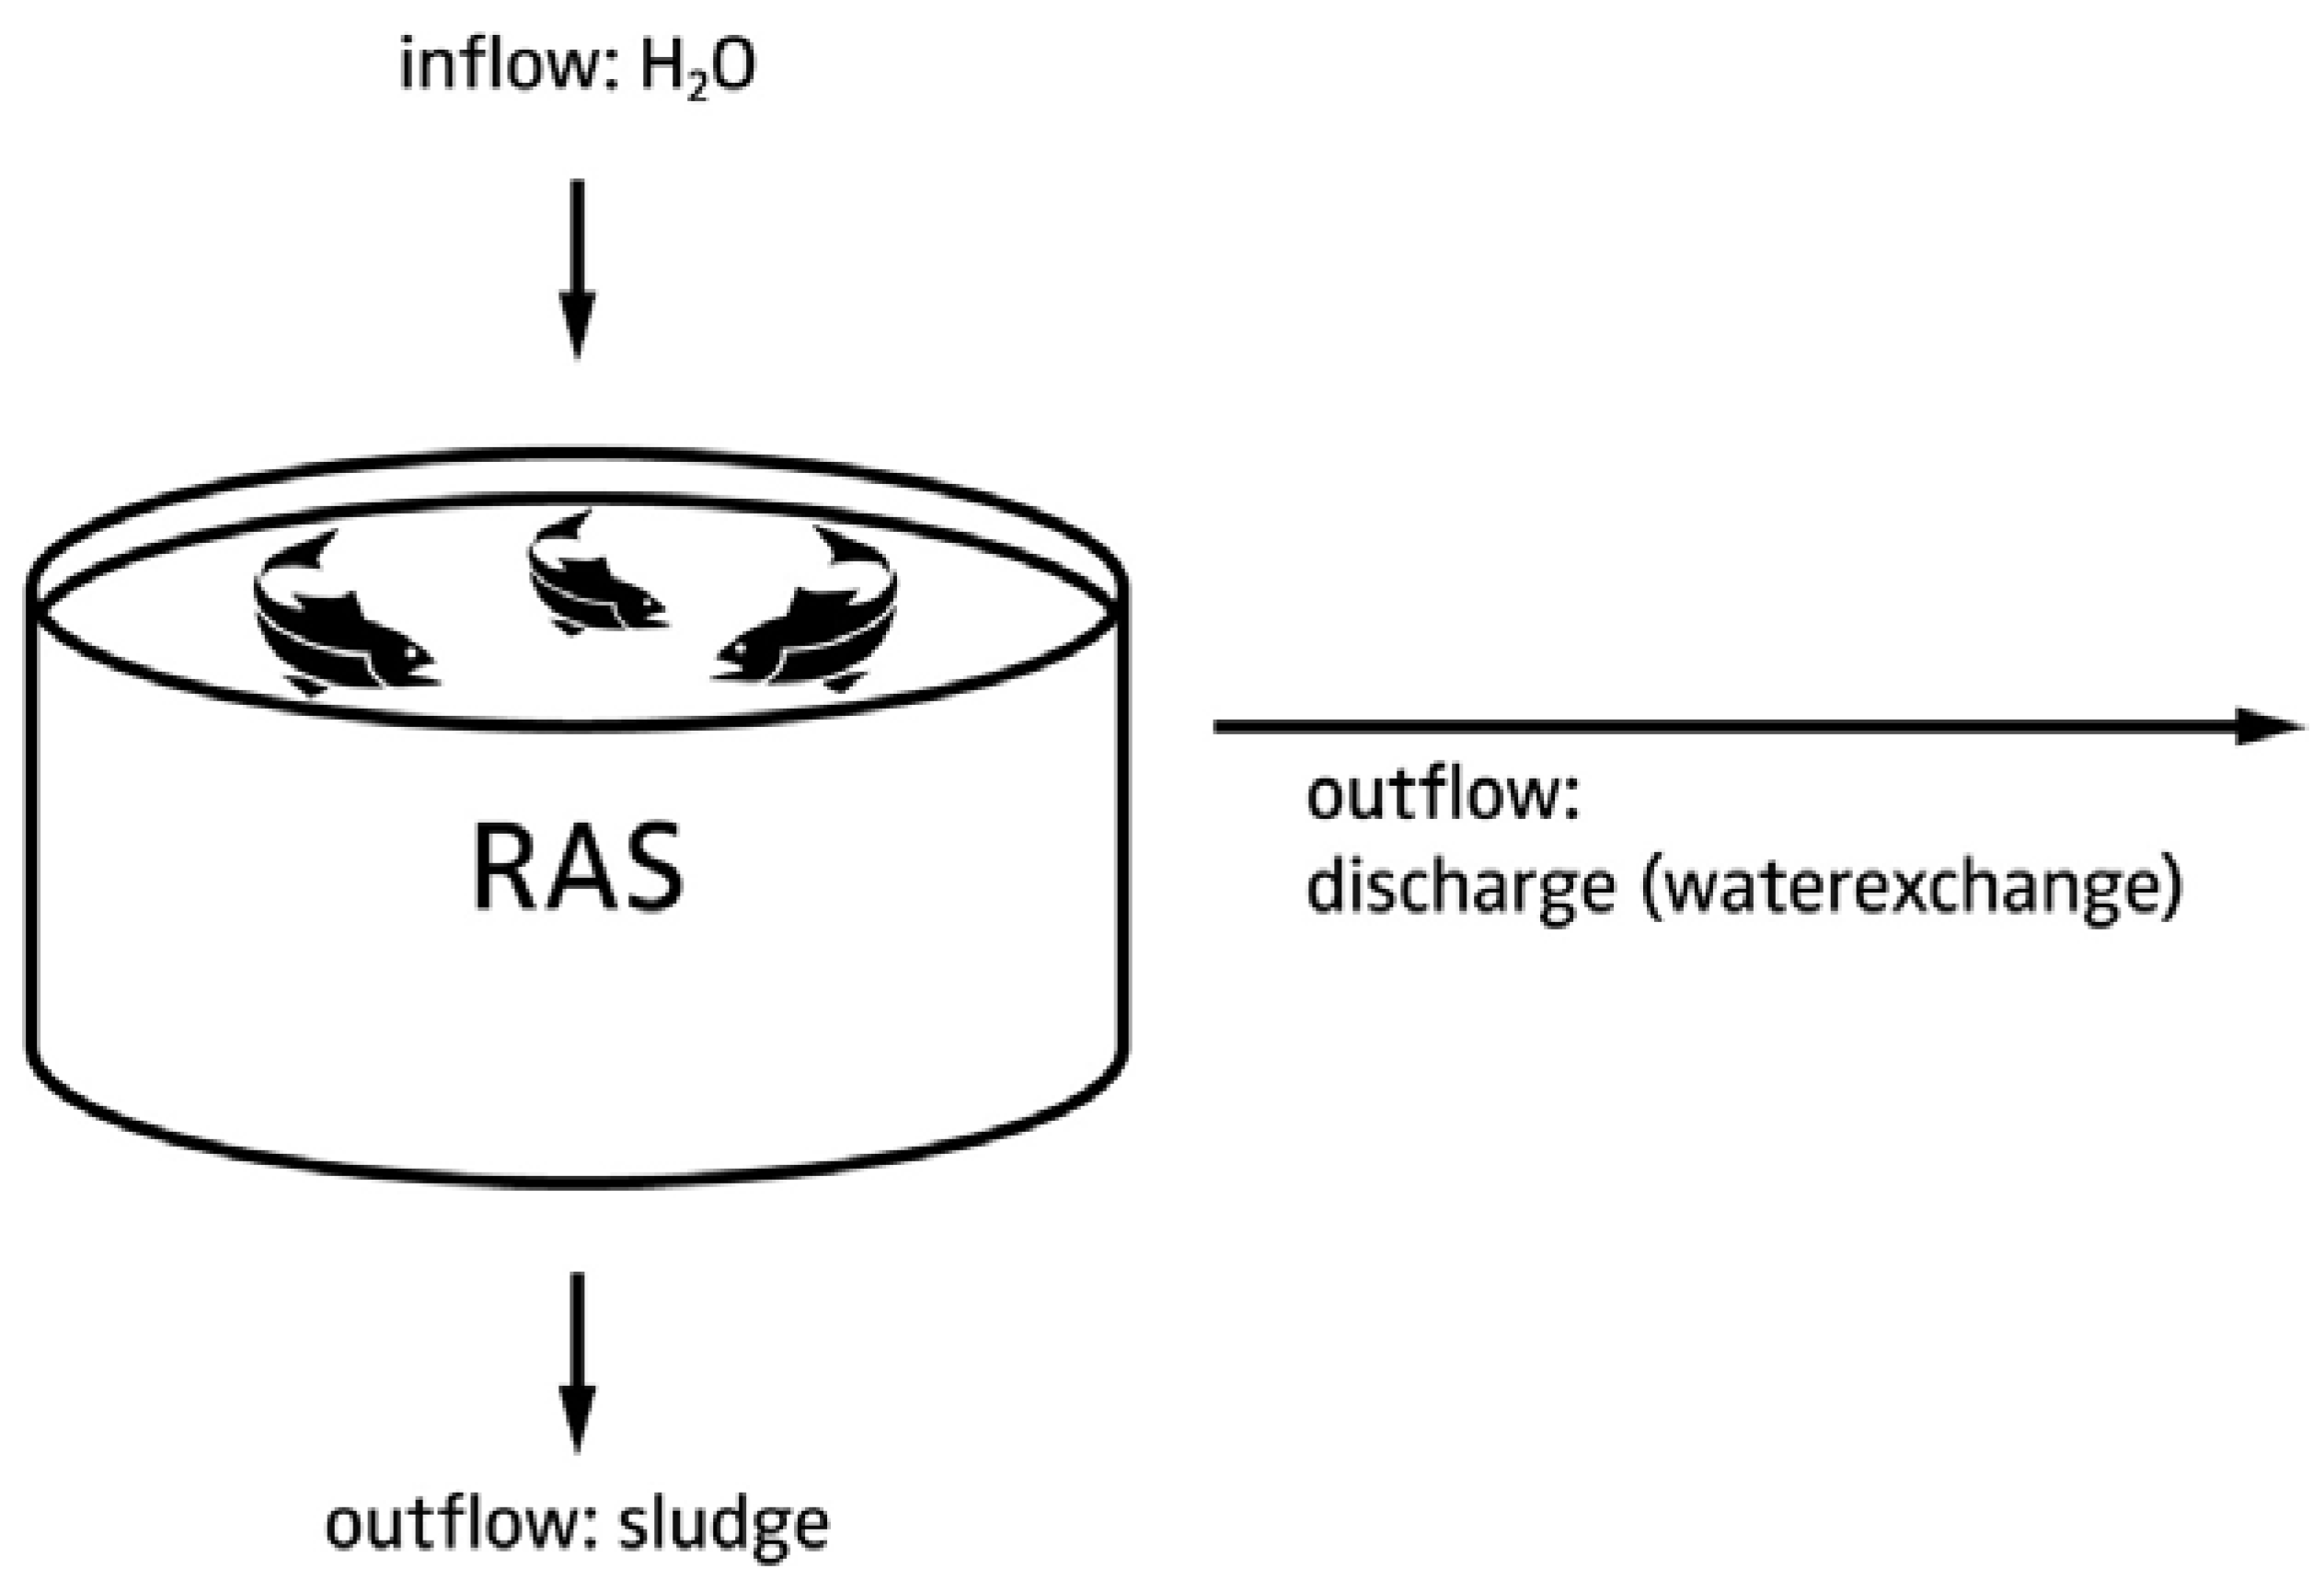
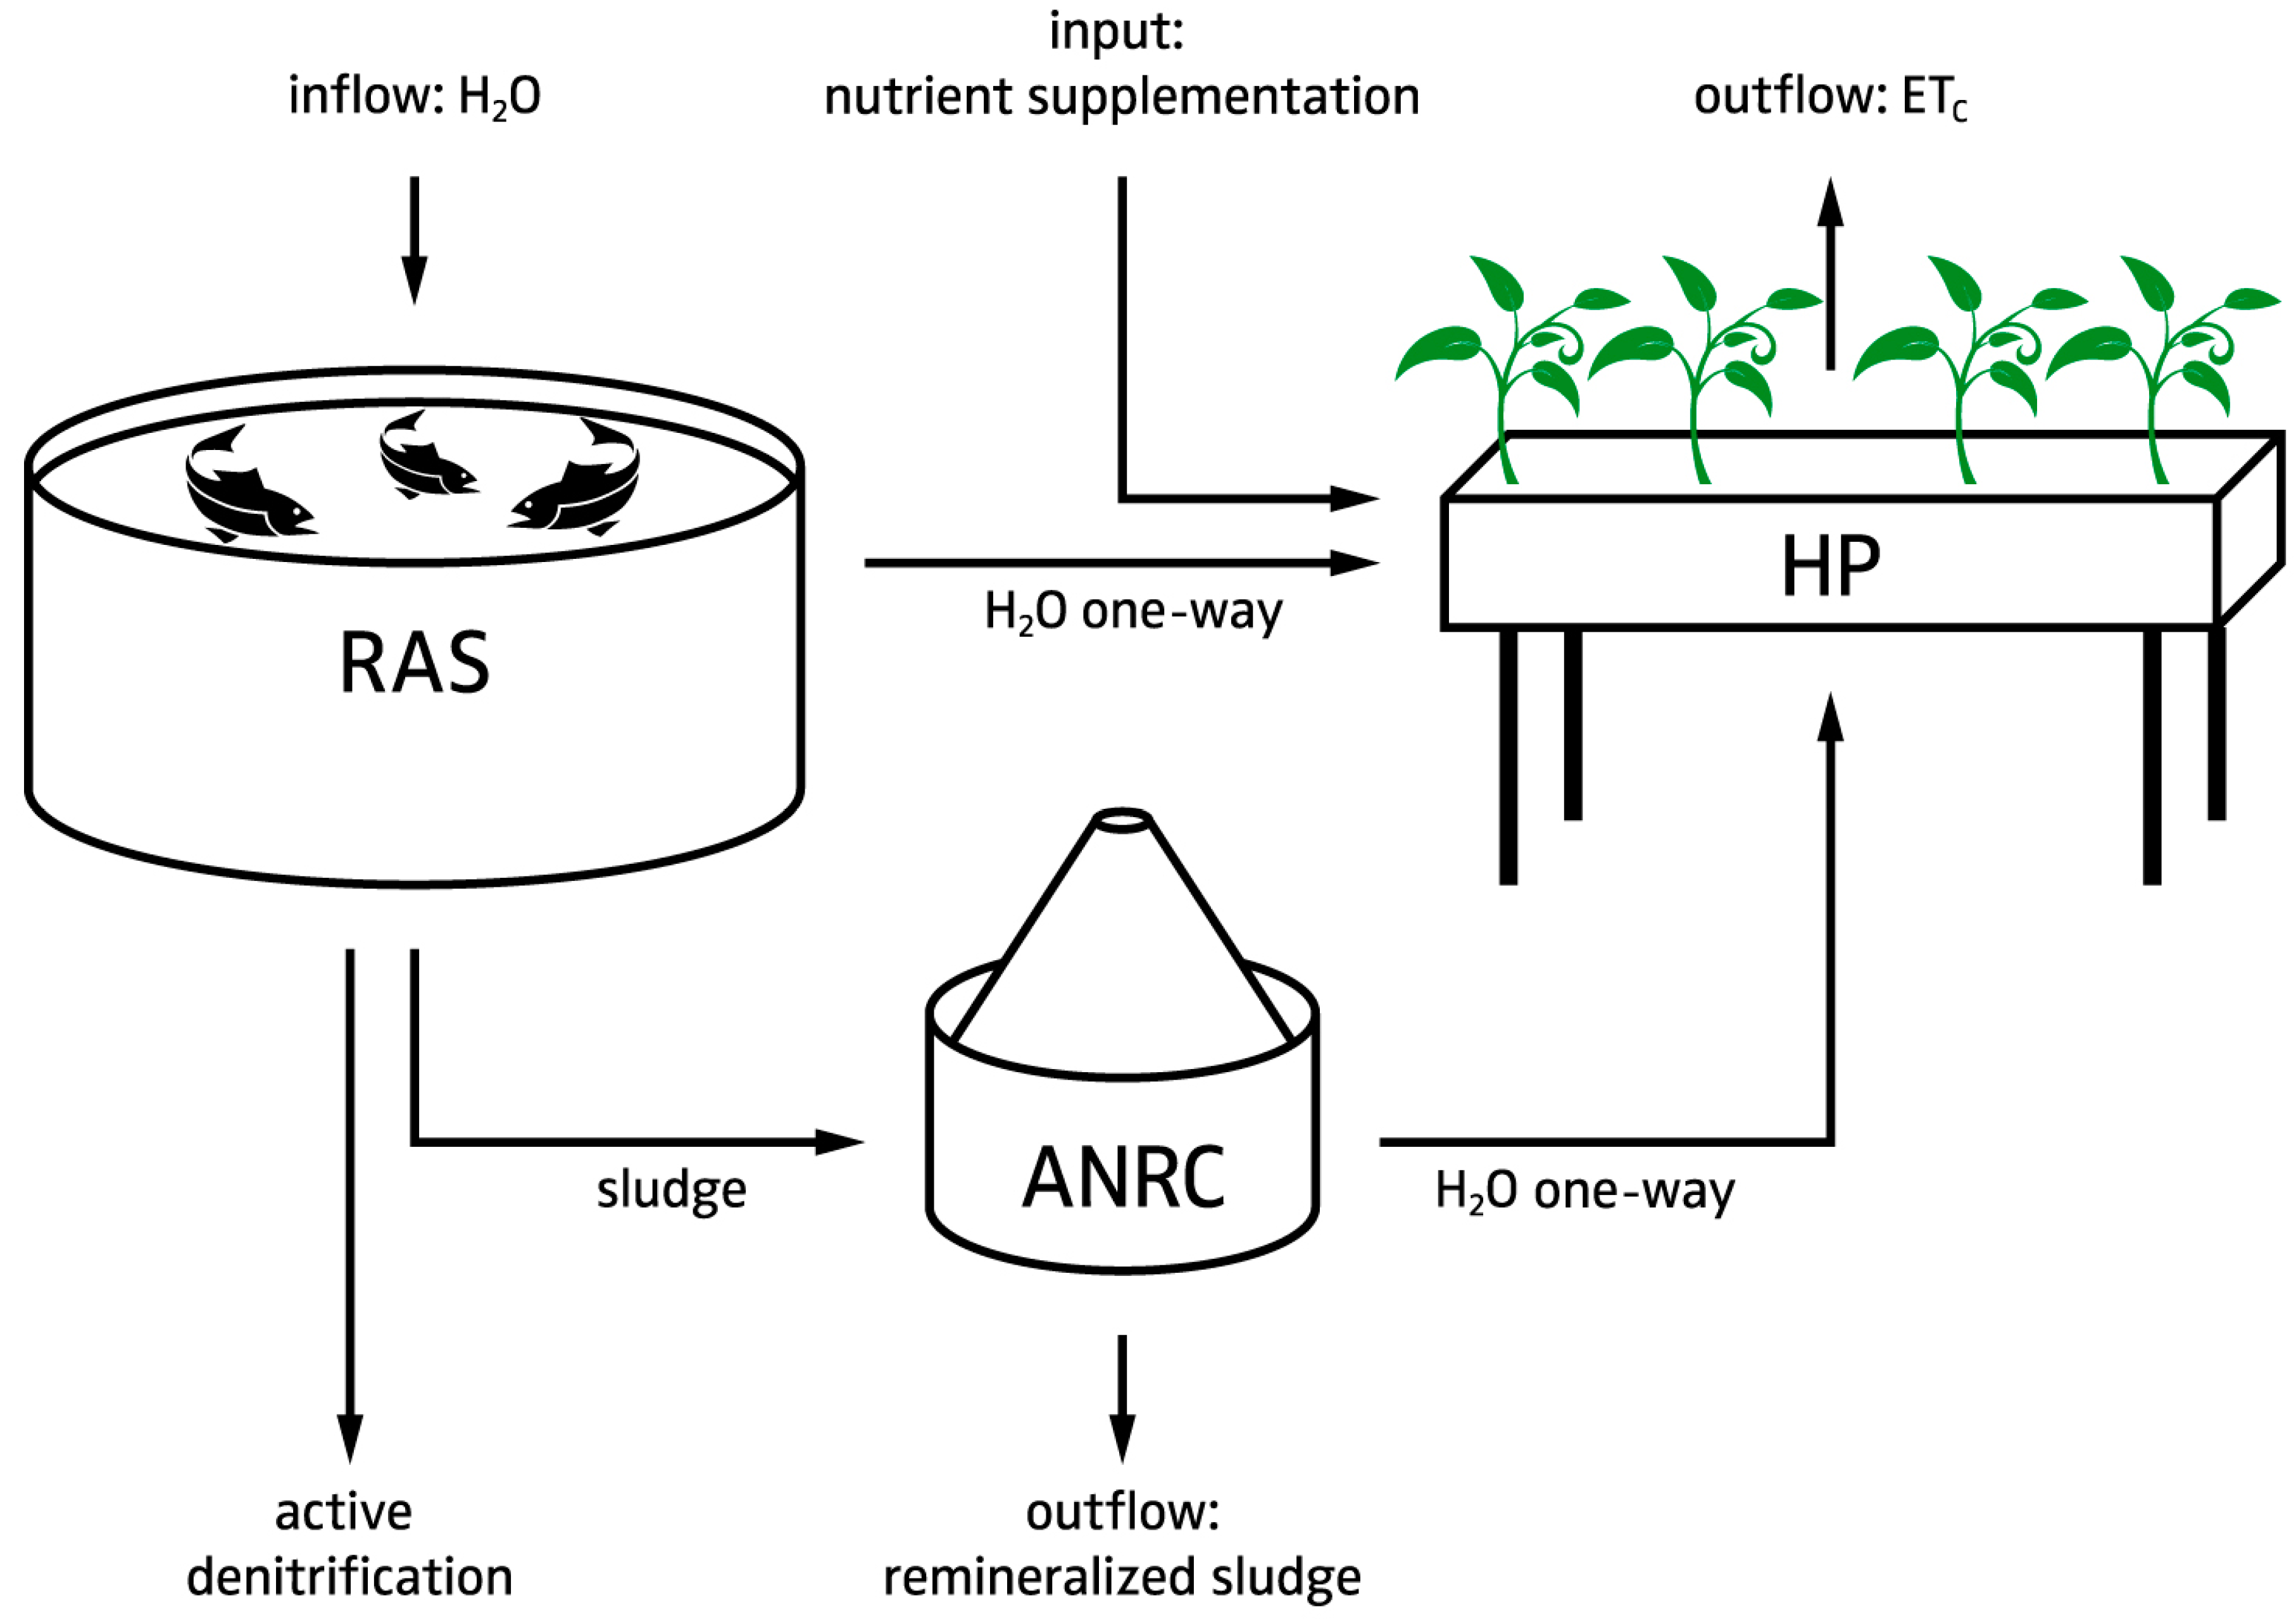
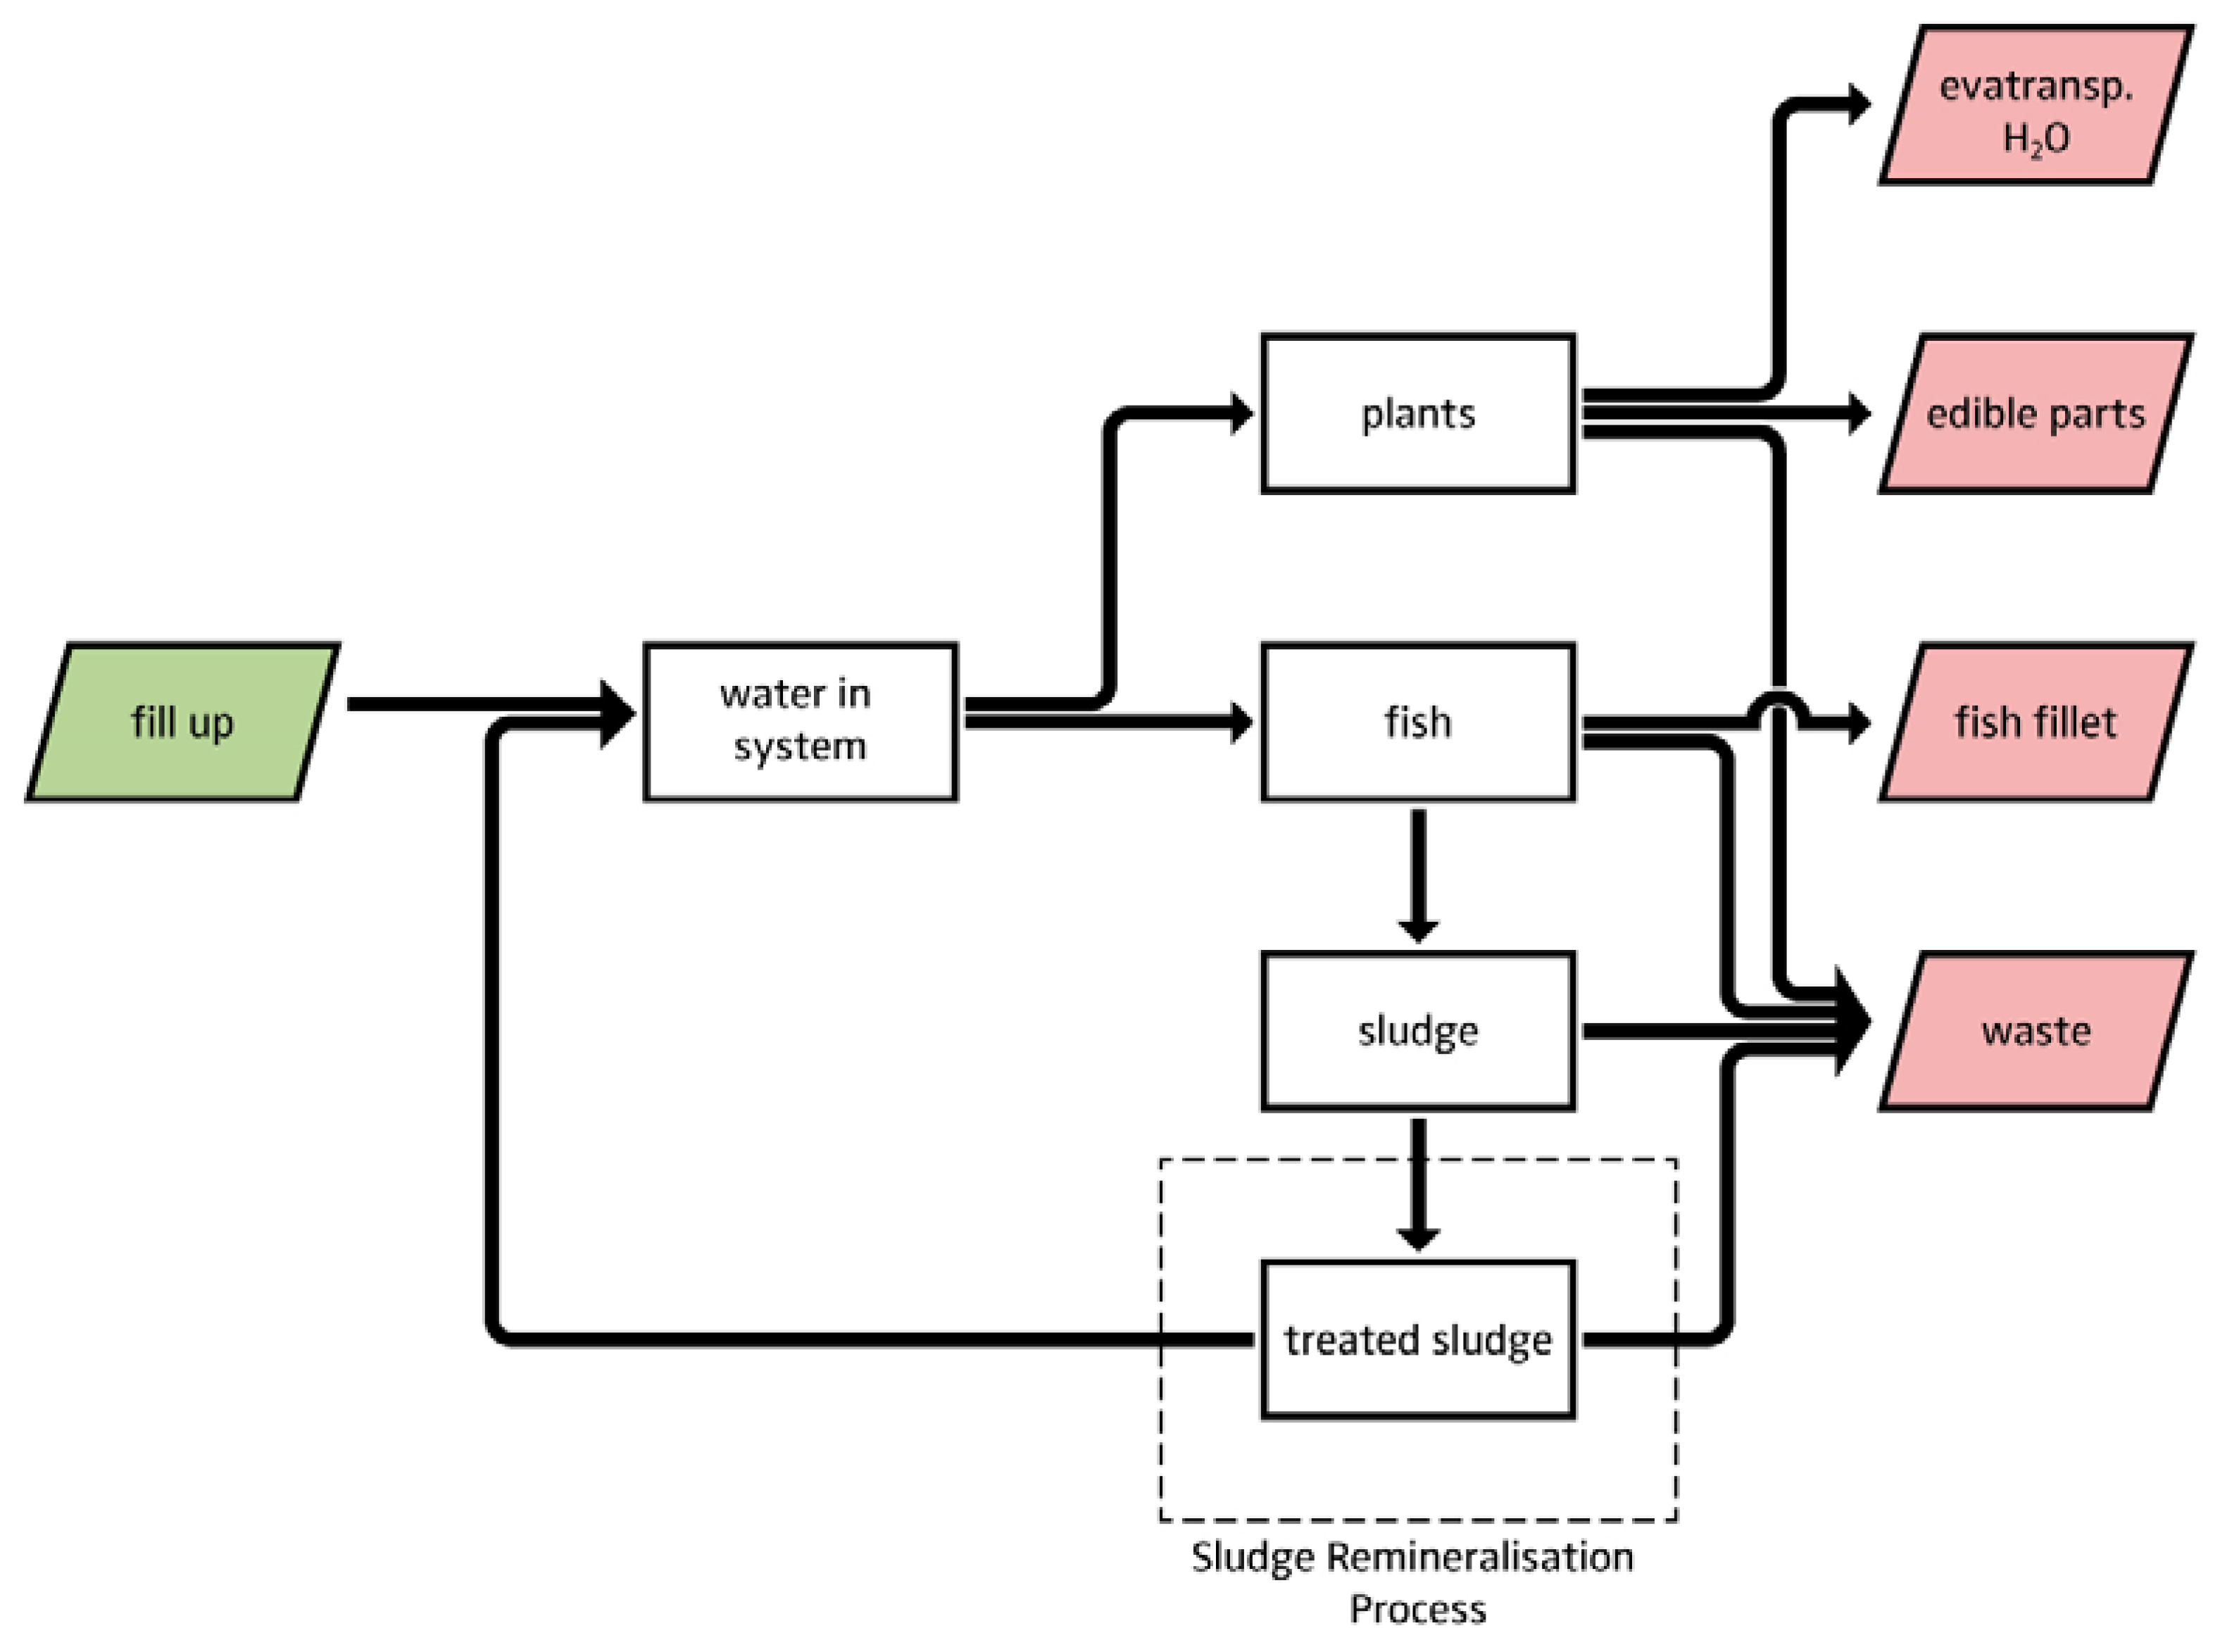
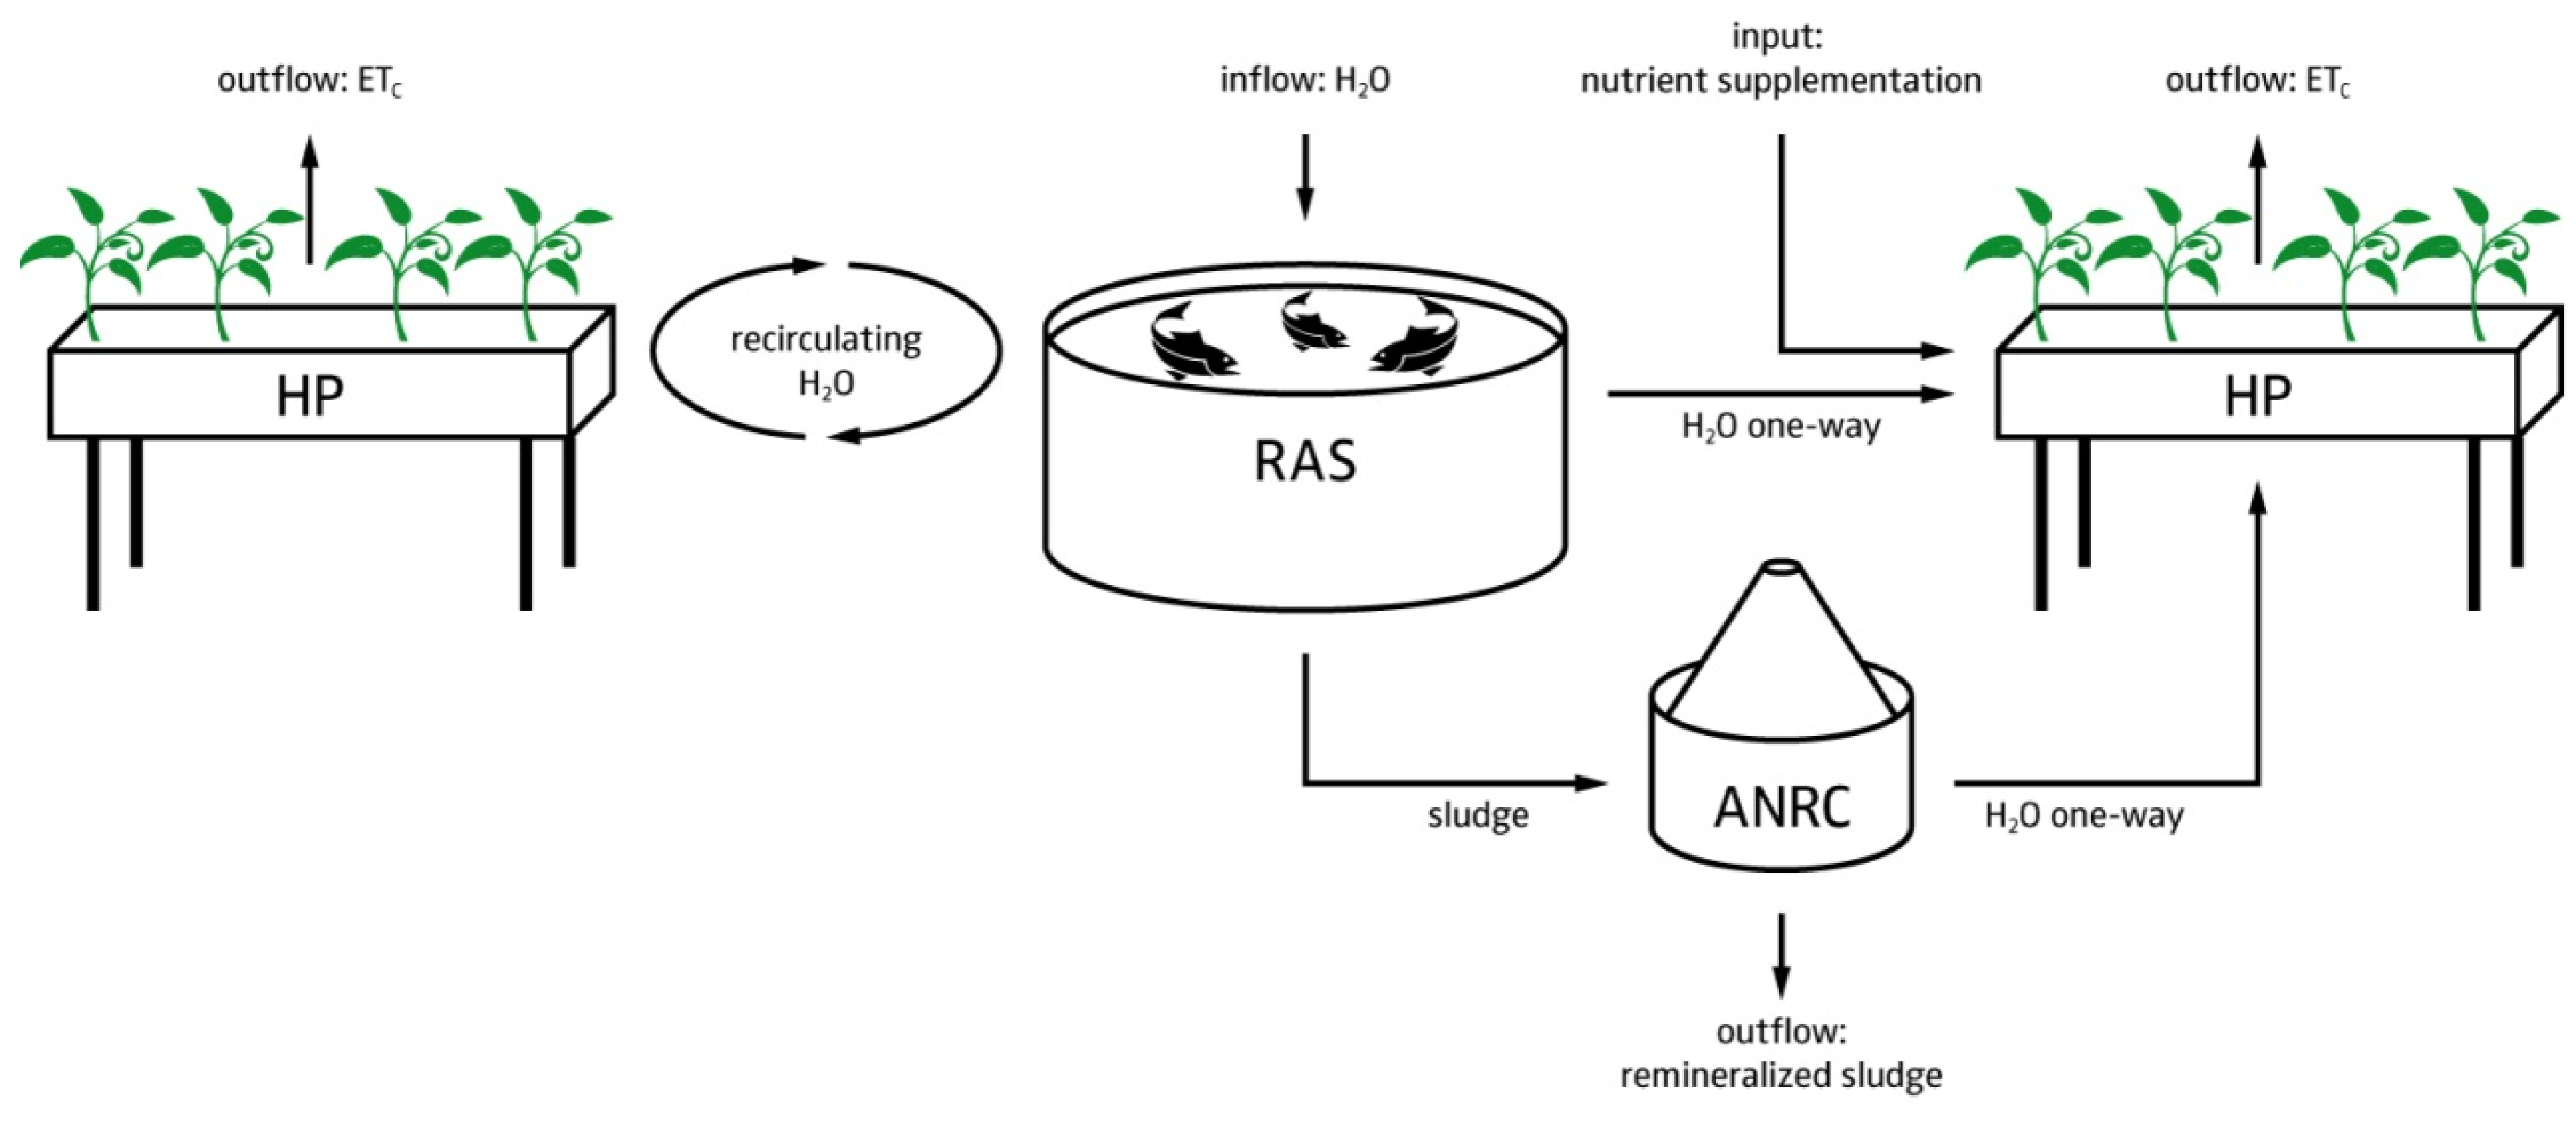
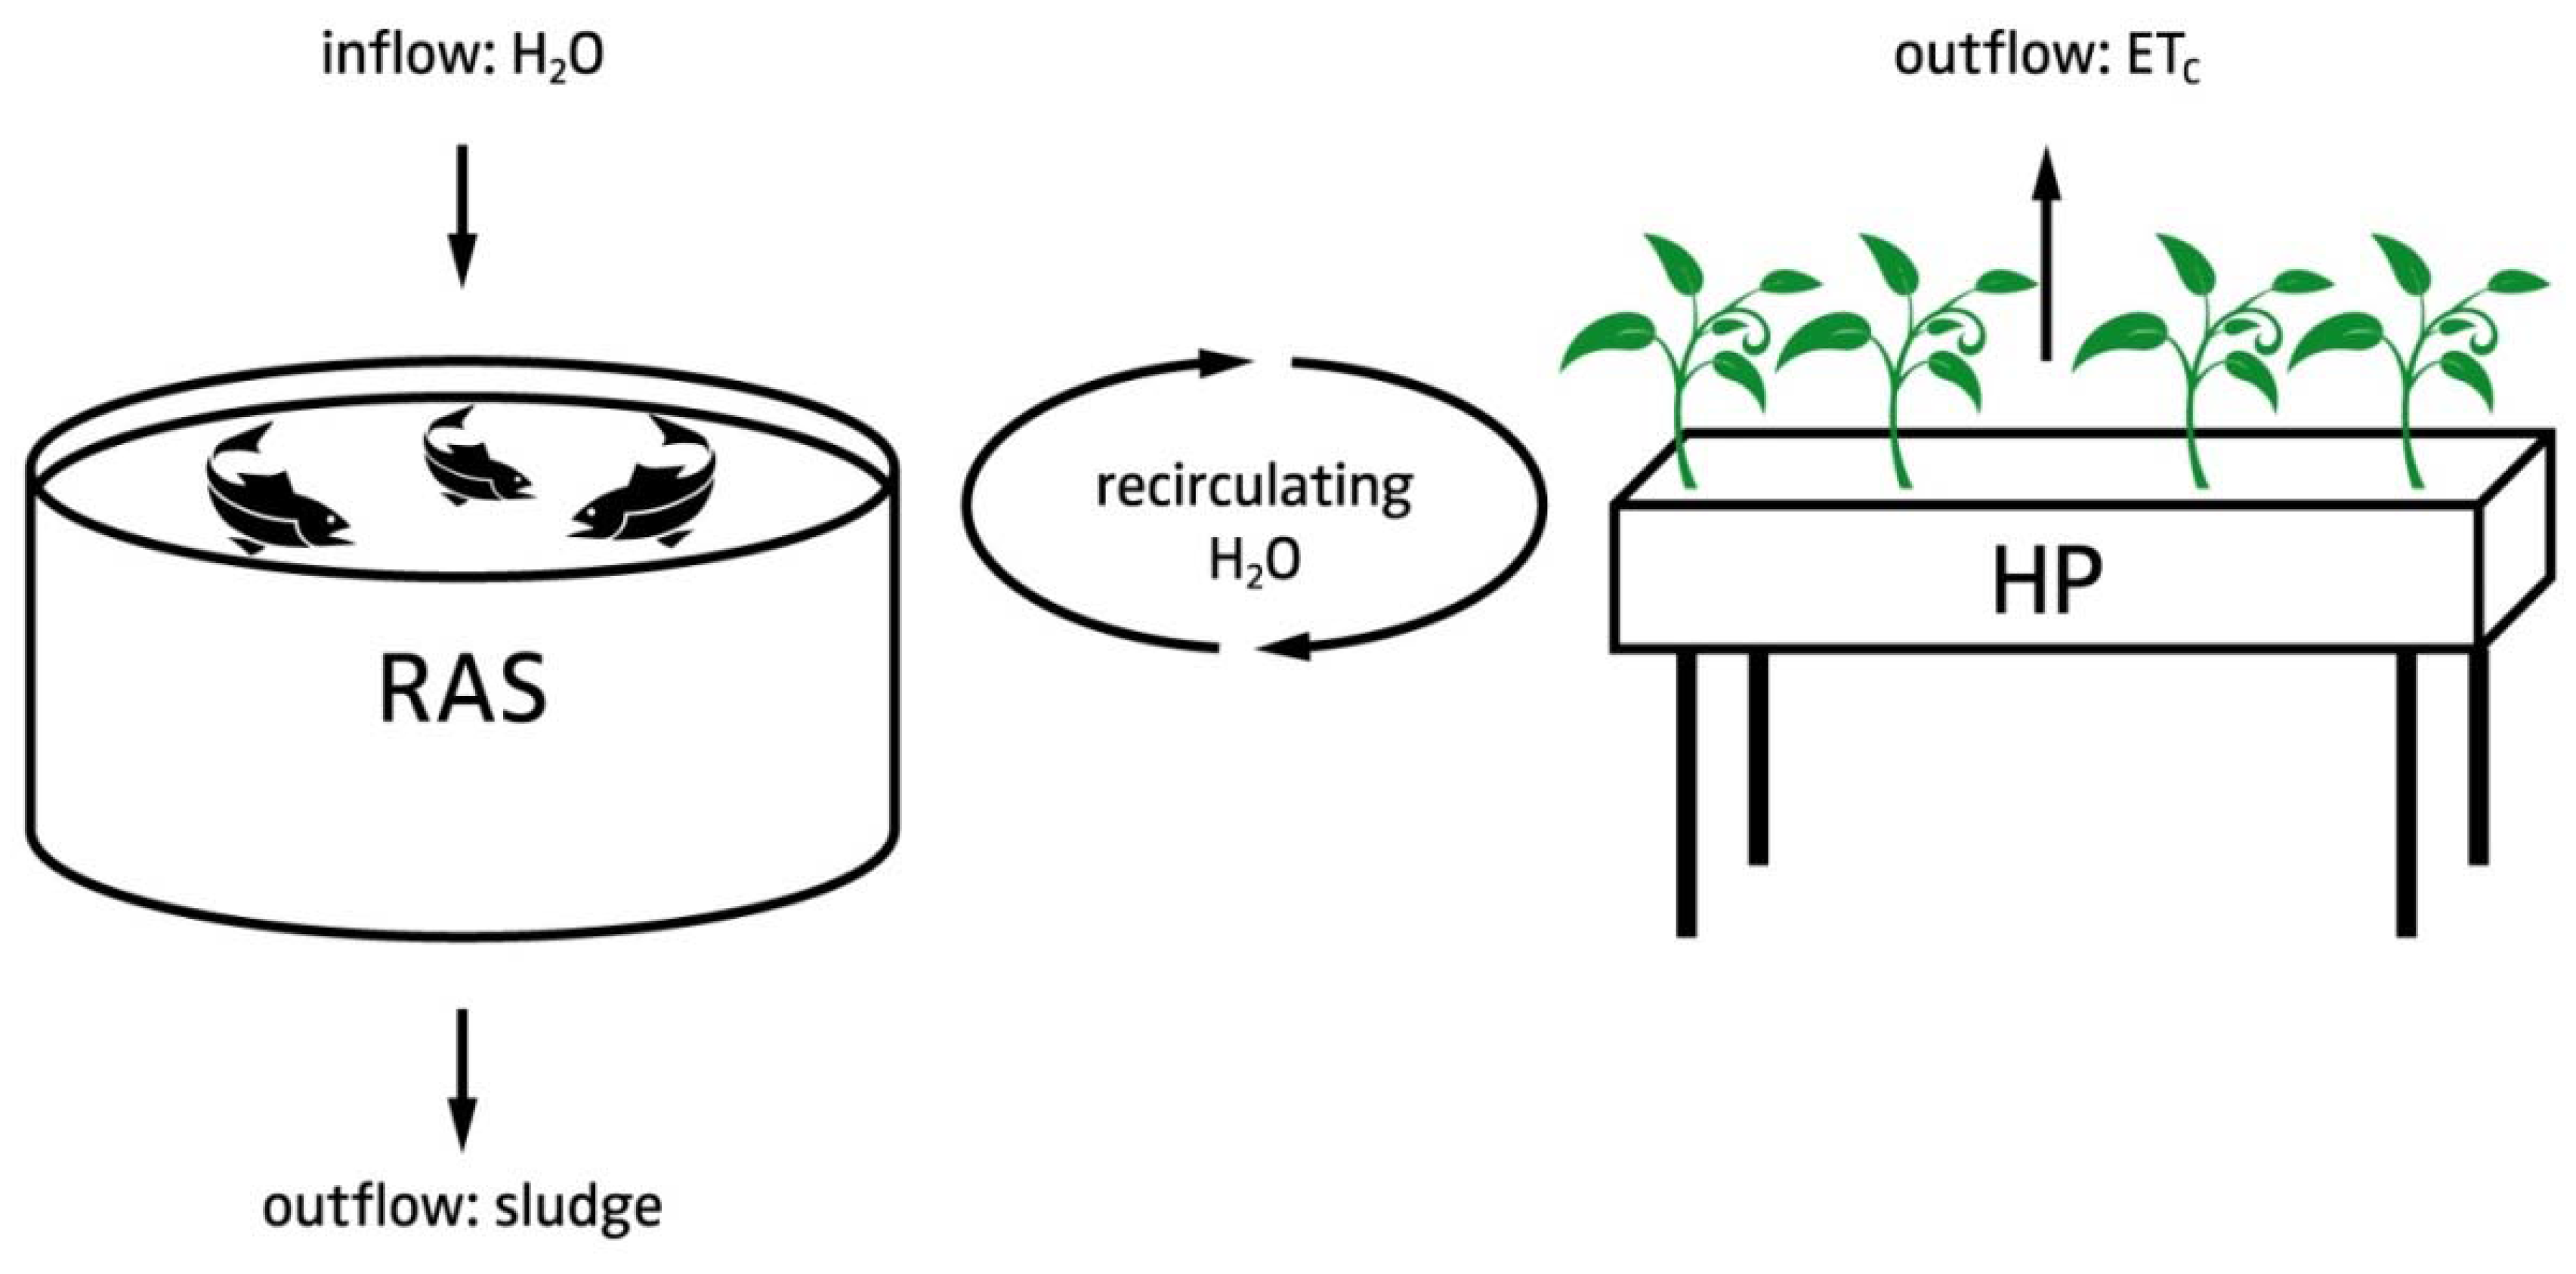
4.1.2. Hardware Layout

The schematic design of a DAPS layout is illustrated in Figure 3. It consists of three parts: (1) conventional RAS; (2) hydroponic component; and (3) ANRC. Implementing such an ANRC into an aquaponic system and following a one-way flow approach require several design considerations, which are outlined below:
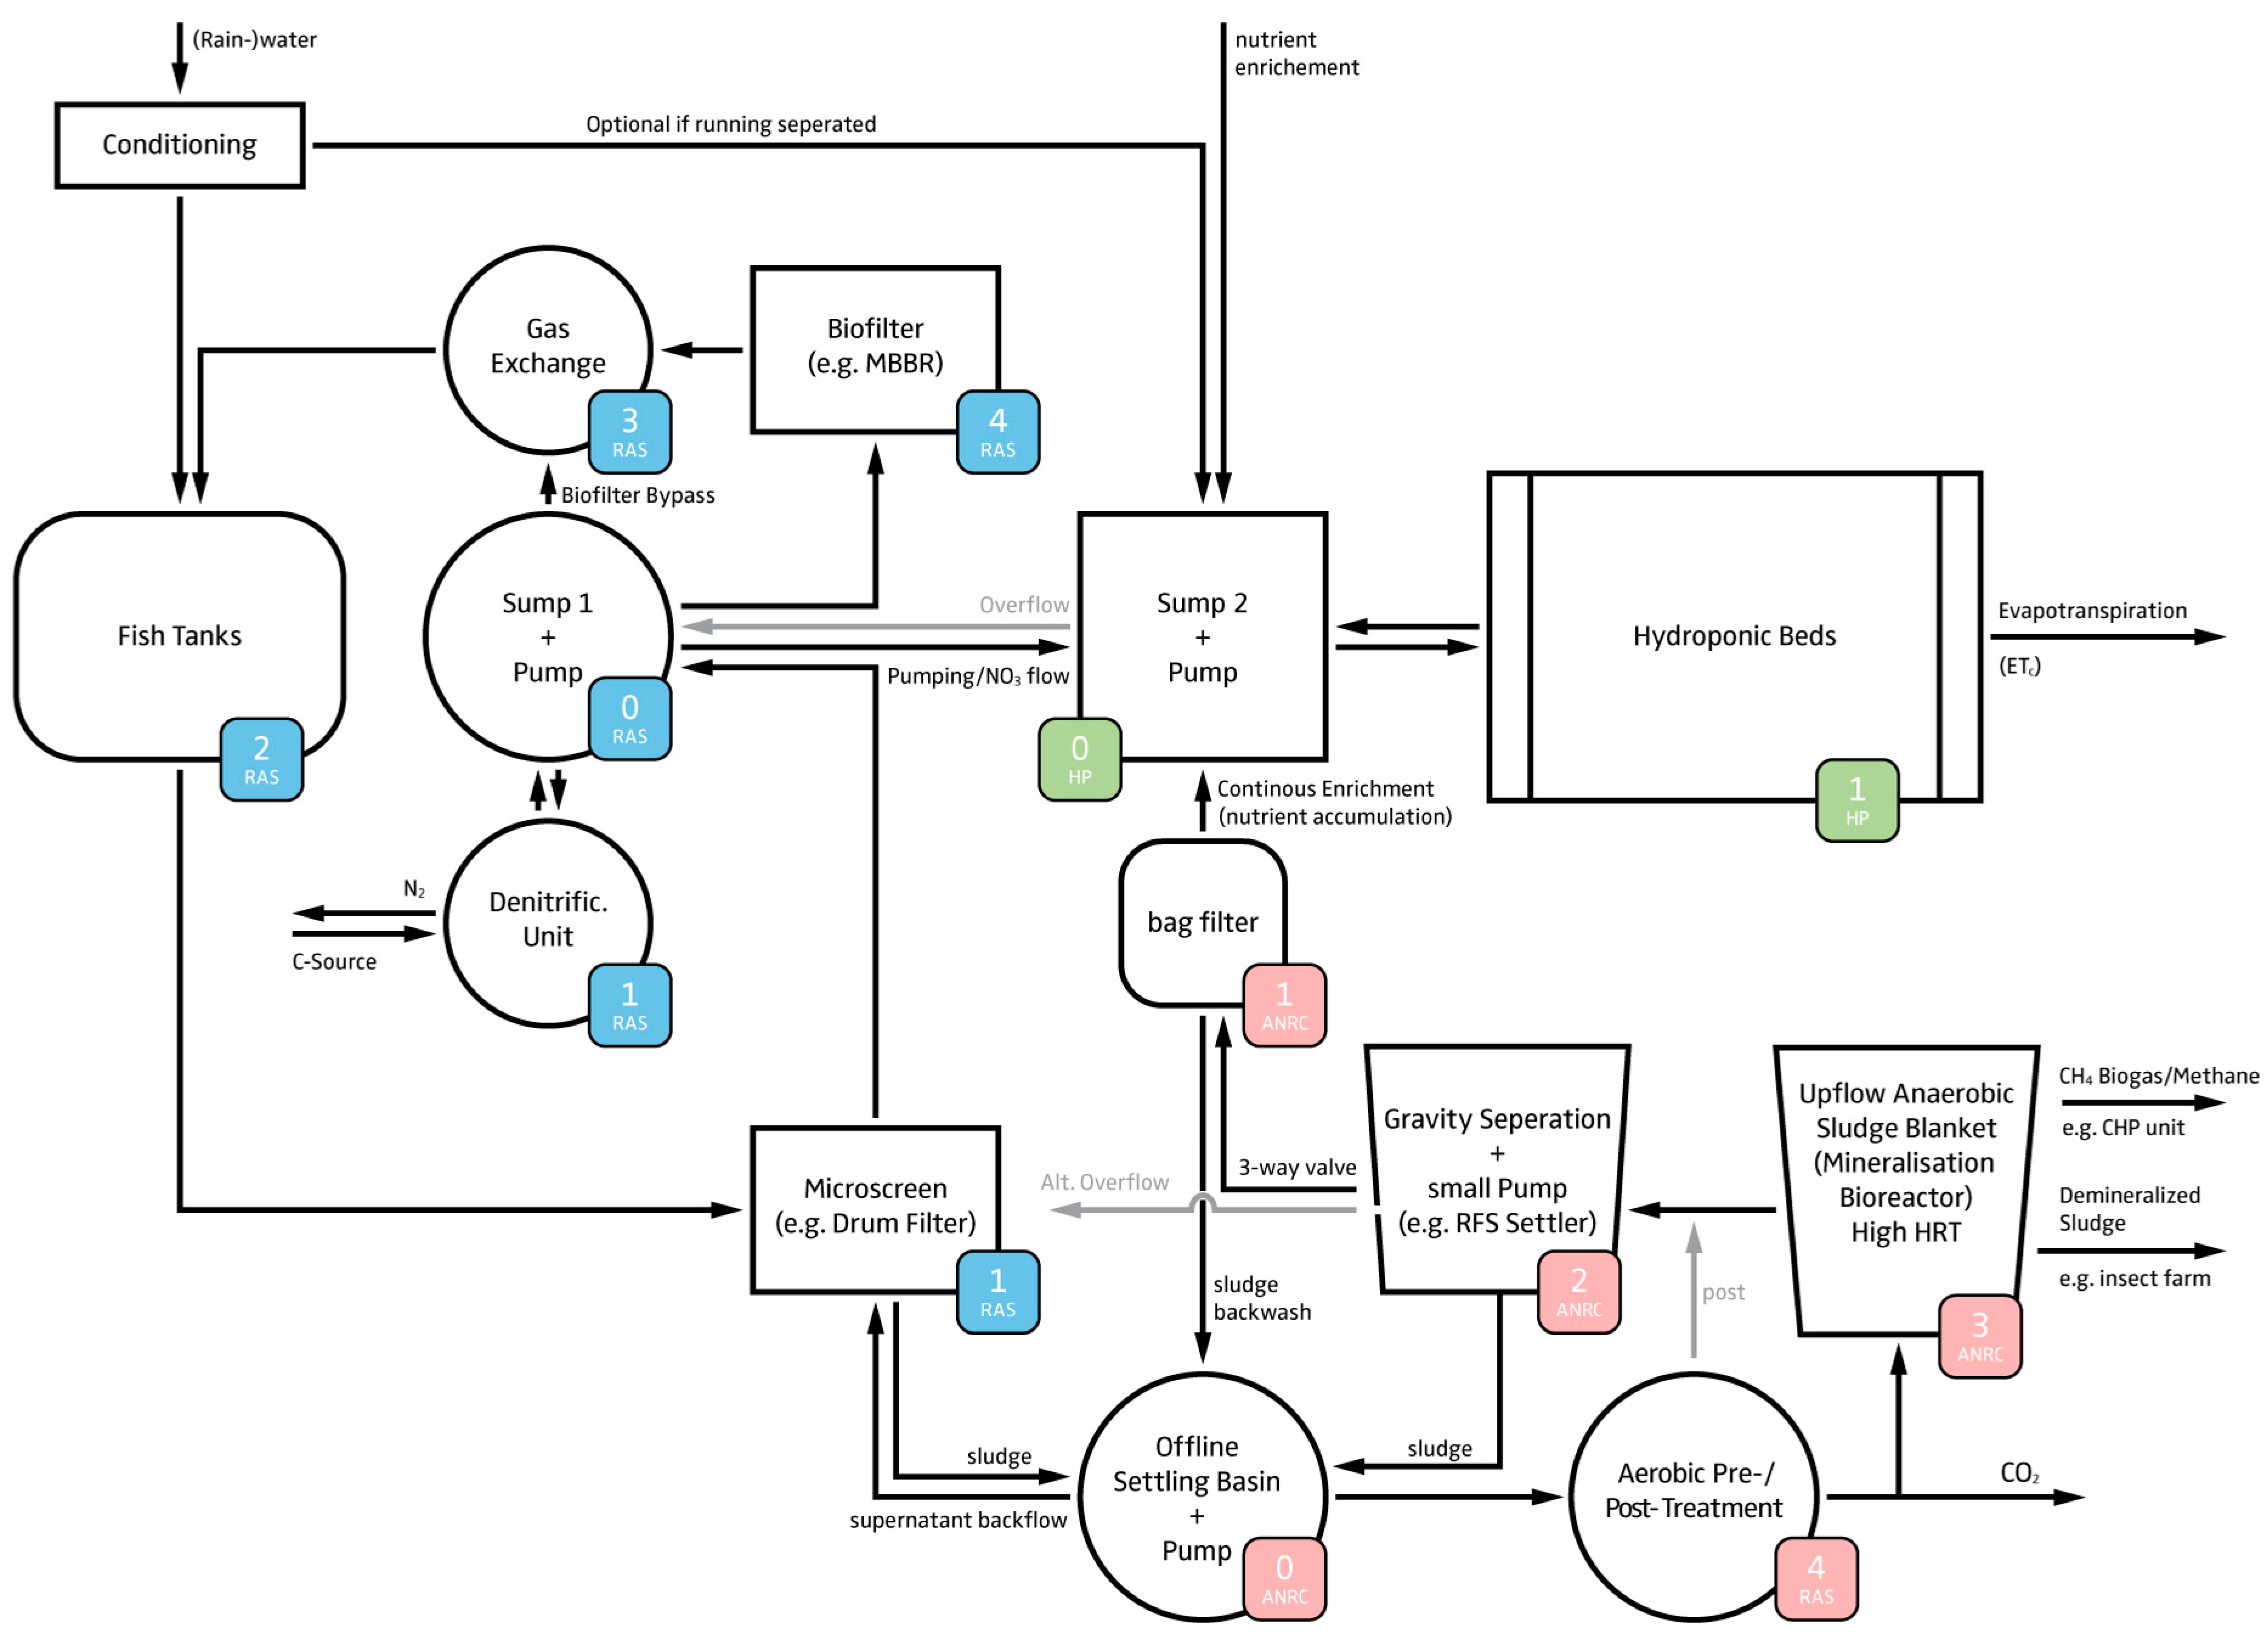
  • The RAS is intended to manage the fish sludge and to provide control over the most important water quality parameters (dissolved oxygen, TAN, suspended solids, and carbon dioxide).
  • Since UASBs have a high denitrification potential that is dependent on both HRT and SRT, a direct one way flow from RAS to the hydroponic component is required to control the nitrate dosing (i.e., provide the plants with N). This also includes a return overflow option; e.g., in case a sub-system needs to be re-coupled.
  • Sludge thickening is a necessary prerequisite for the anaerobic digestion process [15]. An offline settling tank prior to the UASB is used for this process. In practice, activated sludge denitrification reactors can be installed upstream of the UASB to use some of the carbon source to get rid of nitrate and reduce sludge volume [80]. In our case, N is preferred to be kept in the system. However, N recovery in anaerobic sludge treatment is very much HRT dependent and only marginal, when exceeding an HRT over several hours [16].
  • Hypothetically, digester effluents to RAS, even though they contain a high amount of sulfide, are not expected to affect water quality and therefore fish welfare due to dilution [17]. This also applies for the hydroponics-RAS return overflow.
  • Two mechanical filtration steps are used to minimize the TSS in the UASB effluent.
  • The hydroponic system is a hybrid system that utilizes dosing systems to manage nutrients, pH, electrical conductivity (EC), dissolved oxygen, and redox potential to maintain acceptable nutrient levels with precision.
  • The outflow from both the ANRC and RAS, and the utilized water in the hydroponic component are congruent. Consequently, the utilized water in the hydroponic component, and thus the replenishment of water to the fish tanks must be high enough to avoid accumulation of nutrients in the RAS.
  • The ANRC can be complemented with an aerobic pre- or post-treatment, as better remineralization performance can be assumed, and chemical oxygen demand (COD) reduction has been observed [81]. Yet, it must be noted that the drawback of an additional aerobic step is additional production of biomass (i.e., bacteria growth) that consumes part of the available nutrients. Whether the aerobic treatment proceeds or follows the anaerobic treatment depends on whether one prefers to increase the carbon dioxide concentration in the greenhouse (pre) or use the anaerobic digester as a biogas producing device (post). Even though the aerobic treatment most likely provides additional advantages (e.g., H2S reduction), it is no part of our software calculations. For the sake of completeness, we nonetheless added it to this scheme.
  • The produced energy in form of electricity and heat, gained through CH4 combustion, can be returned to the system. This combustion also reduces greenhouse gas emissions. The combustion’s products (i.e., CO2 and H2O) can be lead back to the system as clean water and CO2 (greenhouse required) in order to enhance plant growth.

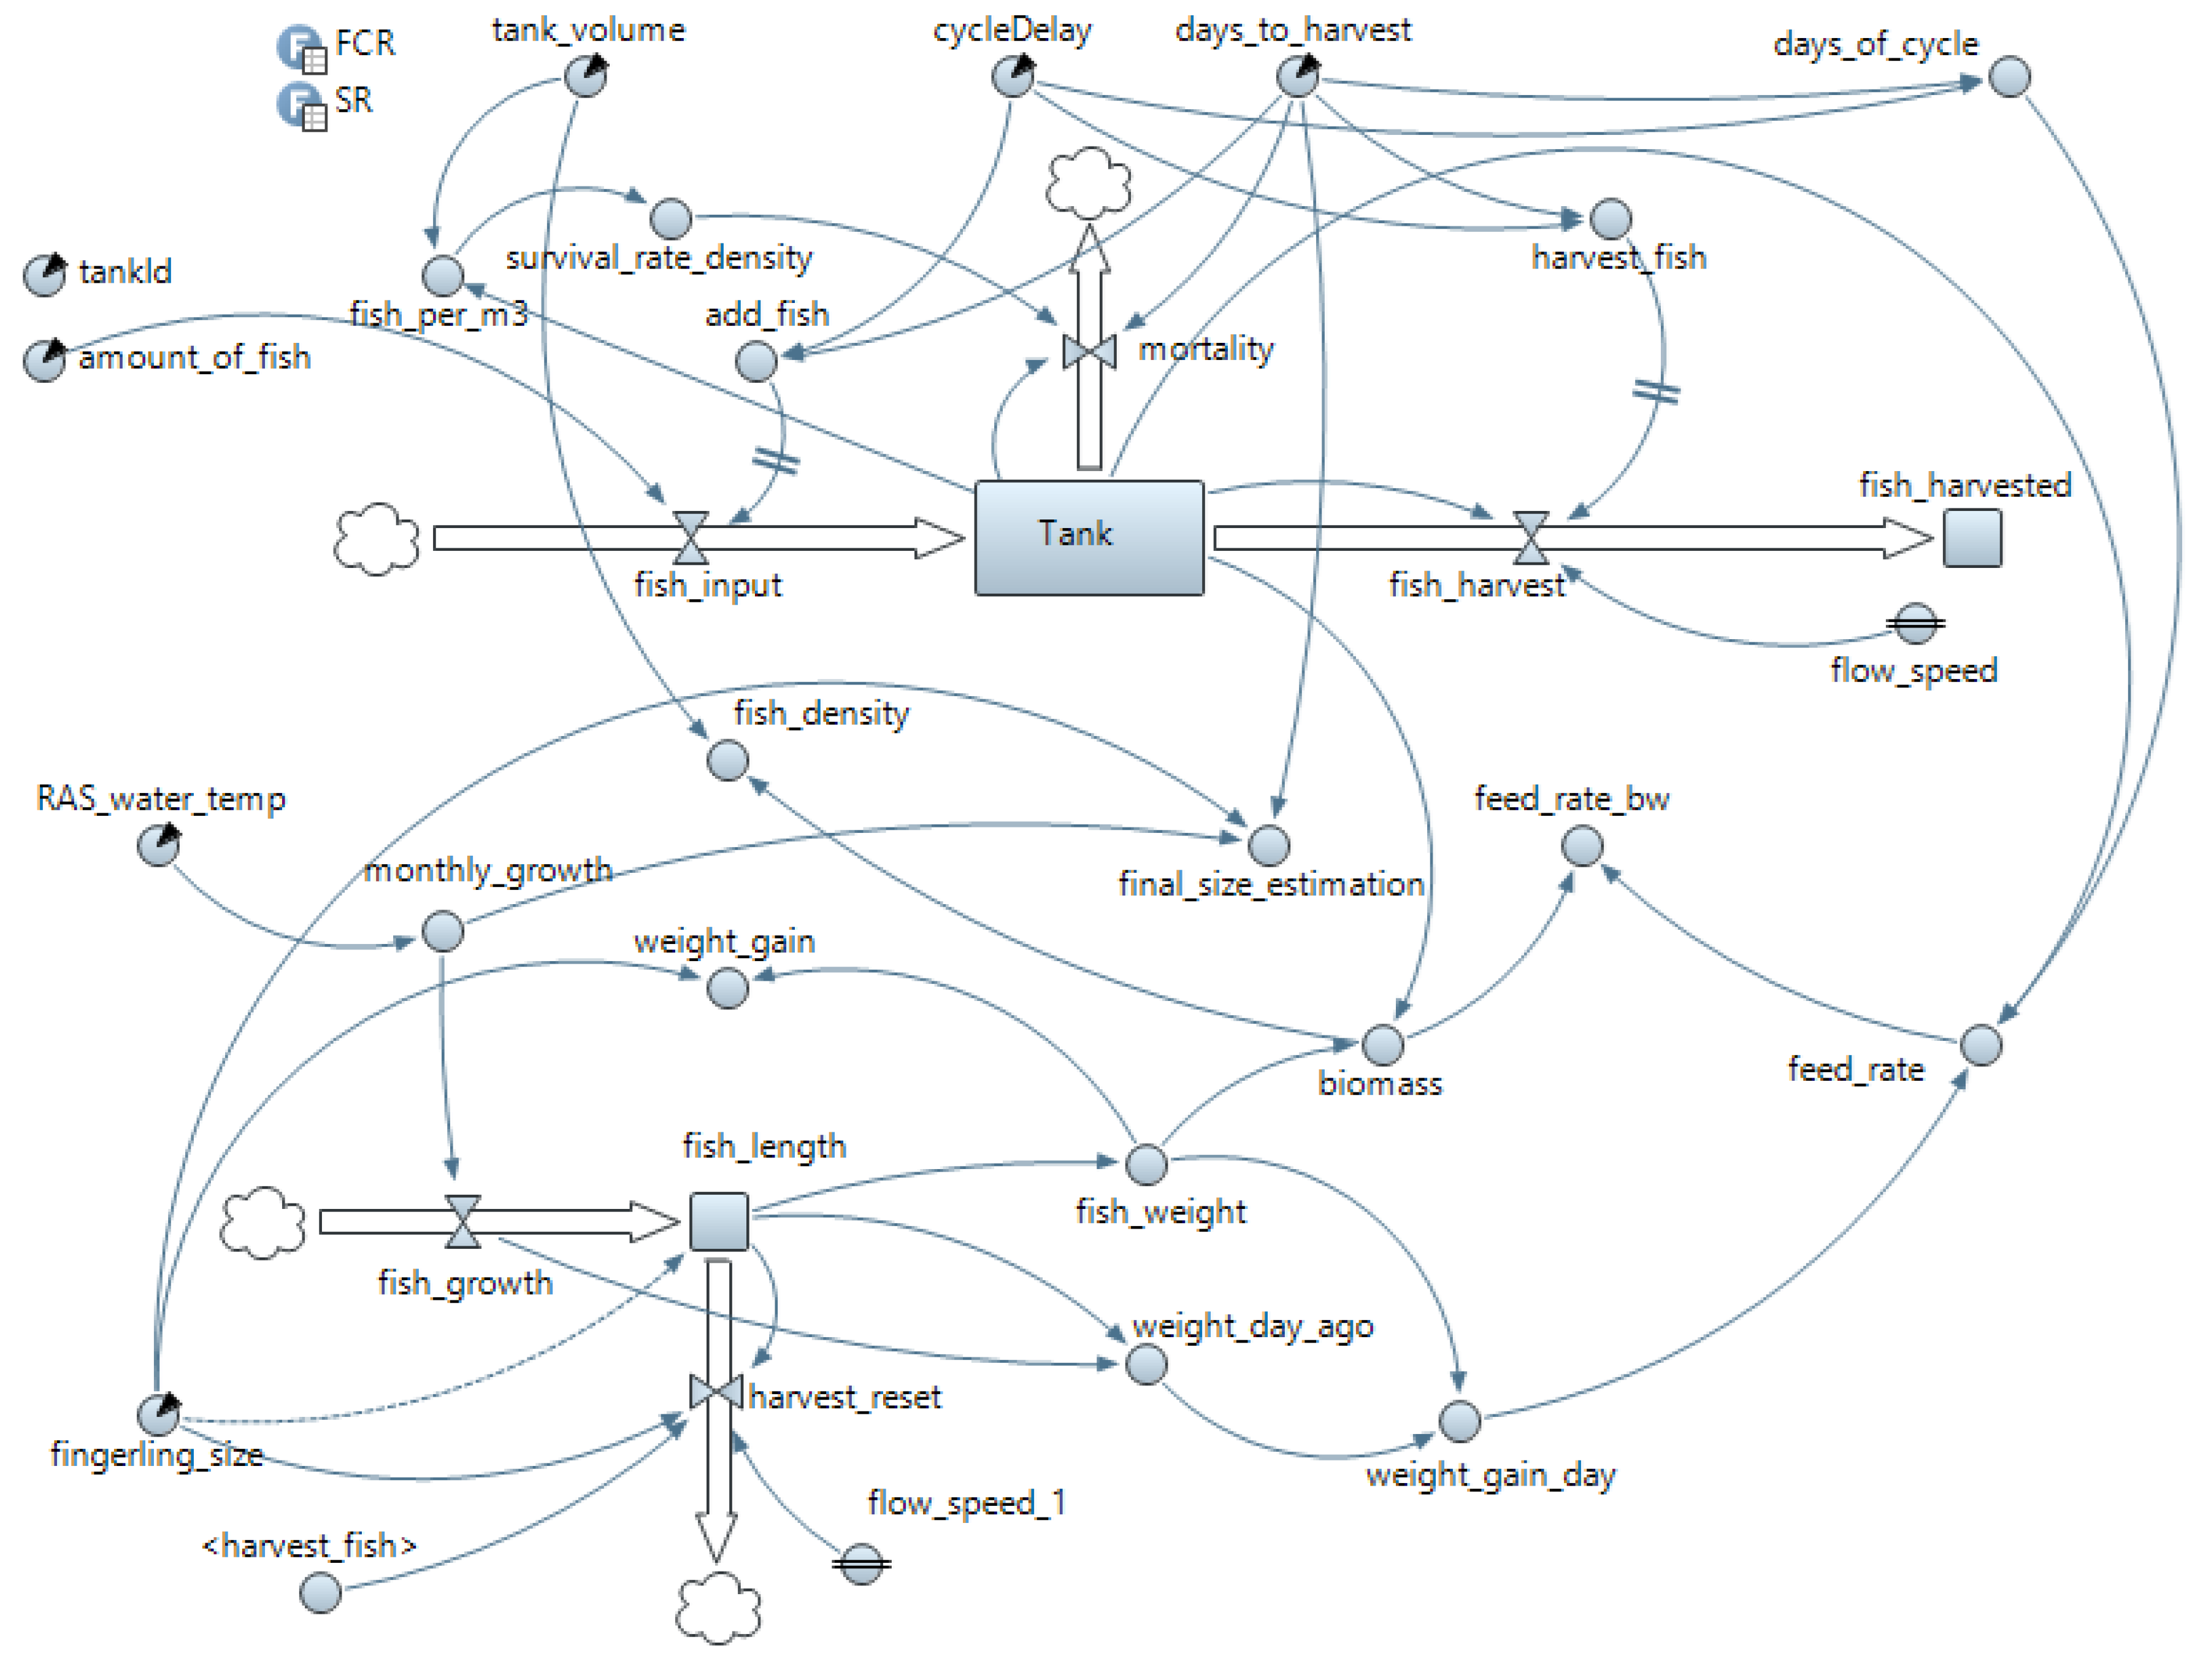
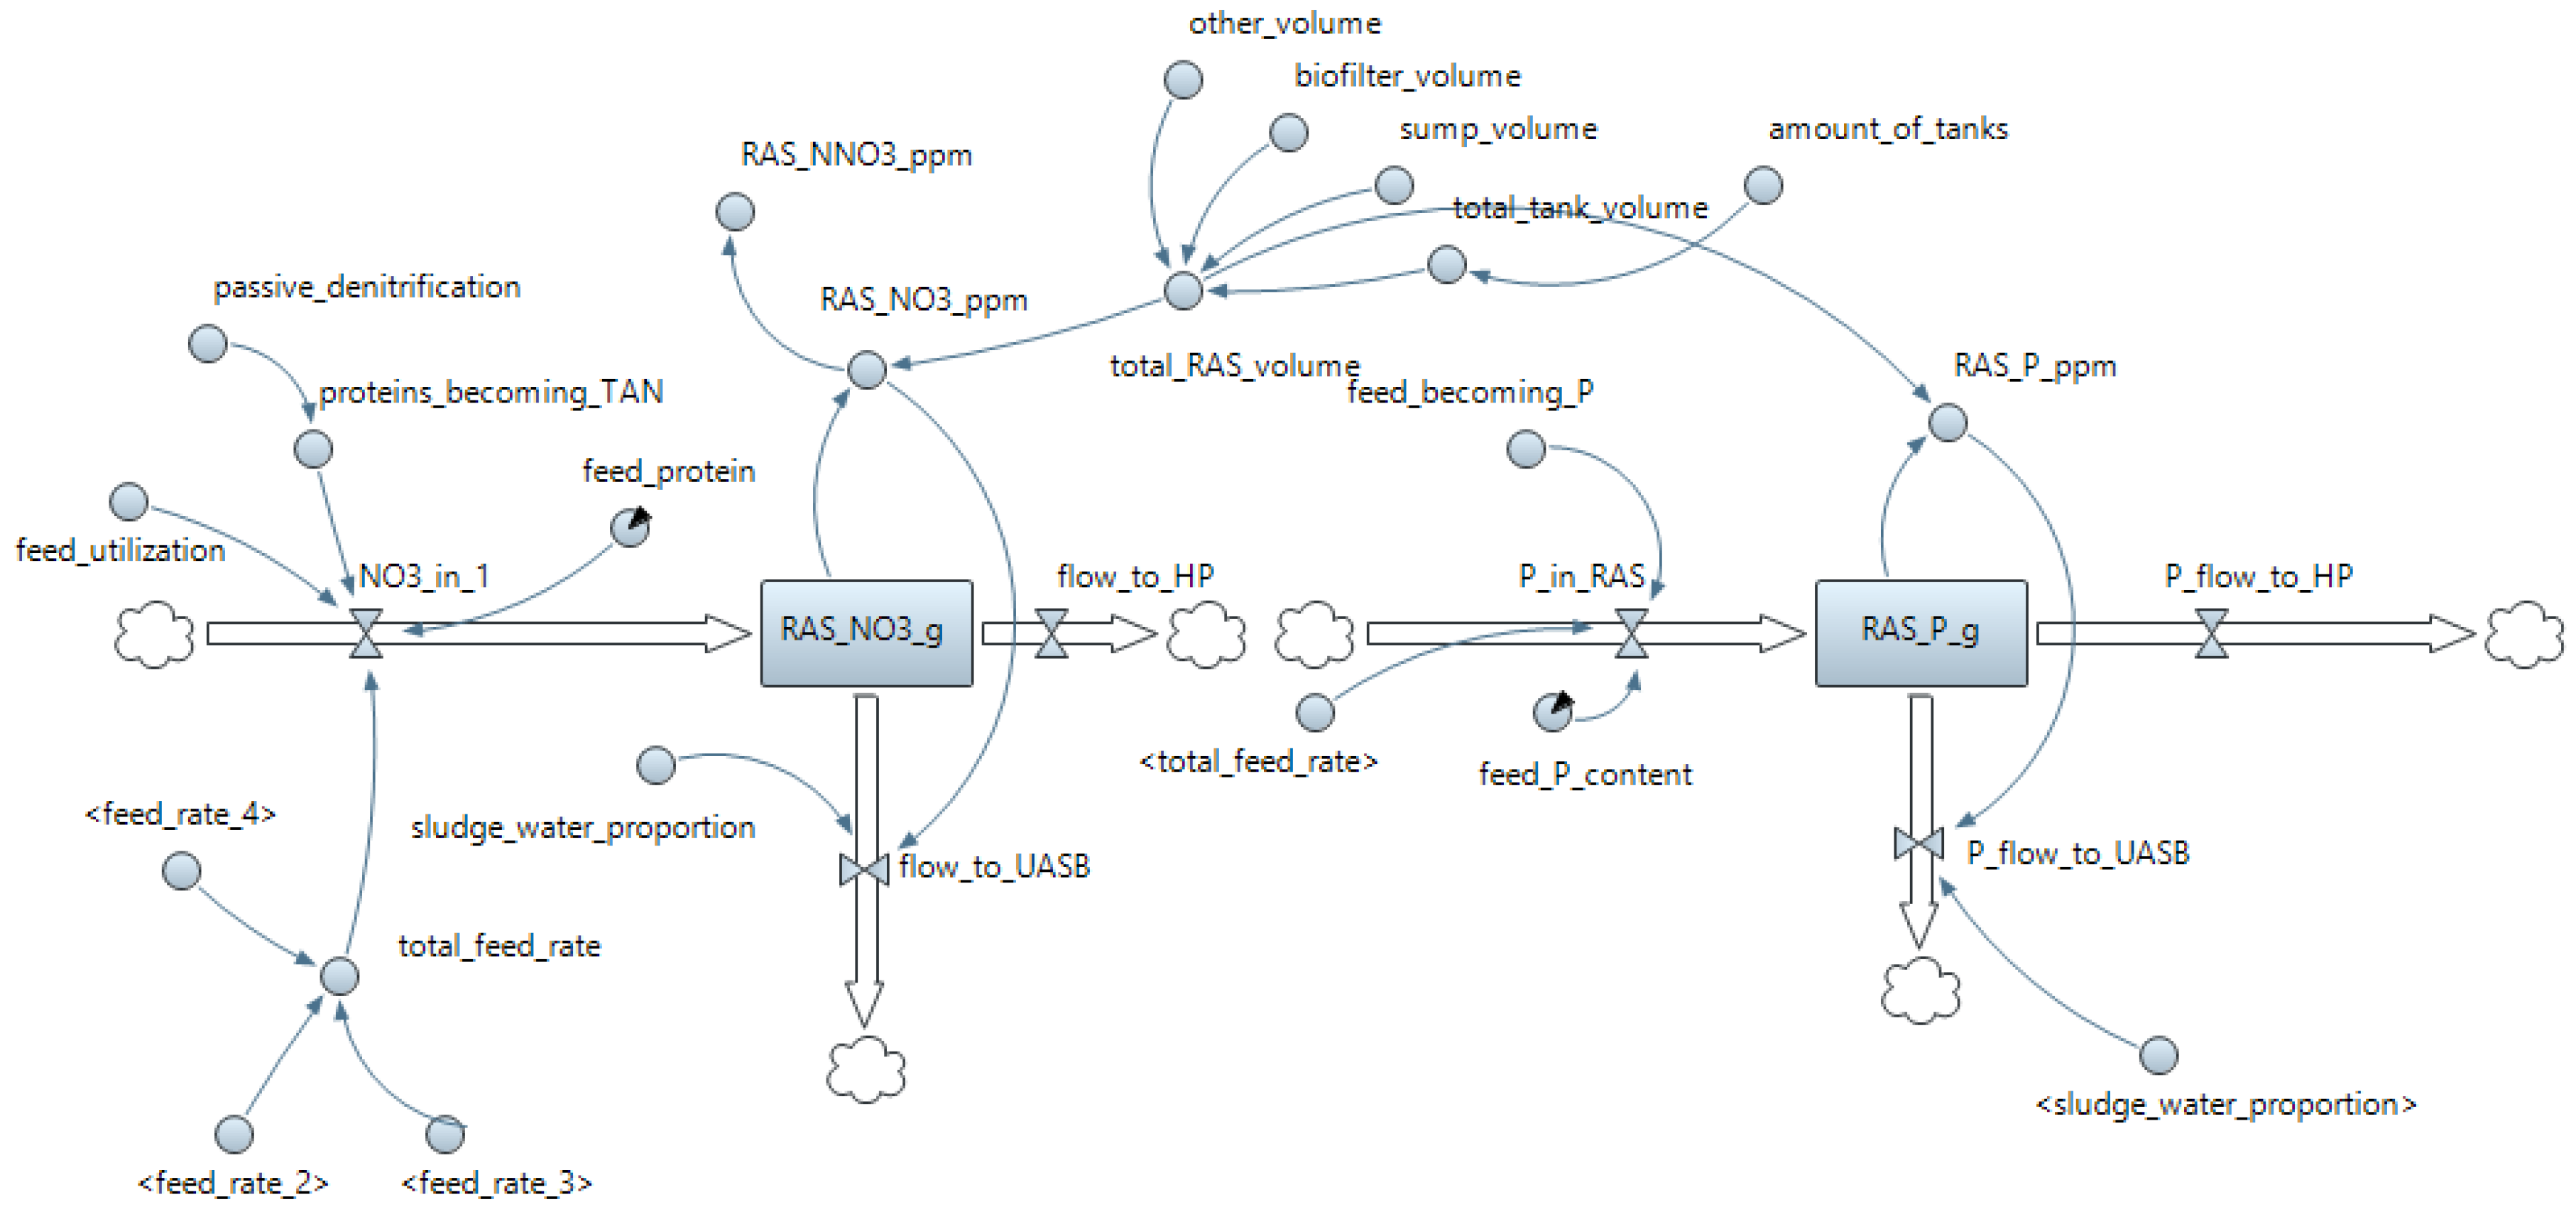
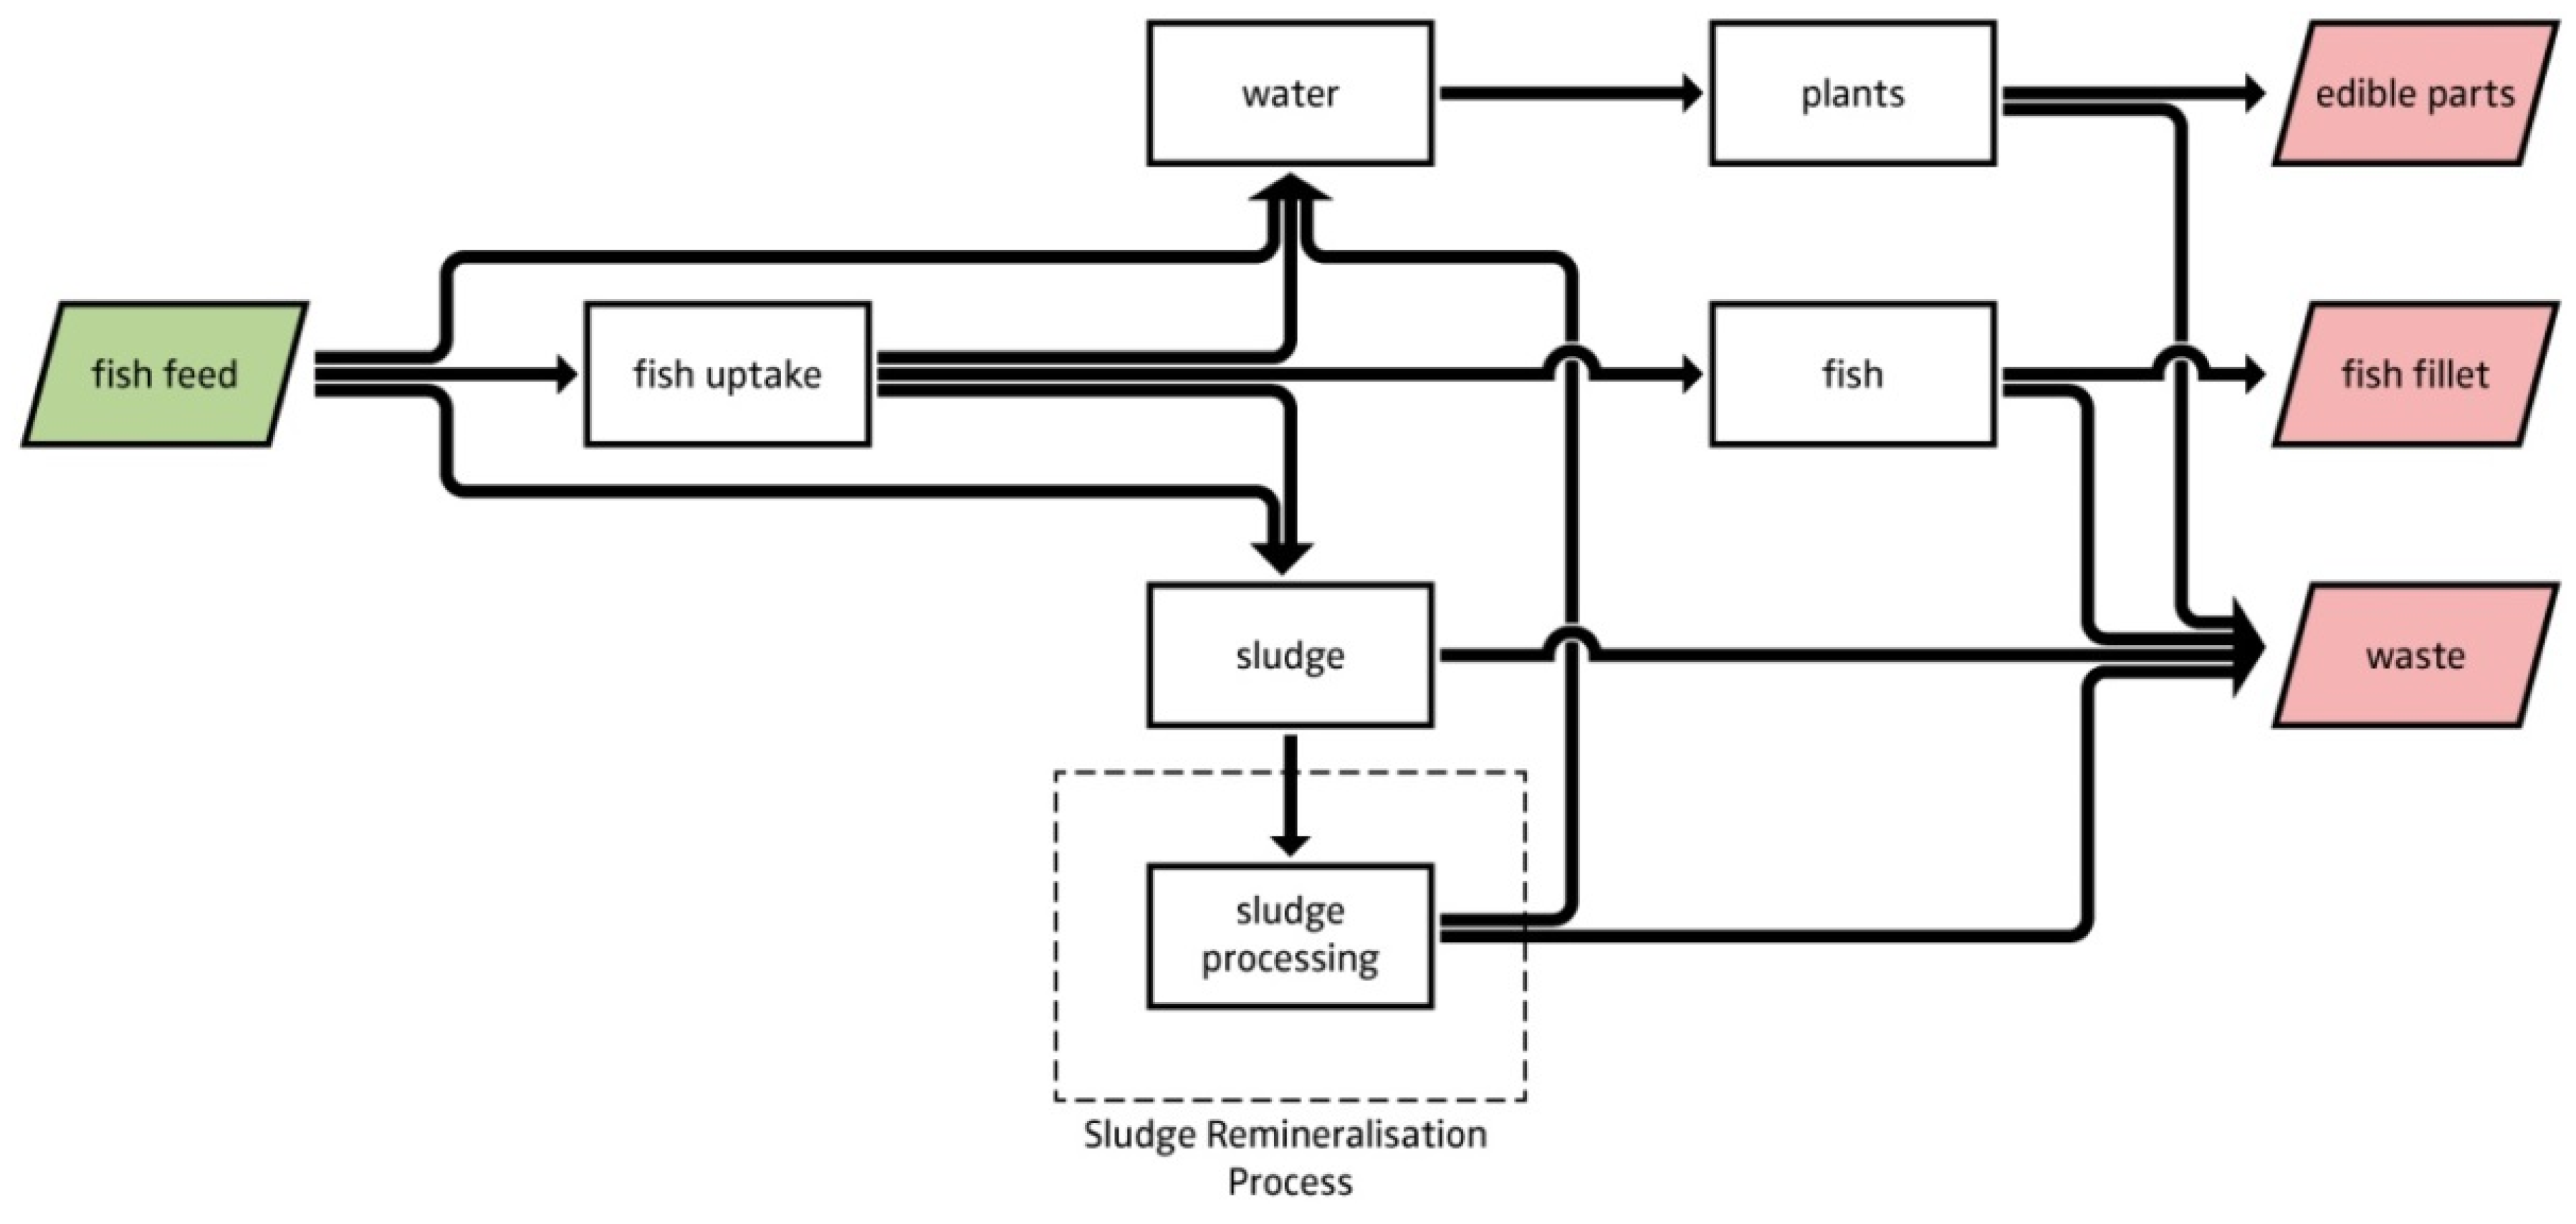
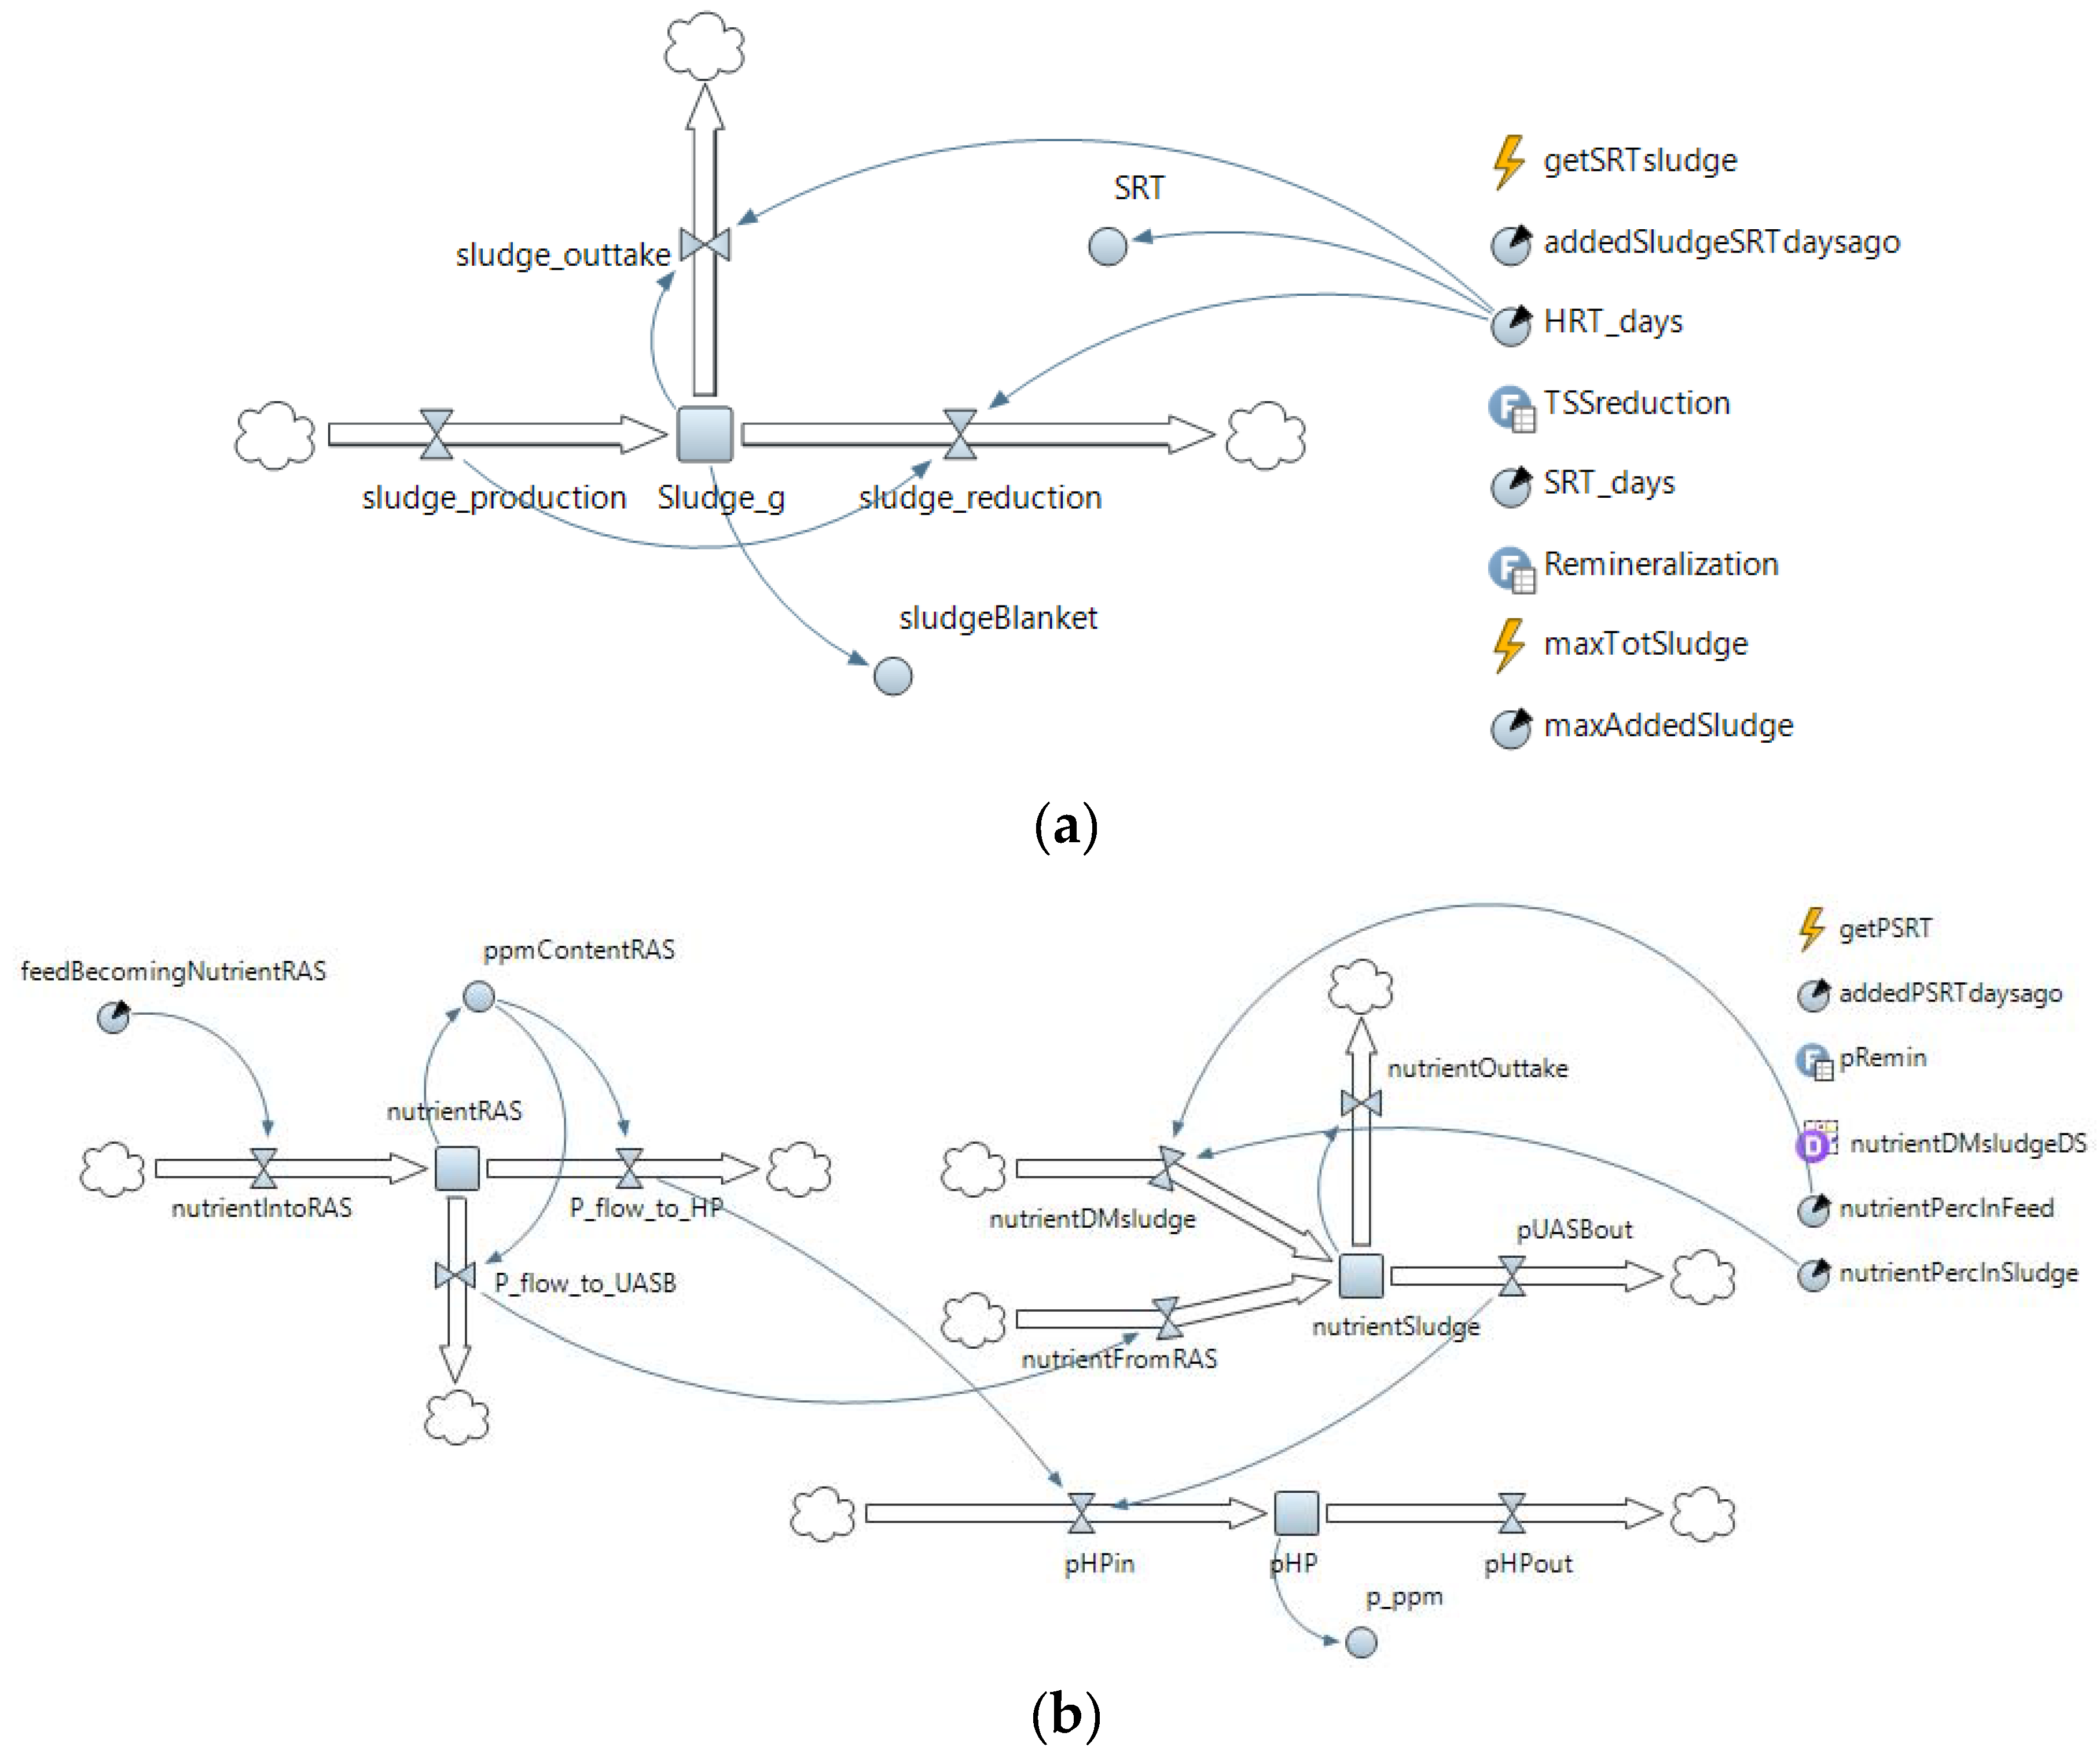
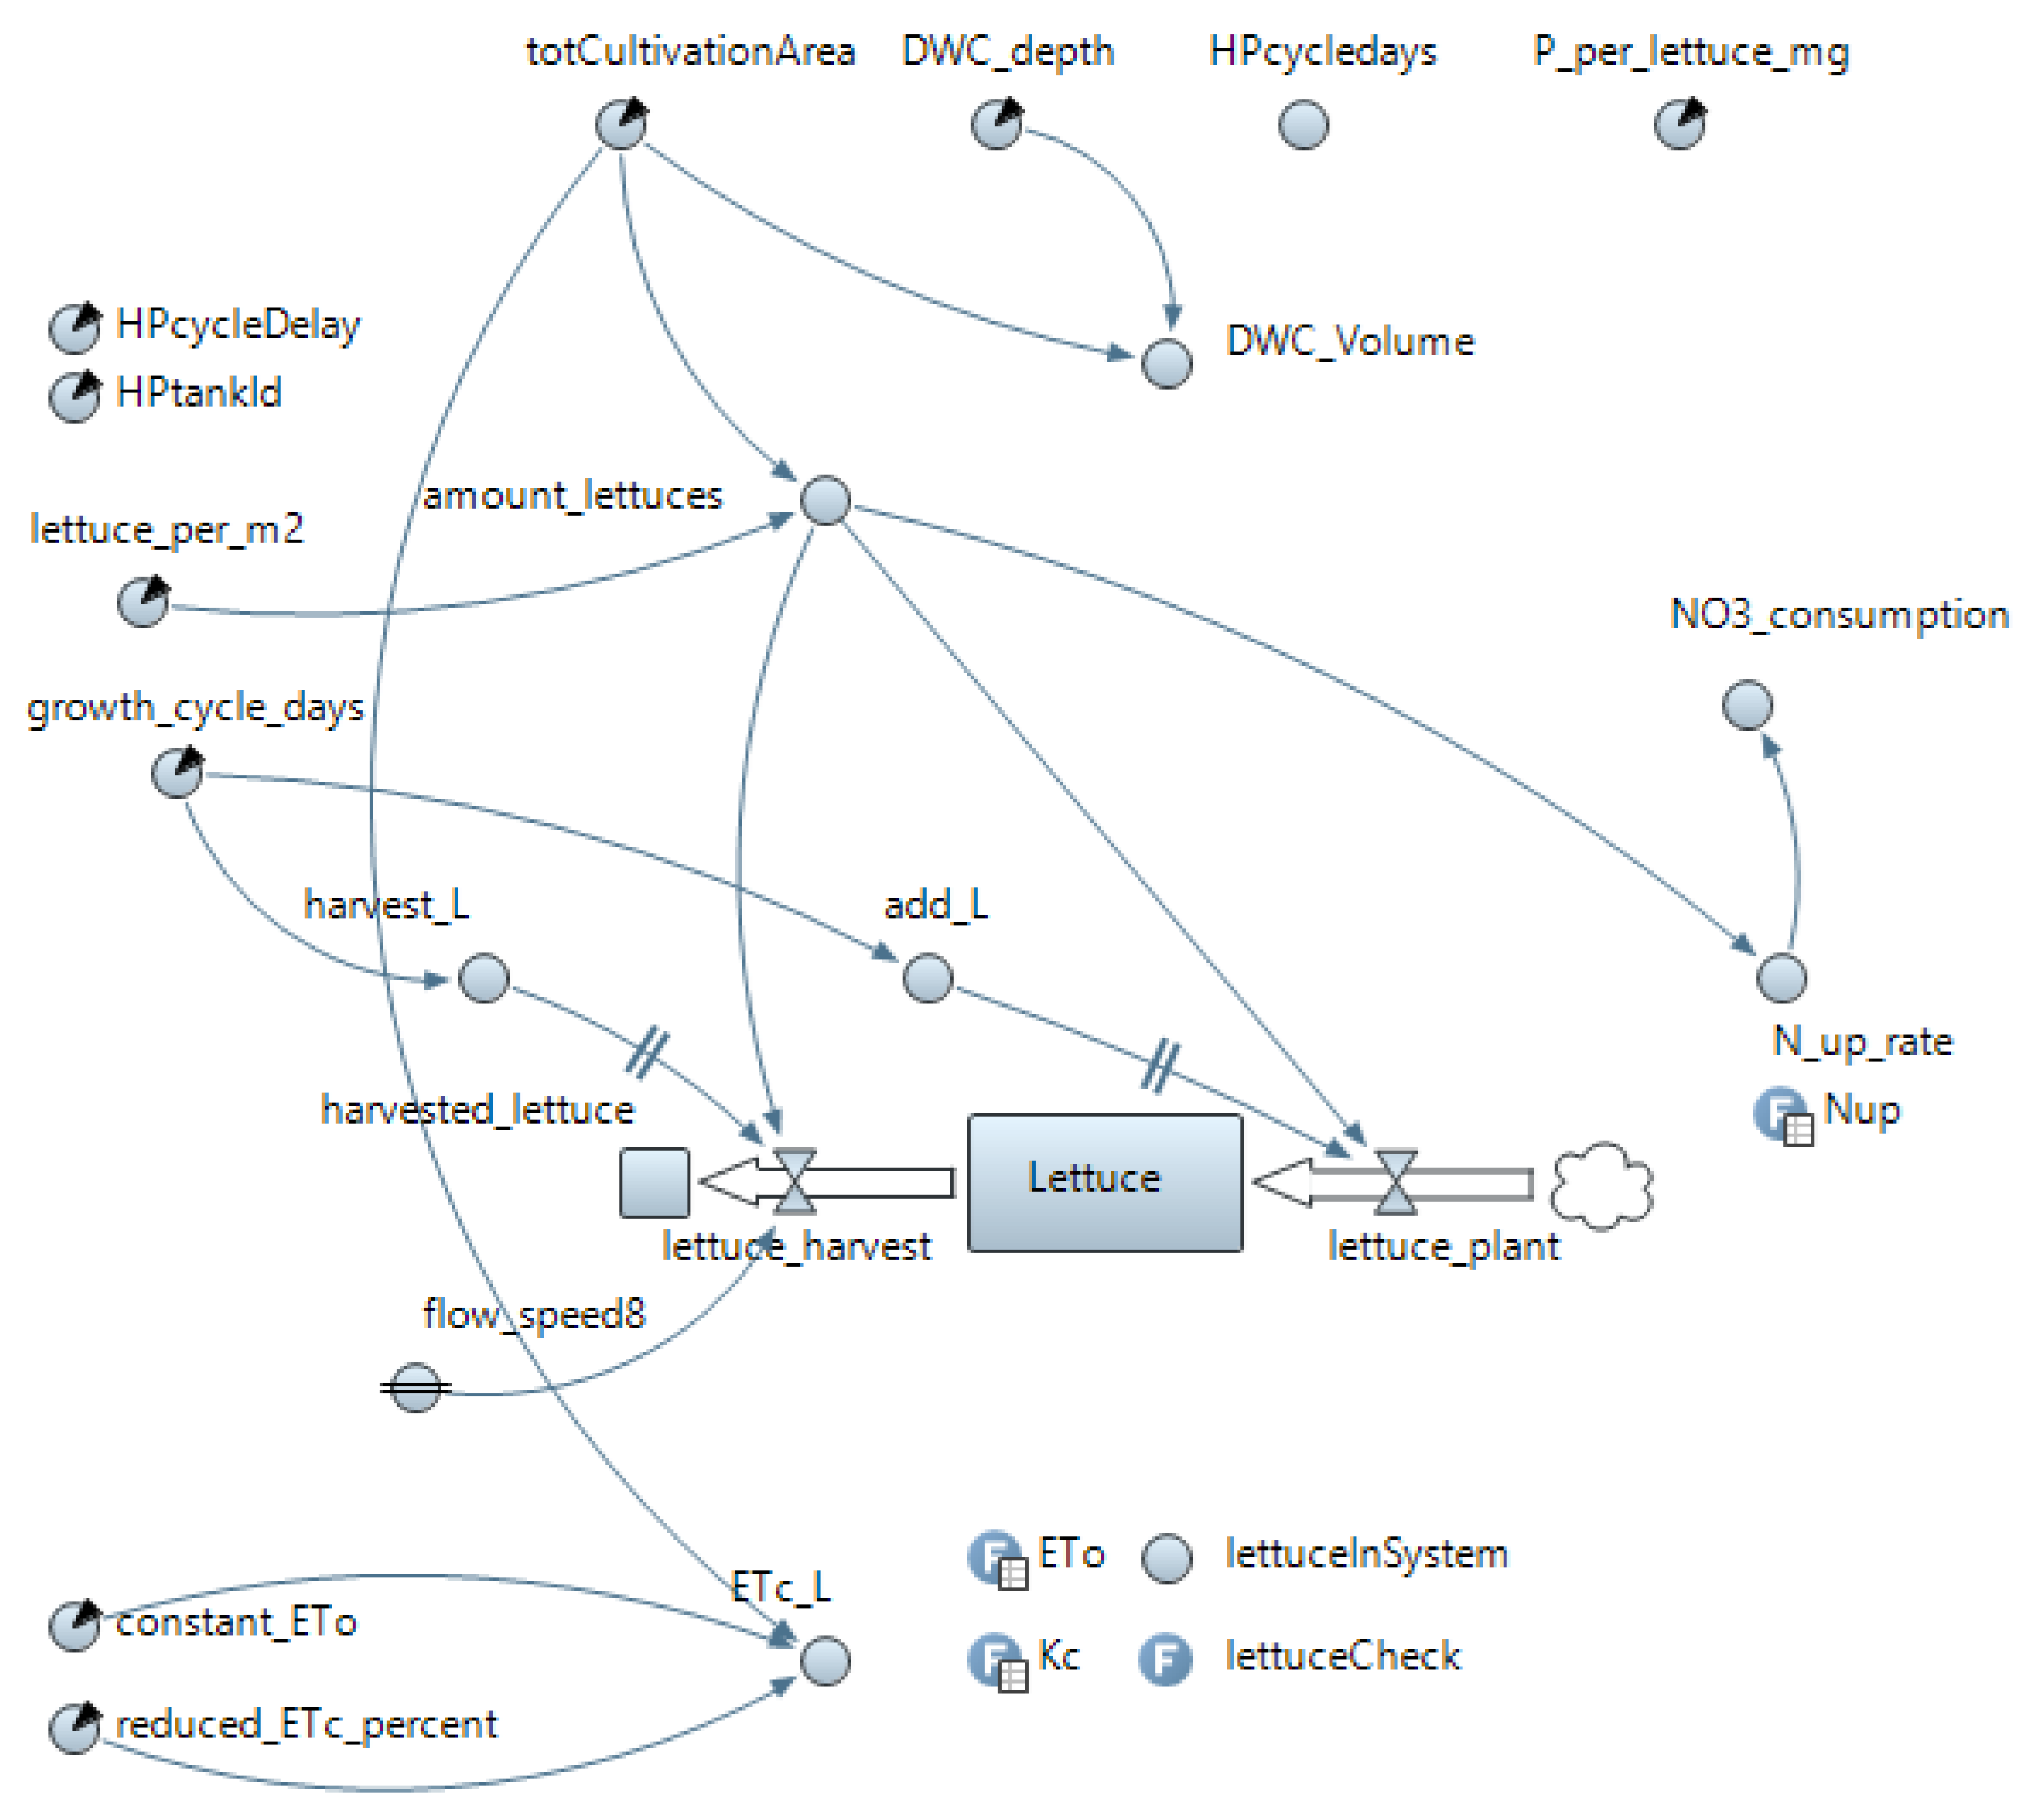
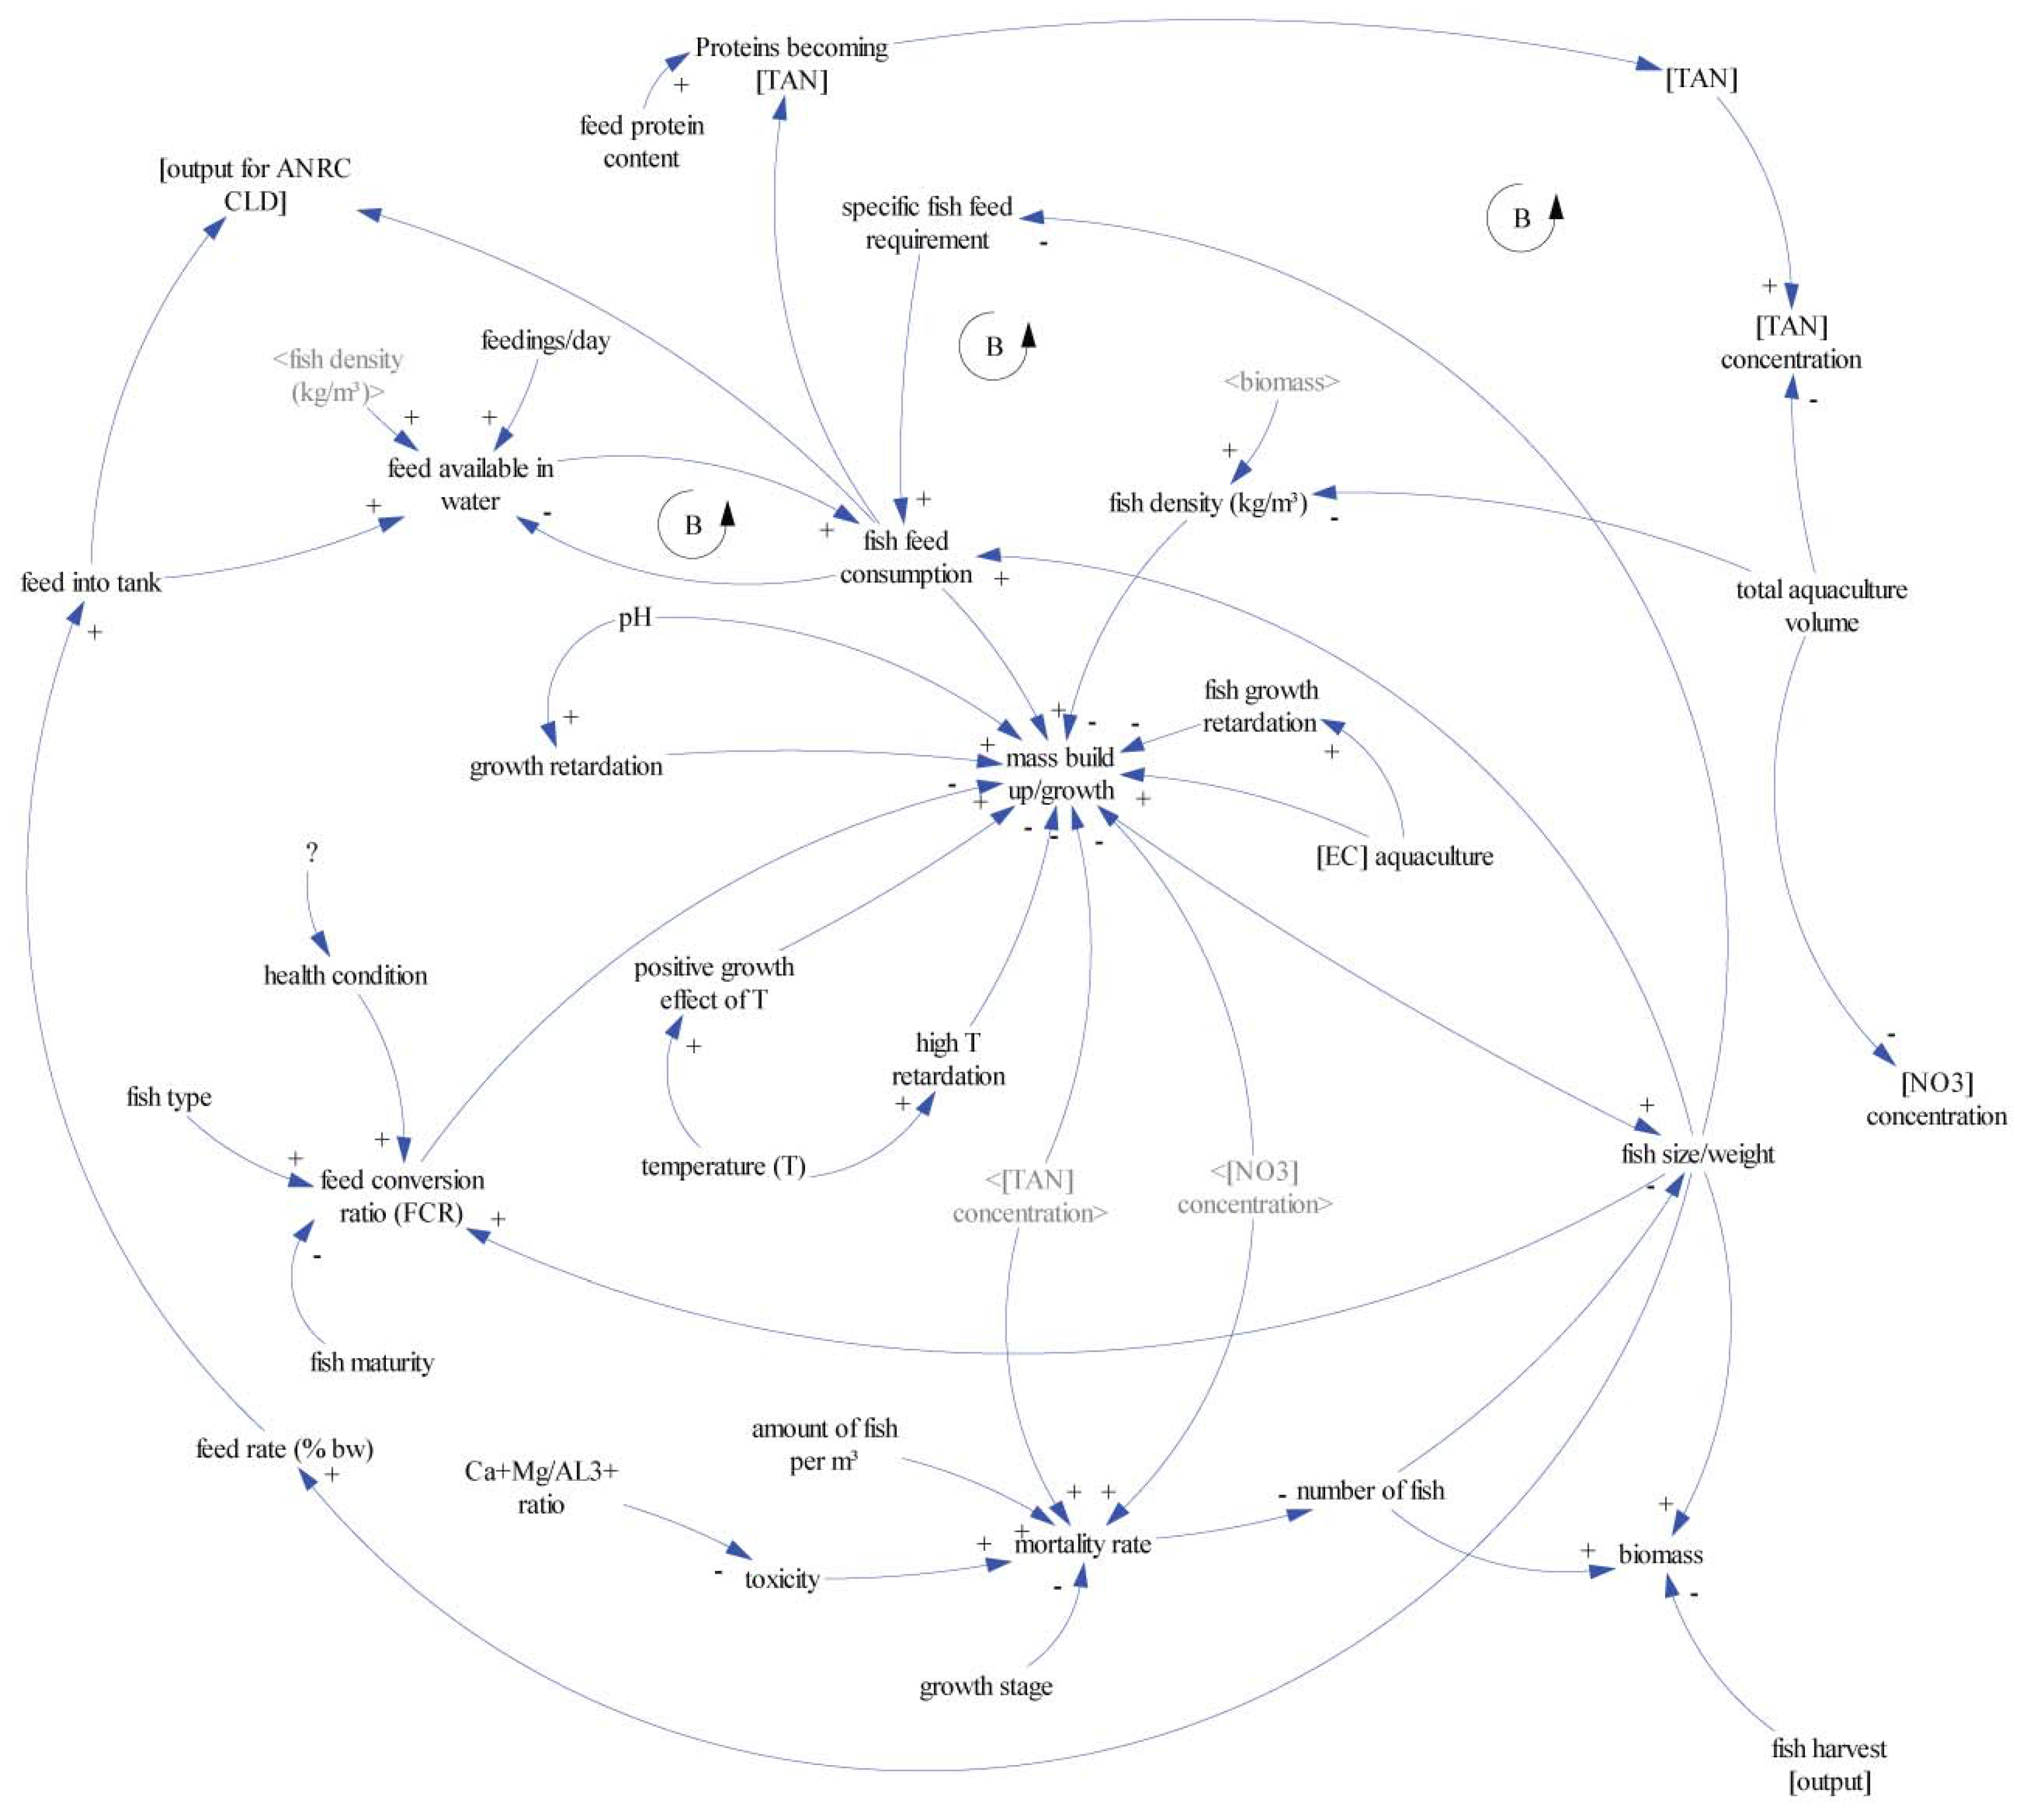
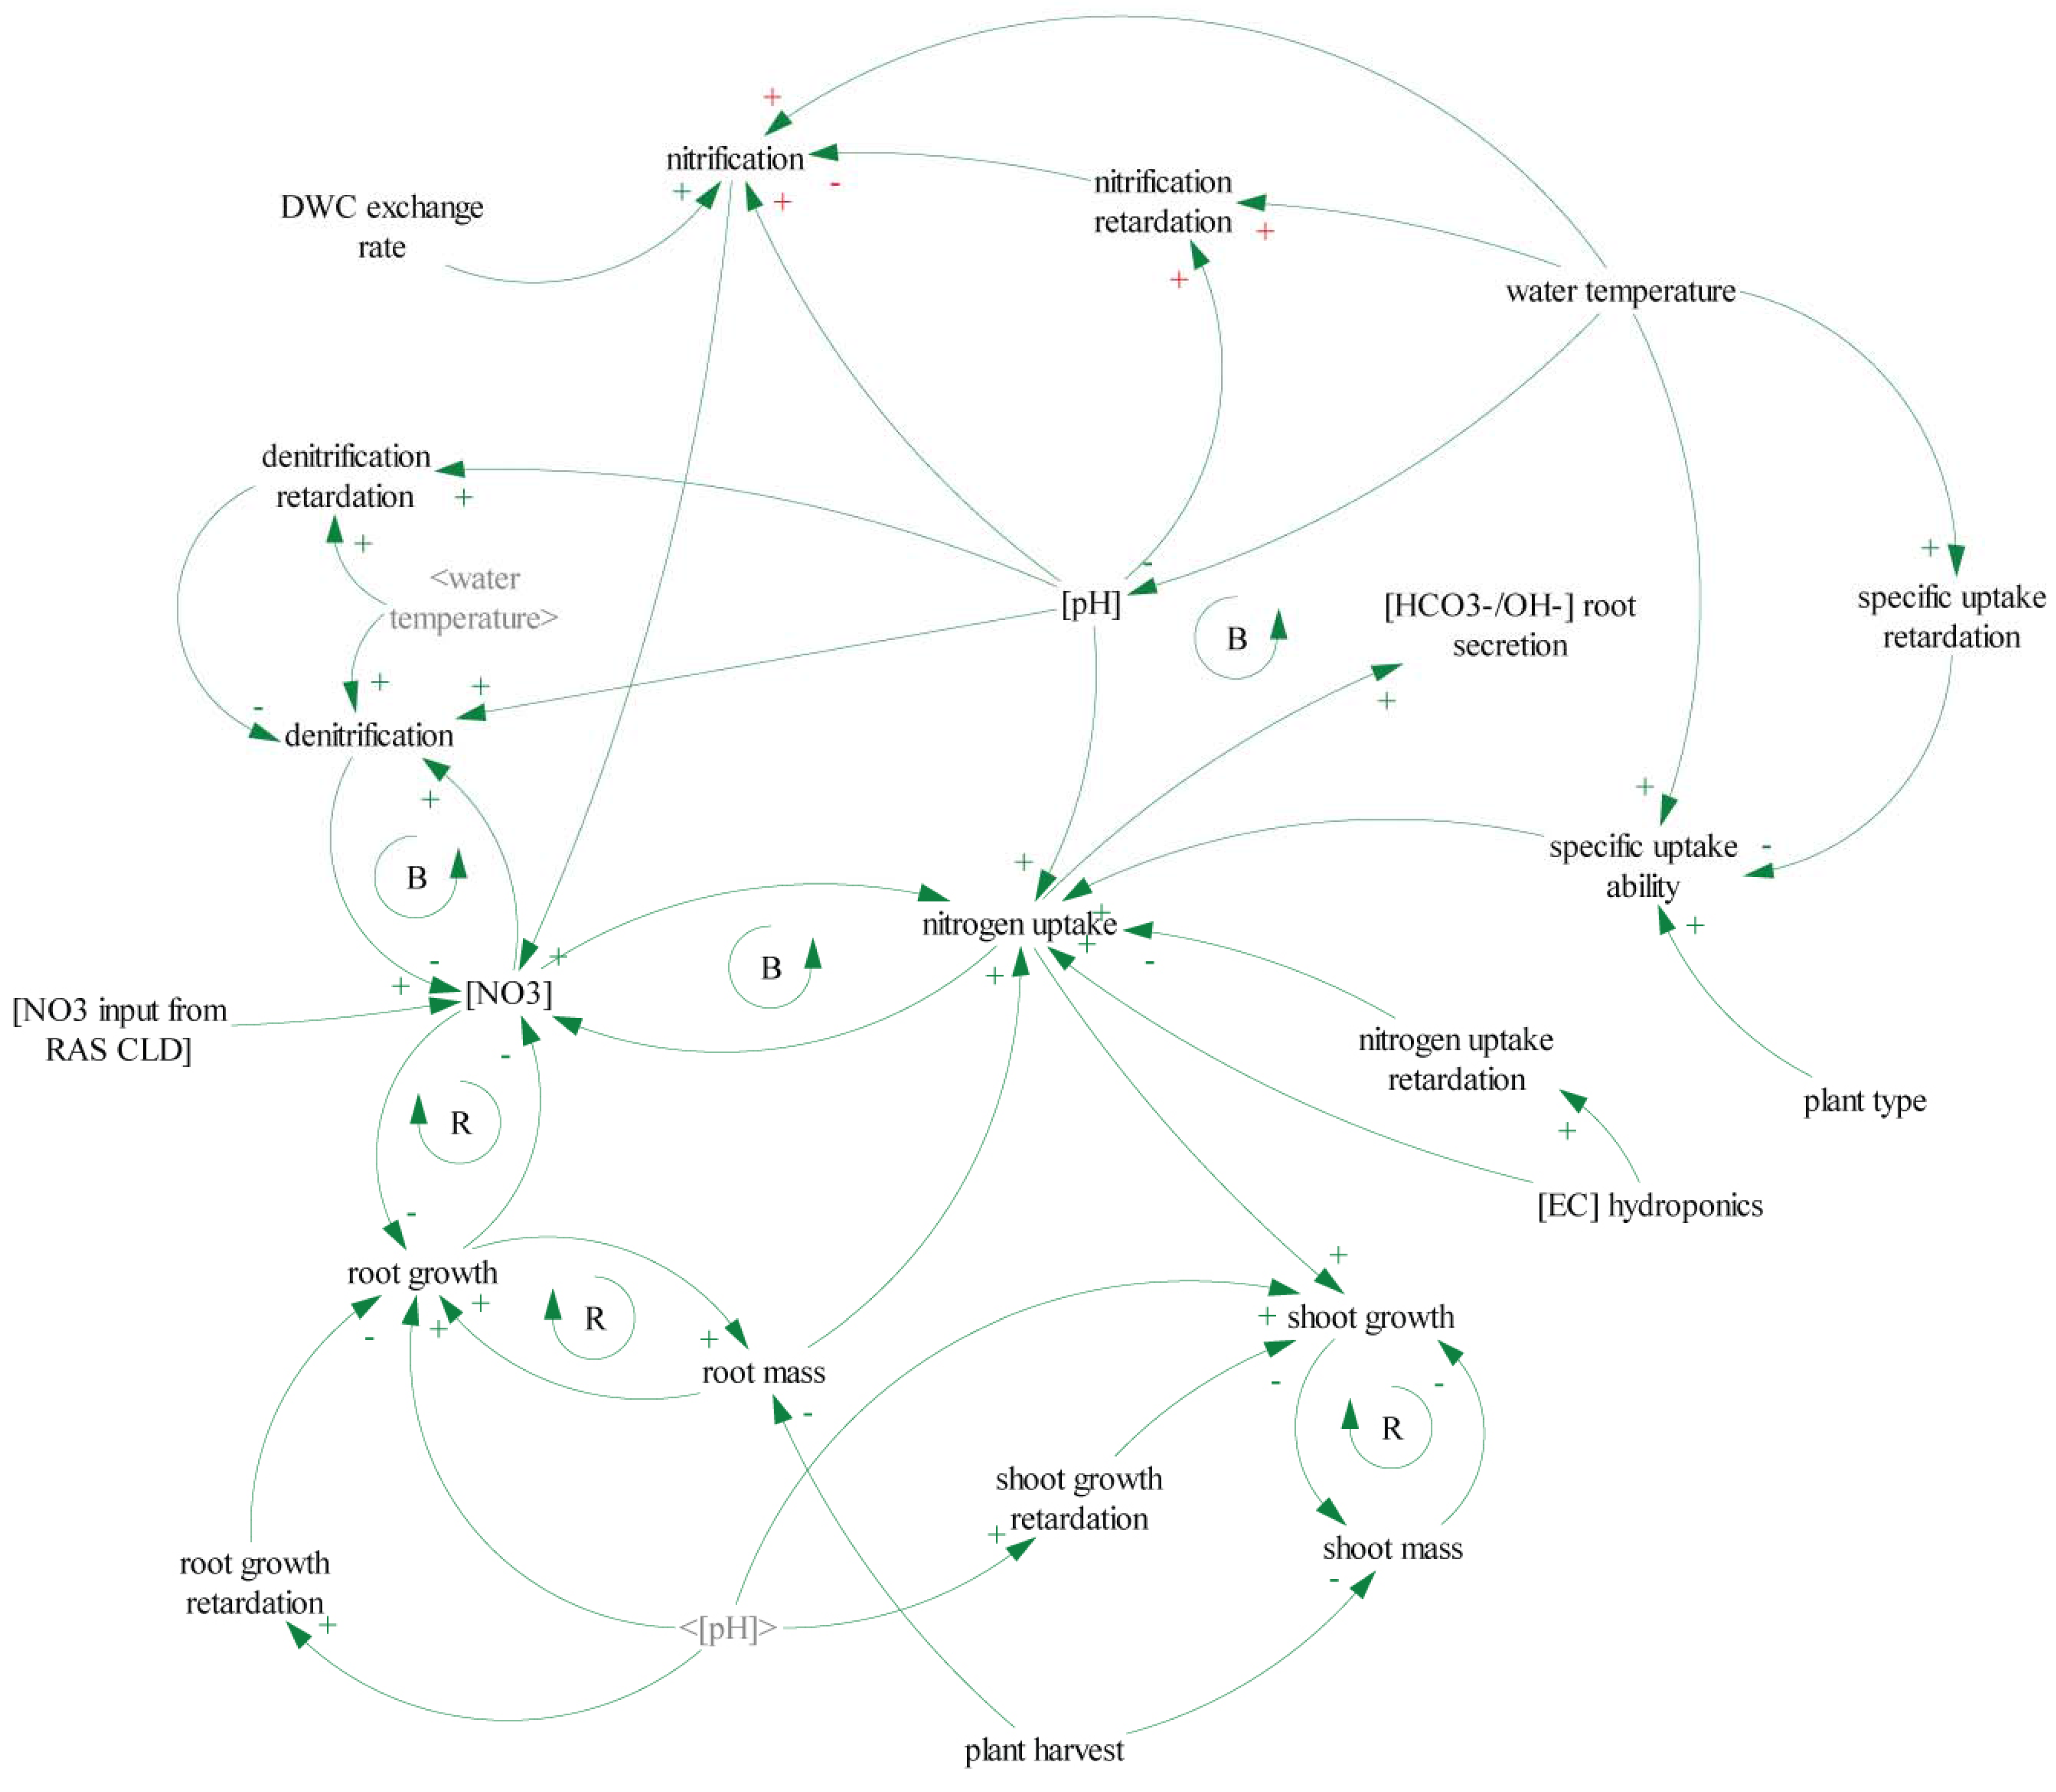
4.2. Model Description—Flowcharts

Figure 4 and Figure 5 show the water flow of traditional RAS and one-loop aquaponic systems. Whereas the outflow in RAS is mainly defined by water discharge rates and sludge removal, the main outflow in one-loop aquaponic systems occurs via evapotranspiration and sludge removal. Figure 6 illustrates in what DAPS differ from the other approaches. Although its main water outflow is also defined through evapotranspiration, it reduces water loss by recycling the sludge, whose production can kept stable by maintaining a constant fish biomass (Figure 7). It must be noted that, as aquacultural sludges contain 95%–97% of water [32], the sludge remineralization process also recycles the water back into the hydroponic component (Figure 8). Depending on the sizing parameter and/or cultivation area, additional denitrification might be needed in the RAS in case the evaporation-dependent water flow to the hydroponic component is not sufficient in order to maintain required nitrate levels in the RAS.
Following the sludge treatment approach (illustrated in Figure 8 and Figure 9), the nutrient loss drawbacks can be limited. Sludge produced by commercial RAS must undergo treatment before disposal unless centralized waste treatment utilities are available [82]. Consequently, the implementation of future-oriented recycling solutions should be considered when designing DAPSs (Figure 6).

5. Results

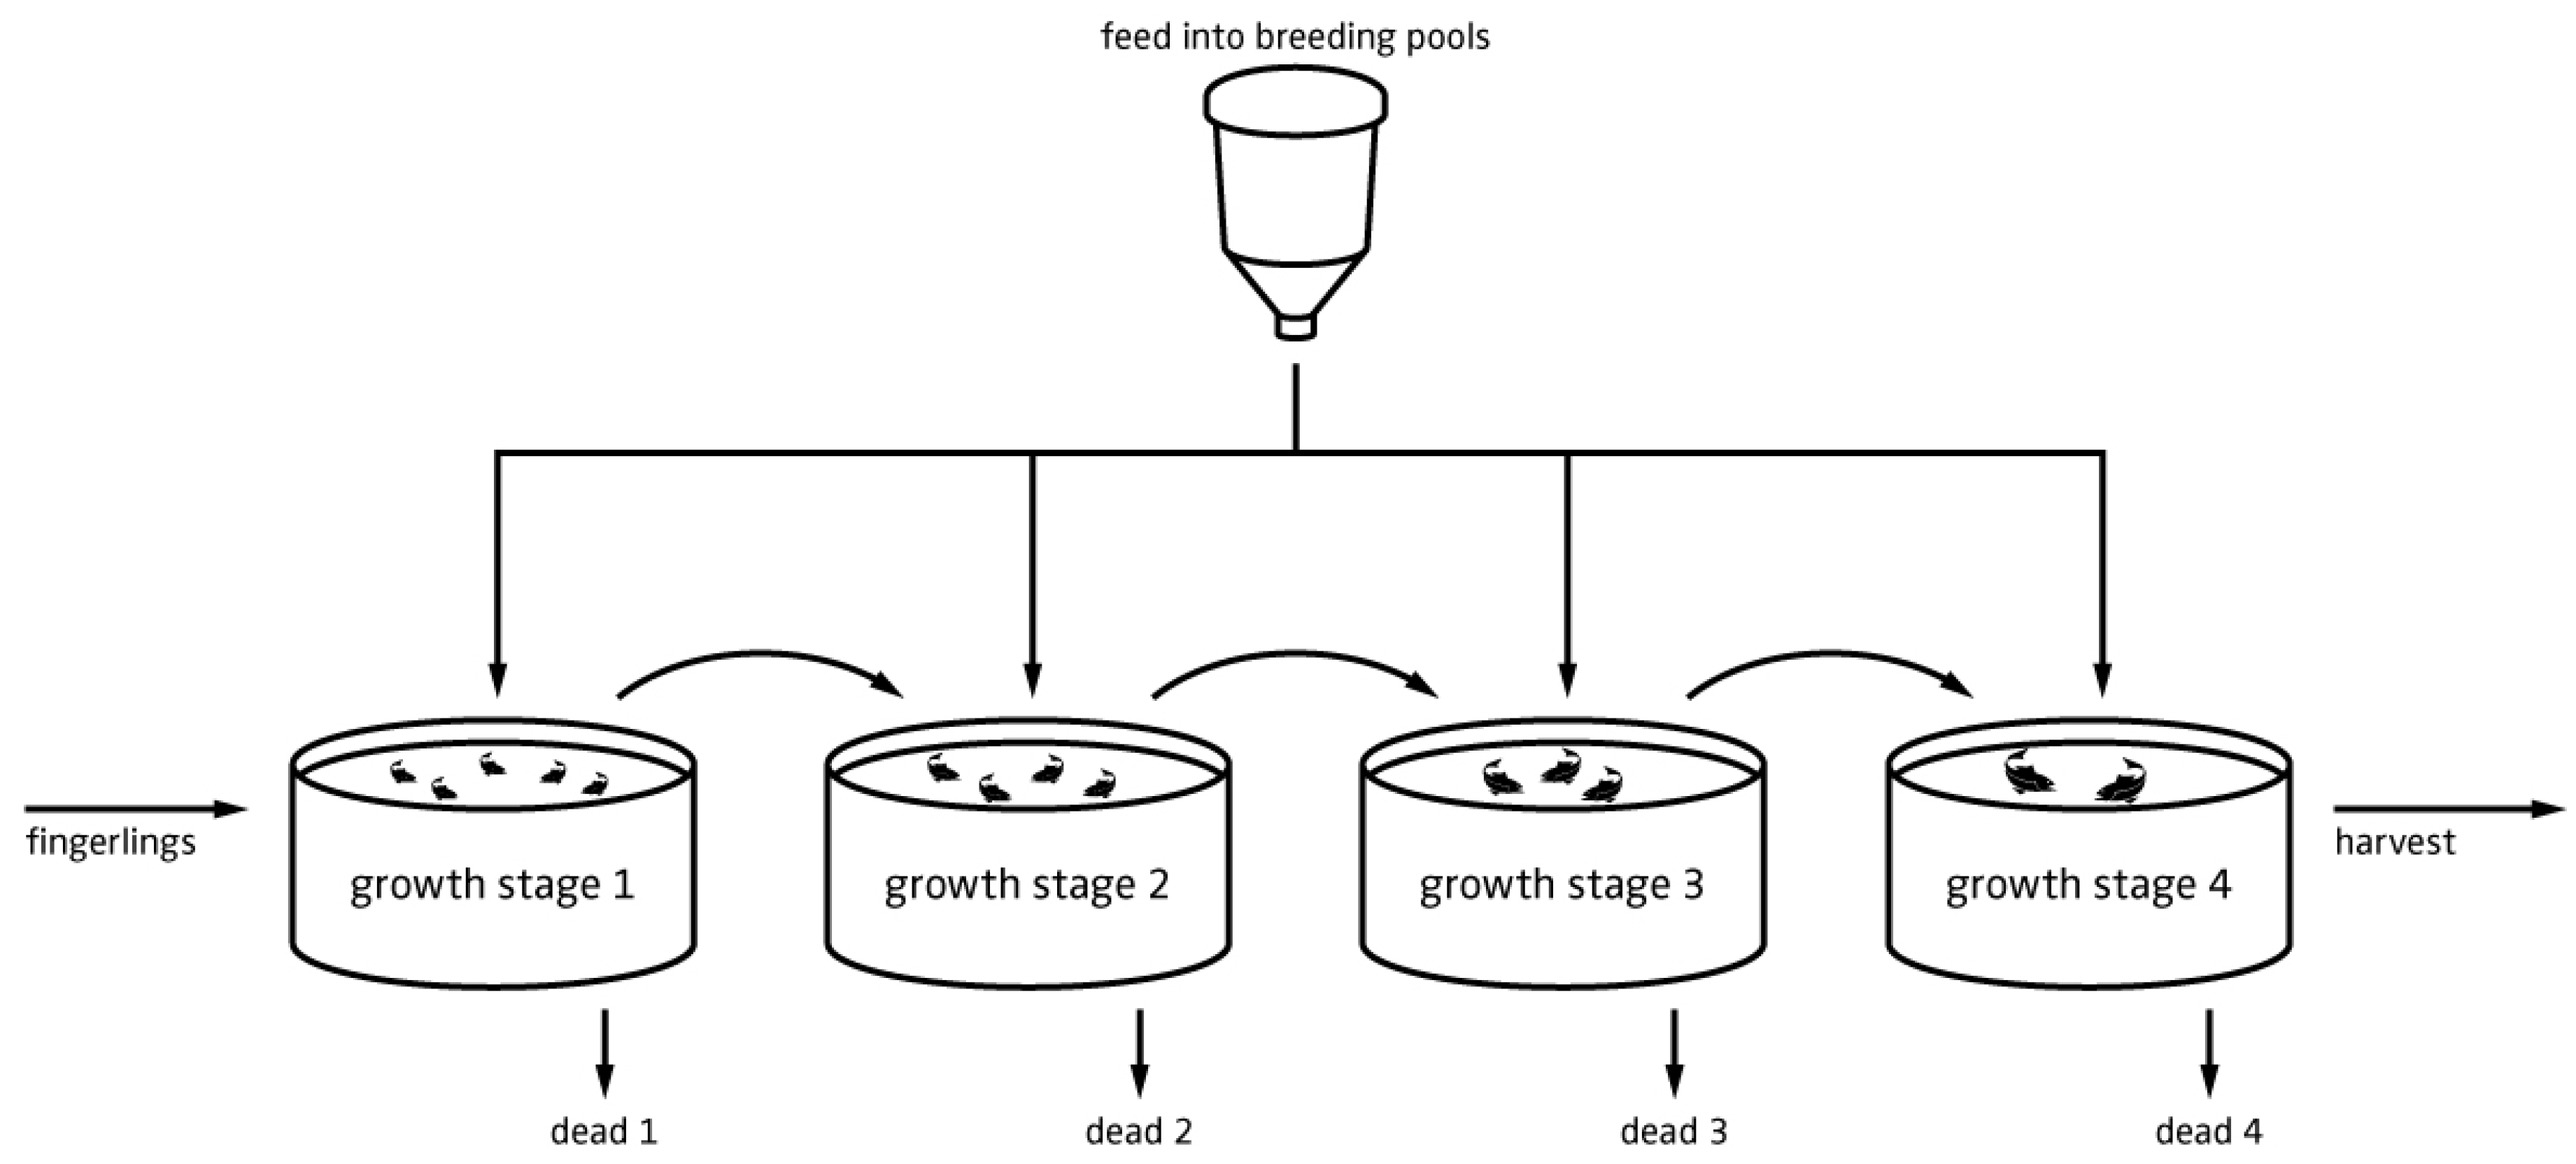
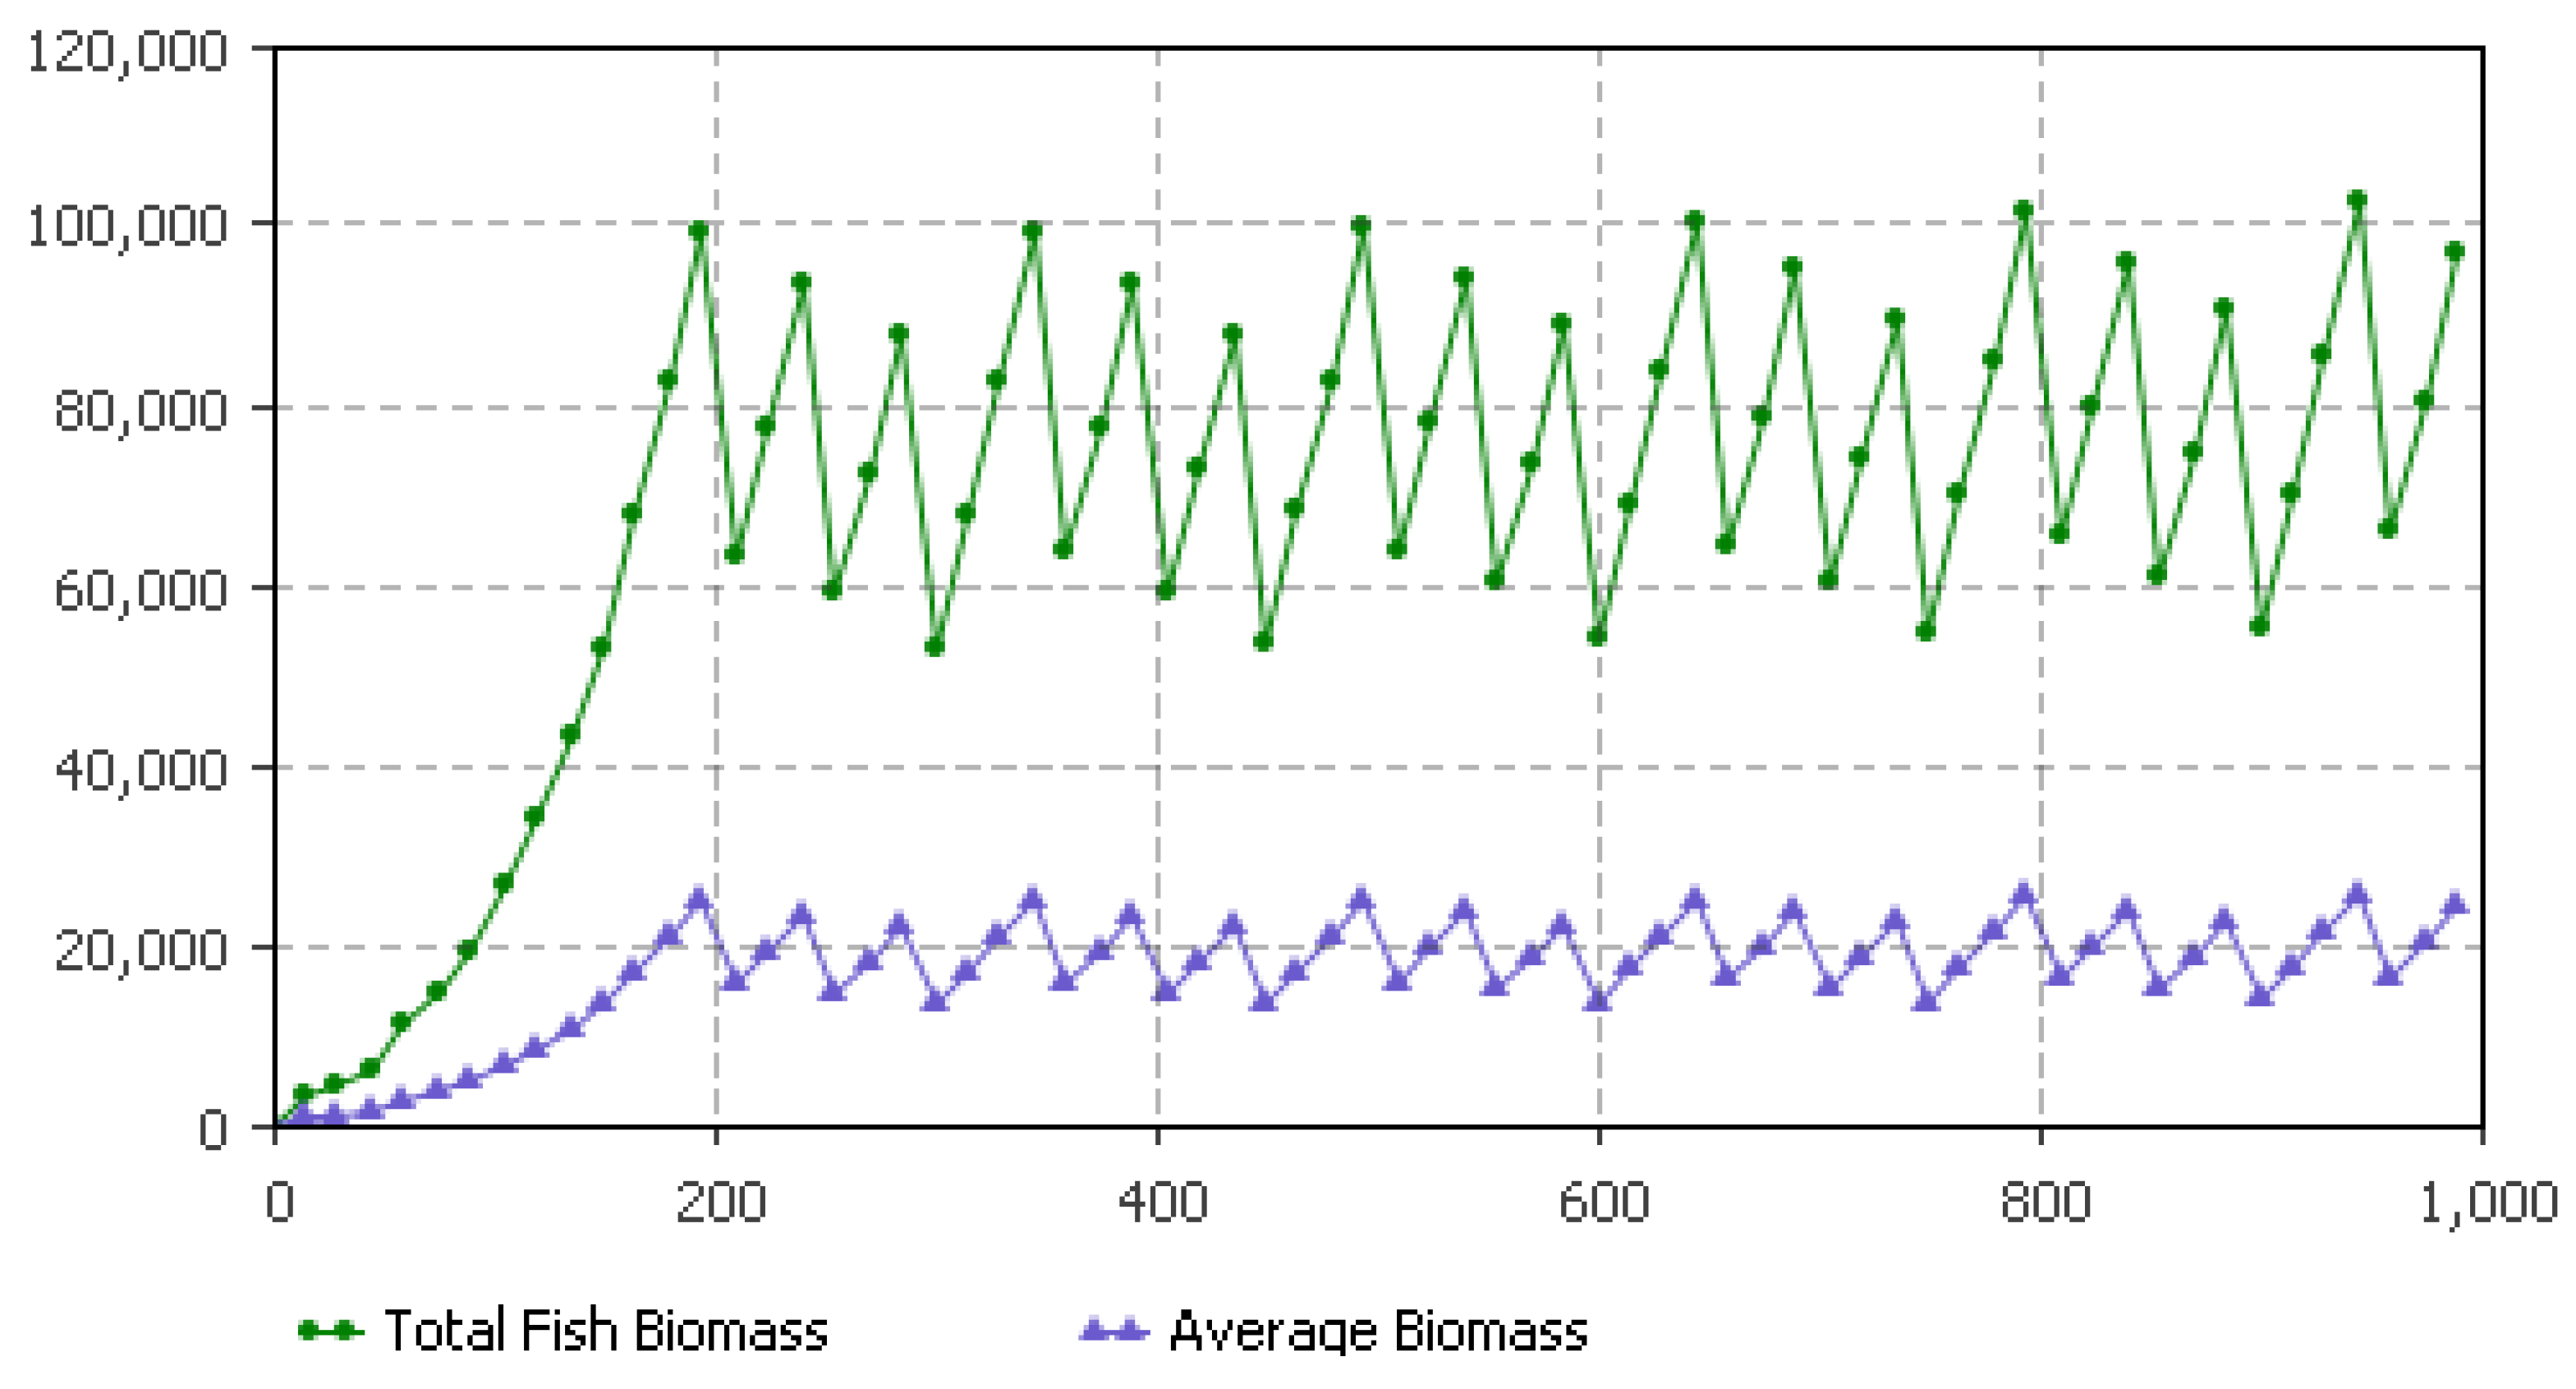
5.1. Fish Biomass Estimates

The DAPS model (see Figure A1, Figure A2, Figure A3 and Figure A4) outputs are shown in Figure 10, Figure 11, Figure 12, Figure 13, Figure 14, Figure 15, Figure 16, Figure 17, Figure 18 and Figure 19. Figure 10 presents the output of a parameter variation experiment that was conducted to determine the amount of fish needed to have a maximum fish stocking density of 50 kg·m−3 per tank. Based on this parameterization the average fish density could be determined (Figure 11). Figure 11 outlines the advantage of using several fish tanks to avoid sharp fluctuations in fish biomass and thus feed input by use of a standing stock of different size classes.

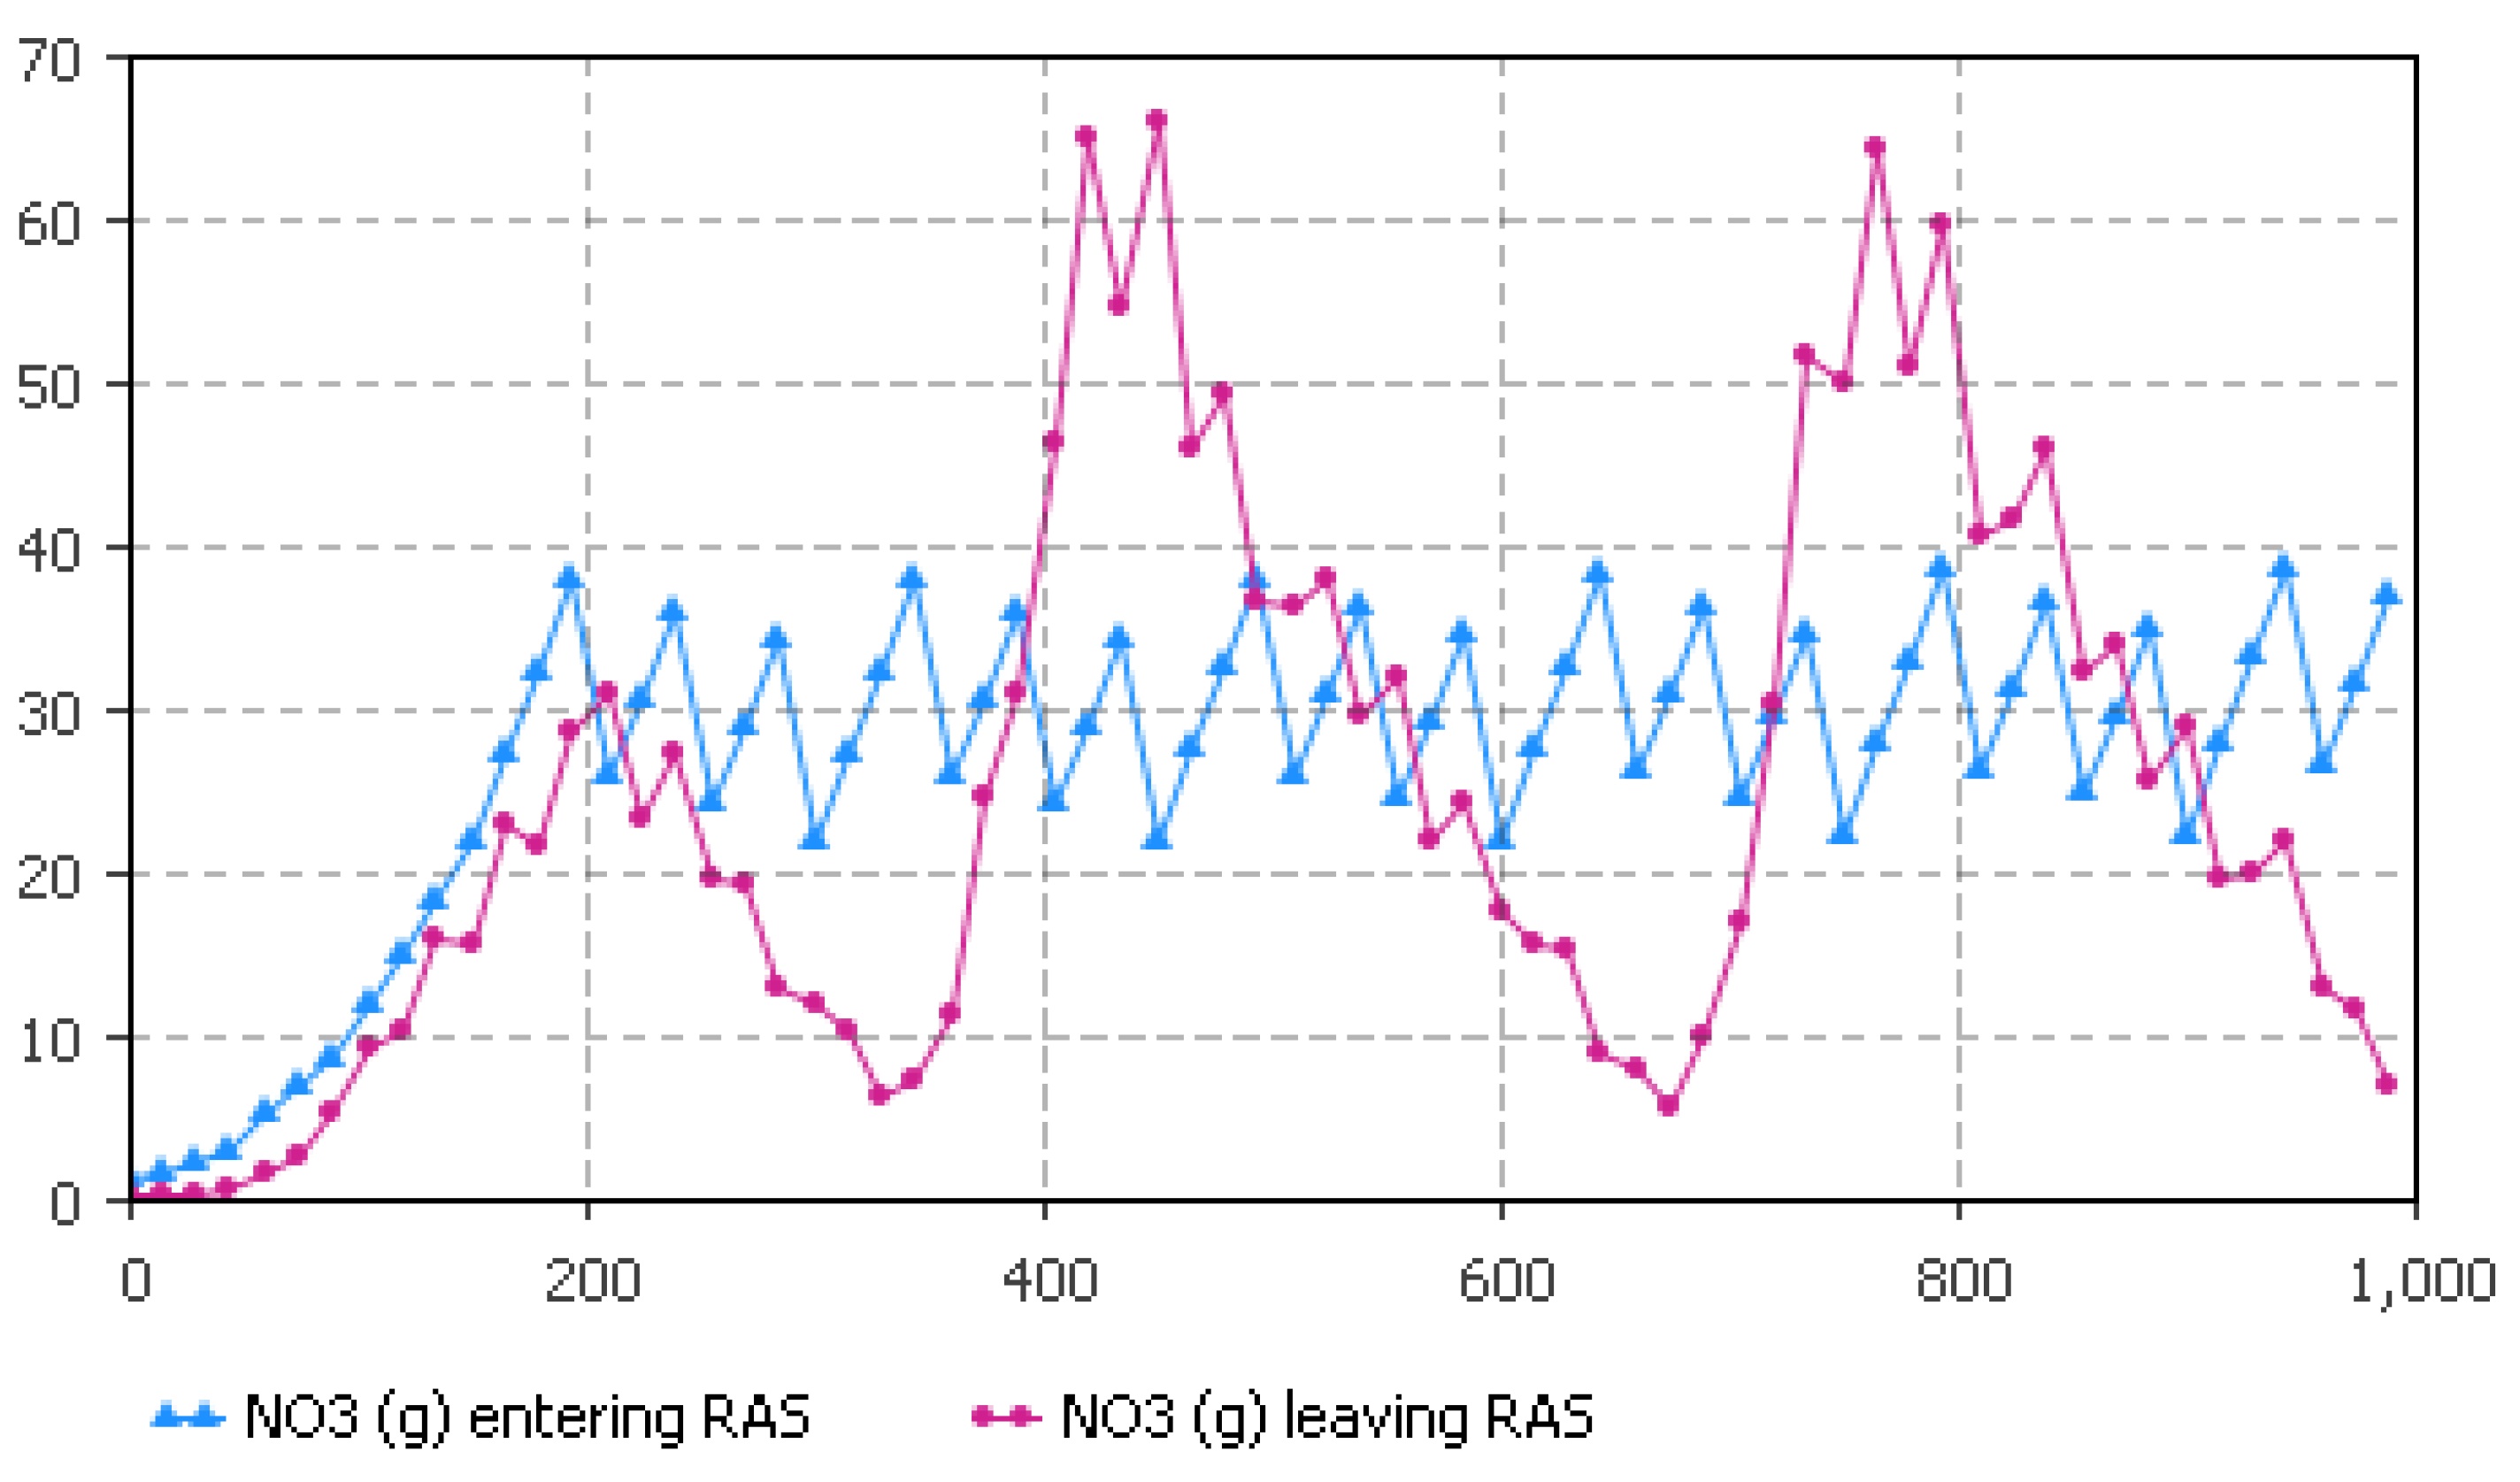
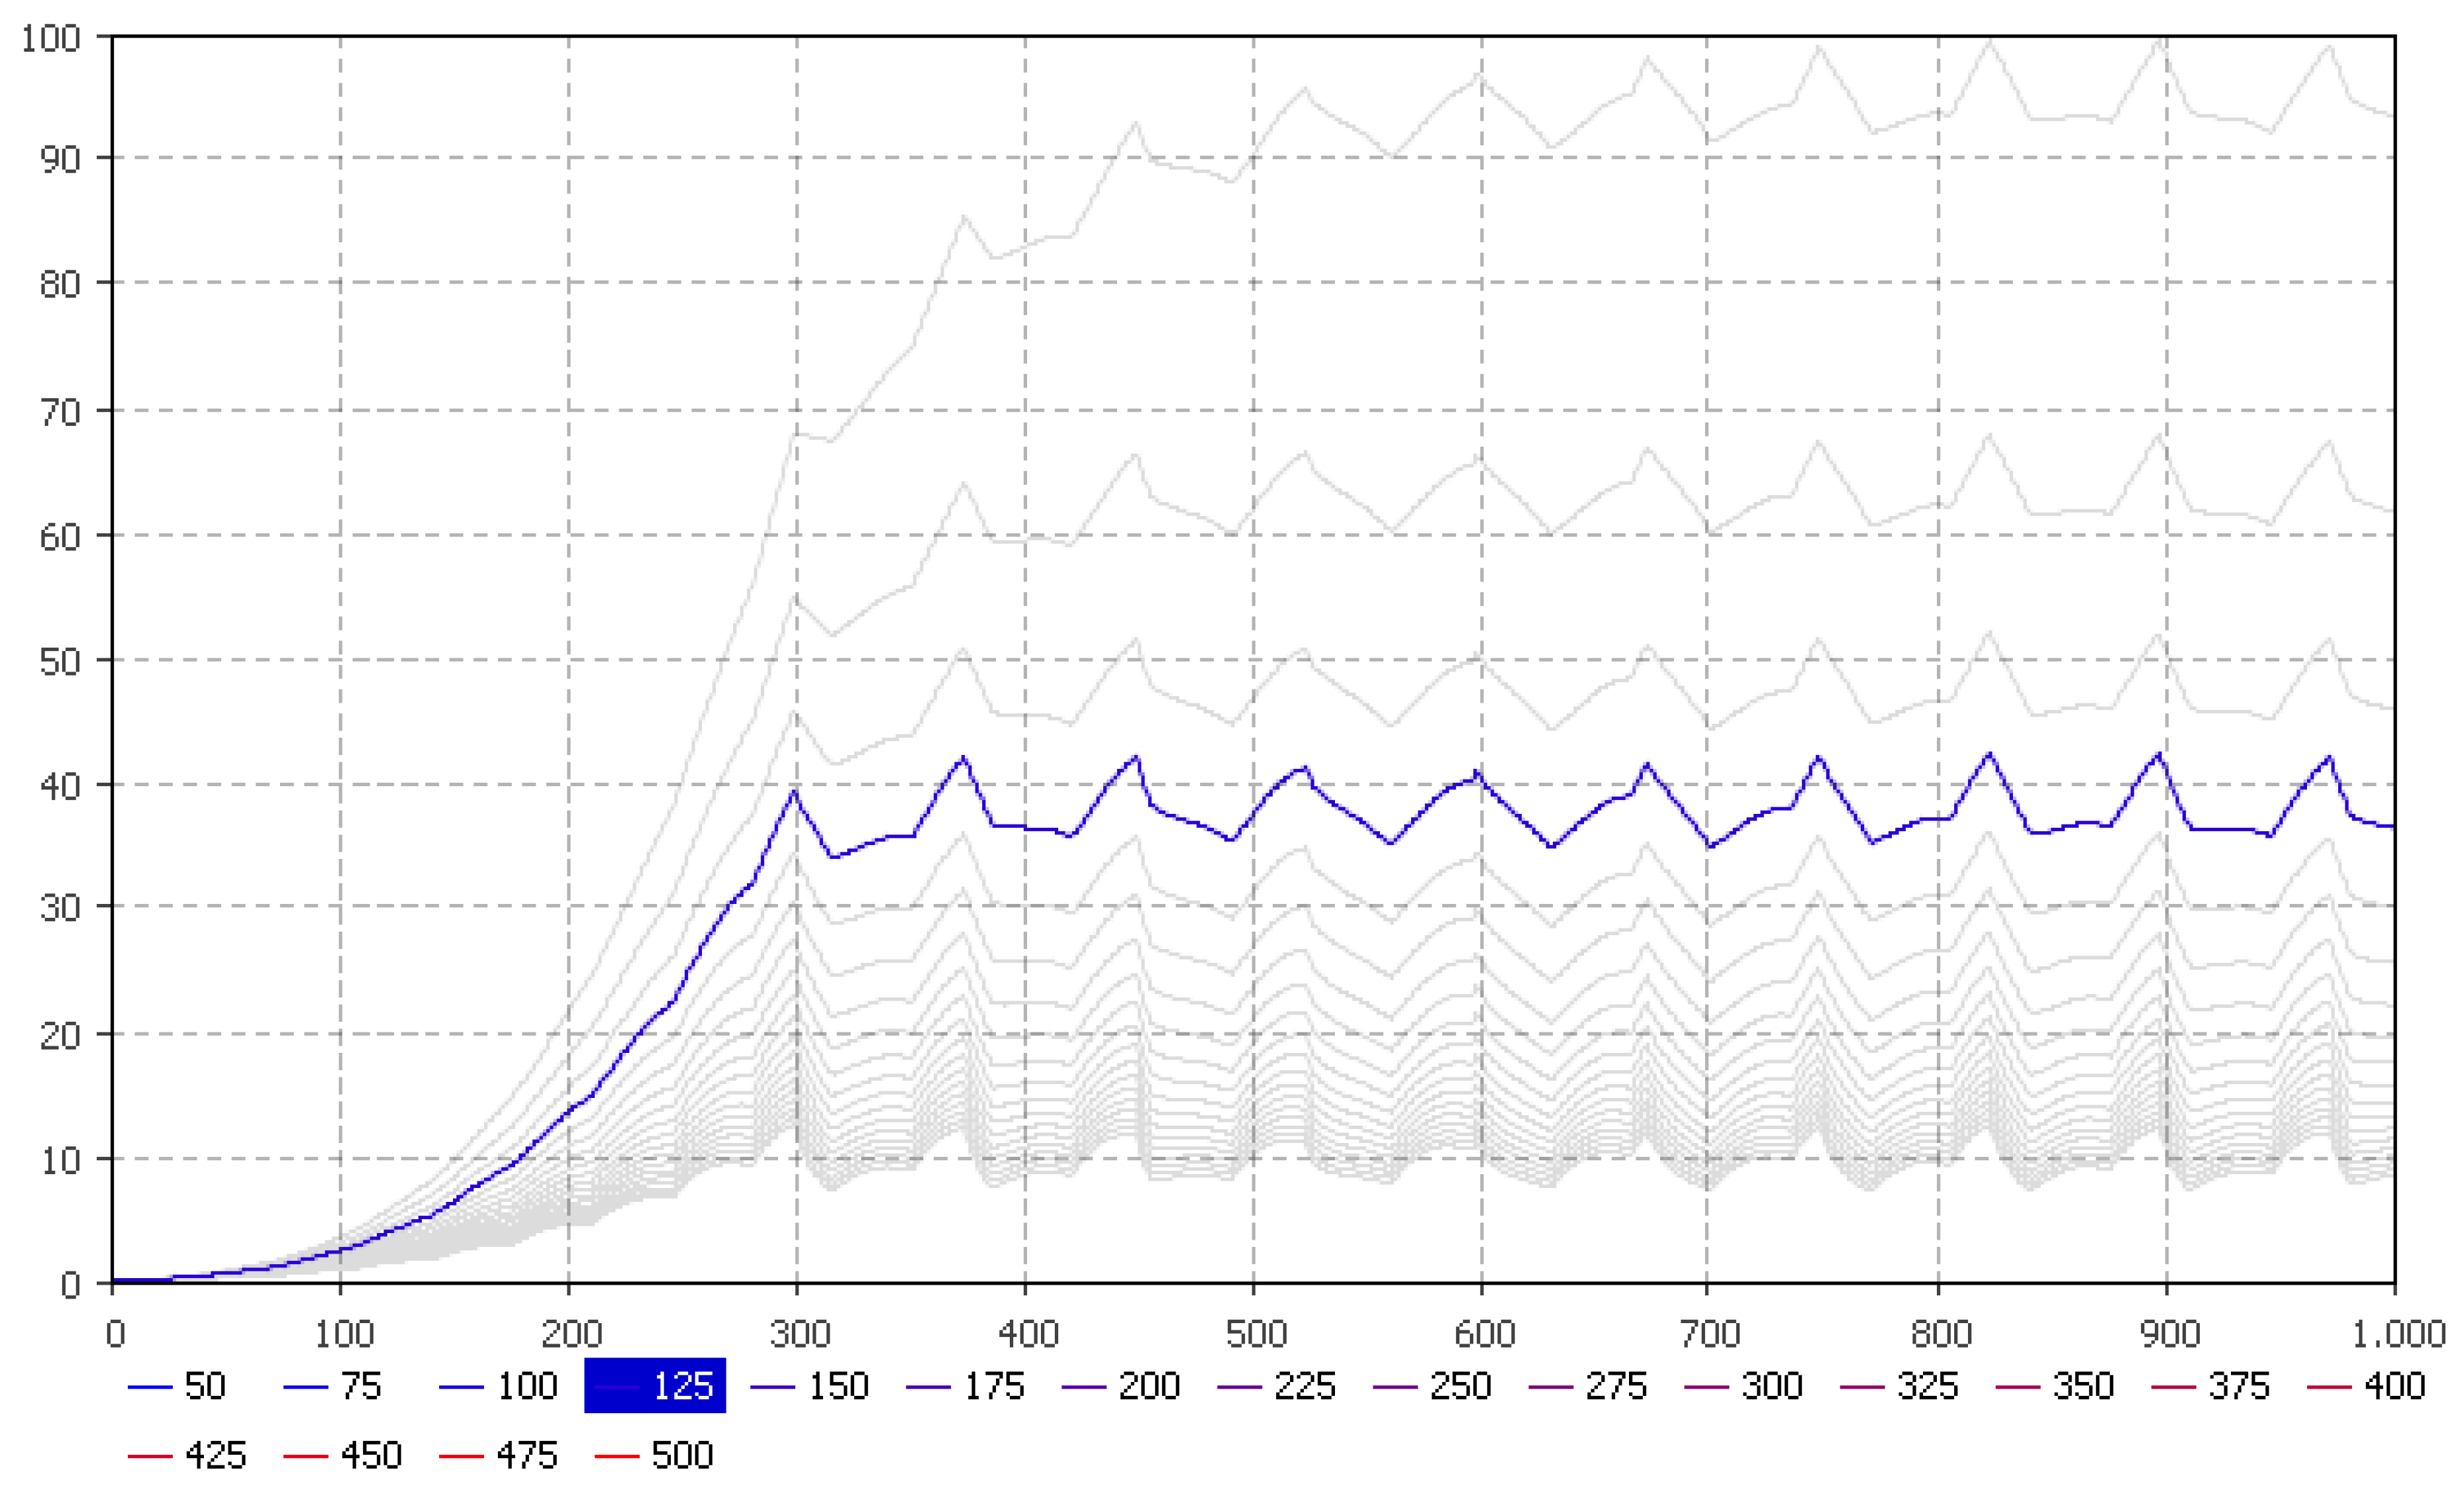
5.2. Nitrate Flow Estimates

As can be seen schematically in Figure 6, the flow rate from RAS to the plants is determined by the plant evapotranspiration rate derived from the FAO Penman-Monteith Equation. Unlike in the case of other macronutrients, the remineralization potential for N is marginal, as almost all of it is denitrified to atmospheric dinitrogen gas due to anaerobic activity in the system. The graphs in Figure 12, Figure 13 and Figure 14 show the hydrological flow under natural light conditions, and the associated RAS nitrate balance and the N-NO3 concentration in the RAS depending on different cultivation area sizes in non-illuminated greenhouse environments in Central Europe. For robust fish at rearing densities of approx. 50 kg·m−3, 100 m2 of growth area would be sufficient to maintain acceptable water quality for the fish in a DAPS. The situation is different for more sensitive fish species, for whom these densities are suboptimal such as sturgeon or if bio labels are targeted that usually require lower densities (10–25 kg/m3). However, using artificial light in industrial DAPS production systems result in a different scenario (Figure 13). In this case, a much smaller cultivation area is needed to achieve a sufficient evapotranspiration rate to maintain low and stable N-NO3 values in the RAS system for both robust and sensitive fish species.

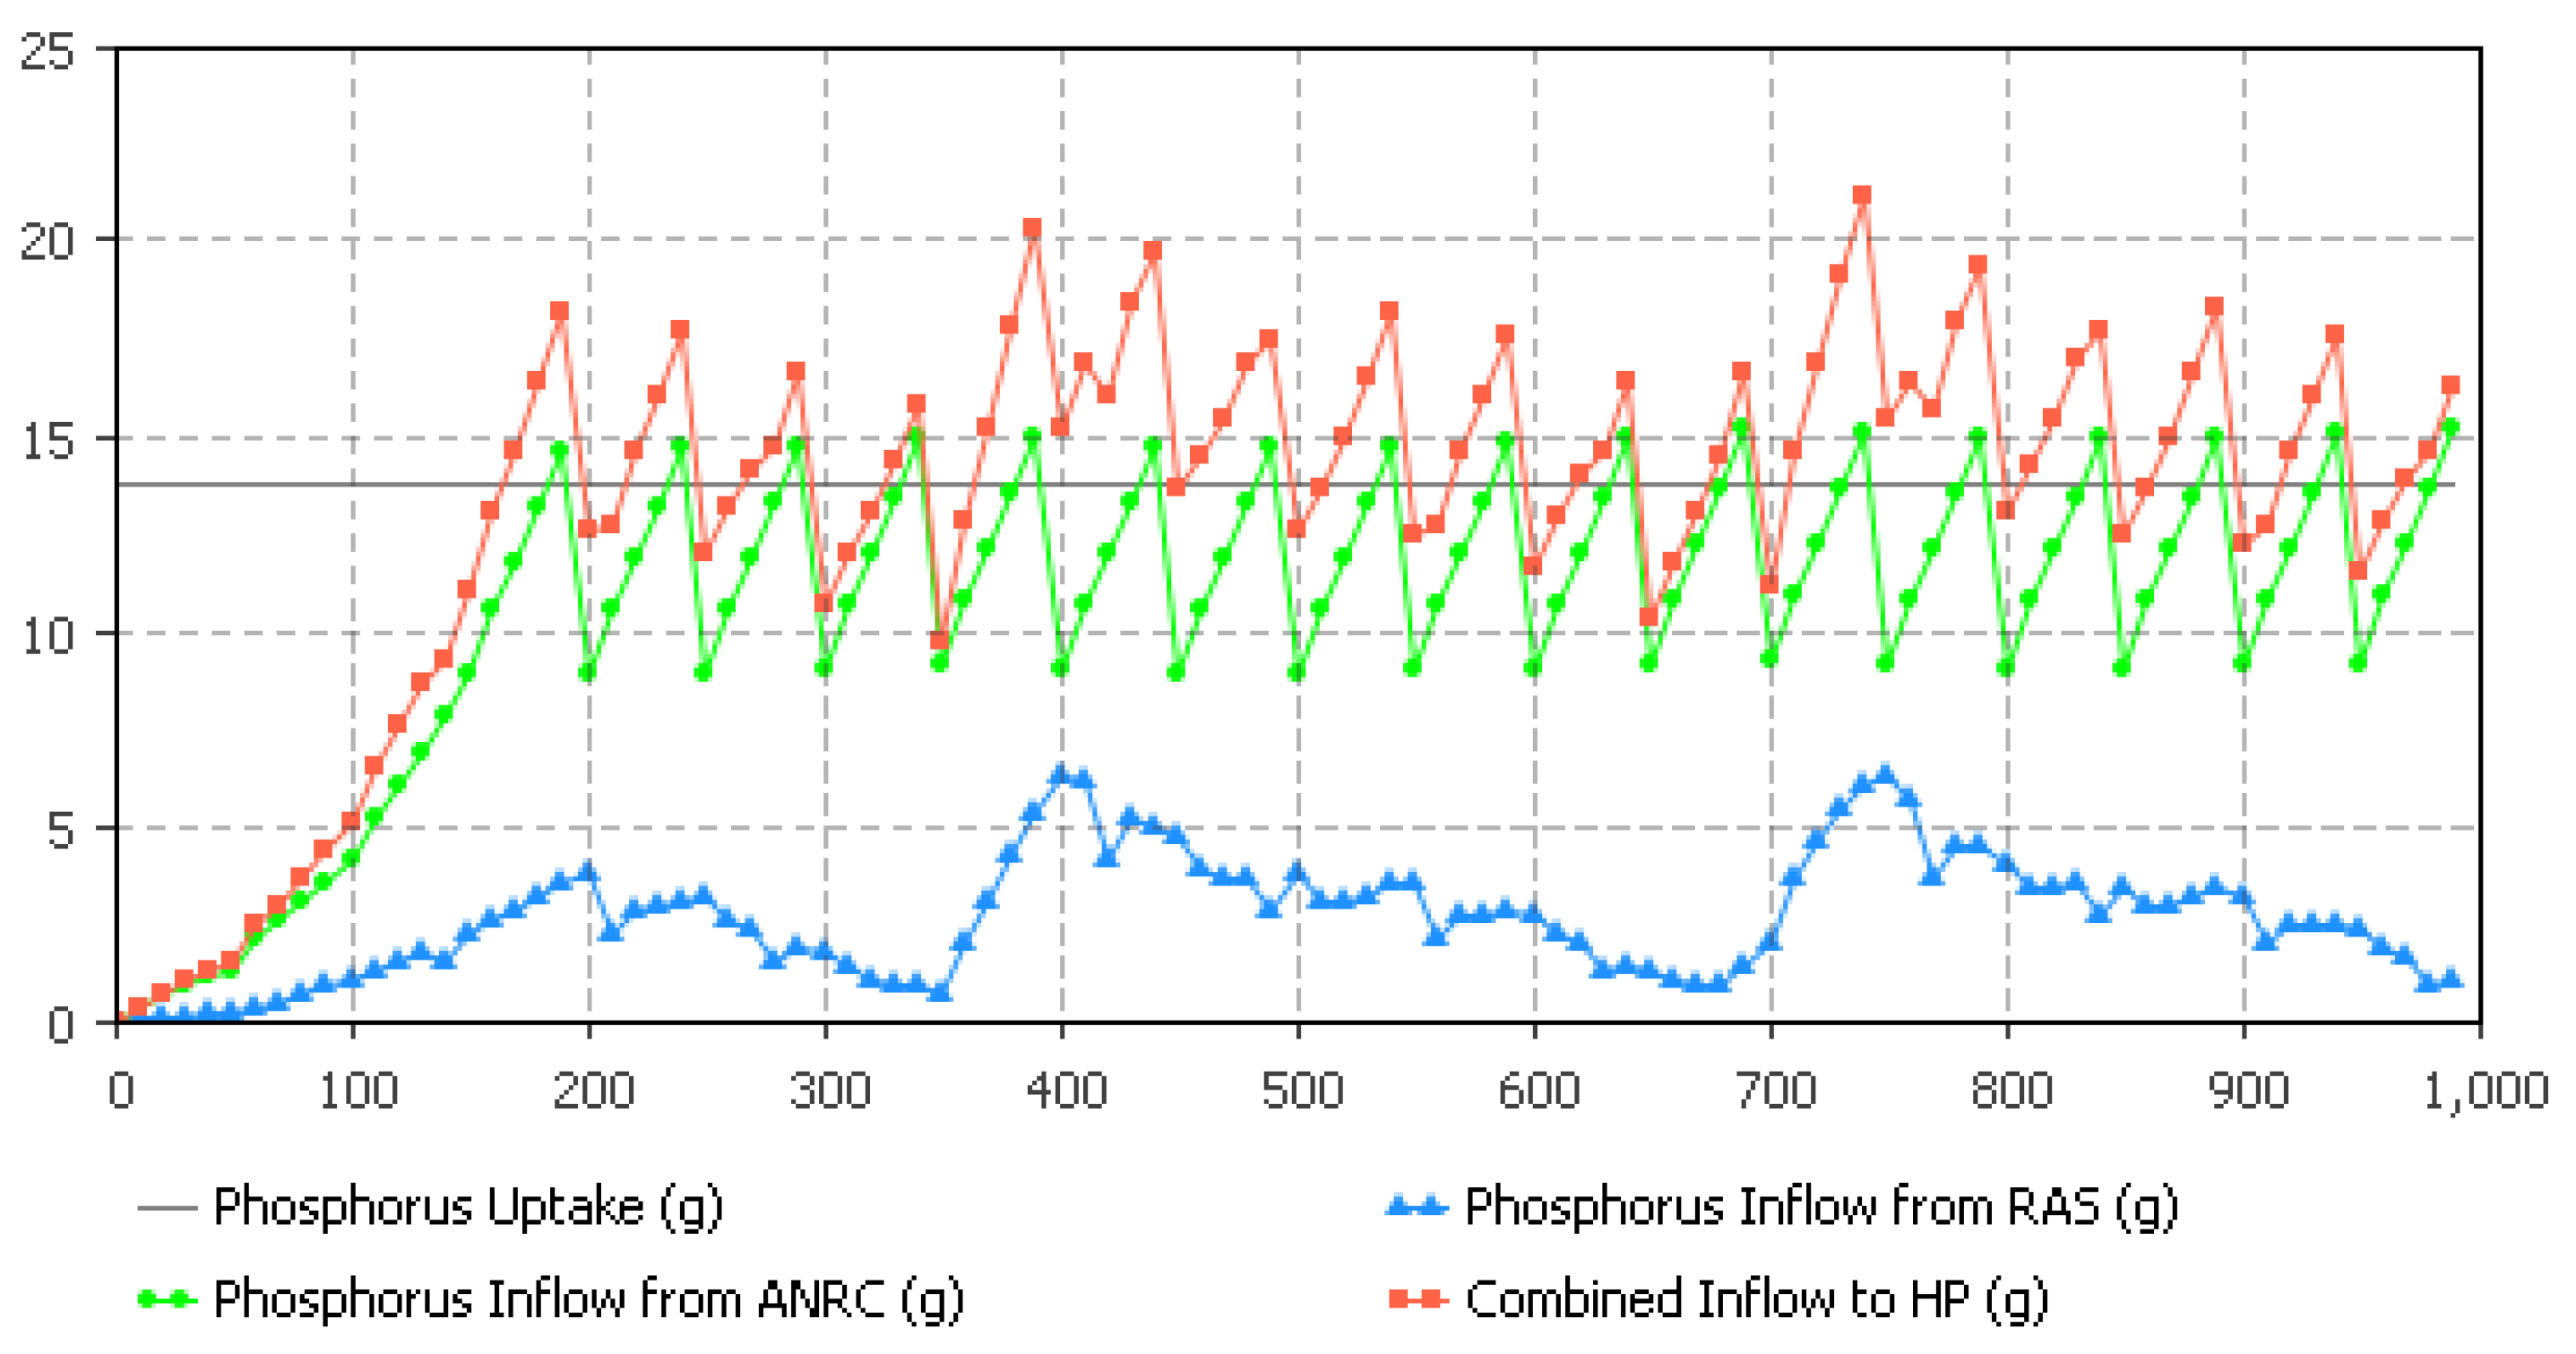
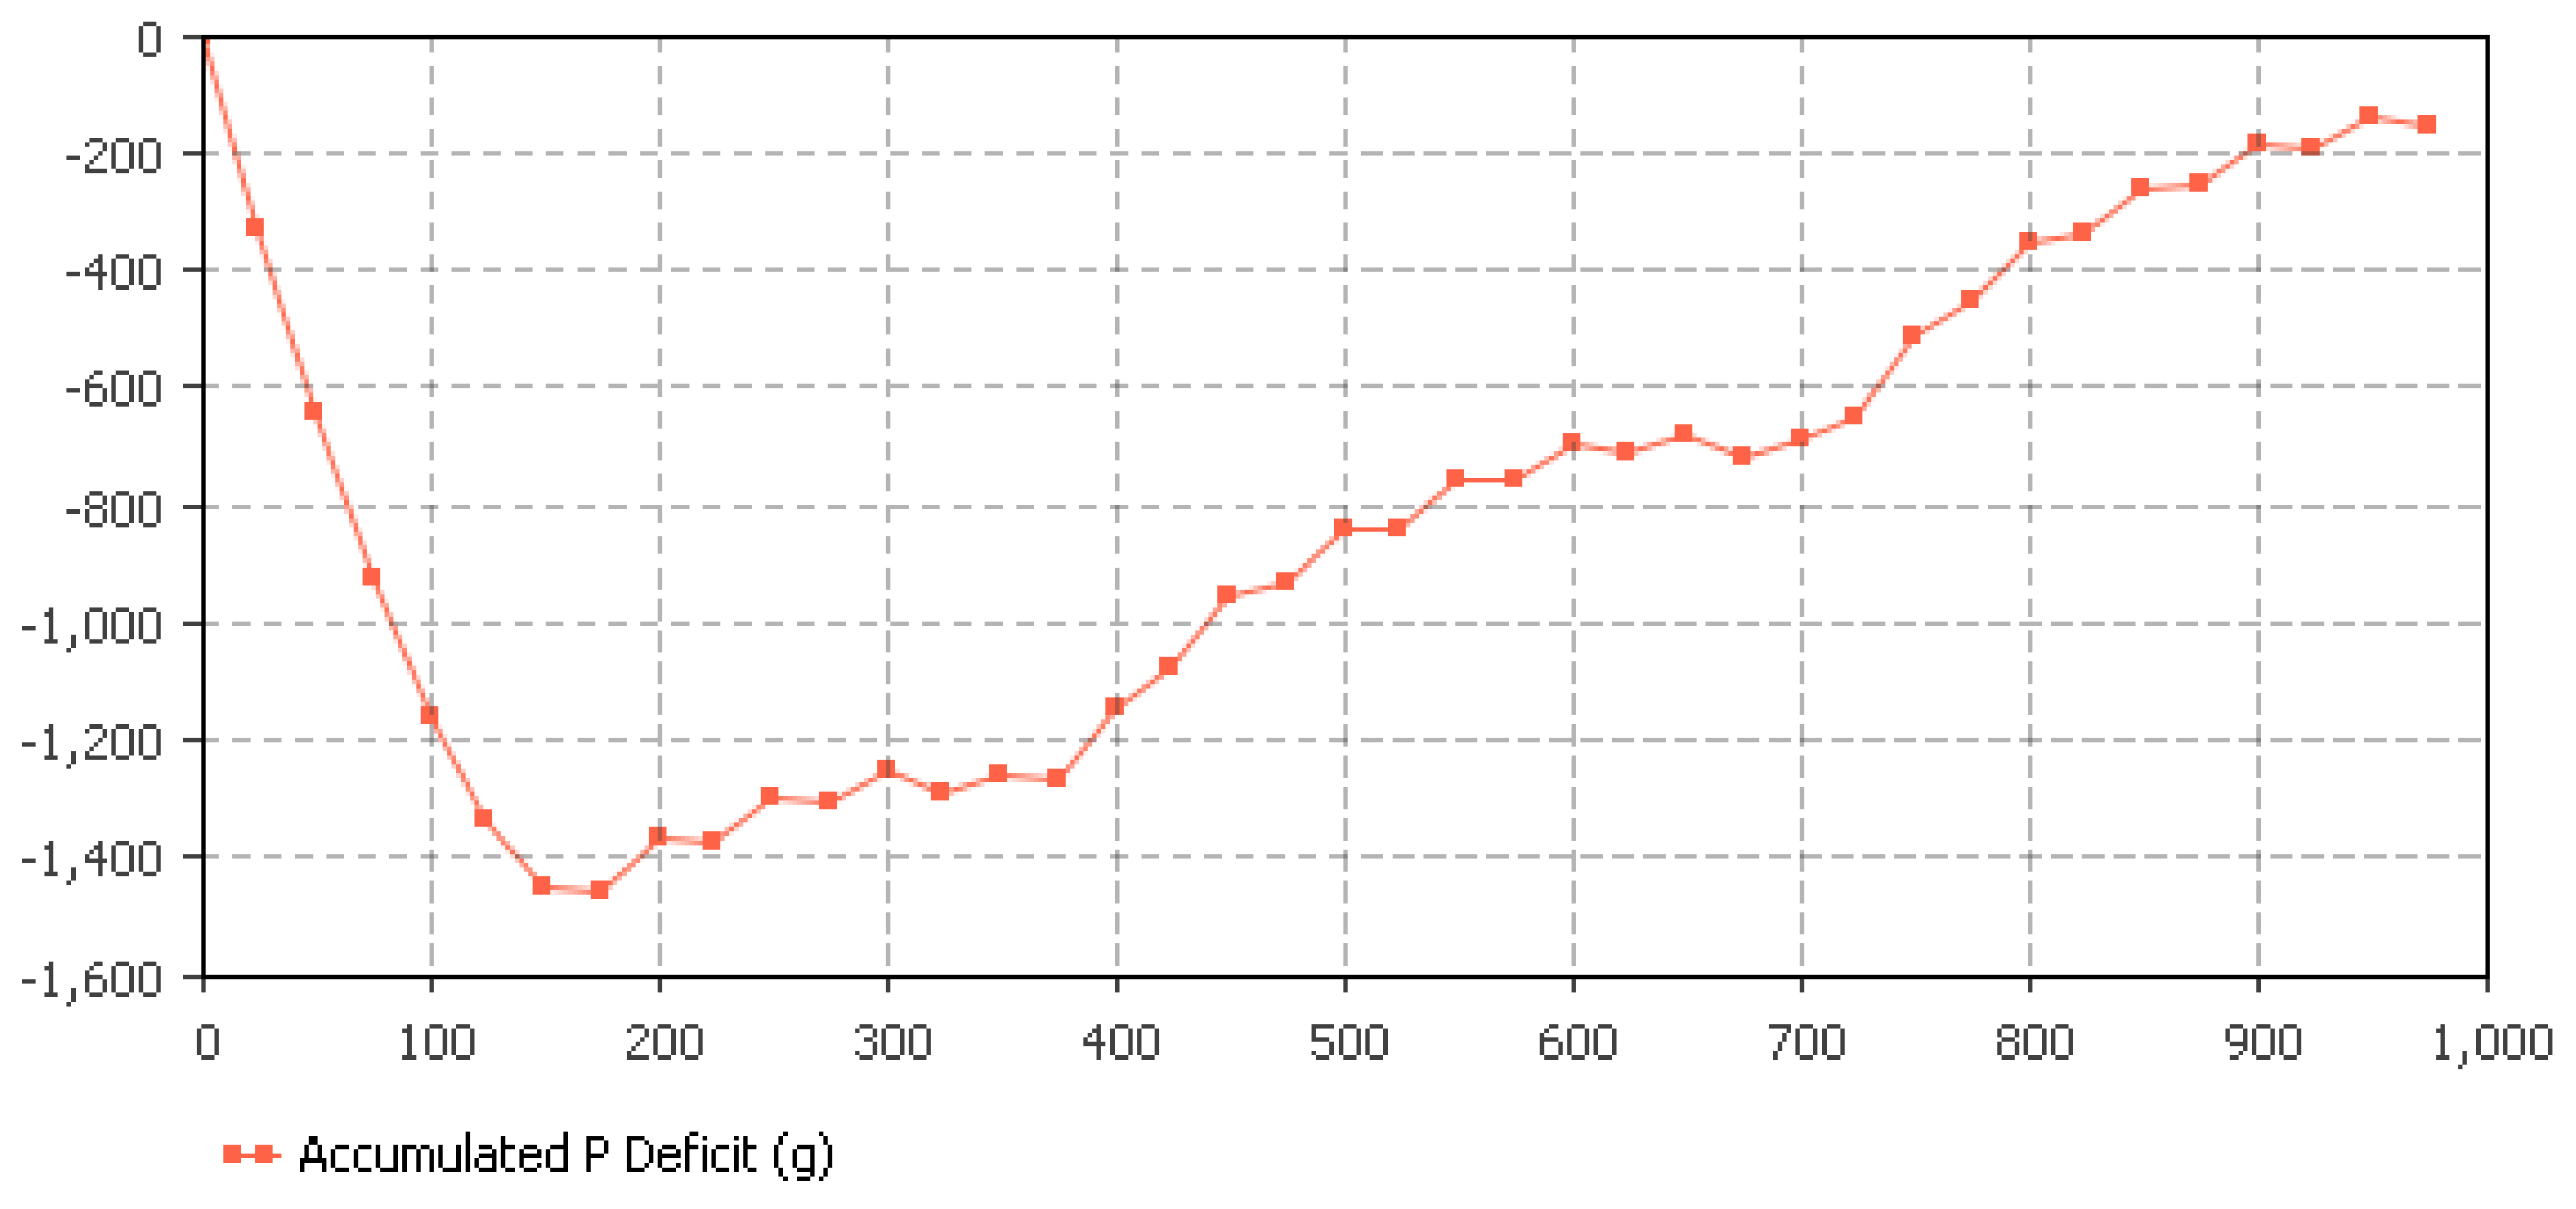
5.3. Hydroponics Sizing Based on P Availability

Figure 16 shows the P dynamics in the hydroponic component with a cultivation area of 600 m2, when running the model for 1000 days under natural light conditions (growing lettuce as it requires low light intensities allowing for an extended production period). This optimization step determines a sufficient cultivation area based on the P inflow from both RAS and ANRC to the hydroponic component. The nutrient remineralization results in the fact that a much higher amount of plants can be supplied with P; i.e., in this case 600 m2. At fish biomass saturation (Figure 17) the P availability is expected to correct its deficit. Consequently, when starting the system, P would have to be added until day 150. Alternatively, one could cultivate an area that is proportional to the amount of fish tanks that are in use, and adapt it accordingly.

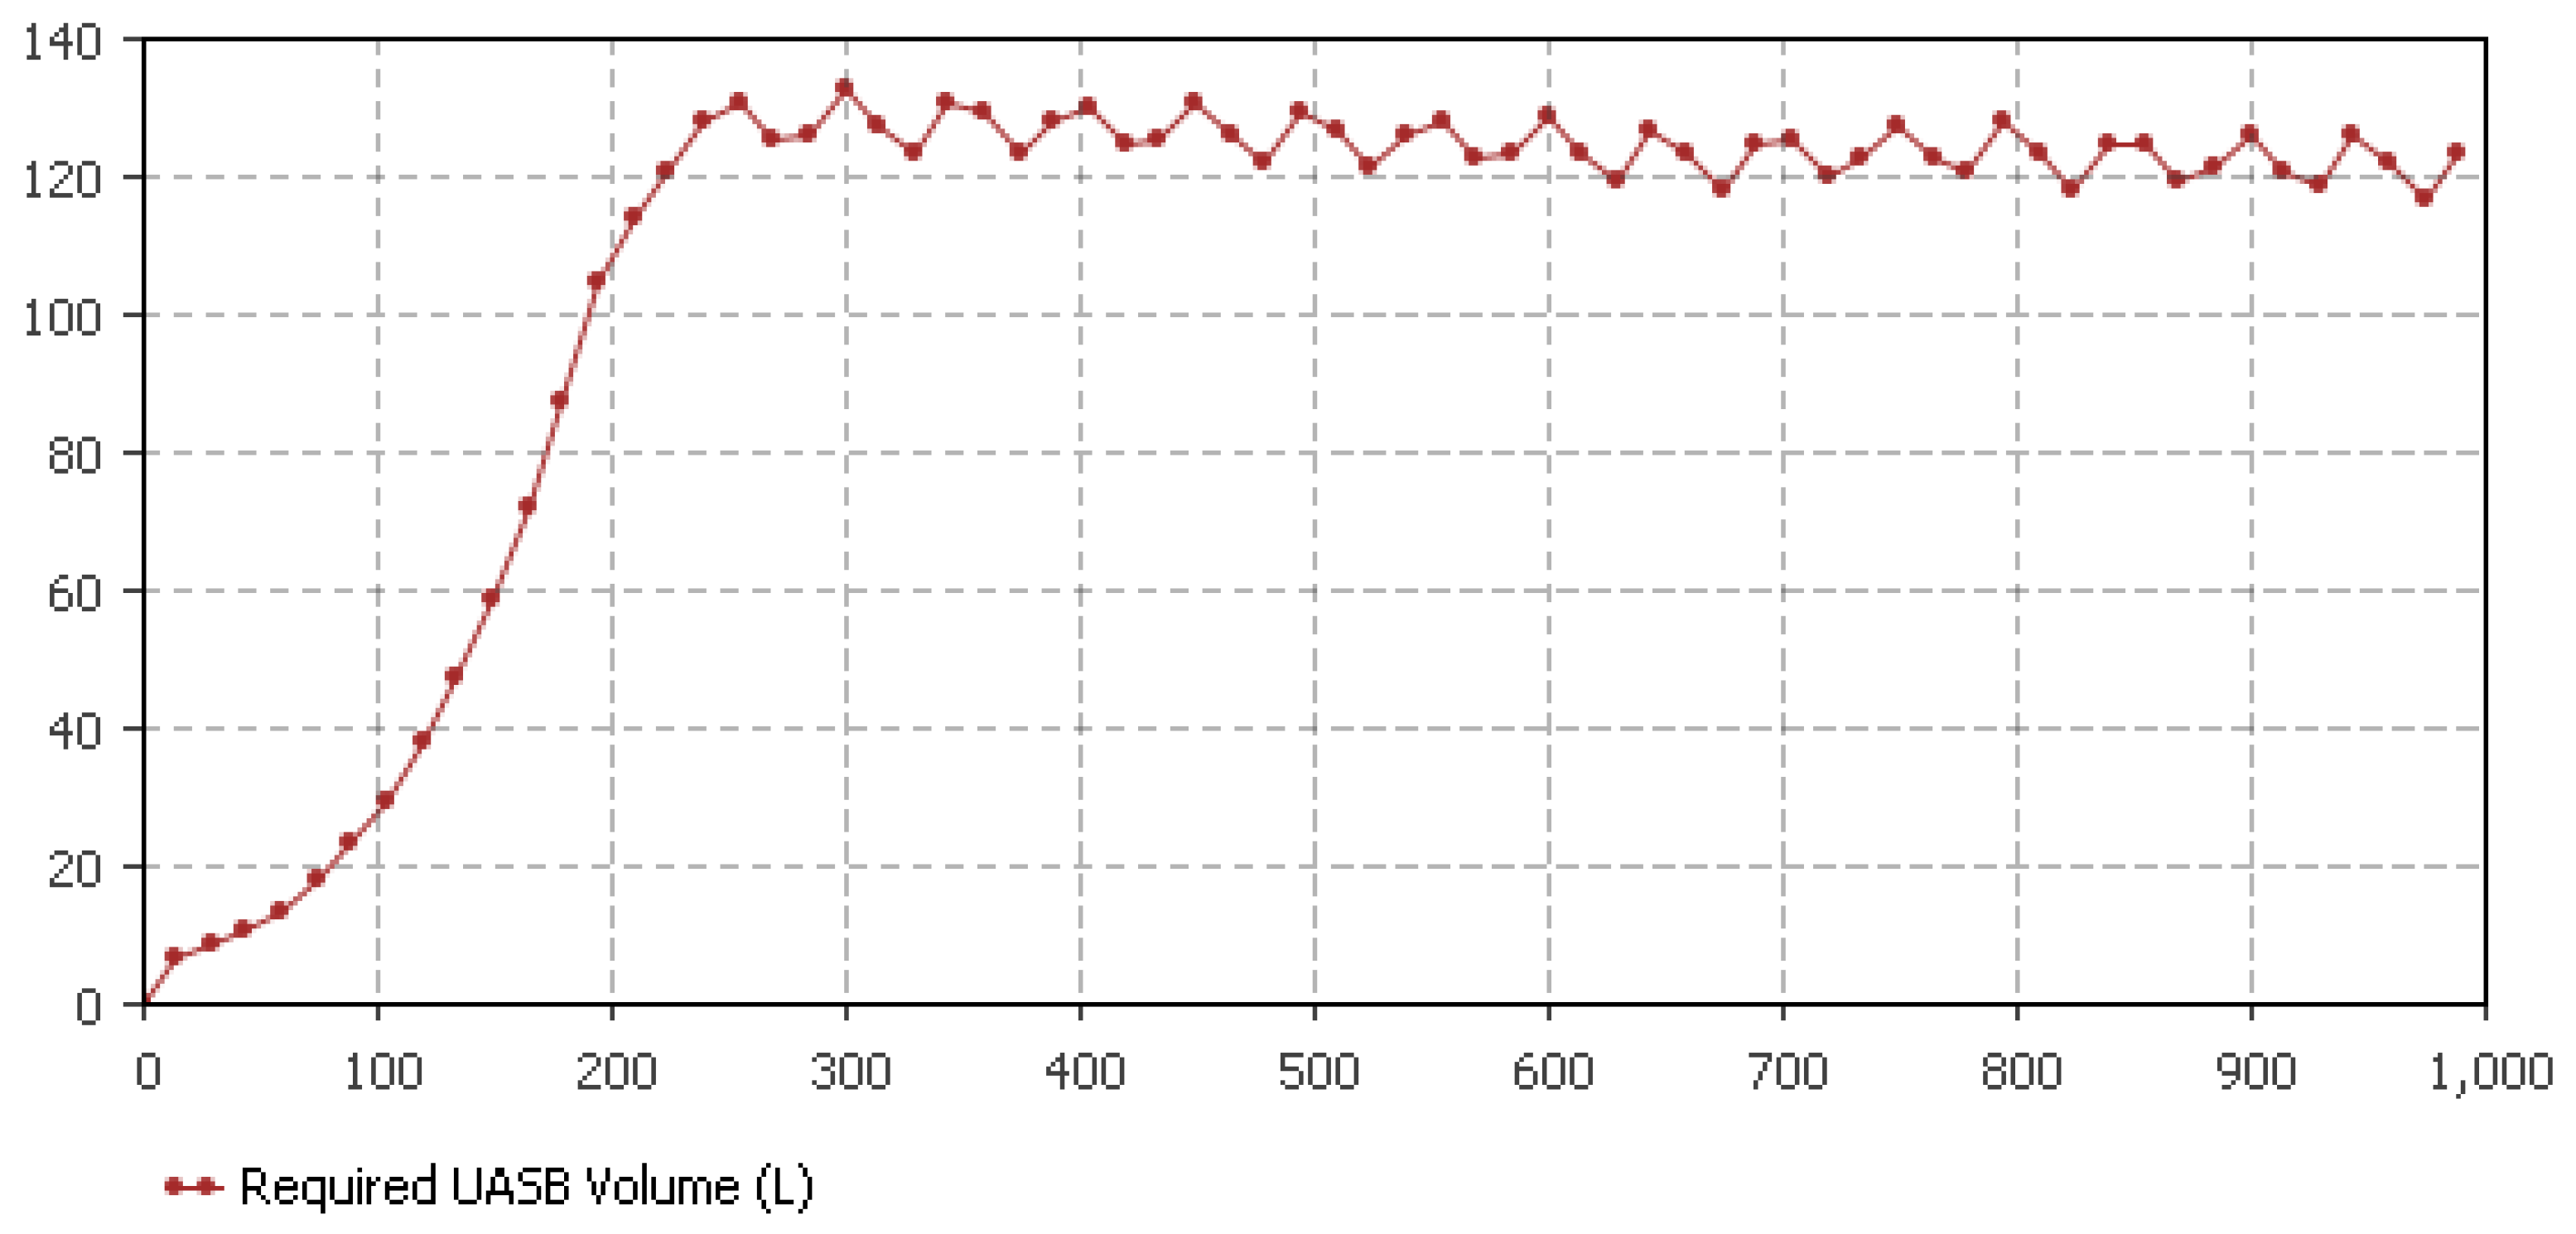
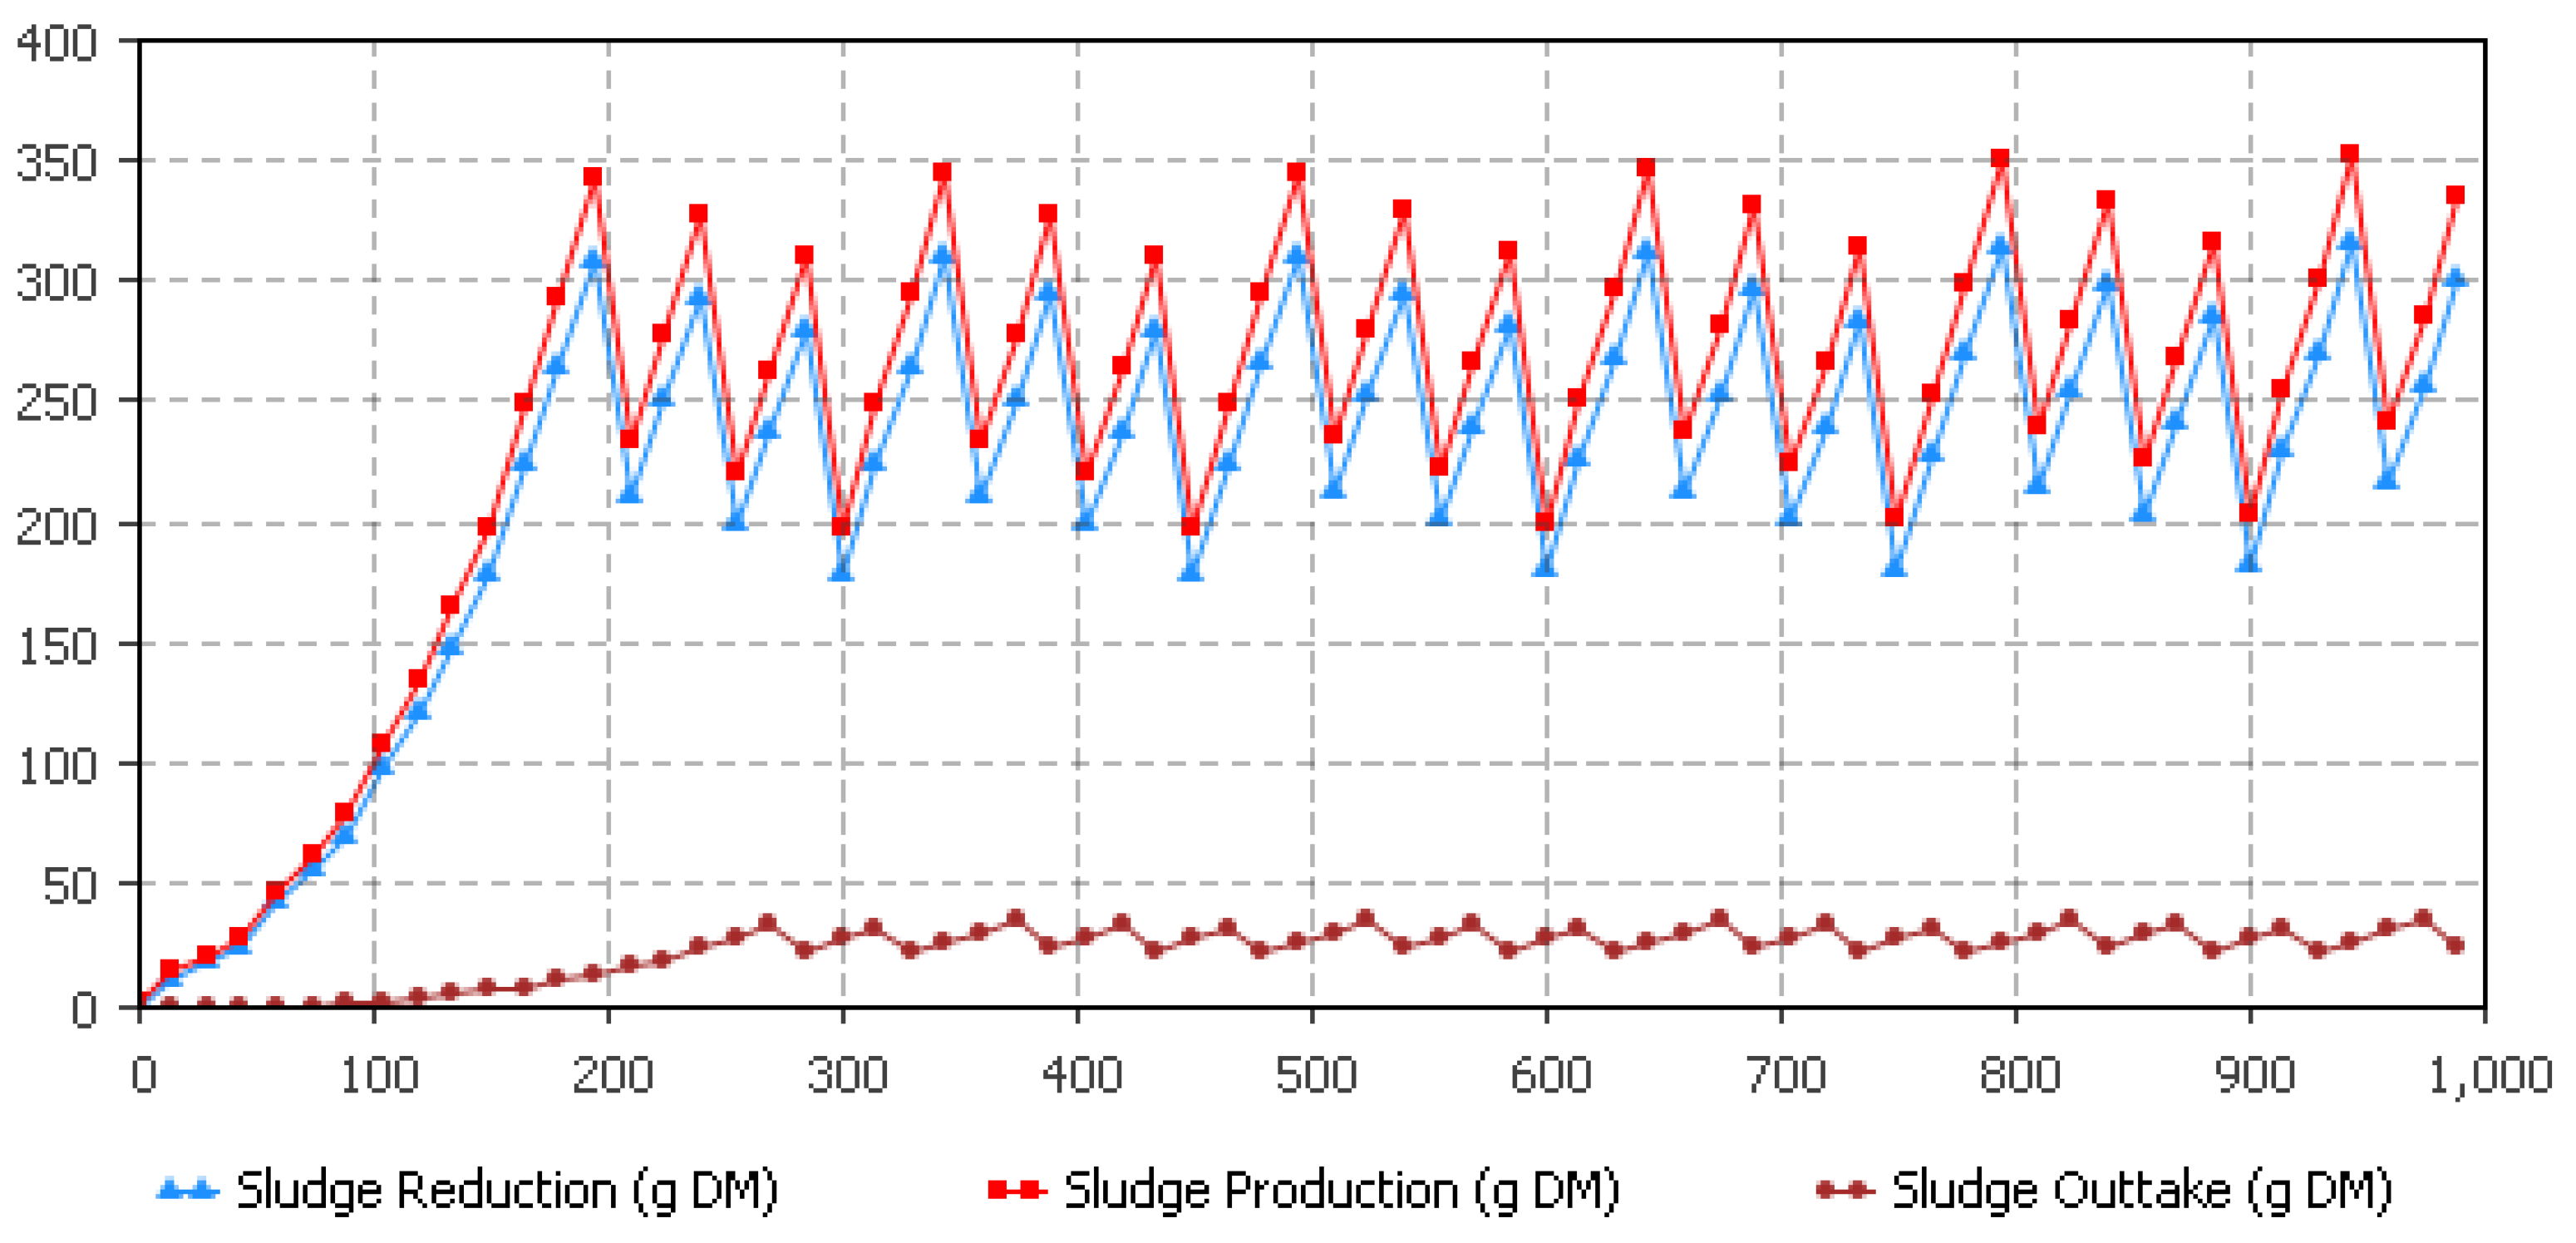
5.4. UASB Sizing Determination

Figure 18 shows the maximum load of the UASB in liters of sludge, whereas Figure 19 displays the sludge flow within the UASB. To achieve an upflow of 0.5 m·h−1 a circulation pump with a sufficient capacity is needed. Sizing a UASB should be treated with caution, as the sludge concentration has a high impact on the volume requirement. For this analysis, a TSS proportion of 3% was considered. Sludge that is not pre-treated (i.e., pre-concentrated) most likely has a lower TSS proportion and thus requires a higher UASB reactor volume.

6. Discussion

The main purpose of this study was to elaborate an integrated design approach for DAPS and to spot possible drawbacks based on a system dynamics model that has been developed here. The findings of this theoretical study indicate that the evapotranspiration rate will have a high impact on the RAS water quality in DAPS. This is because the water use in the hydroponic component is the main factor for RAS water replacement (and thus refill with clean water) that regulates water quality (Figure 14, Figure 15 and Figure 16). As a consequence of this dependency, determining the evapotranspiration rate of a specific plant species appears to be a crucial step when designing a DAPS. A comparison between natural lighting (Figure 12) and artificial greenhouse lighting (Figure 13) underpins these findings and additionally shows a considerably greater potential for cultivating sensitive fish species. To what degree artificial lighting pays out needs to be explored in a crop and fish dependent economic assessment. Another option—mainly for RAS focused systems—to regulate the nitrate levels in the RAS is the implementation of a denitrification tank. This conflicts with the general objective of aquaponics that aims at using all available nutrients and, dependent on the carbon source used (e.g., formalin, methanol), raises concerns about the consumer safety. DAPS that follow an even more goal-oriented approach by recycling generated sludge, however, should not waste resources unnecessarily. On that score, a hybrid system as illustrated in Figure 20 could be a viable alternative for regulating nitrate levels in the RAS. To size the N-regulating hybrid part, Licamele [9] provides the sizing parameter of 2.5 kg fish feed for the production of 16 lettuce plants.
Sizing the hydroponics cultivation area of a DAPS requires another approach than in a balanced one-loop system. Whereas it is custom to take feed as a sizing factor, in DAPS, it might be more reasonable to size the hydroponic component based on the evapotranspiration potential and other macronutrient availabilities. There are two main reasons: (1) the remineralization capacity of N is low, whereas it is expected to be high for other macro nutrients; (2) Since nutrient supplementation in DAPS is managed anyway to achieve highly concentrated nutrient solutions, it is more favorable to add N as it is largely available and cheap. In contrast, P being a declining and limited resource on earth [83], should be recycled to a high degree and not added from an external source. The result showed that enough P for lettuce was available to cultivate at least 600 m2 of lettuce with a density of 16 lettuce plants per m2. Taking this as a reference parameter, the graphs of the variation experiments (Figure 12 and Figure 13) display good water qualities for this cultivation area. With respect to the hybrid approach, only the ANRC effluents can be used in order to size the decoupled hydroponic component.
In DAPS, the nutrient and water use efficiency is quite remarkable, as an agricultural irrigation efficiency of 10% would free up more water than is evaporated off by all other users [84]. The results showed that also in terms of P-recycling this approach is progressive as P for agricultural purposes is a limited fossil resource [4] (i.e., this refers to soil-based agriculture as well as fertilization in hydroponic systems) and P-recycling is crucial to avoid world hunger [19,85]. Nevertheless, the sludge remineralization has to be applied with caution. Zekki et al. [86] reported that nutrient solution recycling could lead to declining harvests in NFT systems. It is suspected that this is most likely due to sulfate ion accumulation in the nutrient solution. However, since it dilutes in the DAPS hydroponic component, it can be expected to be high enough to avoid negative impact on plant growth.
For commercial aquaponic systems, DAPS might provide the best solution on the long run, as running the sub-systems semi-autonomously allows the supplementation of nutrients that are only required by the plant crop separately, in a smaller volume, and without any consequences for the water quality in the RAS. In addition, compared to intensive aquaculture, coupled as well as decoupled approaches can improve the water quality in the fish rearing tanks as accumulation of nitrate is reduced. As reported from commercial scale aquaponic production systems, sublethal effects on growth performance, feed conversion, health, but also reproductive functions may substantially impede harvest yield and profitability when nitrate levels in water exceed species-specific thresholds [22,23,87].
We must, however, remark that this study is of a theoretical kind and needs to be verified. Even though there is sufficient knowledge about the impact of several parameters on RAS, the effect of (long term) accumulation of nutrients on plant growth (and nutrient uptake rates) still remains to be determined. The same applies to the impact of different HRTs on the nutrient remineralization performance. More information about it is needed under different environmental conditions in order to determine the optimal settings for DAPS. Moreover, upscaling effects need to be integrated in the future to add robustness to the model. It is also not clear yet, whether the use of DAPS is economically feasible. Still, we believe that restrictions on nutrient emissions and associated cost of wastewater disposal in the future will most probably be a major driver for aquaponic development. To figure this out, further investigations integrating the economic side are required.

7. Conclusions

AnyLogic software and system dynamics analysis constituted a valuable tool to understand the dynamics and design boundaries of DAPS. During the last decades, scientific aquaponics literature was mainly based on one-loop aquaponic systems. However, this approach results from a trade-off between RAS and hydroponics instead of meeting the optimal conditions for the respective sub-systems. Even though there is no empirical data on the productivity of the system’s hydroponic component, we conclude that in terms of nutrient and water recycling the system contributes to closing the cycle. The results showed that sizing the system is contingent on the evapotranspiration rate. The higher the evapotranspiration rate, the smaller the required hydroponic cultivation area. The AnyLogic outcome showed that this is particularly relevant when focusing on sensitive fish species. In the long term, this is of great relevance as fertilizer costs are rising with the increasing world population as well as the demand for no-emission systems minimizing environmental impact. Regarding the ANRC, further research is needed with respect to its remineralization performance depending on different HRT and SRT. This and the specific nutrient uptake of plants in a DAPS hydroponic environment are required to substantiate the current DAPS model. In conclusion, it can be said that while technical research in this area is important, additional geographically dependent follow-up studies are needed, dealing with the economically viable size of DAPS as well as the comparison with equivalent hydroponic systems.

Acknowledgments

The work was partly supported by Aquaponik Manufaktur GmbH and the COST Action FA1305: The EU Aquaponics Hub-Realizing Sustainable Integrated Fish and Vegetable Production for the EU. In addition, big “tack” goes to Stefan Bengtsson for providing constructive feedback.

Author Contributions

Simon Goddek is the main author of this manuscript. He was assisted by the other co-authors in form and content.

Conflicts of Interest

The authors declare no conflict of interest.

Appendix A

The software diagram is split up in multiple parts for overview reasons (see Figure A1, Figure A2, Figure A3 and Figure A4). The whole software diagram can be accessed via the main author and/or supplementary material.
Figure A1. Software diagram of one fish tank of the RAS part of the AnyLogic model. The feed rate is linked to the total feed rate in Figure A2.
Water 08 00303 g021
Figure A2. Software diagram of the nitrogen and phosphorus balance in the whole RAS system. The inflow is linked to Figure 13, whereas the outflow is linked to Figure A3 (ANRC) and Figure A4 (hydroponics).
Water 08 00303 g022
Figure A3. Software diagram covering sludge balance as well as the remineralization rate of P in the ANRC. (a) Anaerobic remineralization performance; (b) P flow of the ANRC.
Water 08 00303 g023
Figure A4. Software diagram of the hydroponic system consists of water, nitrogen, and phosphorus balances. The water balance is affected by the evapotranspiration rate under the given conditions, the nutrient and phosphorus balance is linked to the lettuce nutrient uptake and the inflow from RAS and ANRC. A negative nutrient stock means that additional nutrient supplementation is required.
Water 08 00303 g024

Appendix B

The CLDs provide a good overview of the causal loop relationships of the three autonomous system components: RAS, hydroponics, and ANRC. They have served as a basis for the AnyLogic software diagrams.
Figure B1. Causal loop diagram of the RAS. Together with the flow charts in Figure 5, Figure 7, Figure 8 and Figure 9, this CLD was used to create the RAS AnyLogic model shown in the Appendix Figure A1 and Figure A2. The CLD shows the impact of different water quality parameters on fish growth as well as the impact of the feed rate on the RAS-derived TAN and nitrate concentrations. The CLD comprises of several inputs of which the design inputs (e.g., amount of fish per m2) that are fixed and the control inputs (such as pH, temperature, and feed input, etc.) are dynamic.
Water 08 00303 g025
Figure B2. Causal loop diagram (CLD) of nitrogen in hydroponics. This CLD shows the dependencies for plant N uptake and illustrates complex N processes in a hydroponic system. Remarkable is the fact that the nitrate concentration has an impact on the root:shoot ratio. In one-loop aquaponic systems the nitrate concentration is known to be quite low as a result of trade-offs between the RAS and hydroponic sub-systems. Consequently, higher concentrated DAPS hydroponic nutrient solutions are expected to generate more shoot and less root biomass. Together with the flow charts shown in Figure 5, Figure 8 and Figure 9 and the FAO Penman-Monteith equation this lead to a simplified hydroponic AnyLogic model as can be seen in the Appendix Figure A4.
Water 08 00303 g026
Figure B3. Causal loop diagram of the UASB. The remineralization mechanisms of the UASB show the impact of SRT and HRT on the remineralization rate, and reactor size determination. The corresponding AnyLogic model is illustrated in the Appendix Figure A3.
Water 08 00303 g027

References

  1. Rakocy, J.E. Aquaponics-Integrating Fish and Plant Culture; Wiley-Blackwell: Hoboken, NJ, USA, 2012; pp. 344–386. [Google Scholar]
  2. Graber, A.; Junge, R. Aquaponic systems: Nutrient recycling from fish wastewater by vegetable production. Desalination 2009, 246, 147–156. [Google Scholar] [CrossRef]
  3. Vermeulen, T.; Kamstra, A. The need for systems design for robust aquaponic systems in the urban environment. Int. Symp. Soil. Cultiv. 2013, 1004, 71–78. [Google Scholar] [CrossRef]
  4. Goddek, S.; Delaide, B.; Mankasingh, U.; Ragnarsdottir, K.; Jijakli, H.; Thorarinsdottir, R. Challenges of Sustainable and commercial aquaponics. Sustainability 2015, 7, 4199–4224. [Google Scholar] [CrossRef]
  5. Kloas, W.; Groß, R.; Baganz, D.; Graupner, J.; Monsees, H.; Schmidt, U.; Staaks, G.; Suhl, J.; Tschirner, M.; Wittstock, B.; et al. A new concept for aquaponic systems to improve sustainability, increase productivity, and reduce environmental impacts. Aquac. Environ. Interact. 2015, 7, 179–192. [Google Scholar] [CrossRef]
  6. Jijakli, M.H.; Delaide, B.; Gott, J. Plant Production Capacity and Nutrient Mass Balance in the PAFF Box, an Urban Aquaponics Module: Preliminary Findings; Geography and Environment University of Southampton: Southampton, UK, 2016. [Google Scholar]
  7. Goddek, S. Three-loop Aquaponics Systems: Chances and challenges. In Proceedings of the International Conference on Aquaponics Research Matters, Ljubljana, Slovenia, 22 March 2016.
  8. Seawright, D.E.; Stickney, R.R.; Walker, R.B. Nutrient dynamics in integrated aquaculture-hydroponics systems. Aquaculture 1998, 160, 215–237. [Google Scholar] [CrossRef]
  9. Licamele, J.D. Biomass Production and Nutrient Dynamics in an Aquaponics System. Ph.D. Thesis, University of Arizona, Tucson, AZ, USA, 2009. [Google Scholar]
  10. Neto, R.M.; Ostrensky, A. Nutrient load estimation in the waste of Nile tilapia Oreochromis niloticus (L.) reared in cages in tropical climate conditions. Aquac. Res. 2013, 46, 1309–1322. [Google Scholar] [CrossRef]
  11. Adler, P.R.; Summerfelt, S.T.; Glenn, D.M.; Takeda, F. Evaluation of the effect of a conveyor production strategy on lettuce and basil productivity and phosphorus removal from aquaculture wastewater. In Proceedings of the Second International Conference on Recycling the Resource Ecological Engineering for Wastewater Treatment, Waedenswil-Zurich, Switzerland, 18–22 September 1995; Staudenmann, J., Schönborn, A., Etnier, C., Eds.; Trans Tech Publications: Waedenswil-Zurich, Switzerland, 1996; pp. 131–136. [Google Scholar]
  12. Roosta, H.R.; Hamidpour, M. Effects of foliar application of some macro- and micro-nutrients on tomato plants in aquaponic and hydroponic systems. Sci. Hortic. (Amst.) 2011, 129, 396–402. [Google Scholar] [CrossRef]
  13. Savidov, N.A.; Hutchings, E.; Rakocy, J.E. Fish and plant production in a recirculating aquaponic system: A new approach to sustainable agriculture in Canada. Acta Hortic. 2007, 742, 209–222. [Google Scholar] [CrossRef]
  14. Rakocy, J.E.; Bailey, D.S.; Shultz, K.A.; Cole, W.M. Evaluation of a commercial-scale aquaponic unit for the production of tilapia and lettuce. In Proceedings of the 4th International Symposium on Tilapia in Aquaculture, Orlando, FL, USA, 9–12 November 1997; pp. 357–372.
  15. Mirzoyan, N.; Tal, Y.; Gross, A. Anaerobic digestion of sludge from intensive recirculating aquaculture systems: Review. Aquaculture 2010, 306, 1–6. [Google Scholar] [CrossRef]
  16. Mirzoyan, N.; McDonald, R.C.; Gross, A. anaerobic treatment of brackishwater aquaculture sludge: An alternative to waste stabilization ponds. J. World Aquac. Soc. 2012, 43, 238–248. [Google Scholar] [CrossRef]
  17. Mirzoyan, N.; Gross, A. Use of UASB reactors for brackish aquaculture sludge digestion under different conditions. Water Res. 2013, 47, 2843–2850. [Google Scholar] [CrossRef] [PubMed]
  18. Sterman, J. Business Dynamics: Systems Thinking and Modeling for a Complex World; McGraw Hill: New York, NY, USA, 2000. [Google Scholar]
  19. Sverdrup, H.U.; Ragnarsdottir, K.V. Challenging the planetary boundaries II: Assessing the sustainable global population and phosphate supply, using a systems dynamics assessment model. Appl. Geochem. 2011, 26, S307–S310. [Google Scholar] [CrossRef]
  20. Borshchev, A. The Big Book of Simulation Modeling; AnyLogic North America: Chicago, IL, USA, 2013. [Google Scholar]
  21. Schrader, K.K.; Davidson, J.W.; Summerfelt, S.T. Evaluation of the impact of nitrate-nitrogen levels in recirculating aquaculture systems on concentrations of the off-flavor compounds geosmin and 2-methylisoborneol in water and rainbow trout (Oncorhynchus mykiss). Aquac. Eng. 2013, 57, 126–130. [Google Scholar] [CrossRef]
  22. Davidson, J.; Good, C.; Welsh, C.; Summerfelt, S.T. Abnormal swimming behavior and increased deformities in rainbow trout Oncorhynchus mykiss cultured in low exchange water recirculating aquaculture systems. Aquac. Eng. 2011, 45, 109–117. [Google Scholar] [CrossRef]
  23. Davidson, J.; Good, C.; Welsh, C.; Summerfelt, S.T. Comparing the effects of high vs. low nitrate on the health, performance, and welfare of juvenile rainbow trout Oncorhynchus mykiss within water recirculating aquaculture systems. Aquac. Eng. 2014, 59, 30–40. [Google Scholar] [CrossRef]
  24. Bonachela, S.; González, A.M.; Fernández, M.D. Irrigation scheduling of plastic greenhouse vegetable crops based on historical weather data. Irrig. Sci. 2006, 25, 53–62. [Google Scholar] [CrossRef]
  25. FAO. FAO Irrigation and Drainage Paper: Crop Evapotranspiration; Allen, R.G., Pereira, L.S., Raes, D., Smith, M., Eds.; FAO: Rome, Italy, 1998. [Google Scholar]
  26. Zolnier, S.; Lyra, G.B.; Gates, R.S. Evapotranspiration estimates for greenhouse lettuce using an intermittent nutrient film technique. Am. Soc. Agric. Biol. Eng. 2004, 47, 271–282. [Google Scholar] [CrossRef]
  27. Boulard, T. Evapotranspiration in greenhouses. Encycl. Water Sci. 2003. [Google Scholar] [CrossRef]
  28. Jolliet, O.; Bailey, B. The effect of climate on tomato transpiration in greenhouses: Measurements and models comparison. Agric. For. Meteorol. 1992, 58, 43–62. [Google Scholar] [CrossRef]
  29. Fernández, M.D.; Bonachela, S.; Orgaz, F.; Thompson, R.; López, J.C.; Granados, M.R.; Gallardo, M.; Fereres, E. Measurement and estimation of plastic greenhouse reference evapotranspiration in a Mediterranean climate. Irrig. Sci. 2010, 28, 497–509. [Google Scholar] [CrossRef]
  30. Möller, M.; Assouline, S. Effects of a shading screen on microclimate and crop water requirements. Irrig. Sci. 2006, 25, 171–181. [Google Scholar] [CrossRef]
  31. Deutscher Wetterdienst WESTE-XL. Available online: https://kunden.dwd.de/weste (accessed on 13 September 2015).
  32. Timmons, M.B.; Ebeling, J.M. Recirculating Aquaculture, 3rd ed.; Ithaca Publishing Company LLC: Ithaca, NY, USA, 2013. [Google Scholar]
  33. Rakocy, J.E.; Masser, M.P.; Losordo, T.M. Recirculating Aquaculture Tank Production Systems: Aquaponics—Integrating Fish and Plant Culture; Southern Regional Aquaculture Centre: Stoneville, MS, USA, 2006; pp. 1–16. [Google Scholar]
  34. Gullian-Klanian, M.; Arámburu-Adame, C. Rendimiento de juveniles de tilapia del Nilo Oreochromis niloticus en un sistema híperintensivo de recirculación acuícola con mínimo recambio de agua. Lat. Am. J. Aquat. Res. 2013, 41, 150–162. [Google Scholar]
  35. El-Shafai, S.A.; El-Gohary, F.A.; Nasr, F.A.; van der Steen, N.P.; Gijzen, H.J. Chronic ammonia toxicity to duckweed-fed tilapia (Oreochromis niloticus). Aquaculture 2004, 232, 117–127. [Google Scholar] [CrossRef]
  36. Al-Hafedh, Y.S.; Alam, A.; Alam, M.A. Performance of plastic biofilter media with different configuration in a water recirculation system for the culture of Nile tilapia (Oreochromis niloticus). Aquac. Eng. 2003, 29, 139–154. [Google Scholar] [CrossRef]
  37. Dalsgaard, J.; Lund, I.; Thorarinsdottir, R.; Drengstig, A.; Arvonen, K.; Pedersen, P.B. Farming different species in RAS in Nordic countries: Current status and future perspectives. Aquac. Eng. 2013, 53, 2–13. [Google Scholar] [CrossRef] [Green Version]
  38. DeLong, D.P.; Losordo, T.M.; Rakocy, J.E. Tank Culture of Tilapia; Southern Regional Aquaculture Centre: Stoneville, MS, USA, 2009; No. 282. [Google Scholar]
  39. Eding, E.H.; Verdegem, M.; Martins, C.; Schlaman, G.; Heinsbroek, L.; Laarhoven, B.; Ende, S.; Verreth, J.; Aartsen, F.; Bierbooms, V. Tilapia farming using Recirculating Aquaculture Systems (RAS)—Case study in the Netherlands. In Handbook for Sustainable Aquaculture; Eurofish International Organisation: Copenhagen, Denmark, 2009. [Google Scholar]
  40. Veras, G.C.; Murgas, L.D.S.; Rosa, P.V.; Zangeronimo, M.G.; da Ferreira, M.S.S.; Leon, J.A.S.-D. Effect of photoperiod on locomotor activity, growth, feed efficiency and gonadal development of Nile tilapia. Rev. Bras. Zootec. 2013, 42, 844–849. [Google Scholar] [CrossRef]
  41. Resh, H.M. Hydroponic Food Production: A Definitive Guidebook for the Advanced Home Gardener and the Commercial Hydroponic Grower; CRC Press: Boca Raton, FL, USA, 2012. [Google Scholar]
  42. Appels, L.; Baeyens, J.; Degrève, J.; Dewil, R. Principles and potential of the anaerobic digestion of waste-activated sludge. Prog. Energy Combust. Sci. 2008, 34, 755–781. [Google Scholar] [CrossRef]
  43. Zhao, L.; Guo, J.; Lian, J.; Guo, Y.; Yue, L.; Gou, C.; Zhang, C.; Liu, X. Study of the dynamics and material transformation characteristics of nitrite denitrification in UASB. Biotechnol. Biotechnol. Equip. 2015, 29, 907–914. [Google Scholar] [CrossRef]
  44. Cuervolopez, F.; Martinez, F.; Gutierrezrojas, M.; Noyola, R.; Gomez, J. Effect of nitrogen loading rate and carbon source on denitrification and sludge settleability in upflow anaerobic sludge blanket (UASB) reactors. Water Sci. Technol. 1999, 40, 123–130. [Google Scholar] [CrossRef]
  45. Lettinga, G.; Pol, L.W.H. UASB-process design for various types of wastewaters. Water Sci. Technol. 1991, 24, 87–107. [Google Scholar]
  46. Ross, L.G. Environmental physiology and energetics. In Tilapias: Biology and Exploitation; McAndrew, B.J., Ed.; Springer Netherlands: Dordrecht, The Netherlands, 2000; pp. 89–128. [Google Scholar]
  47. Alfredo, M.H.; Hector, S.L. Blood gasometric trends in hybrid red tilapia Oreochromis niloticus (Linnaeus) × O. mossambicus (Peters) while adapting to increasing salinity. J. Aquac. Trop. 2002, 17, 101–112. [Google Scholar]
  48. El-Sayed, A.-F.M. Tilapia Culture; CABI Publishing: Oxfordshire, UK, 2006. [Google Scholar]
  49. FAO. Cultured Aquatic Species Information Programme. Oncorhynchus Mykiss. Available online: http://www.fao.org/fishery/culturedspecies/Oncorhynchus_mykiss/en (accessed on 21 August 2015).
  50. Finstad, B.; Staurnes, M.; Reite, O.B. Effect of low temperature on sea-water tolerance in rainbow trout, Salmo gairdneri. Aquaculture 1988, 72, 319–328. [Google Scholar] [CrossRef]
  51. Coghlan, S.M.; Ringler, N.H. Temperature-dependent effects of rainbow trout on growth of atlantic salmon parr. J. Great Lakes Res. 2005, 31, 386–396. [Google Scholar] [CrossRef]
  52. Azevedo, P.A.; Podemski, C.L.; Hesslein, R.H.; Kasian, S.E.M.; Findlay, D.L.; Bureau, D.P. Estimation of waste outputs by a rainbow trout cage farm using a nutritional approach and monitoring of lake water quality. Aquaculture 2011, 311, 175–186. [Google Scholar] [CrossRef]
  53. Westin, D.T. Nitrate and nitrite toxicity to salmonid fishes. Progress Fish-Cult. 1974, 36, 86–89. [Google Scholar] [CrossRef]
  54. Barton, B.A. Principles of Salmonid Culture; Developments in Aquaculture and Fisheries Science; Elsevier: Amsterdam, The Netherlands, 1996; Volume 29. [Google Scholar]
  55. Wedemeyer, G. Physiology of Fish in Intensive Culture Systems; Springer: Berlin, Germany, 1996. [Google Scholar]
  56. FAO. Cultured Aquatic Species Information Programme. Clarias Gariepinus. Available online: http://www.fao.org/fishery/culturedspecies/Clarias_gariepinus/en (accessed on 21 August 2015).
  57. Wellborn, T.L. Channel Catfish: Life History and Biology; Southern Regional Aquaculture Centre: Stoneville, MS, USA, 1988. [Google Scholar]
  58. Tucker, C.S.; Hargreaves, J.A. Biology and Culture of Channel Catfish; Elsevier Science Ltd.: Amsterdam, The Netherlands, 2004. [Google Scholar]
  59. Horváth, L.; Tamás, G.; Seagrave, C. Carp and Pond Fish Culture, 2nd ed.; Blackwell Science Ltd.: Oxford, UK, 2002. [Google Scholar]
  60. FAO. Cultured Aquatic Species Information Programme. Sander Lucioperca. Available online: http://www.fao.org/fishery/culturedspecies/Sander_lucioperca/en (accessed on 21 August 2015).
  61. Keen, G.A.; Prosser, J.I. Interrelationship between pH and surface growth of Nitrobacter. Soil Biol. Biochem. 1987, 19, 665–672. [Google Scholar] [CrossRef]
  62. Tyson, R.V.; Simonne, E.H.; Davis, M.; Lamb, E.M.; White, J.M.; Treadwell, D.D. Effect of nutrient solution, nitrate-nitrogen concentration, and pH on nitrification rate in Perlite medium. J. Plant Nutr. 2007, 30, 901–913. [Google Scholar] [CrossRef]
  63. Parker, R. Aquaculture Science, 2nd ed.; Delmar Publications: Clifton Park, NY, USA, 2002. [Google Scholar]
  64. Huang, Z.; Gedalanga, P.B.; Asvapathanagul, P.; Olson, B.H. Influence of physicochemical and operational parameters on Nitrobacter and Nitrospira communities in an aerobic activated sludge bioreactor. Water Res. 2010, 44, 4351–4358. [Google Scholar] [CrossRef] [PubMed]
  65. Blackburne, R.; Vadivelu, V.M.; Yuan, Z.; Keller, J. Kinetic characterisation of an enriched Nitrospira culture with comparison to Nitrobacter. Water Res. 2007, 41, 3033–3042. [Google Scholar] [CrossRef] [PubMed]
  66. Sonneveld, C.; Voogt, W. Plant Nutrition of Greenhouse Crops; Springer Netherlands: Dordrecht, The Netherlands, 2009. [Google Scholar]
  67. Resh, H.M. Hydroponic Tomatoes; Taylor and Francis: Abingdon, UK, 2002. [Google Scholar]
  68. Kafkafi, U.; Tarchitzky, J. Fertigation: A Tool for Efficient Water and Nutrient Management; IFA and IPI: Paris, France, 2011. [Google Scholar]
  69. Chen, Y.; He, J.; Mu, Y.; Huo, Y.-C.; Zhang, Z.; Kotsopoulos, T.A.; Zeng, R.J. Mathematical modeling of upflow anaerobic sludge blanket (UASB) reactors: Simultaneous accounting for hydrodynamics and bio-dynamics. Chem. Eng. Sci. 2015, 137, 677–684. [Google Scholar] [CrossRef]
  70. Lu, X.; Zhen, G.; Estrada, A.L.; Chen, M.; Ni, J.; Hojo, T.; Kubota, K.; Li, Y.-Y. Operation performance and granule characterization of upflow anaerobic sludge blanket (UASB) reactor treating wastewater with starch as the sole carbon source. Bioresour. Technol. 2015, 180, 264–273. [Google Scholar] [CrossRef] [PubMed]
  71. Alvarez, R.; Lidén, G. The effect of temperature variation on biomethanation at high altitude. Bioresour. Technol. 2008, 99, 7278–7284. [Google Scholar] [CrossRef] [PubMed]
  72. Rakocy, J.E.; Shultz, R.C.; Bailey, D.S.; Thoman, E.S. Aquaponic Production of Tilapia and Basil: Comparing a Batch and Staggered Cropping System; Nichols, M.A., Ed.; University of the Virgin Islands: St. Croix, VI, USA, 2004; Volume 648, pp. 63–69. [Google Scholar]
  73. Davidson, J.; Summerfelt, S.T. Solids removal from a coldwater recirculating system—Comparison of a swirl separator and a radial-flow settler. Aquac. Eng. 2005, 33, 47–61. [Google Scholar] [CrossRef]
  74. Rafiee, G.; Saad, C.R. Nutrient cycle and sludge production during different stages of red tilapia (Oreochromis sp.) growth in a recirculating aquaculture system. Aquaculture 2005, 244, 109–118. [Google Scholar] [CrossRef]
  75. Suhr, K.I.; Letelier-Gordo, C.O.; Lund, I. Anaerobic digestion of solid waste in RAS: Effect of reactor type on the biochemical acidogenic potential (BAP) and assessment of the biochemical methane potential (BMP) by a batch assay. Aquac. Eng. 2015, 65, 65–71. [Google Scholar] [CrossRef] [Green Version]
  76. Lambers, H.; Chapin, F.S.; Pons, T.L. Plant Physiological Ecology, 2nd ed.; Springer: Berlin, Germany, 2008. [Google Scholar]
  77. Steingrobe, B.; Schenk, M.K. A model relating the maximum nitrate inflow of lettuce (Lactuca satvia L.) to the growth of roots and shoots. Plant Soil 1994, 162, 249–257. [Google Scholar] [CrossRef]
  78. Letey, J.; Jarrell, W.M.; Valoras, N. Nitrogen and water uptake patterns and growth of plants at various minimum solution nitrate concentrations. J. Plant Nutr. 1982, 5, 73–89. [Google Scholar] [CrossRef]
  79. Mathieu, J.; Linker, R.; Levine, L.; Albright, L.; Both, A.J.; Spanswick, R.; Wheeler, R.; Wheeler, E.; de Villiers, D.; Langhans, R. Evaluation of the nicolet model for simulation of short-term hydroponic lettuce growth and nitrate uptake. Biosyst. Eng. 2006, 95, 323–337. [Google Scholar] [CrossRef]
  80. Klas, S.; Mozes, N.; Lahav, O. Development of a single-sludge denitrification method for nitrate removal from RAS effluents: Lab-scale results vs. model prediction. Aquaculture 2006, 259, 342–353. [Google Scholar] [CrossRef]
  81. González-González, A.; Cuadros, F. Effect of aerobic pretreatment on anaerobic digestion of olive mill wastewater (OMWW): An ecoefficient treatment. Food Bioprod. Process. 2015, 95, 339–345. [Google Scholar] [CrossRef]
  82. Van Rijn, J. Waste treatment in recirculating aquaculture systems. Aquac. Eng. 2013, 53, 49–56. [Google Scholar] [CrossRef]
  83. Dawson, C.J.; Hilton, J. Fertiliser availability in a resource-limited world: Production and recycling of nitrogen and phosphorus. Food Policy 2011, 36, S14–S22. [Google Scholar] [CrossRef]
  84. Rogers, P. Facing the freshwater crisis. Sci. Am. 2008, 299, 46–53. [Google Scholar] [CrossRef] [PubMed]
  85. Ragnarsdottir, K.V.; Sverdrup, H.U.; Koca, D. Challenging the planetary boundaries I: Basic principles of an integrated model for phosphorous supply dynamics and global population size. Appl. Geochem. 2011, 26, S303–S306. [Google Scholar] [CrossRef]
  86. Zekki, H.; Gauthier, L.; Gosselin, A. Growth, productivity, and mineral composition of hydroponically cultivated greenhouse tomatoes, with or without nutrient solution recycling. J. Am. Soc. Hortic. Sci. 1996, 121, 1082–1088. [Google Scholar]
  87. Van Bussel, C.G.J.; Schroeder, J.P.; Wuertz, S.; Schulz, C. The chronic effect of nitrate on production performance and health status of juvenile turbot (Psetta maxima). Aquaculture 2012, 326–329, 163–167. [Google Scholar] [CrossRef]
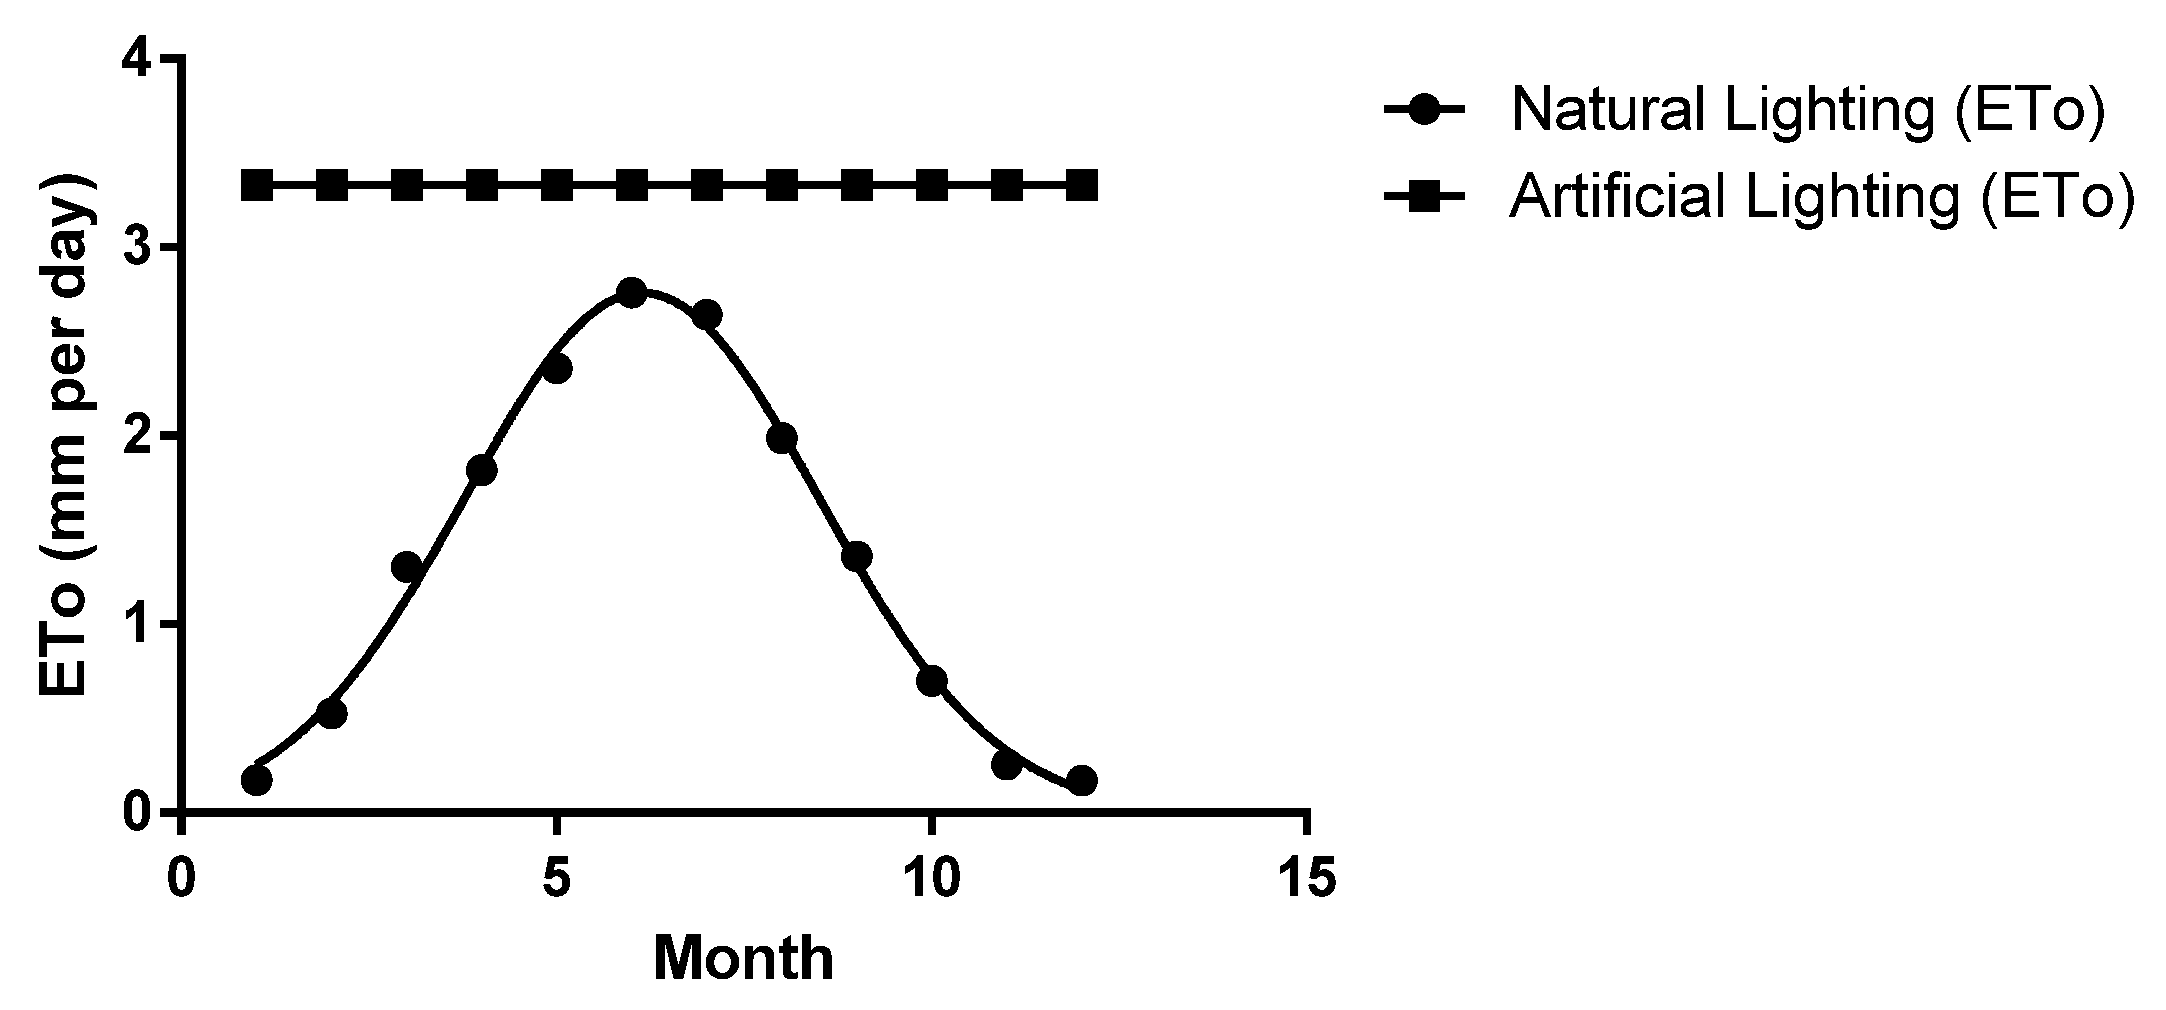
Figure 1. Lettuce crop coefficient for non-covered and surface covered cultivation assuming planting of seedlings after 15 days (in the graph shown as day 0).
Water 08 00303 g001
Figure 2. Reference evapotranspiration (ETo in mm/day) upon plain natural lighting (Köln-Bonn) or at constant radiation using (additional) artificial light.
Water 08 00303 g002
Figure 3. Process flow drawing of a basic DAPS layout. The blue tags comprise the RAS component, the green tags the hydroponic component, and the red tags the ANRC components. The level of each component is illustrated numerically in the small box and refers to the vertical direction the flow needs to travel to; whereas high numbers refer to high positioning and low numbers to low positioning. Gravity flow occurs, when water flows from high levels to low levels, and pressurized flow is required when the flow goes from low to high numbers.
Water 08 00303 g003
Figure 4. Water flow in a RAS system, whereas the tank represents the whole RAS system comprising all parts of a RAS (this is also applicable to the following figures). In terms of sustainability, the water use efficiency presents a drawback of this approach, as water is discharged to maintain an acceptable water quality for the fish. This constitutes a waste of water and nutrient resources as well as nutrient emissions. In addition, the nutrient-rich sludge often is not reused for fertilizing purposes, but instead is discharged to the sewage system.
Water 08 00303 g004
Figure 5. Water flow in a one-loop aquaponic system. This system approach provides the basis for aquaponics. Unlike RAS, the nutrient-rich water is not discharged, but instead used for the fertilization of a plant crop. Both components are exposed to similar water conditions. In one-loop systems the water primarily leaves the system via the crop evapotranspiration (ETc) and the sludge. Minor water loss can be seen in the integrated water flow chart in Figure 9.
Water 08 00303 g005
Figure 6. Water flow in a DAPS. As the ANRC is expected to remove most of the N, active denitrification might be needed in the RAS to reduce the nitrate concentration. This is especially the case if the water flow to the hydroponic component is not sufficient to keep the RAS water quality at a desired level. The flow chart also shows other amendments to the one-loop aquaponic system approach: (1) an ANRC that remineralizes the sludge and reduces water and fertilizer requirements; and (2) manual nutrient supplementation and nutritious ANRC nutrient outflows provide the hydroponic component with optimal nutrient concentrations that do not dilute in the whole system.
Water 08 00303 g006
Figure 7. Fluctuation of the water composition is closely linked with the system’s nutrient input. As the main input in aquaponic systems is fish feed, aquaponic systems should be running with fish of several growth stages to ensure a close to constant uniform feed input to the system. The amount of fish does not change drastically; different fish sizes were used for illustration purposes only.
Water 08 00303 g007
Figure 8. The water flow chart shows the water flows within a DAPS system. It can be seen, that the implementation of an ANRC has an impact on the water availability in the system. Even though, the water loss through evapotranspiration outweighs the loss through sludge removal, it is still an important step towards closing the cycle.
Water 08 00303 g008
Figure 9. Flow chart for nutrients within a DAPS. The accumulation of nutrients can be allocated to edible parts of the plants, edible parts of the fish (i.e., fish fillet) and waste. The dashed line shows the impact of an ANRC on the nutrient flows. Recycled nutrients are added to the hydroponic water and can accumulate in the plant tissues, while fish are not exposed to deleterious nutrient concentrations in the water.
Water 08 00303 g009
Figure 10. Outcome of a parameter variation experiment assessing the amount of required fish to achieve a maximum stocking density (y-axis) of 50 kg·m−3 per tank. The days are displayed on the x-axis. For this simulation, approximately 100 fish were needed to meet that objective.
Water 08 00303 g010
Figure 11. Average biomass per fish tank and total fish biomass of all fish tanks (in g; y-axis) in the RAS for the first 1000 days (x-axis). Fish biomass peaks every 50 days corresponding to the proposed harvest schedule.
Water 08 00303 g011
Figure 12. Parameter variation experiment estimating the RAS-derived N-NO3 concentration in mg/L (y-axis) based on different cultivation area (m2) options under natural light conditions. The days are displayed on the x-axis. It can be seen that 200 mg/L N-NO3 are not exceeded, when having 100 m2 cultivation area.
Water 08 00303 g012
Figure 13. Parameter variation experiment for estimated N-NO3 concentration (in mg/L) when using different cultivation areas (in m2) Compared to the exclusive use of natural light, the application of artificial light for industrial production shows a different picture. The y-axis shows the RAS N-NO3 concentration, whereas the x-axis displays the days.
Water 08 00303 g013
Figure 14. The evapotranspiration dependency for the water flow (in L; y-axis) from RAS to the hydroponic component can be seen clearly in this figure showing the flow from the RAS to the hydroponic component under natural light conditions. The days are displayed on the x-axis.
Water 08 00303 g014
Figure 15. Dependent on the evapotranspiration rate (Figure 14), different nitrate flows from RAS to the hydroponic component can be observed. The RAS nitrate balance in mg·L−1 (y-axis) for the first 1000 days (x-axis) can be seen using exclusively natural illumination and a cultivation area of 600 m2.
Water 08 00303 g015
Figure 16. P dynamics in the hydroponic component with a cultivation area of 600 m2. The P lettuce consumption (y-axis) is assumed being constant, although this is not the case. However, this does not diminish the lettuces N total uptake. The days are displayed on the x-axis.
Water 08 00303 g016
Figure 17. Accumulated P (y-axis) deficit in the system’s hydroponic component with a cultivation area of 600 m2. After 1000 days (x-axis), the deficit is almost corrected.
Water 08 00303 g017
Figure 18. The required volume (L) of the UASB is dependent on the inflowing sludge, its SRT, and the HRT. Here, we assume that the sludge blanket covers 60% of the UASB reactor’s volume. Thus, the total filling capacity is around 140 L and serves as a good indication for sizing the reactor. The days are displayed on the x-axis.
Water 08 00303 g018
Figure 19. Graphical comparison between sludge production, sludge reduction, and sludge outtake assuming a TSS reduction of 90%, a HRT of 10 days, and an SRT of 80 days (y-axis). The days are displayed on the x-axis.
Water 08 00303 g019
Figure 20. The hybrid decoupled system is a combination of the one-loop and the decoupled approach. Whereas the one-loop aquaponic system is regulating the nitrate of the RAS system, the decoupled hydroponic part utilizes the recycled nutrients from the ANRC. Especially for systems that focus on fish production, their advantage is that no denitrification, and thus no waste of nitrate is required.
Water 08 00303 g020
Table 1. Observed sunshine hours (per month) and the respective estimated reference evaporation (ETo in mm/day) for Köln-Bonn.
ParametersJanuaryFebruaryMarchAprilMayJuneJulyAugustSeptemberOctoberNovemberDecember
Sun73.475.8187.5143.9168.8212.1209.8150.7135.499.668.118.0
ETo0.180.531.301.822.362.762.641.991.360.700.260.17
Table 2. Optimal growth parameters for tilapia.
ParameterThreshold for Optimal GrowthReferences
TAN (mg/L)<2.9[35]
NO2-N (mg/L)<0.5–1[36]
NO3-N (mg/L)<100–200[37]
T (°C)27–29[38]
O2 (mg/L)4–6[39]
pH6–9[38]
Photoperiod18L:6D[40]
Table 3. Optimal conditions for different fish in RAS (i.e., tilapia, European perch and rainbow trout), plant species in hydroponic conditions (i.e., lettuce and tomato), biofiltration efficiency being a part of RAS, and anaerobic digestion.
Sub-SystemSpecies/TypepHEC (mS·cm−1) or SalinityOptimal Temp (°C)Ammonia (mg·L−1)Dissolved Oxygen (ml·L−1)Hardness (CaCO3 in mg·L−1)
RASOreochromis niloticus (Nile tilapia)7–9 [46]salinity: <15‰ [47]29.5 [32]; 27–30 [48]<0.1 N-NH4 [48]Optimal: 5.0 [38]
Oncorhynchus mykiss (Rainbow trout)6.5–8.5 [49]salinity: <26‰ [50]15 [51,52]<0.0125 N-NH3 [53]~100% [49]>200 [54,55]; 10–400 [49]
Clarias gariepinus (Catfish)7 [56]salinity: 0‰–4‰ [57]; <4‰–6‰; optimum 0.5‰ [58]25–30 [58]; 28 [56]<2.5 N-NH3 [56]Optimal: 5–6 [59]>20–30 [58]
Sander lucioperca, syn. Stizostedion lucioperca (Pike-Perch)6.5–8.2 [60] 27–28 [60]<0.40 TAN [60]>50% [60]
Bio filterNitrobacter7.5 [61], 7.8 [62] 20–30 [63]; 24–25 [64] >1 [65]
Nitrospira8.3 [65] 29–30 [64]; 30–35 [65]
Nitrosomonas7.8 [62] 20–30 [63]
HydroponicsLactuca sativa (Lettuce)5.5–6.5 [41]1–2 mS/cm [41]21–25 [41]<10 N-NH4 [66]
Lycopersicon esculentum (Tomato)6.3–6.5 [67]>2.5 reduces yield [68]18–24 [67]
DigesterUpflow Anaerobic Sludge Blanket reactor (UASB)7.4 [16,69] 35 [70,71] ~0
Table 4. Suggested hydroponic nutrient solution (ppm) vs. observed aquaponic nutrient solution (ppm) for lettuce, and the percentage difference of aquaponics with respect to optimal hydroponic conditions.
SystempHEC (mS·cm−1)N-NO3N-NH4P-PO4KCaMgS-SO4FeSource
Hydroponics5.5–5.81.5–2.01652550210200401135[41]
Aquaponics7.0–7.60.7–0.842.22.28.244.911.96.5152.5 (supplemented)[14,72]
Gap to Hydroponics (%) 74.491.283.6899483.786.750.0
Table 5. Nitrogen (N) and phosphorous (P) flow from Nile tilapia feeding in RAS cage production.
ParametersN (%)P (%)N (%)P (%)
Neto and Ostrensky [10]Personal Observations (RAS)
Feed100100100100
Fish retention352835–5060–70
Water (Soluble Excretion)331720–305–10
Total Sludge315515–2535–45
Thereof non-consumed feed18185–105–10
Thereof feces133710–1530–35

