1. Introduction
This research assesses the viability of Domestic Rain Water Harvesting Systems (DRWHS) as a water supply method in marginalized communities in Mexico. By focusing on the most vulnerable populations, this research can be used to benefit communities that have the highest need for an alternative water supply system. Access to and quantity of domestic water, marginalization and precipitation were analyzed in Mexico’s 2457 municipalities, as were number of houses and inhabitants.
DRWHS technology, which provides water directly to households and enables a number of small-scale productive activities, has the potential to supply water in rural and peri-urban areas where conventional technologies are not feasible [
1]. The DRWHS technique is a local intervention with primarily local benefits on ecosystems and human livelihoods, though catchment scale benefits have been modeled for urban systems [
2]. The implementation of rainwater harvesting has been increasing as an alternative to conventional methods to reduce the number of people without access to drinking water, especially in rural areas [
3].
The Mexican National Water Plan (PNH) has set up funding mechanisms for achieving stable water supplies across the country, specifically in marginalized communities; however, the means that achieving this goal has not been strictly defined [
4]. This technical analysis aims to show that DRWHS is a feasible option for municipal and national decision-makers as a sole water source in marginal communities by providing the design parameters necessary to provide water year round. In Mexico marginalization is measured by the National Population Council (CONAPO) every five years using the Marginalization Index. The data from the 2010 CONAPO report was used for the development of the calculations in this study [
5].
The use of rainwater catchment and storage systems has an historical importance all over the world and especially in the Pre-Columbian civilizations of Mexico and Central America [
6,
7]. Since colonization, this practice has been abandoned and replaced with the techniques used in Europe at that time, although rainwater harvesting has recently been “rediscovered”.
Liaw and Chiang [
8] propose that rainwater harvesting systems can be used for the following purposes:
The main source of potable water;
A supplementary source of potable water; or
A supplementary source of non-potable water.
This research was conducted with the aim of proposing rainwater catchment systems as the main source of potable water according to the standards established by the World Health Organization [
9]. These standards are based on the quantity of water delivered and used for households and the requirements of water for health-related purposes to derive a figure of an acceptable minimum to meet the needs for consumption (hydration and food preparation) and basic hygiene.
In Mexico approximately nine million people lack access to safe water [
3], with most of them living in scattered communities with high levels of marginalization and isolation due the mountainous nature of the country. Some of these communities also have the highest amount of rain in the whole country.
In general, DRWHS design cannot be standardized because the amount of rainwater provided depends on the local climatic conditions which means that the most important factor relating to the efficiency of a rainwater system is the correct sizing of the rainwater tank [
10], although a comparison between estimated and actual performance in large buildings [
11] exemplifies that factors, such as catchment size and actual occupancy level, have great impact on tank size and have to be taken into account in order to build confidence in the performance of these systems. In this study, the relationship was explored between the location of the community, the rain levels reported and the marginalization and lack of water distribution systems.
Water availability in Mexico varies significantly both geographically and temporally. Mexico contains nearly 1500 river basins, with most of the surface water concentrated in the southern half of the country. These basins vary greatly in size: 87% of the country’s surface runoff is concentrated in 50 basins, and two thirds is concentrated in just seven basins. Rainfall is also concentrated in the southern half of the country, and 68 percent falls between the months of June and September [
12]. In 1997, the country was divided into 13 hydrological-administrative regions (RHA) with the objective of organizing the management and preservation of the nation’s waters (these hydrological-administrative regions are composed of river basins, but have been created by taking into account municipal borders so as to facilitate the integration of socioeconomic information).
In Mexico municipalities are responsible for providing water and sanitation services; therefore, due to the uneven distribution of water and economic resources among these entities water and sanitation services are also unevenly distributed. While residents in most municipalities in the northern and driest part of the country have regular access to drinking water, in the southern part of the country, the percentage of the population with access to water drops steeply, despite the fact that the vast majority of water resources are concentrated in this part of the country. Due to the lack of access to drinking water in scattered communities in the mountainous and rainy parts of Mexico, DRWHS has the potential to bring public benefits for these communities.
Experience using DRWHS varies largely from country to country, from local initiatives by users or fiscal incentives for new buildings to large national programs or even programs in small islands lacking other water resources [
1,
13,
14,
15,
16,
17,
18,
19,
20]. In this case, this research aims to establish a methodology that helps to identify municipalities with the greatest potential for using this technology and promote further implementation of national public policies in support of communities lacking water services.
2. Methodology
This study assumes that estimated water demand should be determined according to the Levels of Service established by the World Health Organization [
9]. Given that precipitation is variable in time and place, the main objective was to find a relationship between local conditions (marginalization, expected level of service, and precipitation) and the physical components of DRWHS, particularly the catchment surface area and the sizing of the water tank.
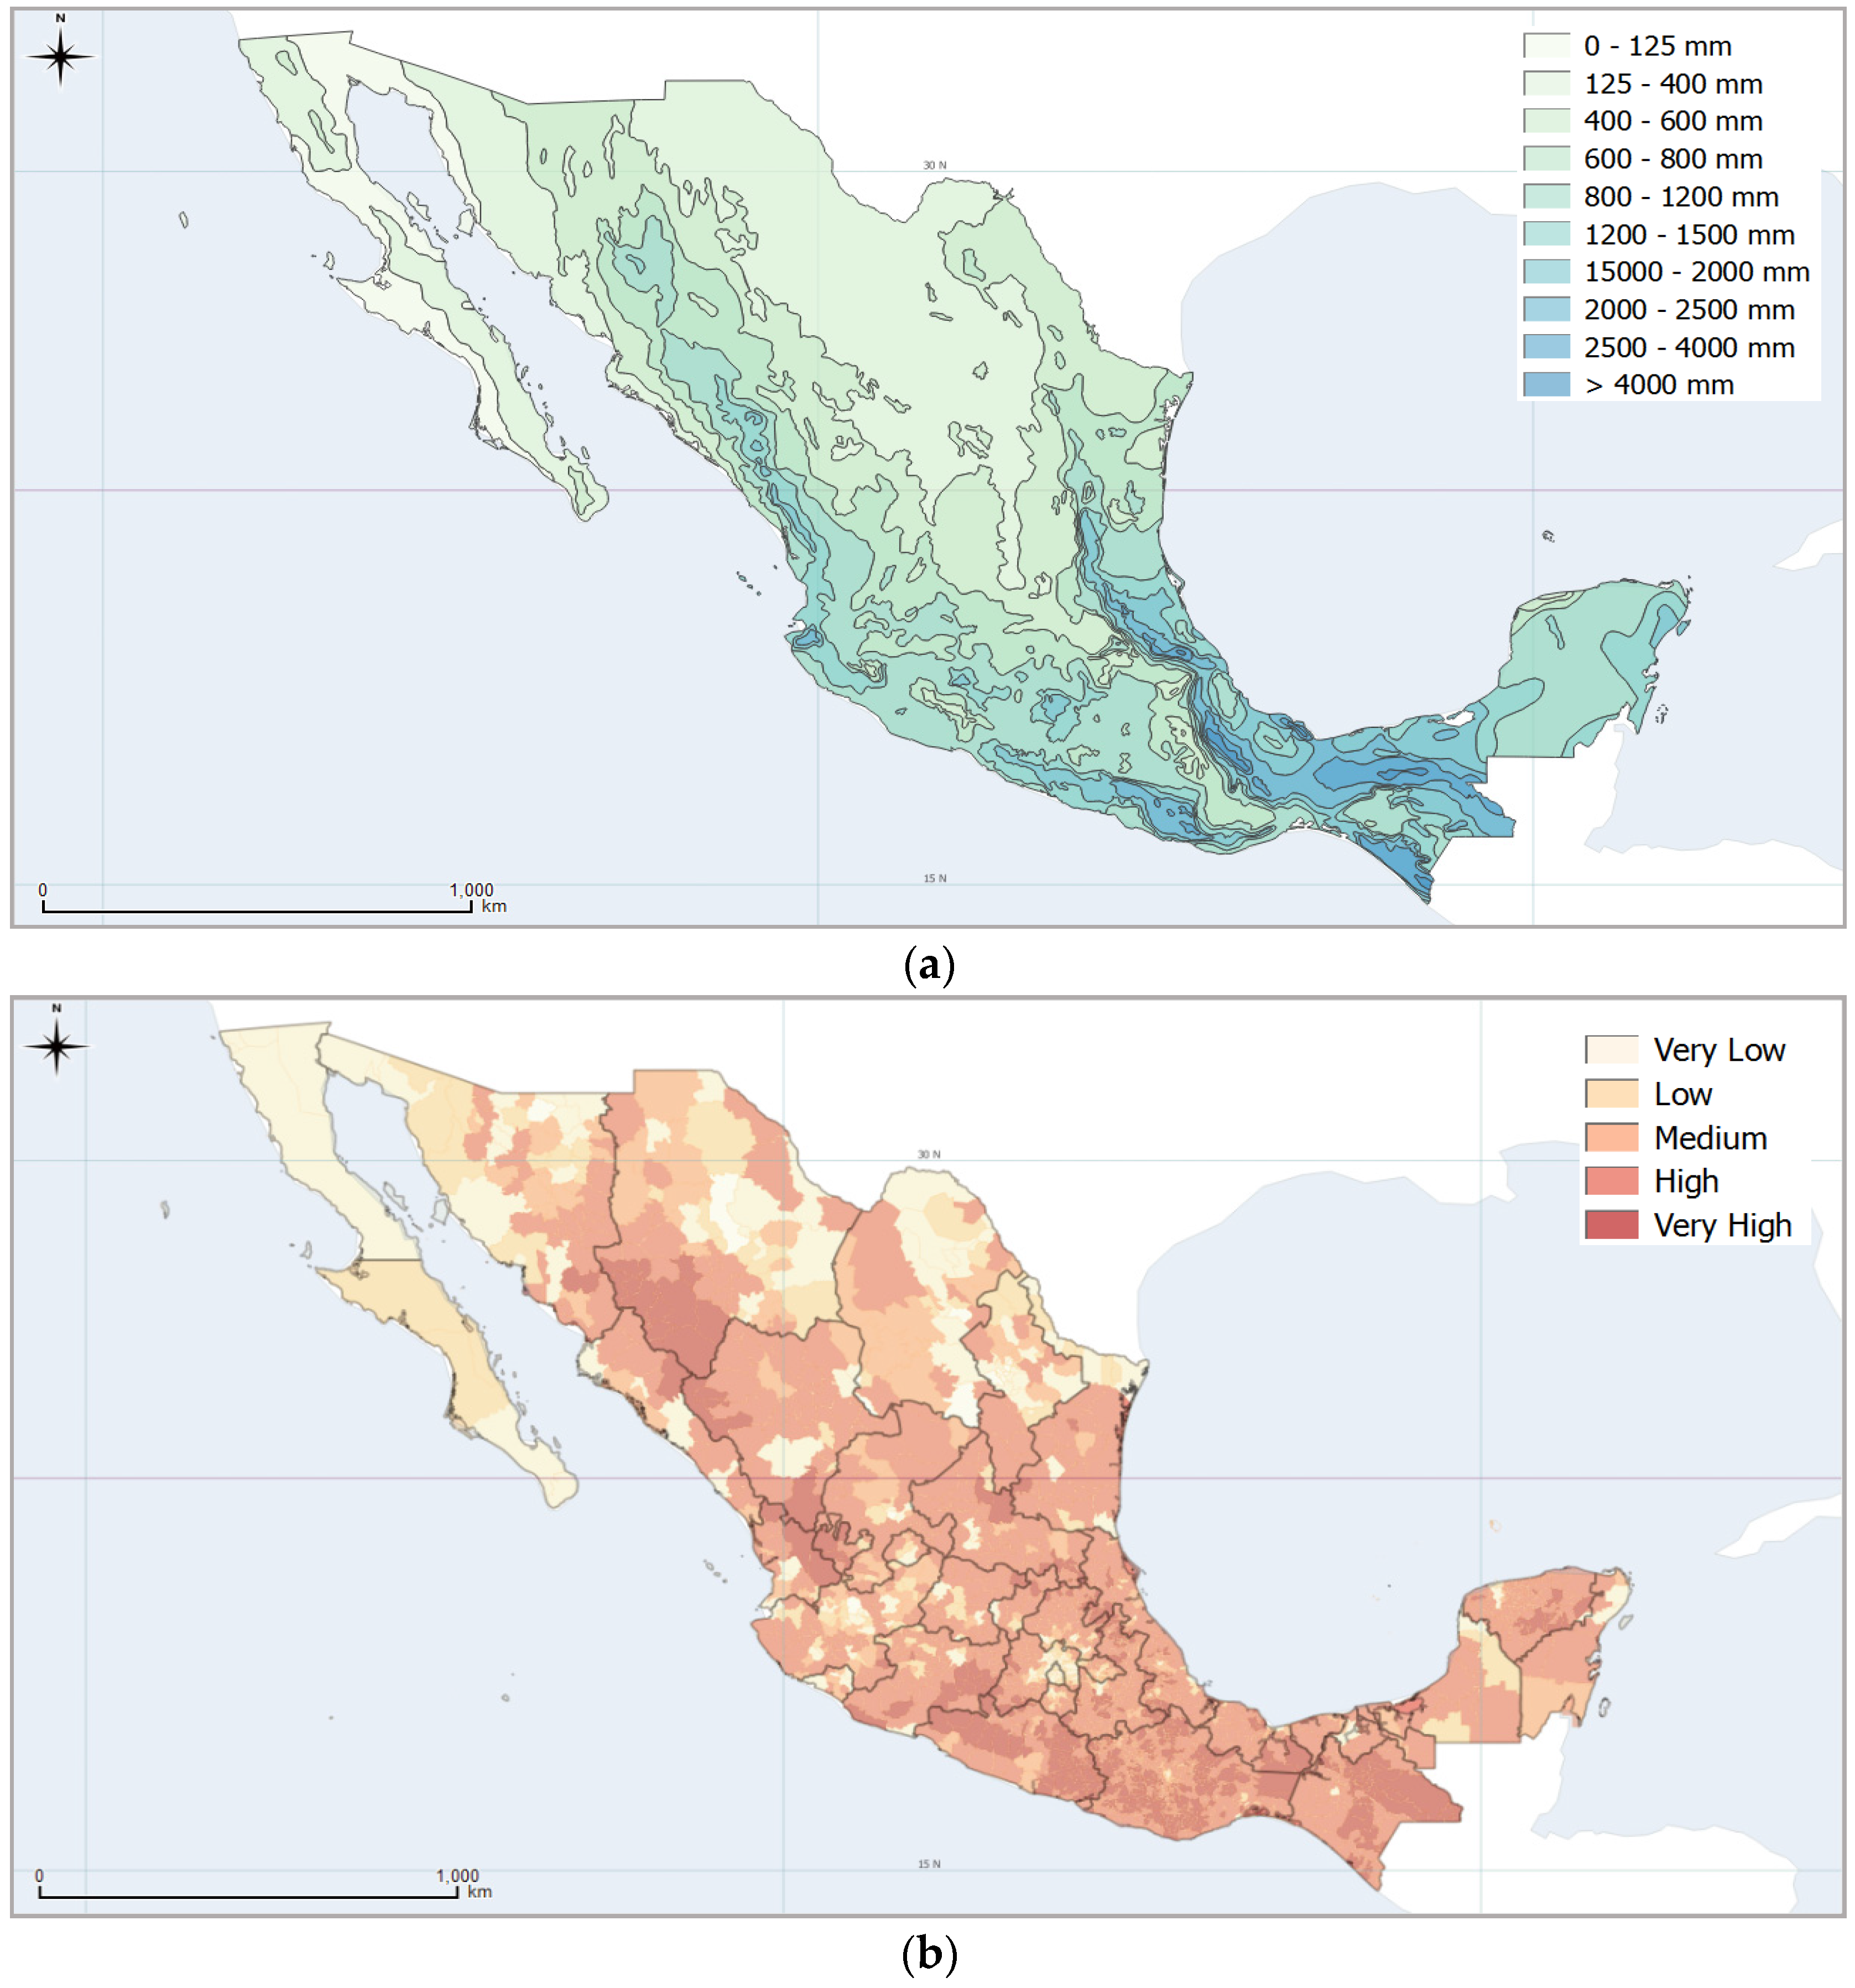
Therefore, this study assumes that communities that would receive the most benefits from DRWHS should be determined by their marginalization and local rainfall, considering the unreliability of their water resources. As shown in the
Figure 1 marginalization coincides with high precipitation levels.
The municipality was chosen as the basic unit of study due legal, administrative, and data considerations. Specifically, the supply of water services in Mexico is the responsibility of these entities and most official data, including hydrological data, is indexed by municipality.
2.1. Population and Sample
Starting with the 2457 municipalities that make up the whole of Mexico, various filters were applied to the data to focus in on study areas with the lowest access to drinking water. First, those municipalities with “high” or “very high” degrees of marginalization were chosen as determined by CONAPO. Secondly, of those municipalities, those with 40% or more of the population without access to municipal water were selected [
5]. The resulting sample consists of 207 municipalities in 16 states. Annual average rainfall in millimeters was then determined and recorded for each municipality using data from the Institute of Statistic and Geography (INEGI) [
21].
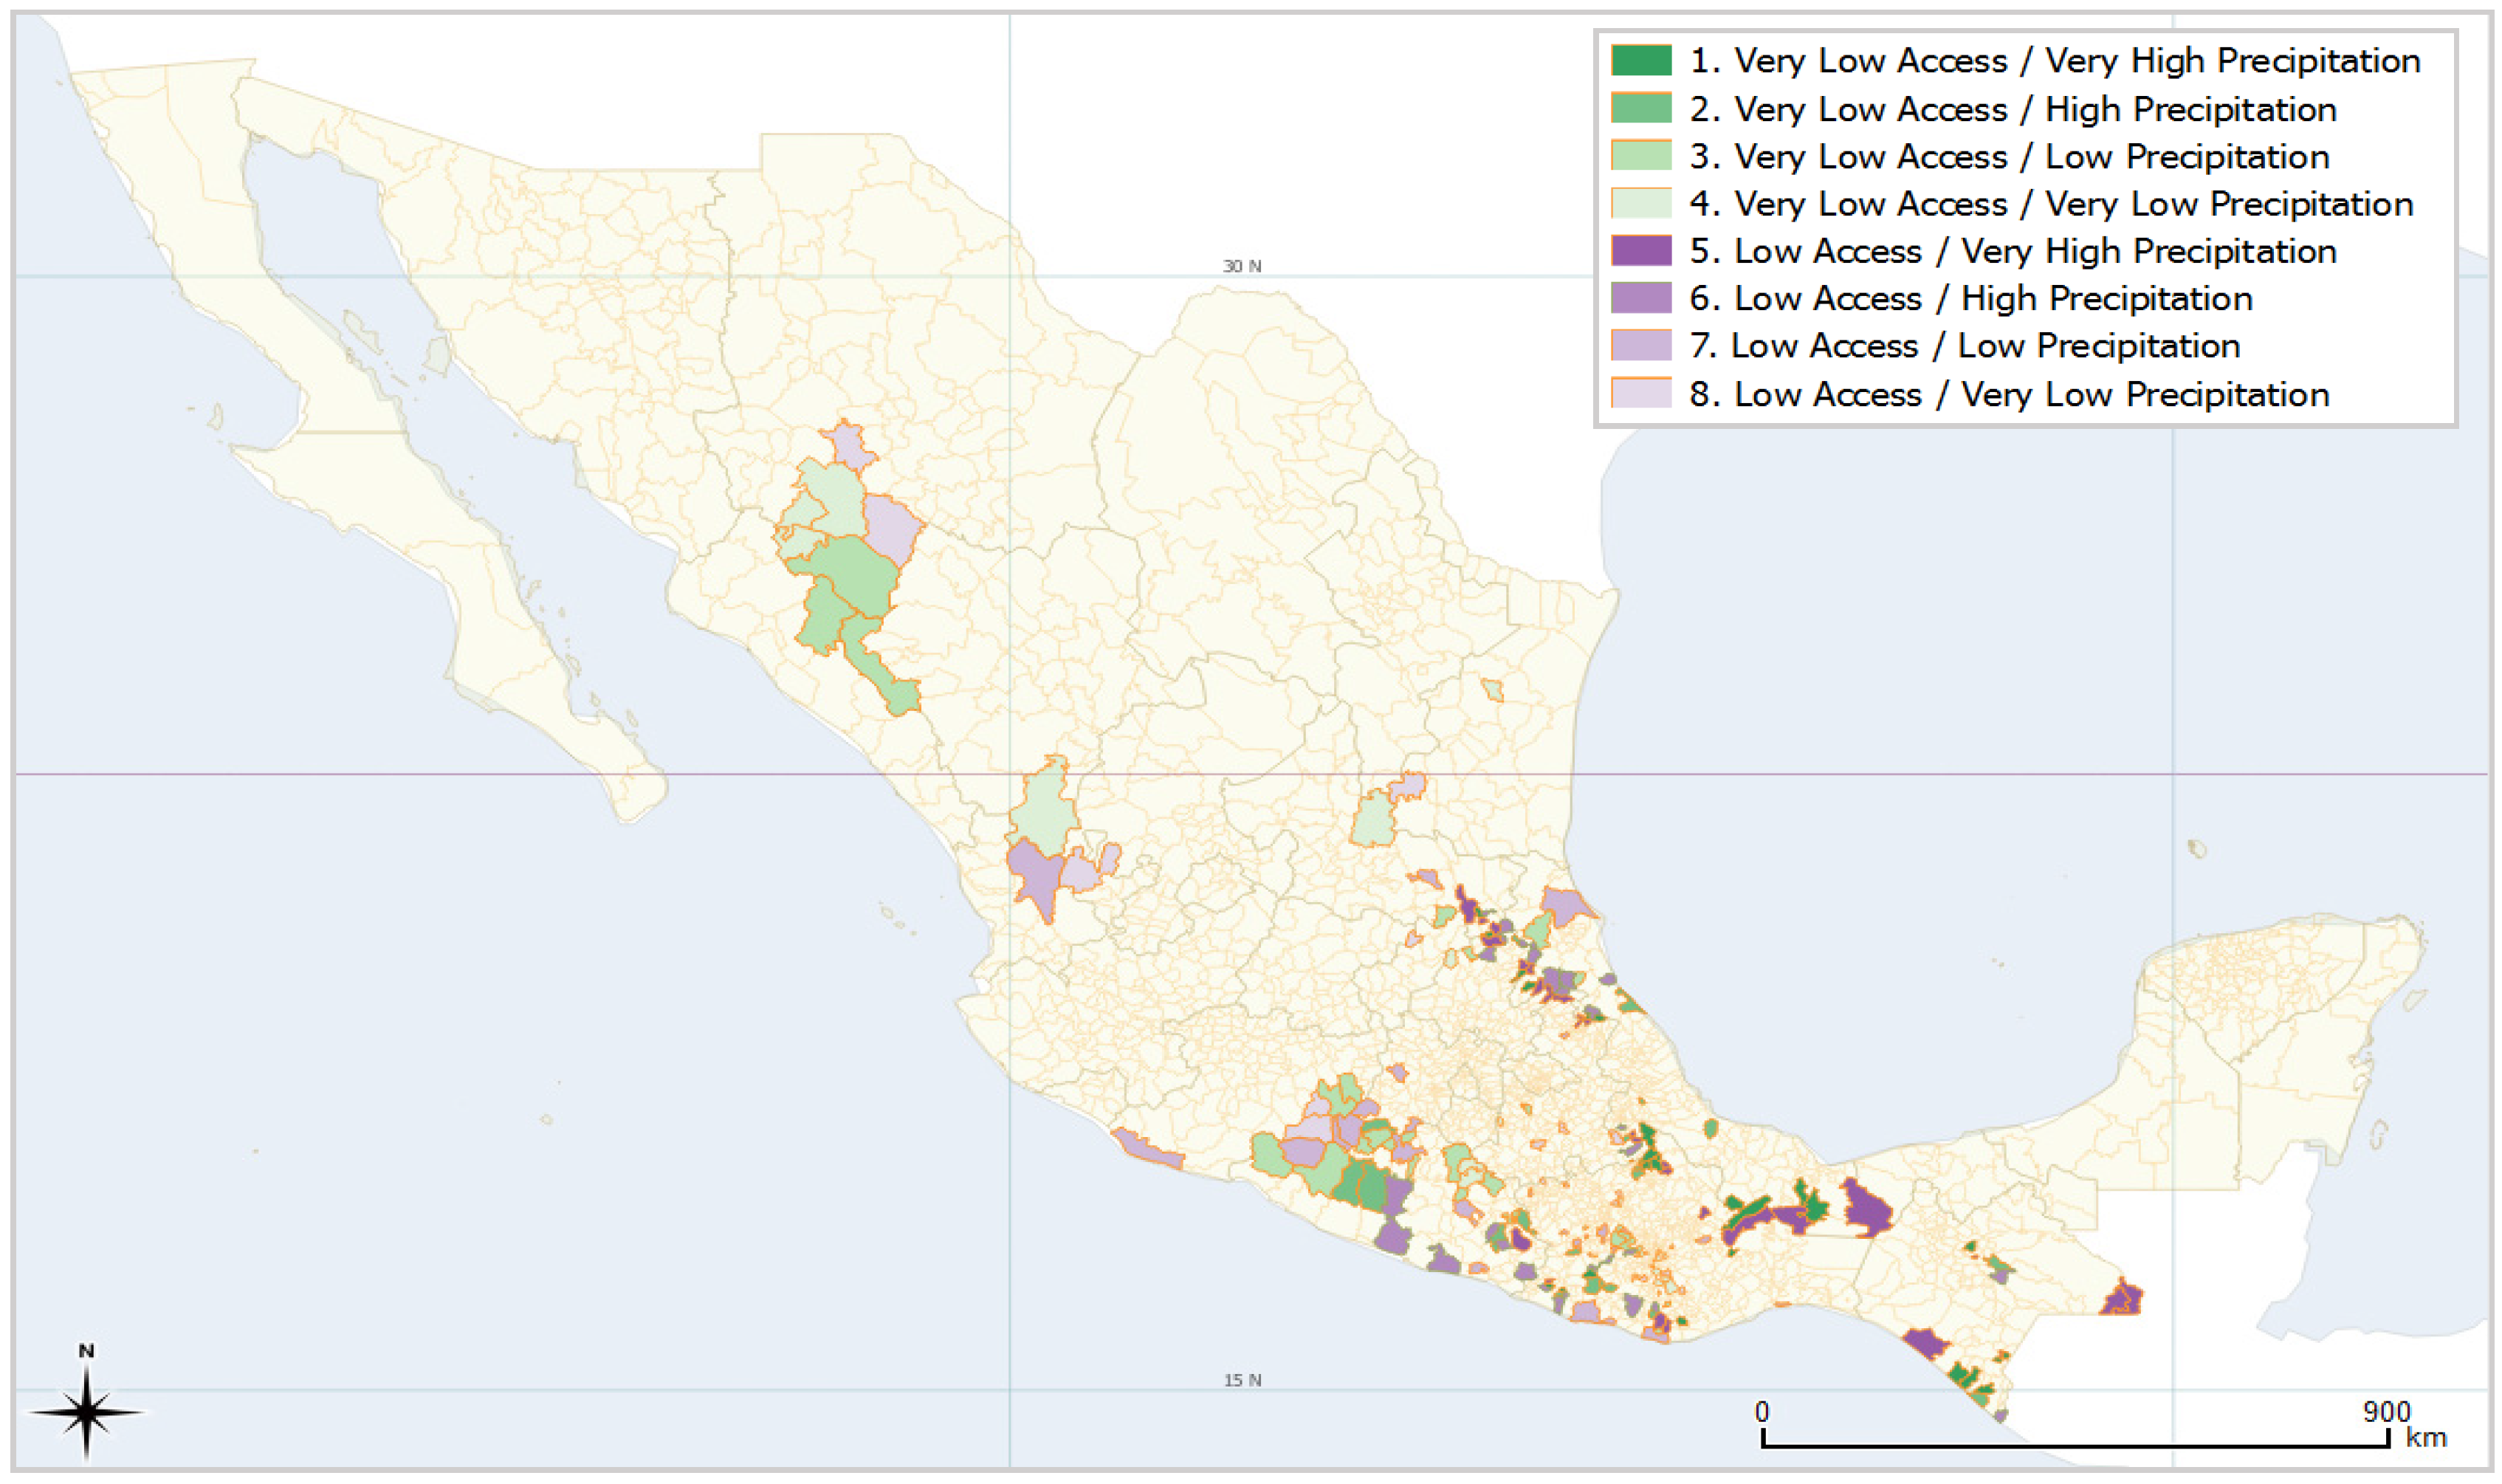
Once constructed, the sample was stratified based on the quartile values of two variables: “Access”, corresponding to population without access to drinking water, and “Precipitation” (
Table 1). Each variable was divided into levels based on these quartiles: Low Access and Very Low Access for Access Level and Very Low, Low, High, and Very High for Precipitation Level. Using these variables, the data set was separated into 8 categories (
Figure 2).
Figure 2 shows the distribution of the municipalities in the sample. In general, the largest municipalities by area are located in the northern part of the country, while municipalities in the southern part of the country are much more densely situated. The municipalities were color coded from darkest to lightest corresponding to higher to lower level of precipitation. Additionally, the two levels of access represented in the sample were colored green or purple according to Very Low or Low access, respectively. It is apparent that the vast majority of municipalities in the sample are located in the southern portion of the country, which also coincides with the highest amount of rainfall. It was also noted that the high precipitation municipalities in the sample tend to be clustered around the Sierra Madre throughout Mexico, as expected due to its orographic effect which is known to cause precipitation in the surrounding valleys [
22].
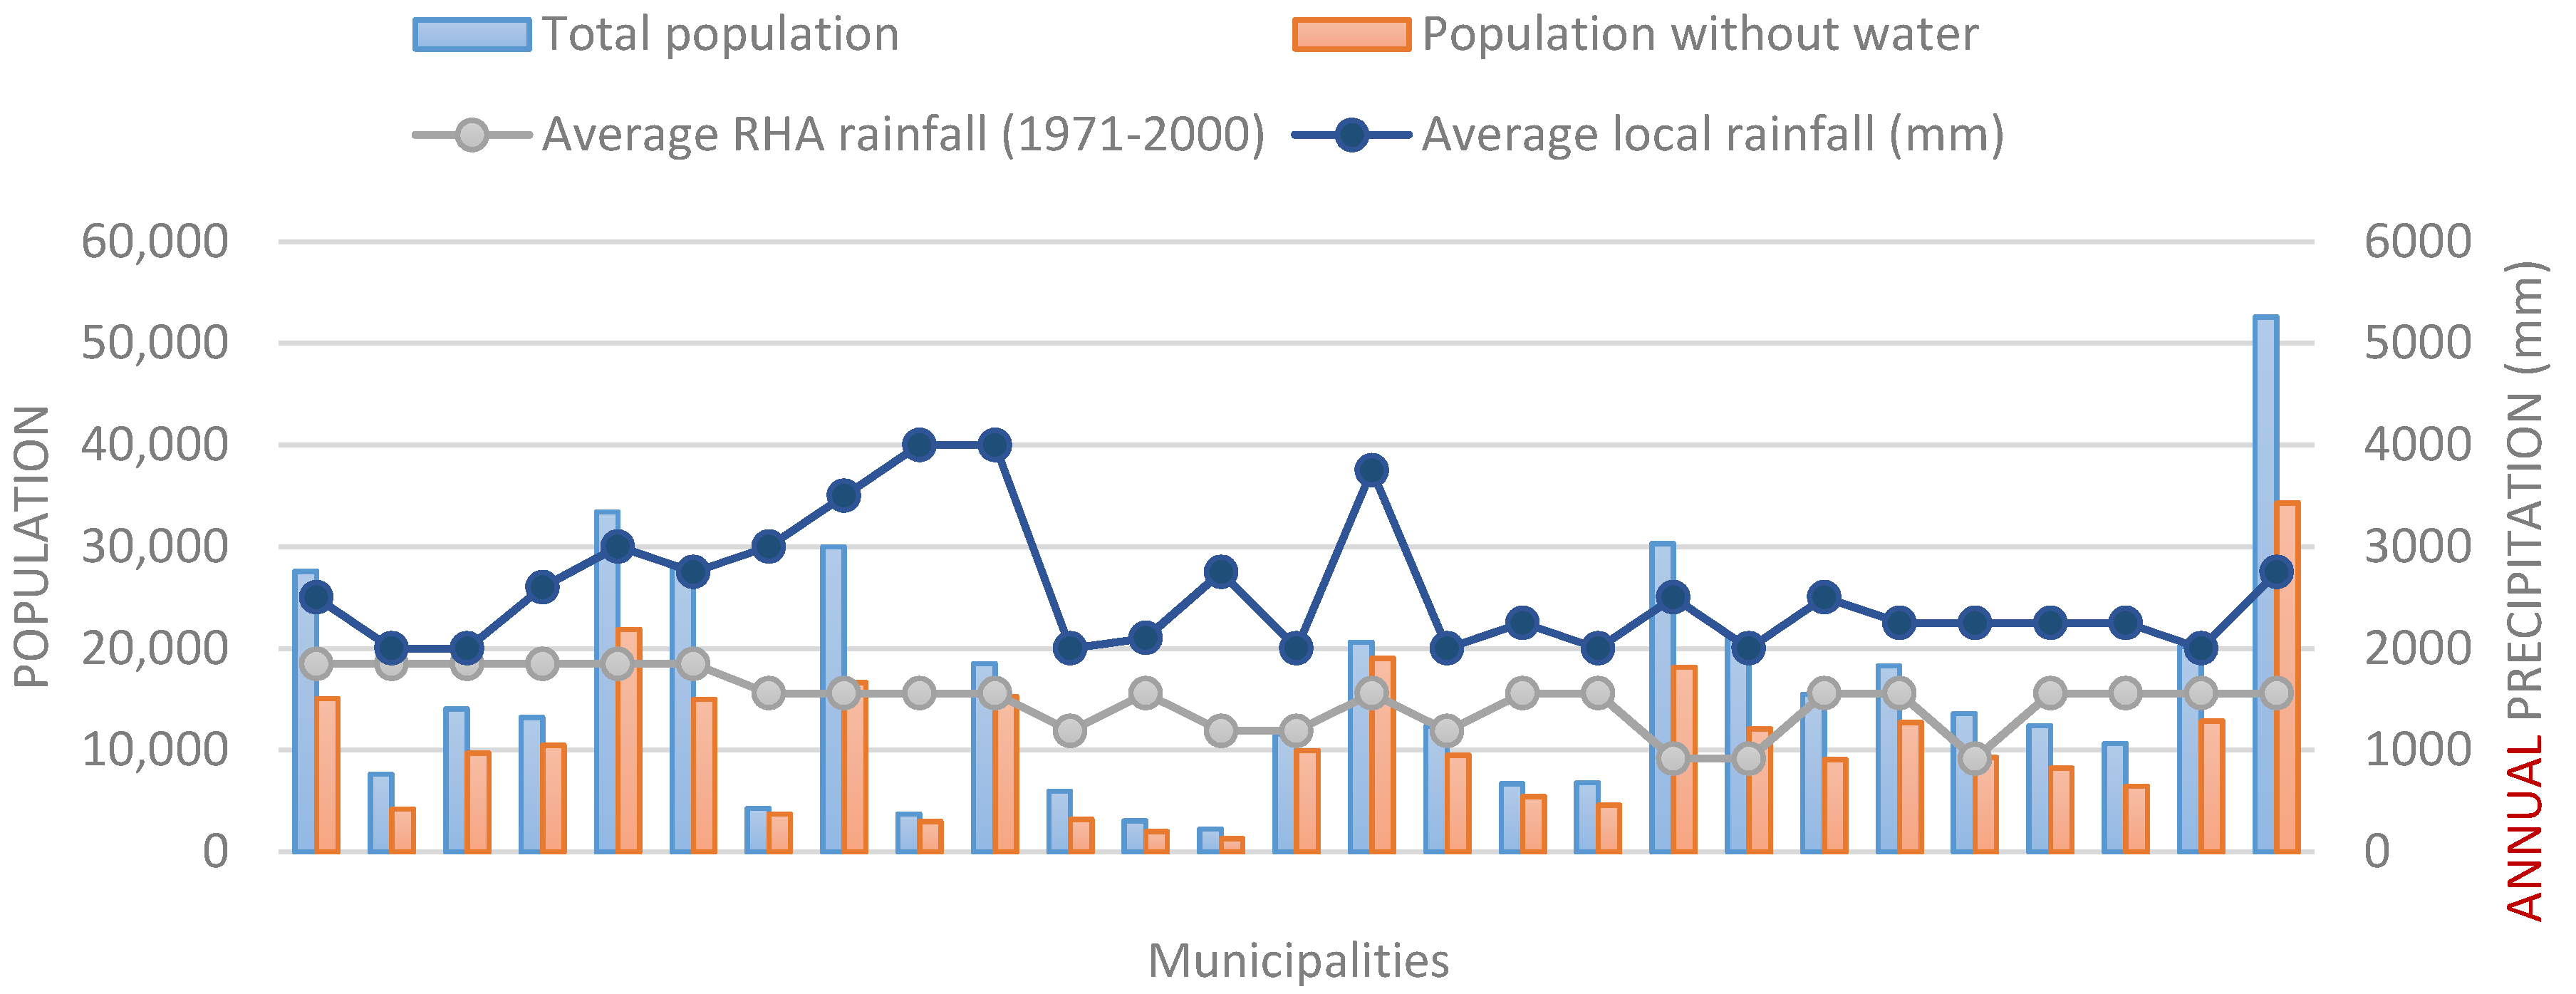
Of the sample, Category 1 (Very Low Access and Very High Precipitation) was chosen for further analysis. This category represents the greatest potential with the highest impact for capture, purification, and domestic use of rainwater given the shortfall in service and the rainfall regime in those municipalities. The majority of the municipalities in Category 1 are found in the Southern Border and Central Gulf RHAs. All the municipalities are categorized as having more than 50% of the population without access to municipal water and over 2000 mm of rain annually; the range of access to water and precipitation are shown in
Figure 3.
This category includes 27 municipalities, most of them in the southern part of the country. The total population in the sample without access to drinking water is 292,752, which calculates to 66% of the population in these municipalities.
2.2. DRWHS Analysis
The physical components of a DRWHS for a single dwelling in each of the municipalities in Category 1 were then determined using the following parameters: water demand, run-off coefficient, monthly precipitation, and number of inhabitants per household. Monthly precipitation and the number of inhabitants per household were determined specific to each municipality, while the water demand and run-off coefficient values were kept constant across all municipalities.
2.2.1. Parameters
Water Demand
Three distinct levels of water demand were chosen to demonstrate how catchment area varies with varying levels of service. Basic Access, at 20 L/capita/day (L/c/d), assures a high health impact by only meeting consumption and basic hygiene needs. Intermediate Access, at 50 L/capita/day, assures a low health impact by meeting consumption, food preparation and hygiene, and personal hygiene needs. Finally, Optimal Access, at 100 L/capita/day, assures no health impact by meeting all hygiene and consumption needs.
Run-off Coefficient
In order to account for variability in catchment surface materials and losses due to absorption and evaporation of rainwater, a run-off coefficient of 80% was considered in all cases. This value was chosen based on a review of literature pertaining to the run-off coefficient [
23,
24,
25].
Number of Inhabitants per Household
Precise data on bed spaces or average inhabitants per household by municipality was not available on a national level, therefore, the average number of inhabitants per household was determined by dividing the number of residents by the number of households in each municipality. The number of inhabitants, the number of households, and the number of houses without connection to municipal water in each municipality were obtained from the National Municipal Information System (SNIM) [
26].
Monthly Precipitation
The monthly rainfall averages were obtained from the official repository of climatological data [
27], which is managed by the National Water Commission (CONAGUA) and the National Meteorological Service (SMN). This data is derived from daily precipitation data from individual climatological stations across the country and has been processed and validated by CONAGUA. There has not been a similar processing and validation effort realized by CONAGUA for daily rainfall averages; therefore, the monthly values were considered the most accurate representation of local conditions available. For the purposes of the calculations, the values used correspond to the period 1981–2010, the most recent period of validated averages of 30 years available.
To obtain an average precipitation corresponding to each municipality the Thiessen polygons method [
28] was used with the territory of each municipality used instead of the watershed as the geographic limit. With this method a weighted average is calculated from values belonging to polygons intersecting a given sub-region of the municipality. This can be expressed mathematically as:
where
represents the total area of the municipality,
the area of the municipality sub-region corresponding to a given climatological station, and
the average precipitation in each month. The concept of
is equivalent to the quotient between
and
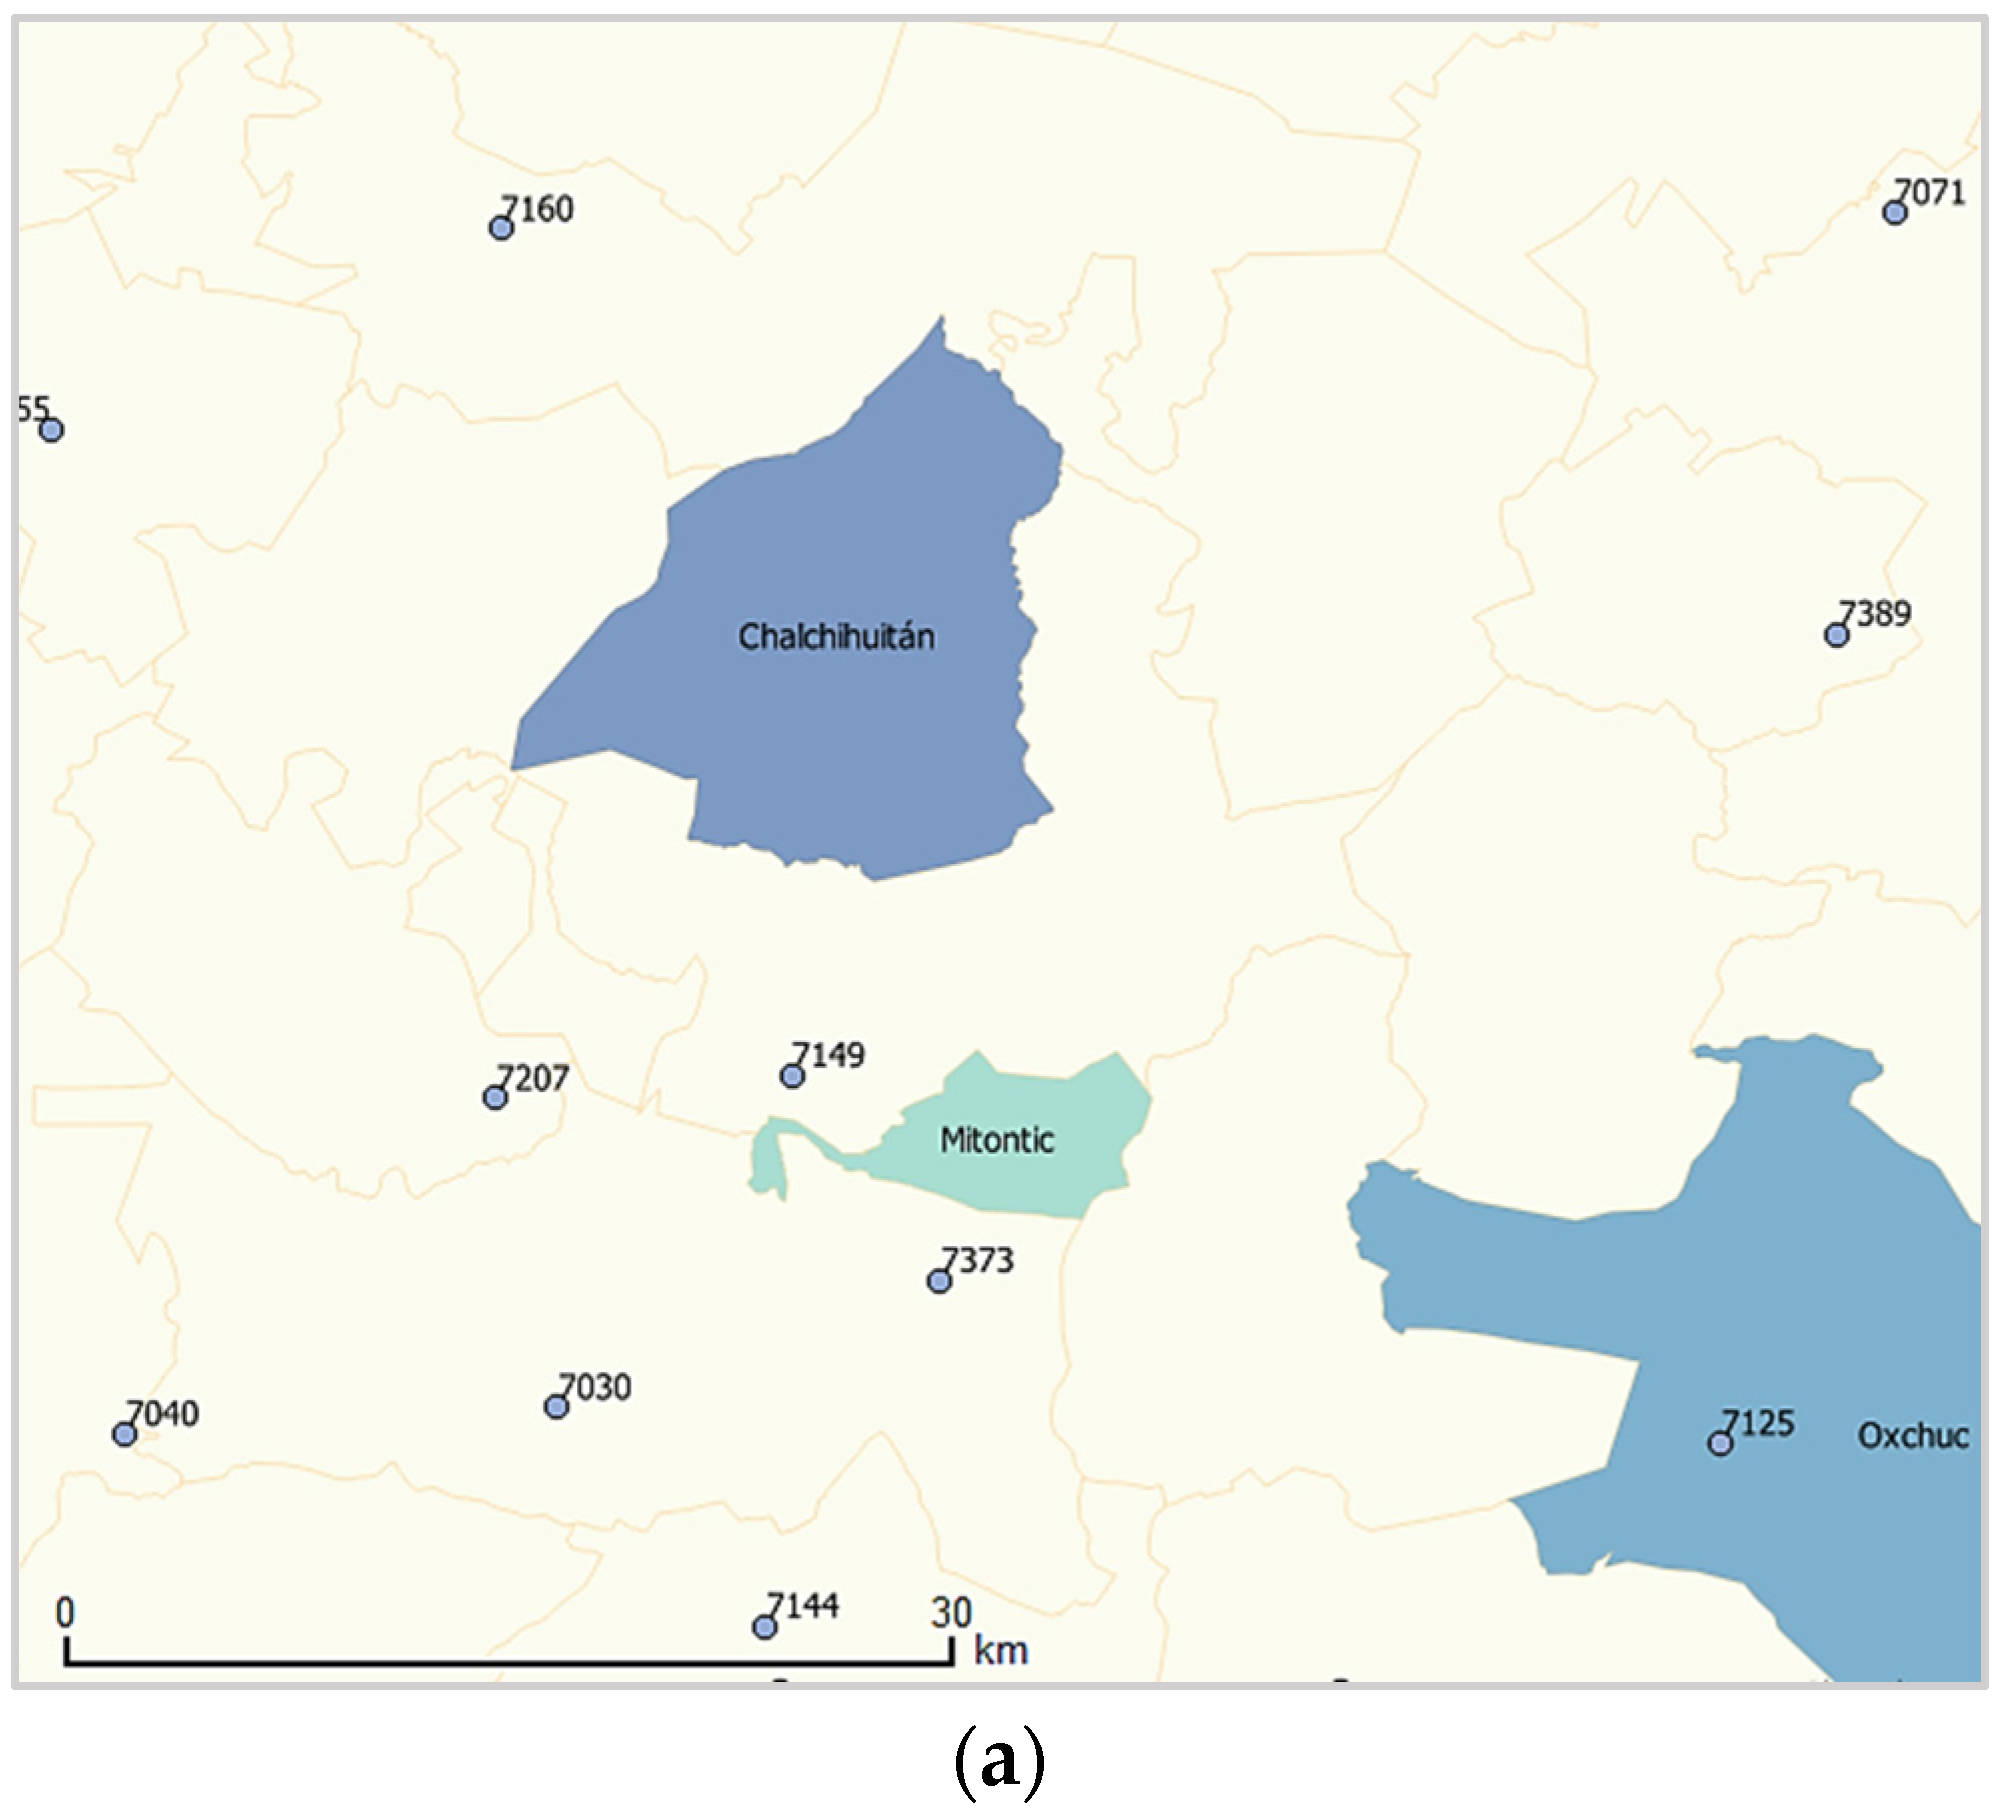
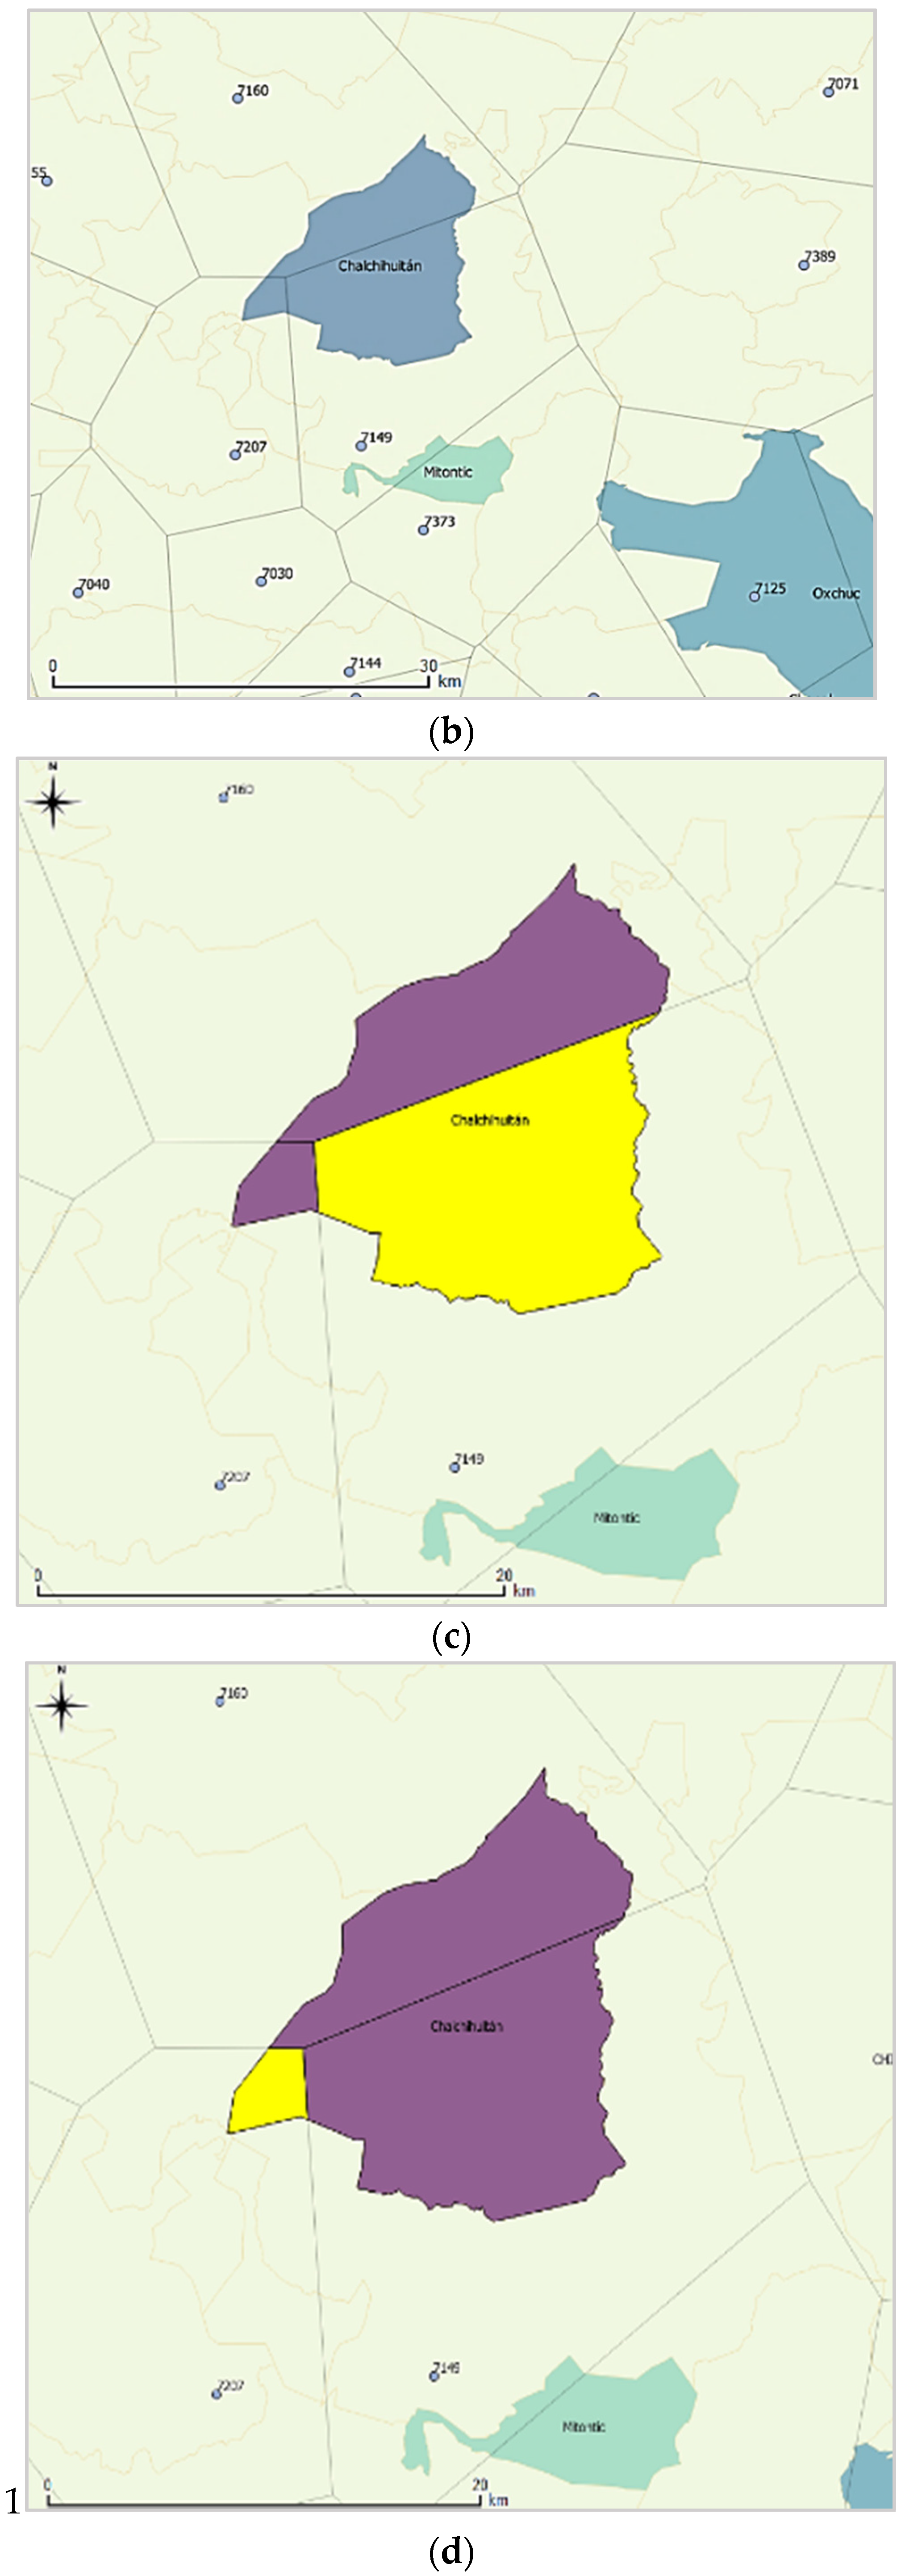
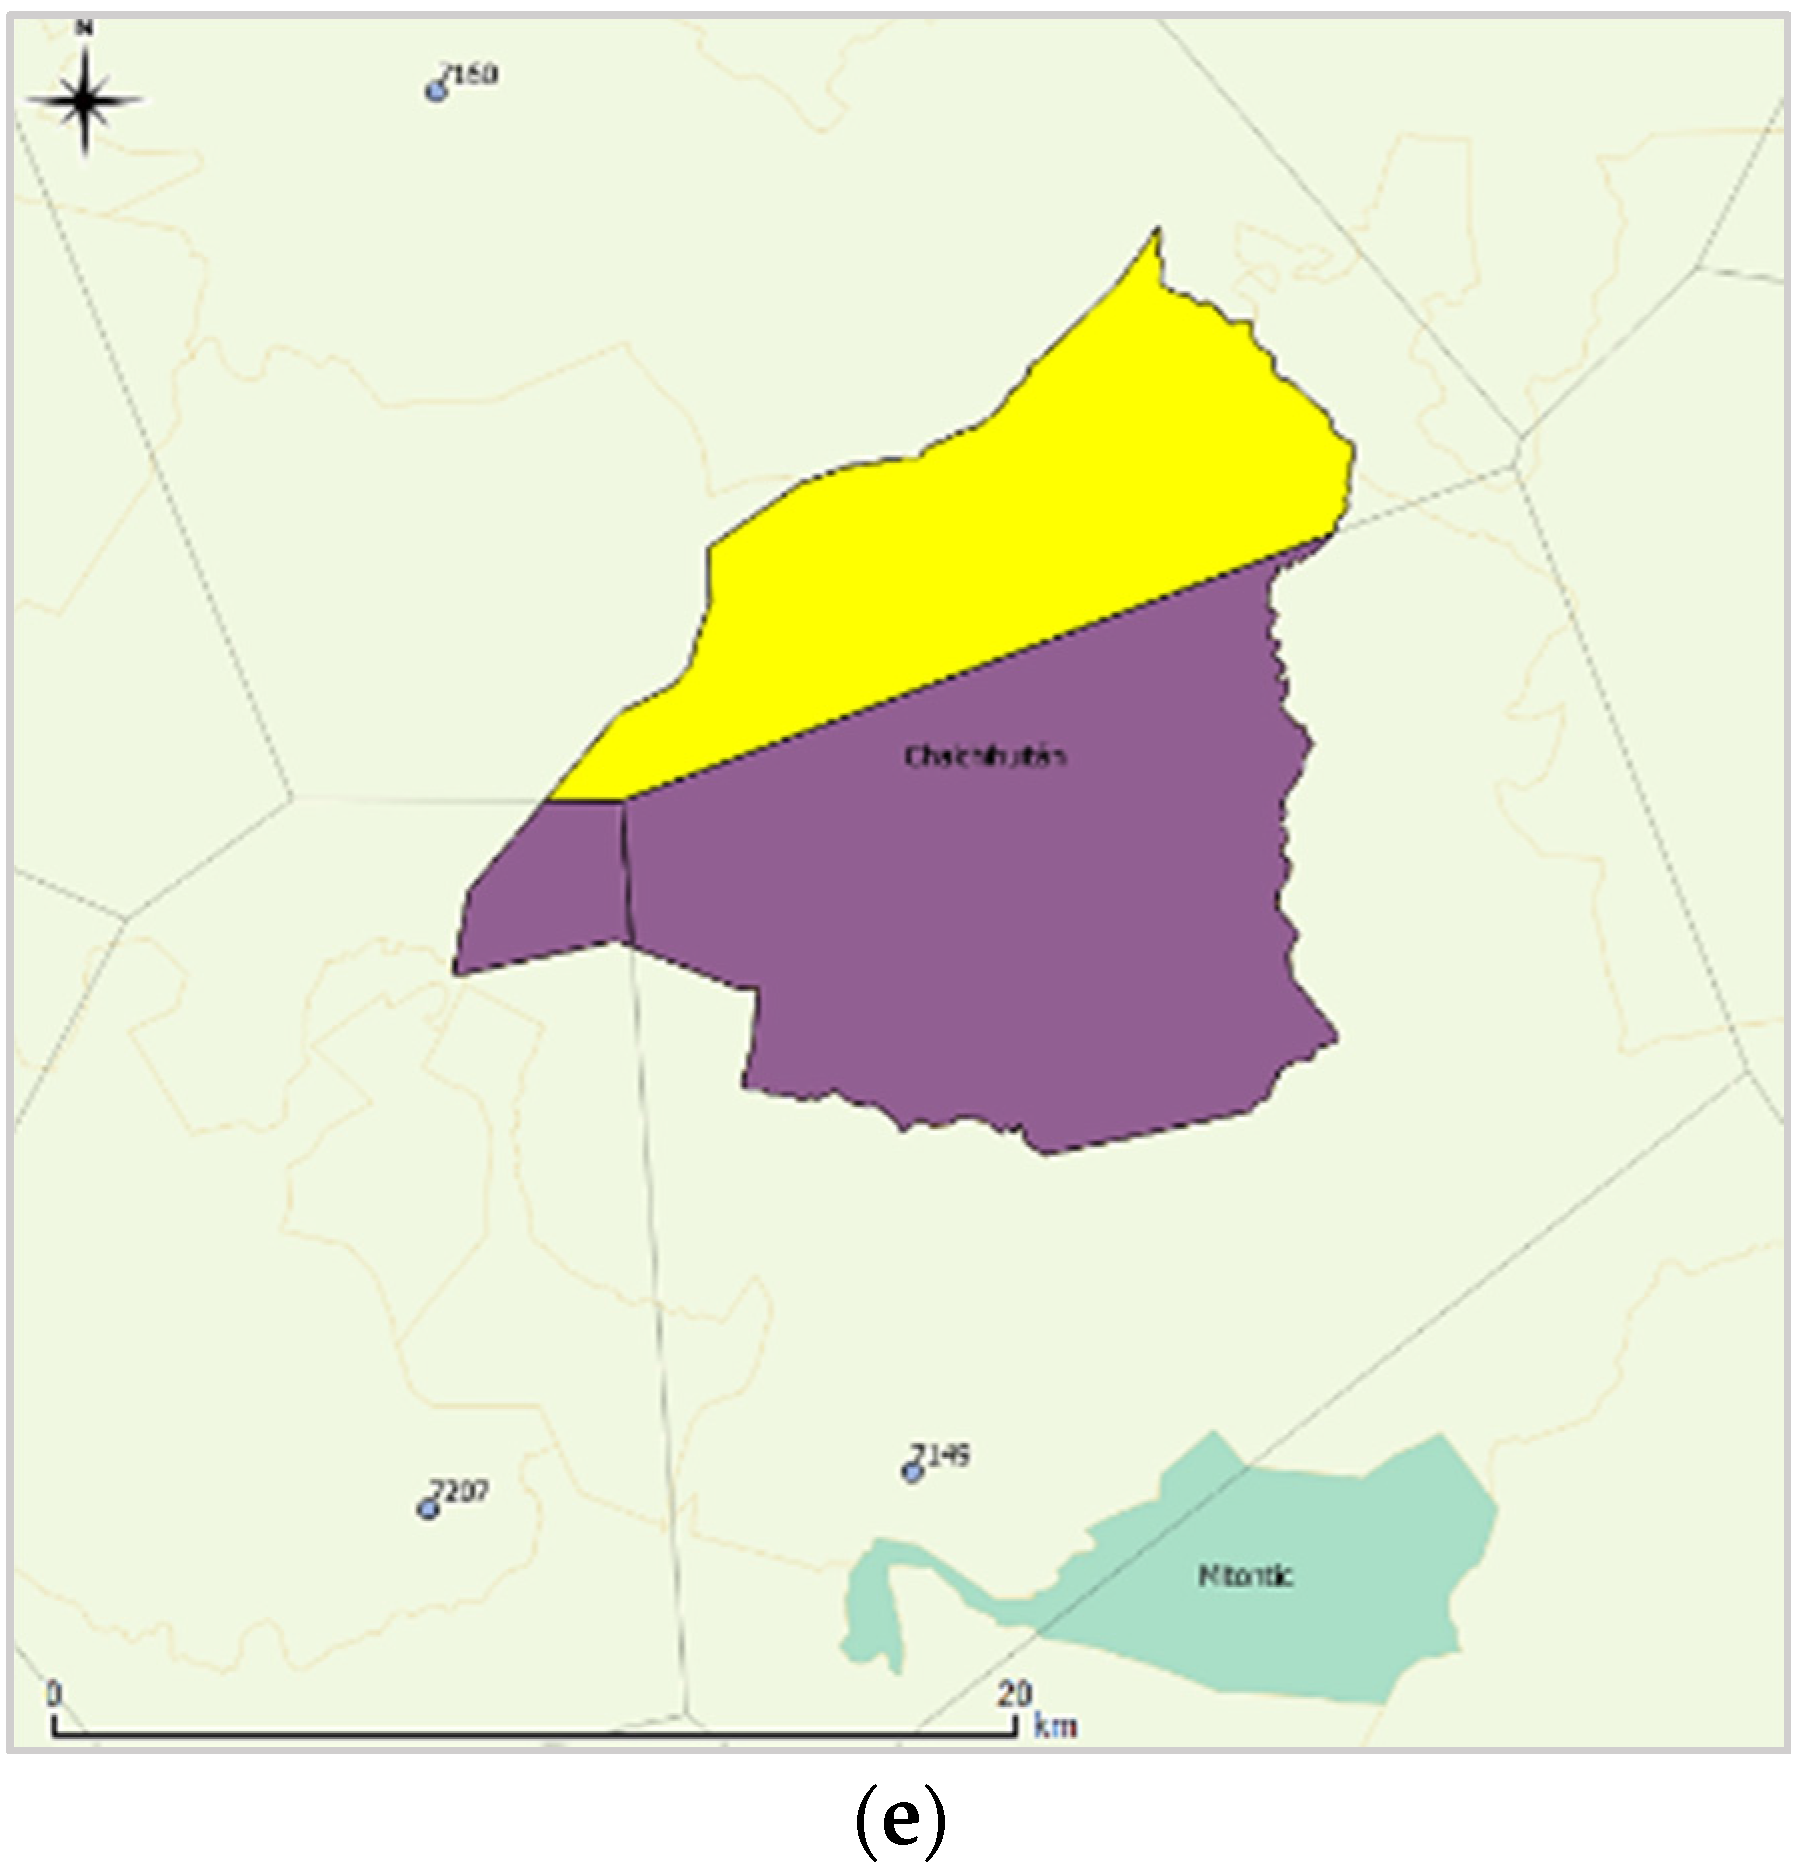
. Each variable was obtained using QGIS software as shown in
Figure 4.
2.2.2. Catchment Surface Area
Due to heterogeneity in the types and sizes of the houses, catchment area is treated as variable. In each of the municipalities a starting catchment area was estimated based on the approximate annual rainfall. This estimate was then raised or lowered by 1 m2 and 5 m2 at a time depending on the level of service (Basic and Intermediate/Optimal, respectively) until water demand for the year and average household size was met, resulting in water catchment areas with a precision of ±1 m2 and ±5 m2 (Basic and Intermediate/Optimal, respectively).
2.2.3. Tank Sizing
To determine the size of the water tank the mass curve method, a critical period method, was used [
29]. A critical period method analyzes the absolute difference between demand and supply in sequences of flows to determine the storage capacity, with the mass curve method being the best known and earliest example of this approach to storage sizing [
8]. Storage tank modeling has been assessed by various studies using hourly, daily, and monthly data as well as both behavioral and critical period models; a good review of the literature is found in Fewkes and Butler 2000, which compares a variety of these models. In this case monthly data was used, as Fewkes and Butler have shown that monthly data can be used to model the performance of large stores, specifically when demand is equal to 100% or more of annual harvestable rainfall as is the case in this study [
30]. The storage change in a tank is calculated using a mass balance equation:
where
is the inflow of the month analyzed and equal to the product of the average rainfall
, the run-off quotient
, and the catchment area
. As discussed above,
was calculated using various levels of water demand.
The outflow in each month corresponds to the product of the number of inhabitants
, the water demand
(level of service: 20, 50, or 100 L/capita/day) and the number of days in the month analyzed
:
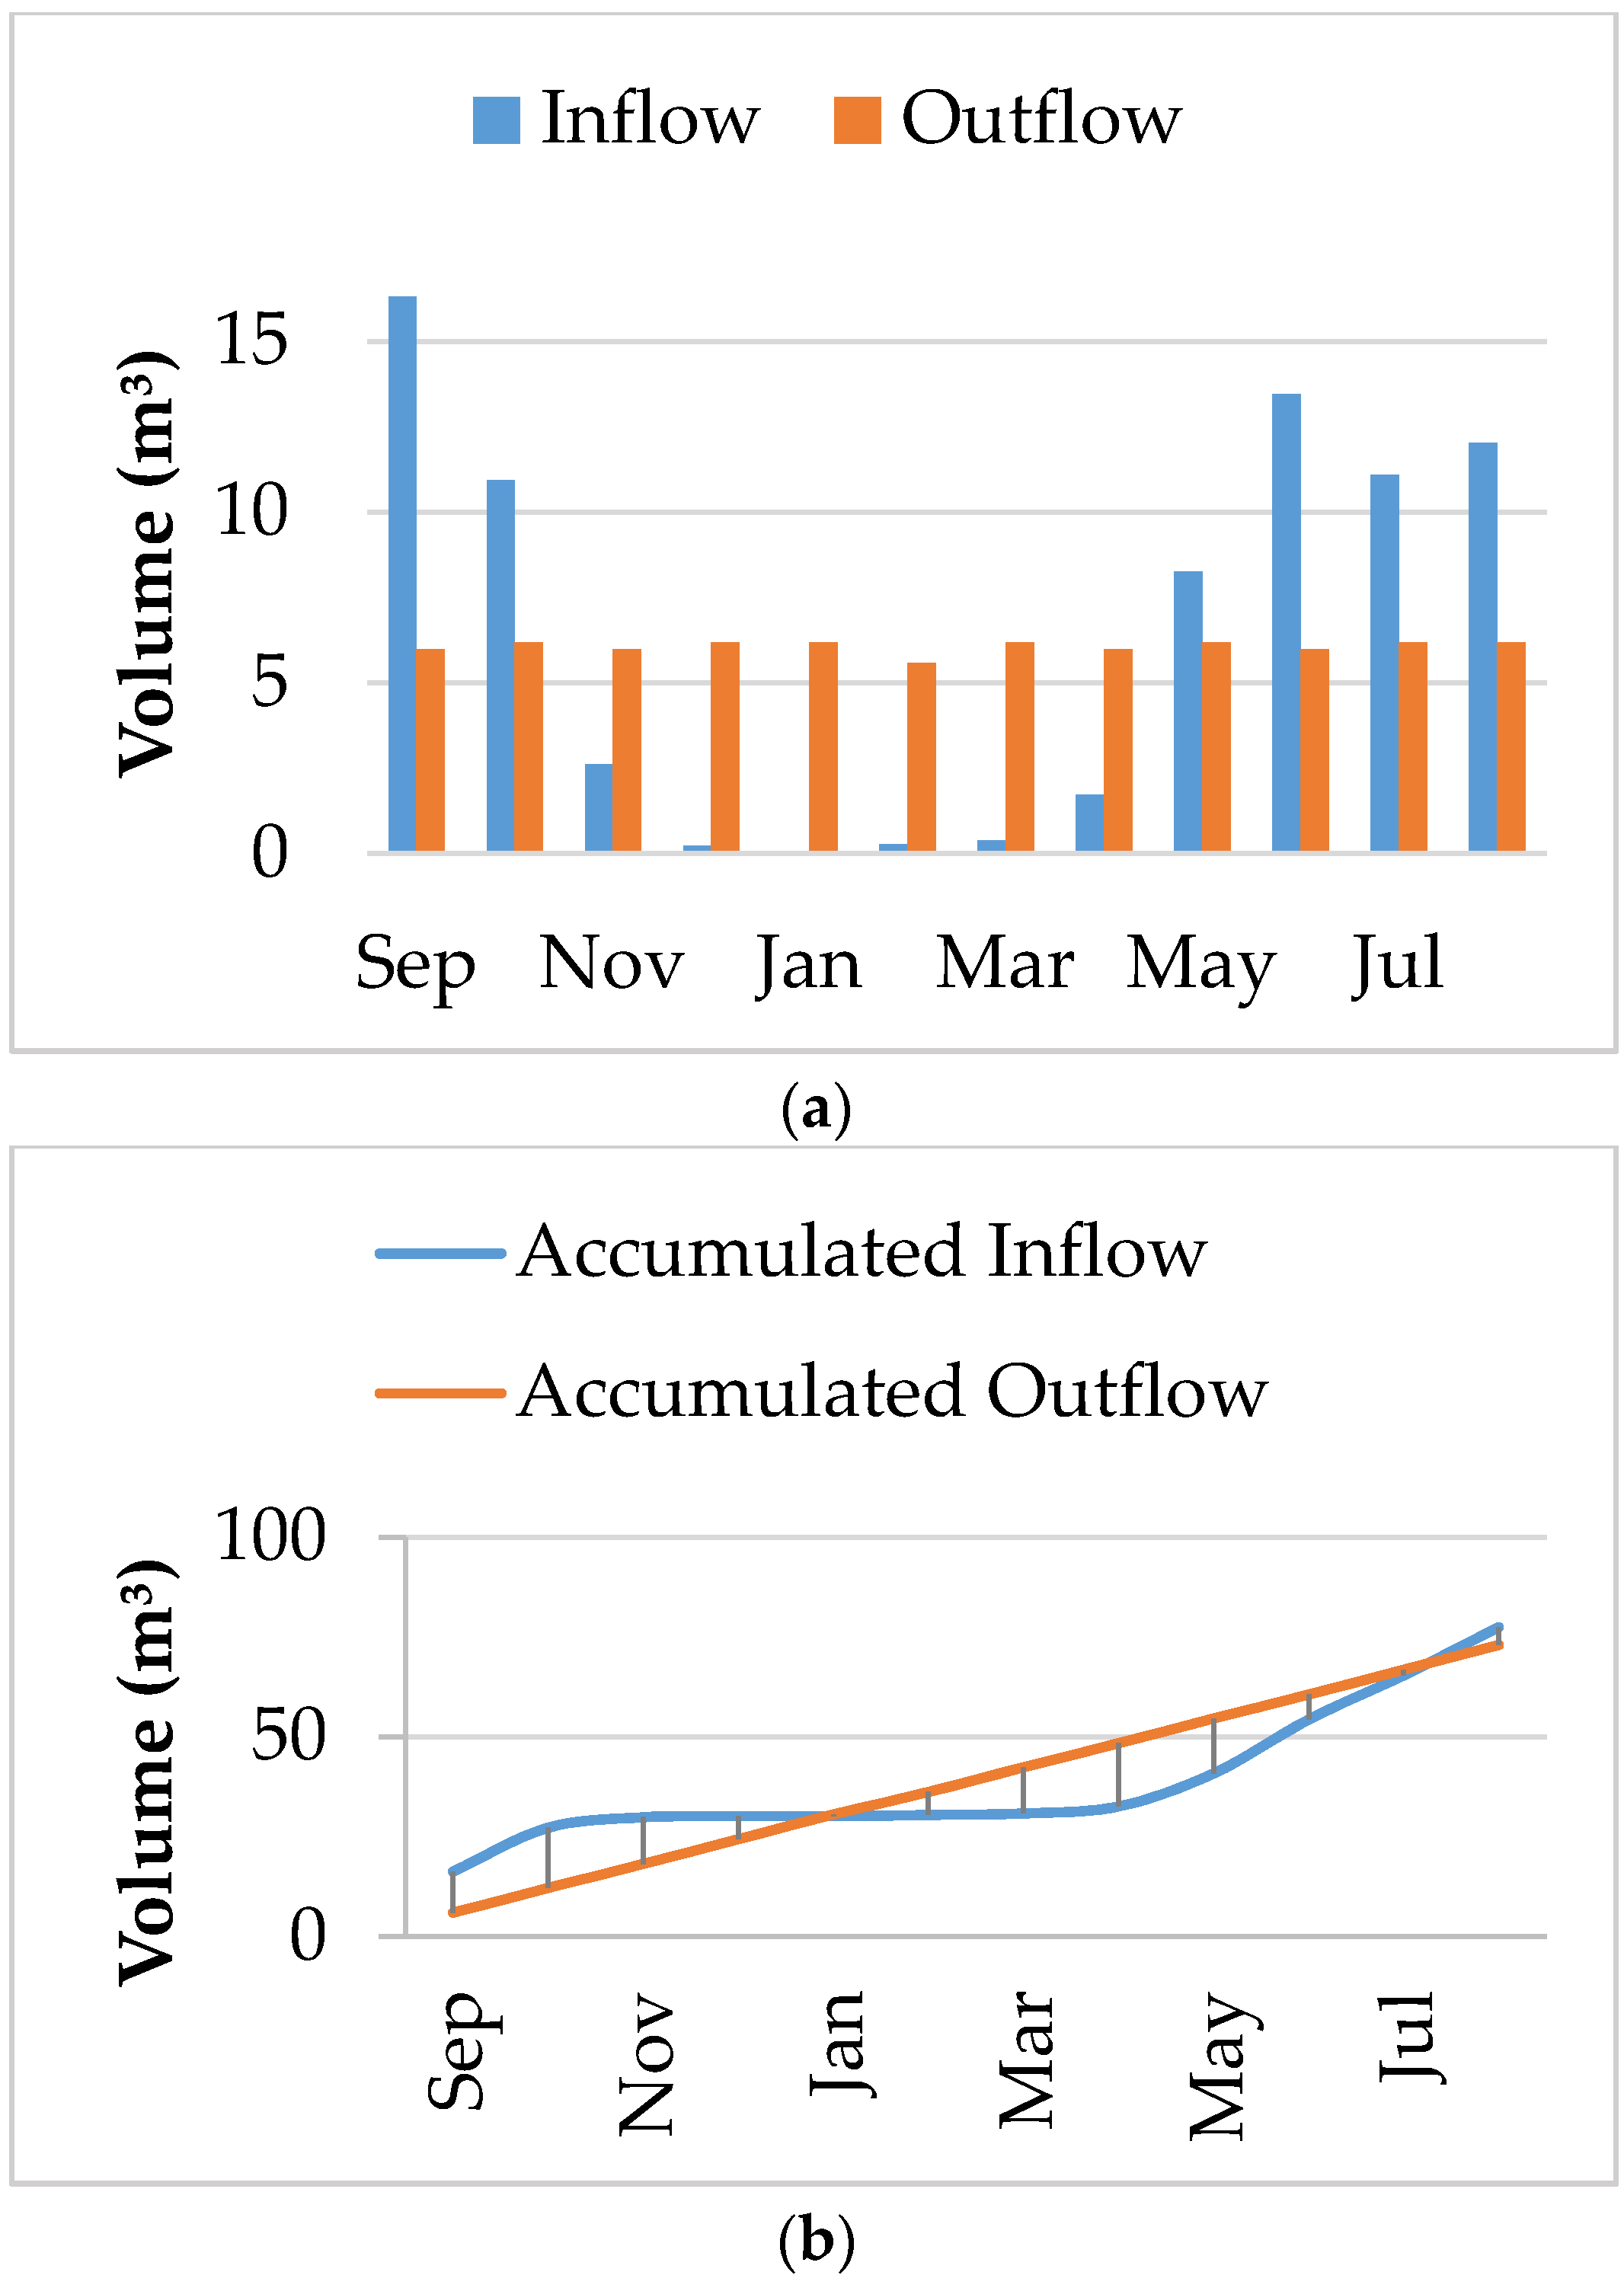
The respective values of inflow and outflow were then summed over all months starting in the month with the highest rainfall. Lastly, the accumulated outflow was subtracted from the accumulated inflow. Therefore, the volume is equal to the sum of the maximum positive difference (the surplus of water that must to be stored in a given month) plus the absolute value of the maximum negative difference (the shortage of water in a given month), which can be expressed mathematically as:
where
is the estimated water tank volume,
is the accumulated inflow, and
is the accumulated outflow.
Figure 5 shows an example of the results of these calculations.
3. Results and Discussion
Ideal catchment surface area and approximate rainwater tank dimensions were analyzed by comparing the correlation with rainfall annual averages. Both design variables were taken as a function of the rainwater demand established by the level of service.
Table 2 shows the results for area and volume obtained for each of the 27 municipalities analyzed. Slope and coefficient of correlation of the relationship between demand and catchment area are shown in the last columns in
Table 2, it is apparent that a linear relationship exists between the required area and the corresponding access level (
i.e., from 20 L/capita/day to 50 L/capita/day the catchment area is multiplied by 2.5).
It is important to note that the calculated annual rainfall in
Table 2, is different than the data reported by INEGI. Most of the municipalities have high calculated precipitation, around 2000 mm, with the exception of San Lucas Camotlán, approximately 600 mm. This discrepancy is likely due to inconsistency between the national datasets used by INEGI and the climatological data from CONAGUA used to calculate the average rainfall.
To achieve Optimal Access the required catchment area among the Category 1 municipalities ranges from approximately 60 to 160 m
2 with an average of 113.3 m
2. Using the linear relationship established between water demand and the catchment area, an average of 56.7 and 23.2 m
2 would be required to meet Intermediate and Basic Access respectively. These catchment areas are higher than catchment areas that have been reported [
31]. Similarly, for Optimal Access, tank size varied from 32.1 to 115 m
3 with an average of 58.0 m
3 and Intermediate and Basic Access equated to an average size of 29.0–11.6 m
3, respectively. Again, the tank sizes determined in this study are higher than reported in the literature [
25].
The difference in the design parameter values reported in other studies and those determined in this study can be attributed to the intentions of this study as compared with others. While other studies focus on the ability of DRWHS to provide a supplement to other water supplies available, this study analyzes the feasibility of using DRWHS as a sole water source throughout the entire year in regions where other water sources are cost prohibitive. National and municipal decision makers can therefore use the tool developed to estimate regional catchment and storage needs to determine relative costs between DRWHS and other water supply infrastructure (e.g., piped water, water trucks) and prioritize areas in which DRWHS is most practicable.
Additionally, Fewkes and Butler reported that monthly data models can sometimes overestimate storage volume; as such, it is suggested that further research be carried out regarding how the performance of this model varies when using differing data time periods (e.g., hourly, daily) [
30]. Finally, as noted above, Mexico experiences the majority of its rainfall June through September with relatively dry periods the rest of the year, except in select areas in the southern part of the country. As such, larger tanks sizes are needed than those needed in regions with relatively consistent precipitation throughout the year.
Municipalities with higher annual rainfall can achieve Optimal Access with smaller areas than those with comparatively lower rainfall as is shown in the models developed. However, it is apparent that rainwater storage tank size does not follow a similar behavior and instead depends more on the frequency or regularity of rainfall throughout the year. The municipalities with well-defined periods of drought, even those with high average annual rainfall, ended up requiring larger tanks to store rainwater than those with more even rainfall from month to month. Broadly, it was observed that all parameters (catchment area, inhabitants, water demand, and rainfall amount) influence the sizing of the rainwater tanks to some extent, but the greatest influence by far is the periodicity of the rainfall.
Correlations
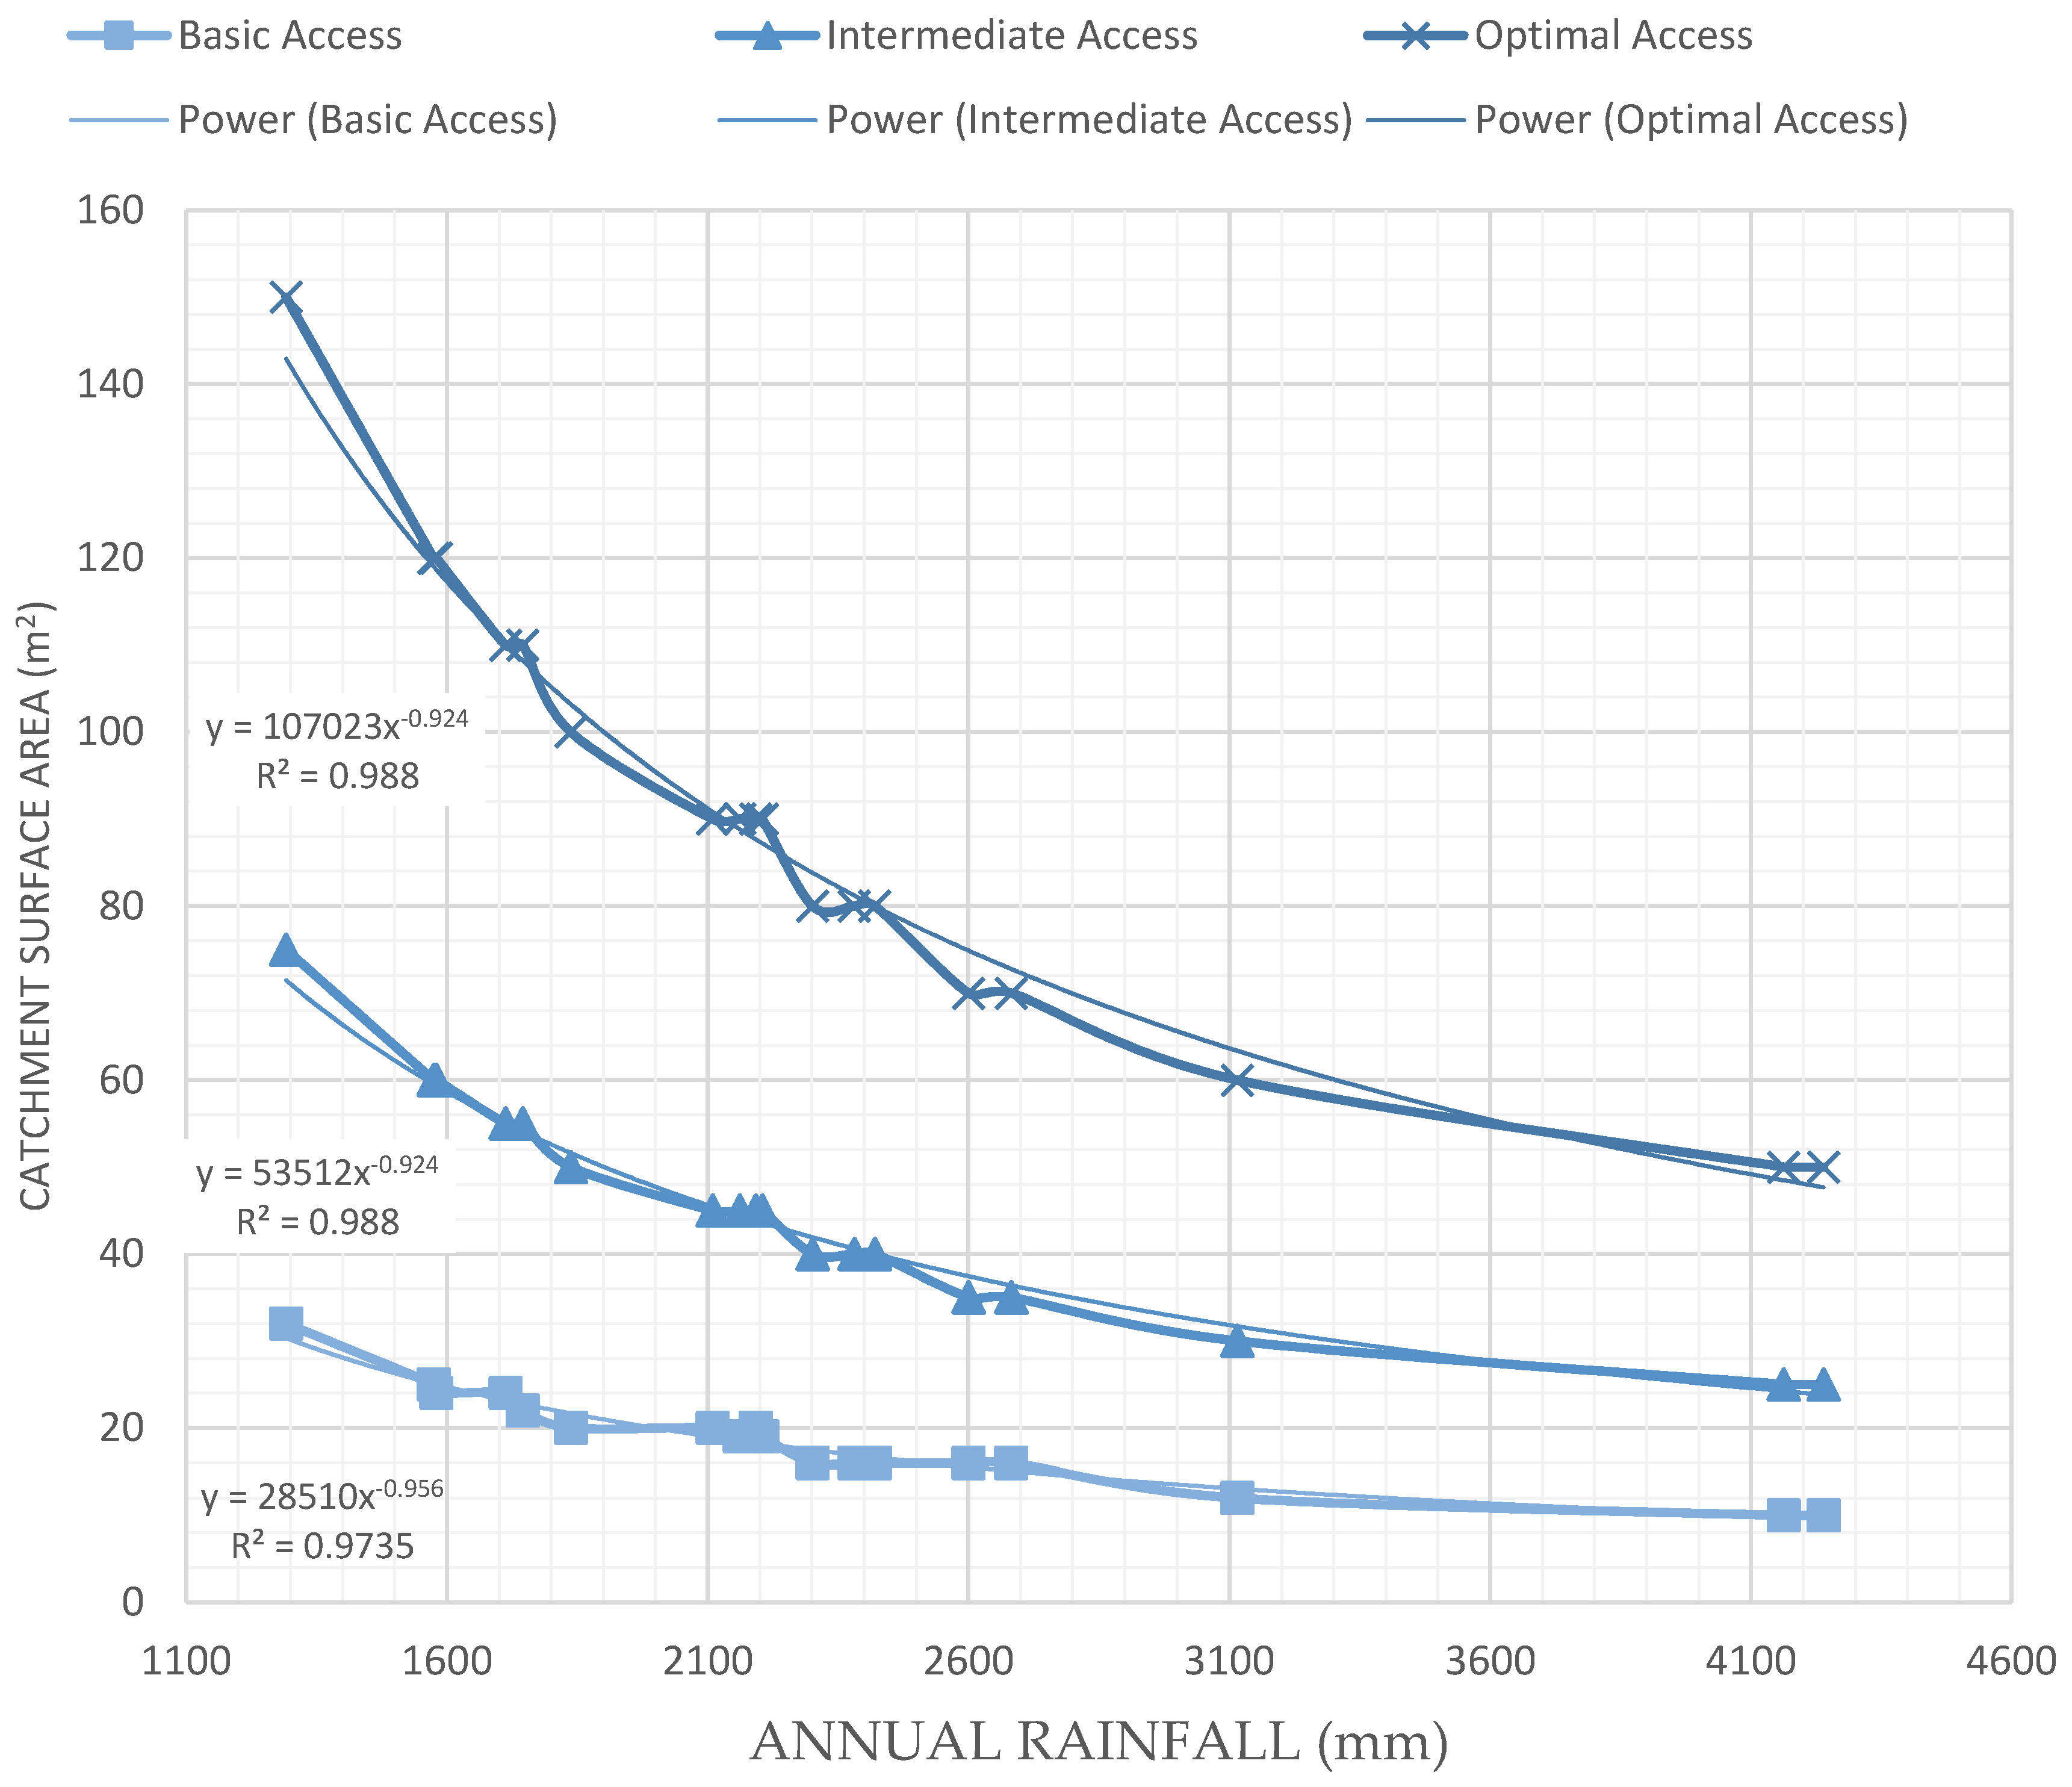
Due the relationship that exists between precipitation and the components of DRWHS it is possible to establish a mathematical model that will allow us to estimate the catchment surface area required to meet the water demand. In this case the model was built for an average of four persons per house and precipitations from just under 1300 mm to slightly more than 4200 mm annually.
Figure 6 shows the functions obtained from the experimental results.
4. Conclusions
The focus of this study was to evaluate the potential use of rainwater catchment systems in marginalized communities to serve as the sole supply of potable water. The method developed prioritizes areas of high marginalization and high precipitation, while still providing a tool that can be used throughout Mexico for municipal and state level decision-making. High priority communities were selected as those with >40% of the popula tion without access to municipal water sources and 2000 mm annual precipitation due to their potential for high impact from the installation of DRWHS.
Values for catchment area and storage tank size were modeled for the 27 municipalities in the study using average annual rainfall by municipality as determined using the Thiessen polygon method; average number of inhabitants per household as determined by national data; and three different levels of service: Basic (20 L/hab/day), Intermediate (50 L/hab/day), and Optimal (100 L/hab/day), as determined by WHO guidelines.
A linear relationship between rainwater catchment area size and level of service was confirmed with a correlation coefficient of 1.00. A relationship was also found between annual rainfall and catchment area with R2 > 0.97 for all three levels of service, providing a quick method to determine catchment area given level of service and annual rainfall.
Storage tank sizes determined in this study were found to be greater than those reported in the literature which can be attributed to the following influences decreasing in supposed order of importance: the systems were modeled with the intention of serving as the sole supply of potable water as opposed to a supplementary supply; this method employs the use of readily available monthly data as opposed to difficult to obtain daily or hourly data; and much of Mexico experiences the majority of its precipitation during a relatively short four month period as opposed to evenly distributed rainfall throughout the year.
To develop a national rainwater harvesting program in Mexico it is necessary to have a local approach, however, using large scale models as a first approximation will facilitate such a daunting task. No doubt Mexico has the circumstances to exploit the technology of Domestic Rain Water Harvesting Systems given its geographic conditions and its shortcomings in water supply.


