Article

A Methodology to Assess and Evaluate Rainwater Harvesting Techniques in (Semi-) Arid Regions

1
Wageningen University, Soil Physics and Land Management Group, P.O. Box 47, 6700 AA Wageningen, The Netherlands
2
University of Anbar, 31001 Ramadi, Iraq
3
Institut des Régions Arides, Route de Djorf km 22.5, 4119 Medenine, Tunisia
*
Author to whom correspondence should be addressed.
Water 2016, 8(5), 198; https://doi.org/10.3390/w8050198
Submission received: 17 November 2015 / Revised: 20 April 2016 / Accepted: 4 May 2016 / Published: 13 May 2016

Abstract

:
Arid and semi-arid regions around the world face water scarcity problems due to lack of precipitation and unpredictable rainfall patterns. For thousands of years, rainwater harvesting (RWH) techniques have been applied to cope with water scarcity. Researchers have used many different methodologies for determining suitable sites and techniques for RWH. However, limited attention has been given to the evaluation of RWH structure performance. The aim of this research was to design a scientifically-based, generally applicable methodology to better evaluate the performance of existing RWH techniques in (semi-) arid regions. The methodology integrates engineering, biophysical and socio-economic criteria using the Analytical Hierarchy Process (AHP) supported by the Geographic Information System (GIS). Jessour/Tabias are the most traditional RWH techniques in the Oum Zessar watershed in south-eastern Tunisia, which were used to test this evaluation tool. Fifty-eight RWH locations (14 jessr and 44 tabia) in three main sub-catchments of the watershed were assessed and evaluated. Based on the criteria selected, more than 95% of the assessed sites received low or moderate suitability scores, with only two sites receiving high suitability scores. This integrated methodology, which is highly flexible, saves time and costs, is easy to adapt to different regions and can support designers and decision makers aiming to improve the performance of existing and new RWH sites.

1. Introduction

Aridity and climate change are the major challenges faced by farmers who rely on rainfed farming [1]. Especially in arid regions, farmers are faced with low average annual rainfall and variability in temporal and spatial distribution. In order to increase the availability of water for crop production and cattle grazing, inhabitants of dry areas have constructed and developed several types of Rain Water Harvesting techniques (RWH). RWH is a method for inducing, collecting, storing and conserving local surface runoff for agriculture in arid and semi-arid regions [2]. RWH is a likely viable option to increase water productivity at the production system level [3]. RWH and management techniques have a significant potential for improving and sustaining the rainfed agriculture in the region [4]. In fact, a wide variety of micro-catchment, macro-catchment and in situ RWH techniques are available in arid and semi-arid regions. The indigenous techniques, or those modified by the indigenous RWH practices, are more common and widely accepted by smallholder farmers than the others [5]. Throughout history, archaeological evidence has revealed RWH sites that were implemented in Jordan, the Al-Negev desert, Syria, Tunisia and Iraq. The earliest signs of RWH are believed to have been constructed over 9000 years ago in the Edom Mountains in southern Jordan [6,7]. The most common RWH techniques in arid and semi-arid regions are dams, terracing, ponds and pans, percolation tanks and Nala bunds. Tunisia is an example of the Mediterranean countries that are facing scarcity of water which will be worsened due to climate change, growing demand for water in agricultural and urban development and an expanding tourism industry [8]. To adapt to this development, Tunisians have developed and implemented several types of water harvesting techniques of which the most common are jessour, tabias, terraces, cisterns, recharge wells, gabion check dams and mescats [9,10].
The success of RWH systems depends mainly on identification of suitable sites and technologies for the particular area. Soil Conservation Service (SCS) with Curve Number (CN), Geographic Information System (GIS) and Remote Sensing (RS) and integrated GIS, RS with Multi-Criteria Analysis (MCA), have all been applied with different biophysical and socio-economics criteria to identify suitable locations for RWH. Several researchers have presented and applied the SCS with the CN method to assess how much runoff can be generated from a runoff area like in South Africa [11], and India [12,13].
Nowadays, the Geographic Information System and Remote Sensing are used to represent the biophysical environment and applied to identify suitable sites for RWH [1,10,14]. Other researchers have integrated GIS, RS and Multi-Criteria Analysis to assess the suitability of sites for RWH [15,16].
Ouessar et al. [17] developed and applied a simple tool to evaluate the structural stability of 12 sites (four jessour, four tabias and four gabion check dams) in southern Tunisia. Through physical inspection, the characteristics of the structures were rated and an overall score was given. The characteristics rated include a cross-section for the water and sediment components of the structure, infiltration potential, vegetation quantity, dyke material and dyke erosion. This study also assessed the hydrological impact of the water harvesting systems by adaptation and evaluation of the soil and water assessment model (SWAT).
Jothiprakash and Mandar [18] applied the Analytical Hierarchy Process to evaluate various RWH techniques (aquifer recharge, surface storage structures and concrete storage structures) in order to identify the most appropriate technique and the required number of structures to meet the daily water demand of a large-scale industrial area.
So far, most attention has been given to the selection of suitable sites and techniques for RWH [19] but little attention has been given to the evaluation of the RWH structure after implementation.
To understand the performance of RWH and to ensure successful implementation of new RWH, engineering (technical), biophysical and socio-economic criteria need to be integrated into the evaluation tools [20,21]. In addition, the relation and importance of the various criteria also needs to be taken into consideration.
The overall objective of the study, therefore, was to develop and test a comprehensive methodology to assess and evaluate the performance of existing RWH in arid and semi-arid regions. To achieve this goal, we developed a new RWH evaluation and decision support tool. In this tool, engineering, biophysical and socio-economic criteria were taken into account to assess the performance of existing RWH, using the Analytical Hierarchy Process supported by GIS. To develop and test this assessment tool, the Oum Zessar watershed in south-eastern Tunisia was selected as a case study. Jessour and Tabias are the most common RWH techniques in the Oum Zessar watershed and they are used in our methodology.

2. Materials and Methods

2.1. Case Study: Wadi Oum Zessar

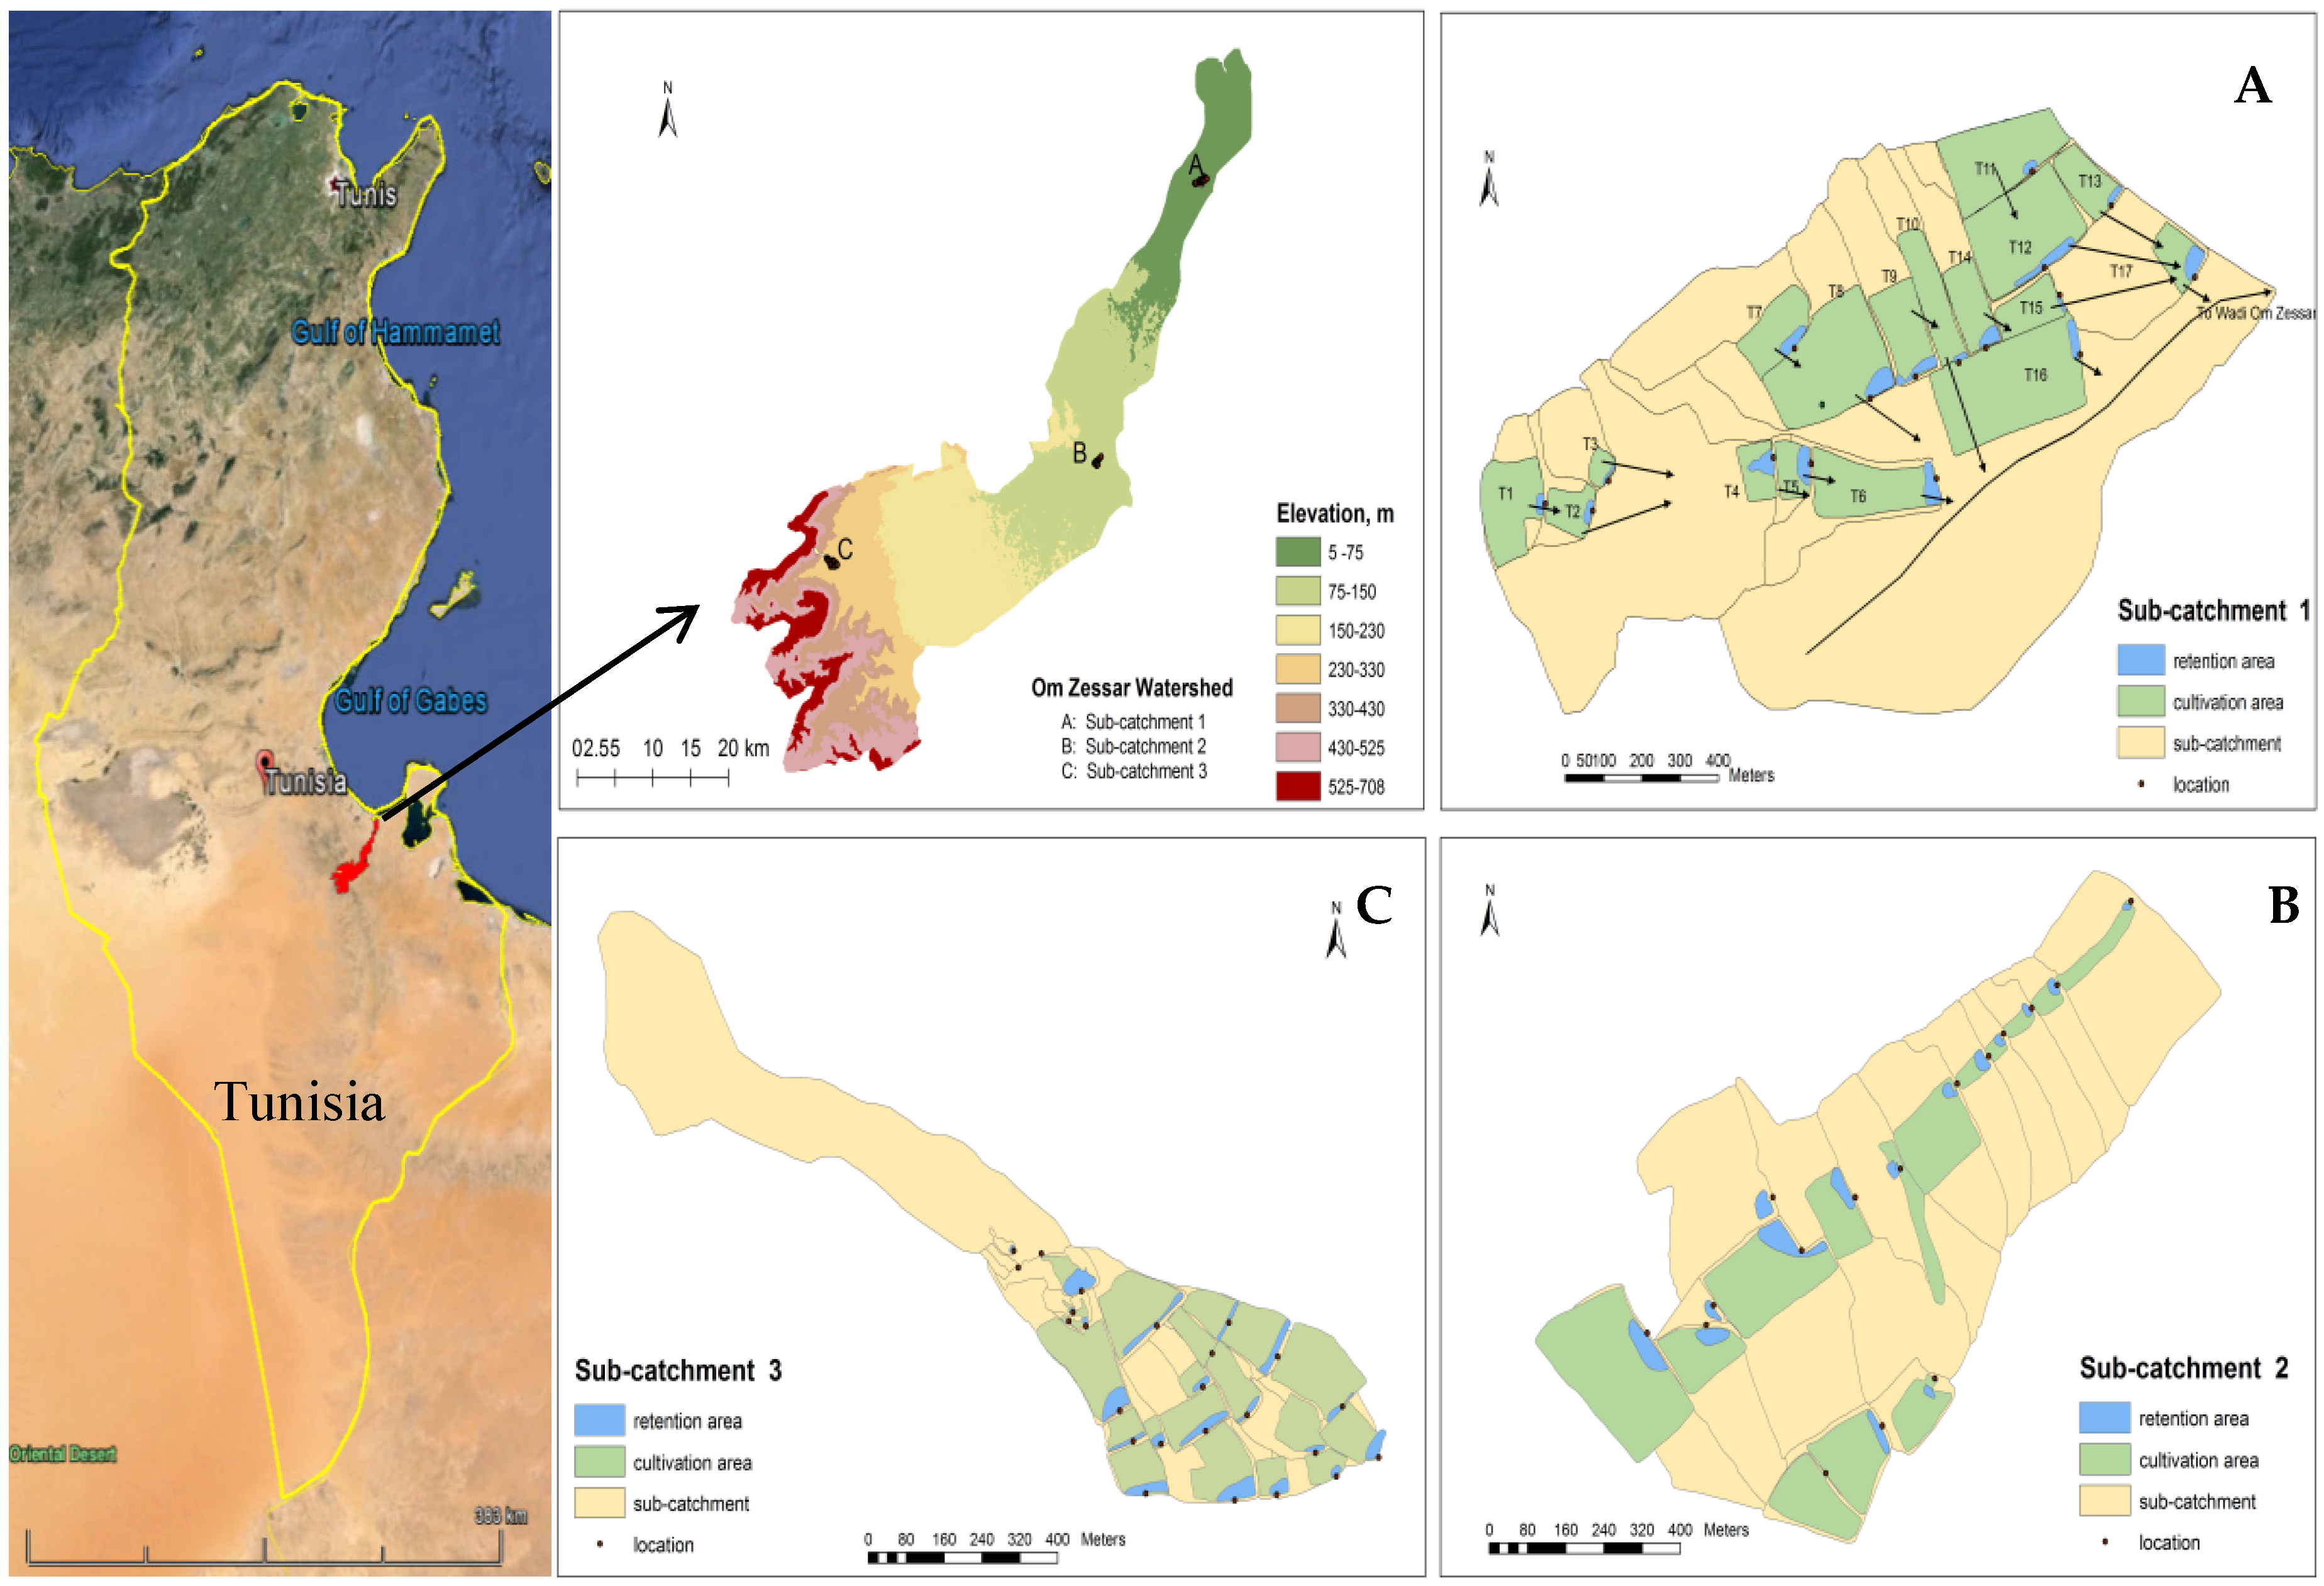
To test the RWH evaluation tool we conducted a case study in the Wadi Oum Zessar watershed located in Medenine province in the south-eastern part of Tunisia (Figure 1). The Wadi Oum Zessar watershed has a surface area of 367 km2. The area is characterized by a low arid Mediterranean climate, with an average annual rainfall of 150–230 mm·y−1, and average annual temperature of 19–22 °C. Rainfall occurs mainly in winter (40%), autumn (32%) and spring (26%), while summer is almost rainless [22].
Several types of RWH exist in the study area to satisfy water requirements for agriculture and ground water recharge. The most common RWH systems in the region are jessour and tabias; spreading of flood water and groundwater recharge structures in the wadi beds are applied too [23].
To test the RWH evaluation tool, three representative sub-catchments were selected based on four criteria.
  • Representative of the geographic distribution of our watershed; one located in upstream another in the midstream and one in downstream.
  • Representative of the different types (jessour and tabias), scale (small and large) and age of RWH systems (new and old).
  • Source and destination of collected rainwater for each sub-catchment.
  • Accessibility; easy to access physically and acceptance of the local people.
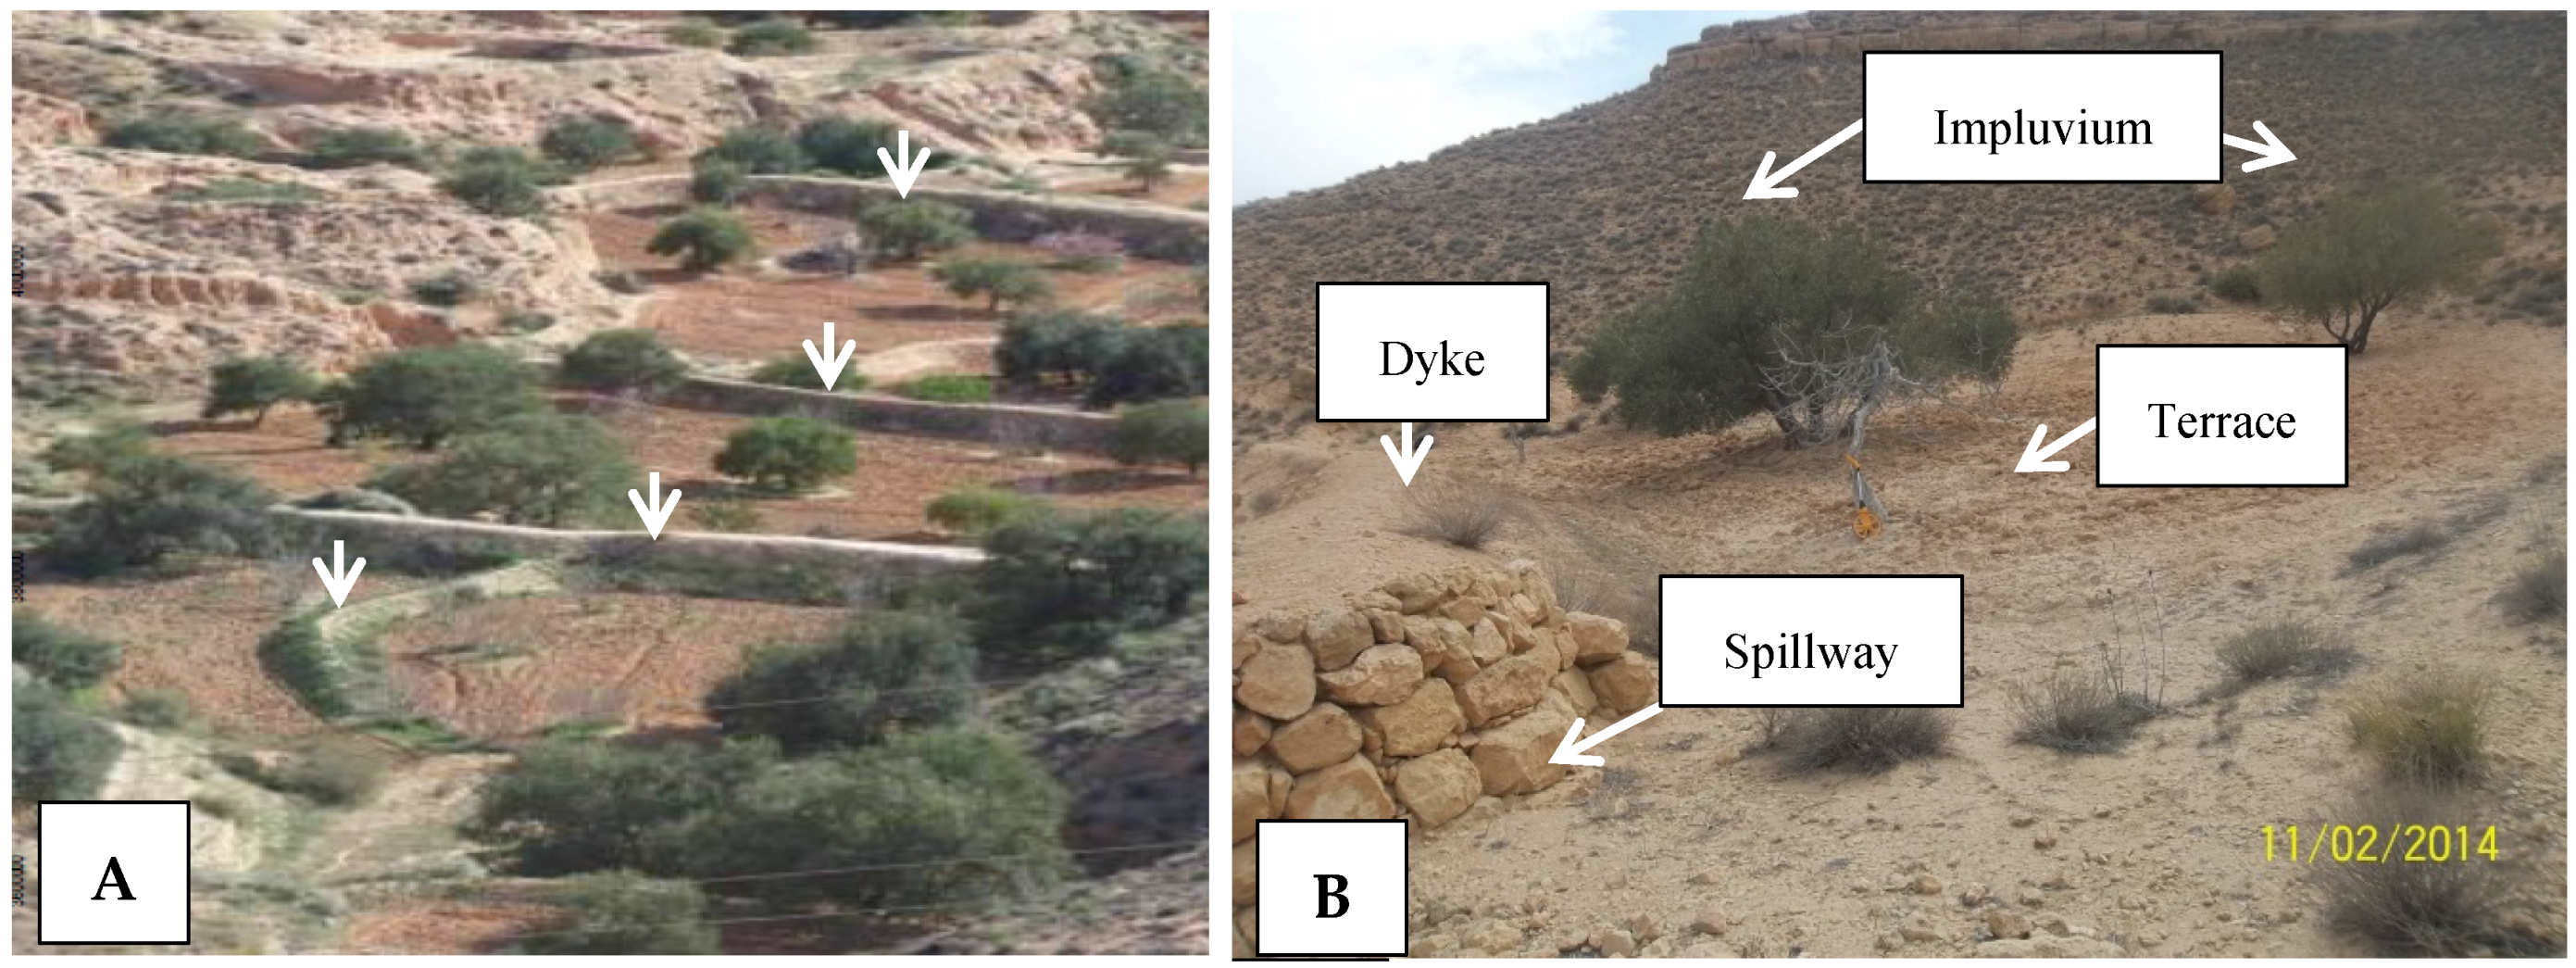
These three sub-catchments are located in the downstream (Sub-catchment 1), middle (Sub-catchment 2), and upstream (Sub-catchment 3) of Oum Zessar watershed as shown in Figure 1. Each jessr (singular of jessour) or tabia consists of three parts: the impluvium or catchment area providing the runoff water; the terrace or cultivation area where the runoff water is collected and crops or trees are grown; and the dyke, which is a barrier to catch water and sediment. Each dyke has a spillway (menfes if the spillway is located on one or both sides and masref if the spillway is located in the middle of the dyke) to regulate water flow between dykes (see Figure 2).

2.2. General Description of the RWH Evaluation Decision Support Tool

This research aims to develop a more comprehensive and relevant evaluation tool for RWH structures. To achieve this goal, we developed a simple and robust assessment tool for the evaluation of RWH sites (structures) which is inexpensive, simple to apply, reliable and flexible with different criteria and easy to adapt to various RWH techniques and regions. The Analytical Hierarchy Process (AHP) forms the base for this tool.
The AHP is a multi-criteria decision making method, providing a structured technique for organizing and analyzing complex decisions, based on mathematics and expert knowledge [24]. It was developed by Thomas Saaty in the 1970s and, since then, has been applied extensively in different disciplines. The main principle of AHP is representing the elements of any problem hierarchically to show the relationships between each level. The uppermost level is the main goal (objective) for resolving a problem and the lower levels are made up of the most important criteria that are related to the main objective. Pairwise comparison matrixes are constructed and scaled in preference from 1 to 9 for each level. Then, the consistency of each matrix is checked through the calculation of a consistency ratio (cr). The cr should be smaller or equal to 10% [25]. The weight for each criterion and the cr are determined, then all matrixes are solved.

2.3. Methodology Overview

AHP is particularly useful in multi-index evaluation and consists in our RWH evaluation tool of the following steps:
  • Describe the main objective of the intervention;
  • Identify the biophysical, engineering (technical) and socio-economical main and sub-criteria;
  • Develop a decision hierarchy structure;
  • Collect and process the data for each sub-criteria;
  • Classify the values for each sub-criteria in terms of suitability classes;
  • Apply the pairwise comparison matrix to identify priorities (weights) for each criterion;
  • Calculate the RWH performance (suitability);
  • Check the results with the stakeholders; and
  • Decide based on conclusions and recommendations

2.3.1. Description of the Main Objective of the Intervention

In our case study, the main objective is to collect and store runoff water during the rainy season to enable farmers to grow profitable crops and mitigate drought spells in arid and semi-arid regions.

2.3.2. Identification of the Main and Sub-Criteria

This step formulates the set of criteria for the assessment based on the main objective. All major aspects should be represented, but the set should be as small as possible (simple and flexible). In addition to engineering (technical) aspects, social and economic aspects should also be included. Furthermore, the set of criteria has to be operational (e.g., measurable) and not redundant (the set should not count an aspect more than once).
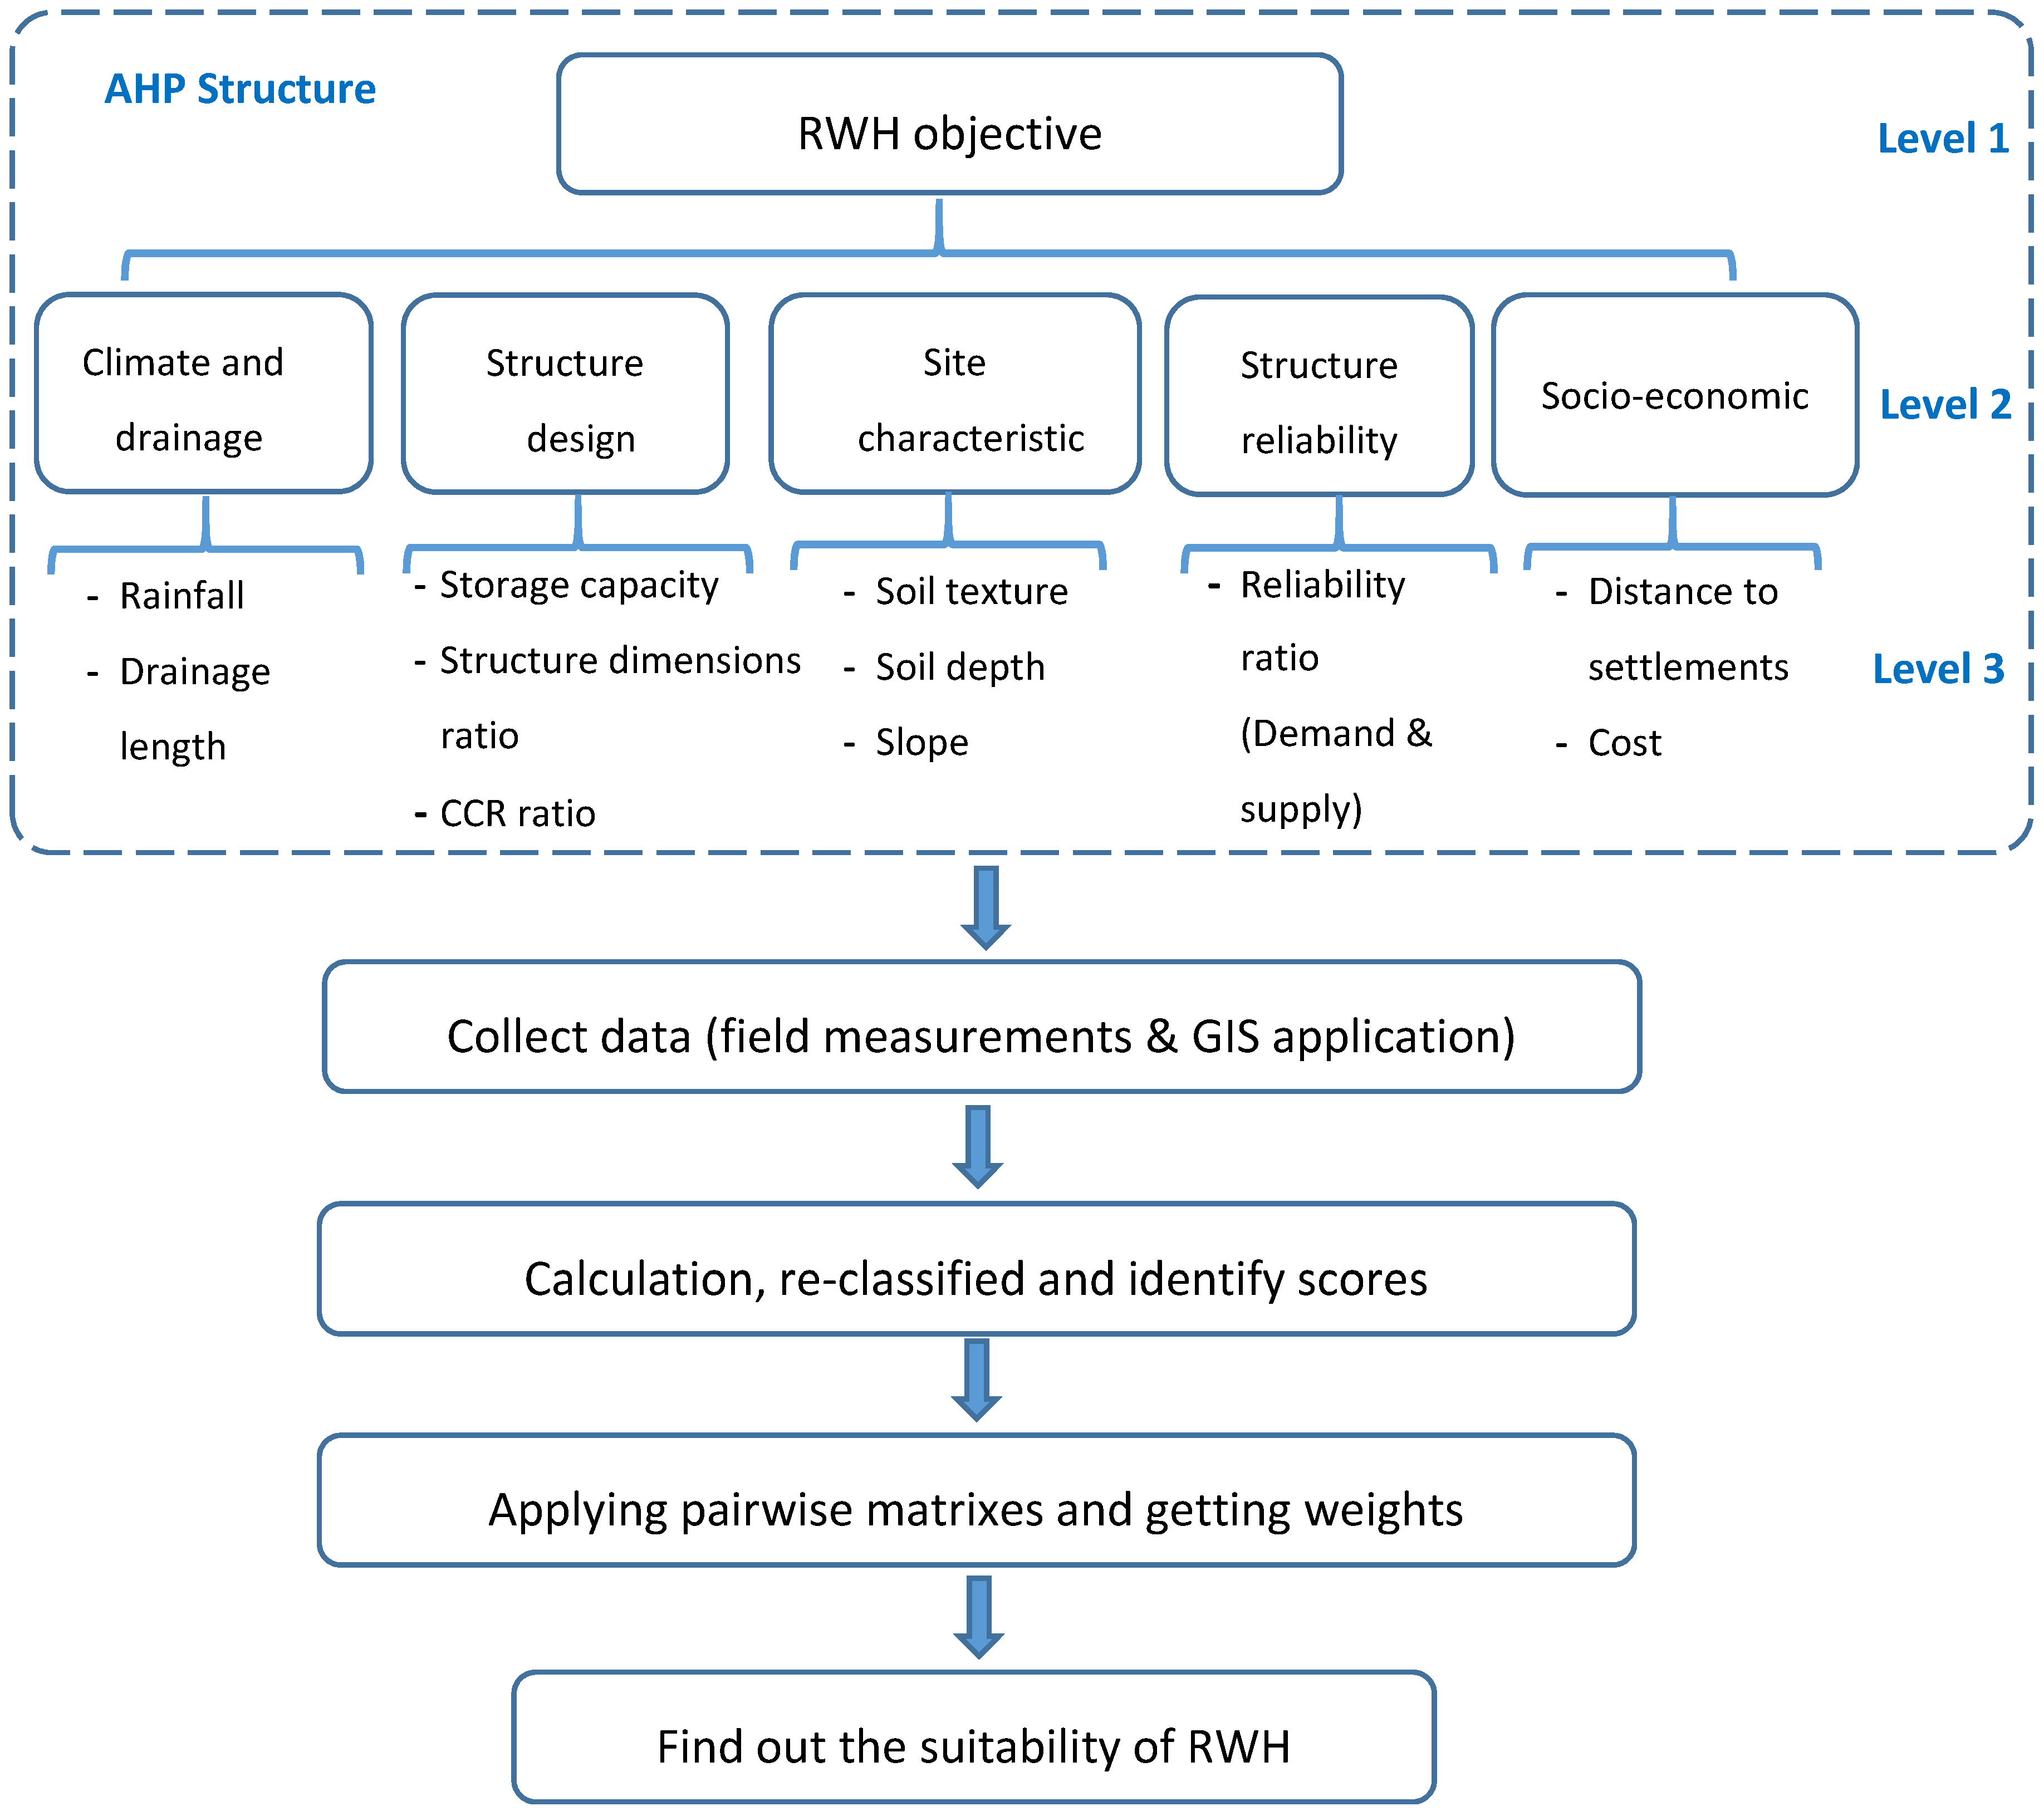
In this study, we looked for criteria that represent the key parameters affecting the performance of RWH interventions and which could be applied to different sites and techniques. The parameters we were concerned with were based on the general definition of RWH, i.e., a method for inducing, collecting, storing and conserving local surface runoff for agriculture in arid and semi-arid regions [2], and information found in literature studies. The main selected criteria and sub-criteria are shown in Figure 3, and reflect the following questions:
  • How suitable is the local climate for RWH (Climate and drainage)?
  • What is the engineering (technical) performance of the RWH intervention (Structure design)?
  • How suitable is the location for RWH (Site characteristics)?
  • How well does the RWH satisfy the water demand (Reliability)? and
  • How well does the RWH technique fit in with the social economic context (Socio-economic criteria)?
Sub-criteria were chosen based on the relation with the main criteria (above), field investigations, expert discussions and literature studies.

2.3.3. Development of the Decision Hierarchy Structure

In this step, the main criteria and sub-criteria are arranged in a multilevel hierarchical decision structure. In this study case, the objective of the RWH (jessour and tabias) represents the first level. The second level contains the main criteria for the assessment. These criteria define the aspects by which the intervention is assessed e.g., how it fits within the local conditions (climate, drainage length and landscape), functionality and reliability based on the engineering design, and socio-economic aspects. The sub-criteria used to measure the performance of each main criterion are represented in the third level. Figure 3 shows the structure of the applied methodology for our case study.

2.3.4. Collection and Processing of the Data for Each Sub-Criteria

The definition, data collection, field measurements, storage and processing of data, as well as the calculations used for each criterion is explained in detail in the Section 2.4.

2.3.5. Classification of the Values for Each Sub-Criteria in Terms of Suitability Classes

Due to the variety of measurements and scales for the different criteria, a comparable scale between criteria must be identified before applying AHP tools. For instance, rainfall depth is measured in mm while soil texture is measured by the percentage of clay content. Therefore, the selected criteria were re-classified into five suitability classes, namely, 5 (very high suitability), 4 (high suitability), 3 (medium suitability), 2 (low suitability), and 1 (very low suitability). For example, suitability Class 3 is considered to be acceptable performance, while suitability Class 1 means that the RWH does not work well and that one or all criteria that caused this insufficient performance need improvement. Table 1 shows the scores assigned based on discussions and consultations with experienced people and information found in the literature.

2.3.6. Application of Pairwise Comparison Matrix to Identify Priorities (Weights) for Each Criteria

After assignment of scores, the weight for each criterion was determined by applying AHP with the pairwise comparison matrix. Pairwise comparison concerns the relative importance of two criteria involved in determining the suitability for a given objective. A pairwise matrix is first made for the main decision criteria being used. Other pairwise matrixes are created for additional criteria levels. The comparison and rating between two criteria are conducted using a 9-point continuous scale, the odd values 1, 3, 5, 7, and 9 correspond respectively to equally, moderately, strongly, very strongly and extremely important criteria when compared to each other. The even values 2, 4, 6 and 8 are intermediate values [26]. During pairwise comparison, criteria were rated based on the literature review, information from the field survey and discussions with stakeholders and experts. The final weight calculation requires the computation of the principal eigenvector of the pairwise comparison matrix to produce a best-fit set of weights. The consistency of each matrix, which shows the degree of consistency that has been achieved by comparing the criteria, was checked through the calculation of consistency ratio (cr). The cr should be smaller or equal to 10%, otherwise they are judged as not consistent enough to generate weights and, therefore, have to be revised and improved [25].
To find out the final weight for each criterion and the cr, we solved the pairwise matrixes mathematically. The results of the main criteria from the pairwise comparison and the final weight are presented in the results section.
In this study, two methods were applied. In the first, the hierarchy structure consists of all three levels; the objective, main criteria (5 criteria) and sub-criteria (11 criteria). In the second method, the hierarchy structure consists of just two levels: the objective and the sub-criteria (11 criteria). By applying these two methods, the understanding of the relation between each criterion and its reflection on the main objective becomes much clearer, and they confirm the flexibility of AHP to adopt different criteria on multi-levels. Moreover, this will give an insight into whether there are any mistakes and how they will be distributed or fixed, and gives more reliability and confidence in our methodology for adoption in different regions and/or for different criteria.

2.3.7. Calculation of the RWH Performance (Suitability)

The next step in the assessment methodology is the calculation of the overall suitability for each RWH site. The overall RWH suitability was calculated by applying the following formula:
S = i = 1 n W i   X i
where: S: suitability; W: weight of criteria i; X: score of criteria i; i, n: number of criteria
The overall suitability will be classified also from 1 to 5, namely, 5 (very high suitability), 4 (high suitability), 3 (medium suitability), 2 (low suitability) and 1 (very low suitability).

2.3.8. Discussion of the Results with Stakeholders

It is important to check the results with the stakeholders, including the preliminary conclusions and recommendations. If felt that something is missing or has changed, additional measurements or recalculation with different weights might be necessary. Thereafter, results have been presented again to the local stakeholders for discussion and approval.

2.3.9. Decision Making Based on Conclusions and Recommendations

The main results of the assessment will give insight into if and how a RWH structure can be improved to increase its performance. Once there is general agreement on the results between stakeholders and scientists, a well-founded decision can be made on what structure needs to be improved for better performance of the RWH system.

2.4. Data Collection

Different data sources were used. Meteorological as well as other biophysical data, was collected from the Institute des Régions Arides (IRA) in Tunisia. Field measurements were carried out in the Wadi Oum Zessar during the period from December 2013 through March 2014. An open structure interview was made with key stakeholders (41 landowners and farmers) and discussions with people working and having experience with RWH (15 experts), particularly the engineers from the Regional Department of Agriculture in Medenine. A pairwise matrix was established and the relative weights for each criterion and suitability rank for classes are assigned as shown in Table 1. GIS was also applied to extract data that are needed in our methodology. All collected and measured data were stored and processed using Excel software.

2.4.1. Climate and Drainage Data

Rainfall

Rainfall is one of the major components in any RWH system, with the magnitude of rainfall playing a significant role in assessing the RWH suitability for a given area. In arid and semi-arid regions, rainfall varies greatly in time and space. RWH systems can only function if there is sufficient rainfall in the catchment area to be stored somehow. Average monthly rainfall for the period 1979–2004 was collected from IRA for 7 meteorological stations in the Wadi Oum Zessar watershed, namely Ben Khedache, Toujan Edkhile, Allamat, Koutine, Sidi Makhlouf, Ksar Hallouf and Ksar Jedid. The rainfall amount in the three test sub-catchments was determined by applying the Inverse Distance Weight (IDW) function from ArcGIS 10.0 to interpolate the data from these stations. The rainfall depth data was then reclassified and scored as shown in Table 1. Areas with high annual rainfall are ranked as highly suitable.

Drainage Length

Since RWH interventions (especially jessour and tabias) are located on the hydrographic network and their location is influenced by topography, the distance from the water course has a significant role in the assessment of RWH performance. In this study, the distance from a RWH site to the drainage networks is used to represent the runoff suitability. By determining the location of the furthest point contributing to runoff [31], the drainage system was classified to each of the RWH sites (short distance means fewer water losses). The distances from the water courses to each dyke were measured using Google earth image and ArcGIS software.

2.4.2. Structure Design

Storage Capacity

One of the main principles of RWH is storing water to mitigate drought effects in dry seasons. Technically, the volume of water harvested and the amount retained over a reasonable duration of time is one indicator of the performance of RWH.
Potential runoff (V1 in m3) from a catchment area was calculated by:
V 1 = 0.001 × C × P × A
C: The mean annual runoff coefficient (-); equal (0.18) based on the simulations done by Schiettecatte et al. [32].
P: The mean annual precipitation (mm)
A: The catchment area (m2)
The total volume of water inflow (Vi) is, therefore:
V i = V 1 + V 2 + V 3
where V2 (m3) is the overflow from upstream dyke(s) and V3 (m3) is the volume of rainfall onto the storage area.
During the field measurements, the retention area and maximum potential depth of water (height of spillway) were measured with GPS and measuring tape. Then, the existing storage volumes were calculated (by multiplying the retention area by spillway height). Finally, the ratio between the total volume of water inflow (Vi) and existing storage capacity were calculated and scored. If the ratio, for example, equals 1–2, it means that the total inflow volume will be similar to the storage capacity or there is excess water that will be an overflow to the downstream. Therefore, the ratios that are close to one are ranked as highly suitable (Table 1).

Structure Dimensions

The dimensions of RWH structures are very important for achieving stability, controlling flood hazard and water supply. Furthermore, the primary goal of a structure is to harvest water for irrigation crops; the secondary goal is for flood protection. In this study, we assessed the existing height of dykes or barriers for each RWH structure and then compared this with the theoretical (required) design height.
The existing dyke’s height for each site was measured in the field. The total volume of water that could be collected behind each dyke was calculated as noted in the previous section. The effective dyke height was calculated using this information. The free board, the vertical distance between the top of the dam and the full supply level, was calculated using standard dam design principles and added to the effective dyke height to determine the theoretical design height for each site. The ratio between existing and design dyke height was calculated and scored, as shown in Table 1.

Catchment to Cropping Area

To provide sufficient water to the crops, the terrace area should be not too large and the impluvium area should be enough. Therefore, an optimal ratio between impluvium area and terrace area has to be found. Depending on effective rainfall and runoff rates, the ratio between the catchment (impluvium) and cropping (terrace) area (Ca/C) can be determined. According to Schiettecatte et al. [32], the minimum ratio (Ca/C) “impluvium area/terrace area” (design) can be calculated by:
C a C = ( W R P ) / C P
where WR is the annual crop water requirement, P is the average annual precipitation (mm) for the period 1979–2004, and C is the average annual runoff coefficient (0.18) of dry soil and wet soil which was measured by Schiettecatte et al. [32]. For olive trees, the WR is estimated to be 500 mm·y−1 [32]. Catchment area (impluvium) and cropping area were delineated with GPS in the field, and the areas were calculated using ArcGIS. At the end, the CCR ratio between the design and existing “impluvium area/terrace area” were calculated and scored.

2.4.3. Site Characteristics

Soil Texture

Soil texture is a very important factor in selecting, designing and assessing the performance of RWH. Soil texture affects both the infiltration rate and surface runoff. The textural class of a soil is determined by the percentage of sand, silt and clay. Soil texture also determines the rate at which water drains through a saturated soil; for instance, water moves more freely through sandy soils than it does through clayey soils. High infiltration rates such as with sandy soil are not suitable for RWH structure. Clay soils have a greater water holding capacity than sandy soils, therefore, soil with high water holding capacity are more suitable for RWH. Indeed, Mbilinyi et al. [33] and others conclude that clay soil is best for water storage due to its low permeability and ability to hold the harvested water.
In this research, the terrace area was sampled at different sites (based on the size of terrace area, 1–3 samples for each site) and at depths of up to 1.3 m. The samples were taken to the IRA laboratory and analyzed. The clay contents (%) were measured, rated and classified into five suitability classes, as shown in Table 1.

Soil Depth

Soil should be deep enough to allow excavation to the prescribed depth for RWH, to ensure both adequate rooting development and storage of the harvested water. Critchley and Siegert [20] and Kahinda et al. [1] used soil depth as one criterion for selecting potential sites for RWH. Both soil depth and soil texture determine the total soil water storage capacity, which controls the availability of water for crops during the dry periods [9]. We measured soil depth in the field using a steel bar hammered into the ground until it could go no further and by checking the soil levels between two successive terraces. Then, soil depth data were categorized and classified into five suitability classes, as shown in Table 1.

Slope

Slope is also a major factor in site selection, implementation and assessment of RWH. It plays a significant role in runoff and sedimentation quantity, the speed of water flow and quantity of material required to construct the dyke structure (dyke’s height).
Using DEM (30 m resolution) and ArcGIS 10.0, the slope was extracted for each catchment area and reclassified. Due to the large variety of slope values between jessour and tabias, different suitability classes were used for each type as shown in Table 1.

2.4.4. Structure Reliability

The relation between the demand and supply of water (reliability) is a good indicator of the performance of a RWH structure. Based on the function (purpose) of each technique, the demand for each RWH site was calculated. In our case, the main purpose of RWH is for on-site crop production.
The total demand was calculated by estimating the crop water requirements (evapotranspiration ETc) plus losses to downward percolation, based on the field measurements by Schiettecatte et al. [32] in the same watershed.
T h e   t o t a l   d e m a n d = E T c + D o w n w a r d   p e r c o l a t i o n
Schiettecatte et al. [32] applied the Penman-Monteith method to calculate potential evapotranspiration (PET) and used data from the meteorological station at Medenine to calculate the average PET values over the period 1985–1995.
The maximum crop evapotranspiration (ETc) was calculated by:
E T c = P E T × k c
where kc is the crop coefficient. Table 2 above shows the values for PET, ETc and kc.
The infiltration ratios were used to calculate the downward percolation based on the soil texture results, as shown in Table 3 [34].
From the relation between storage capacity and total runoff volume from Equation (2), the total potential volume of supply water was calculated. Reliability was calculated as the ratio between total demand and the total supply of water for each site.

2.4.5. Socio-Economic Criteria

The success of an intervention depends not only on technical aspects but also on how well it fits within the stakeholder’s social context and the economic benefit it provides him/her. Bamne [35], Al-Adamat [27] and Nasr [36] argued that one of the main reasons we do not use RWH sufficiently in the Middle East and North Africa is insufficient knowledge of the socio-economic contexts. There are several socio-economic criteria such as ownership, family size, education etc., and to identify good indicators for socio-economic conditions in relation to the functioning of these RWH systems is much more difficult than the biophysical ones. In this case study based on the literature studies and expert discussion, we are using distance to the settlements and cost per cubic meter of water as the socio-economic criteria influencing how suitable the intervention is for the main stakeholders.

Distance to Settlements

Since the local community is targeted in this study, the distance to the settlements is an important parameter in the design, selection and assessment of the RWH suitability [6]. We assumed that the distance to their home would influence the way they manage this system. Each farmer has scattered farming fields at a radius of about 20 m–1 km from his house. Therefore, it is very logical that the closer the field, the easier are the maintenance operations, particularly in the mountain zones where transportation is difficult. The distance for each site was measured using the image from Google earth and the ArcGIS program. Thereafter, as with other criteria, the values were reclassified and scored.

Cost Per Cubic Meter of Water

Cost plays a significant role in the design and assessment of RWH sites. In order to assess the cost effectiveness of each structure, the establishment and annual maintenance costs for each site were calculated. The actual costs for each structure were not available; the main problem with the jessour and tabia is that they do not have fixed designs (different shapes and sizes). Therefore, it is difficult to calculate the exact cost for each structure. Thus, the costs have been estimated by using the best available resources. The cost for each jessr or tabia was calculated based on the World Overview of Conservation Approaches and Technologies (WOCAT) database [30] and interviews with the local farmers. The costs for each jessr/tabia include the establishment and maintenance cost per year. The establishment costs consist of dyke construction, plantations, spillway construction for jessour and diversion channels and terracing for tabia. The maintenance costs consist of crop and tree maintenance, dyke and spillway maintenance, repairs and reconstruction. The overall costs for jessre per year are 3000 US$ for establishment and 900 US$ for maintenance. Whereas, 670 and 200 US$ for establishment and maintenence for tabia per year, respectively [30]. Based on the field measurements, the length for each jessr/tabia was measured and then the cost for each meter length of jessr/tabia was estimated. These costs are similar to the values that were discussed with local farmers. The volume of collected water in each storage area and maintenance and construction costs of the jessour/tabias were used to calculate the cost per cubic meter of water, which was then classified and scored.

2.5. Application of the Assessment Tool for Different Test Sub-Catchments

We first tested our methodology on a catchment that has only one type of RWH structure. Sub-catchment one has just 17 tabias and no jessour and a total area of about 20 ha. It is located in the downstream area of the Oum Zessar watershed, as shown in Figure 1.
To further validate the methodology and criteria, we applied it on the other two sub-catchments, which have different characteristics. The second sub-catchment is located in the middle of Wadi Oum Zessar and has 16 RWH structures, 9 tabias followed (downstream) by 7 jessour, and a total area of about 19 ha. Sub-catchment three is located in the upstream part of Wadi Oum Zessar, with 25 RWH—8 jessour followed by 17 tabias—and a total area of about 45 ha.

3. Results

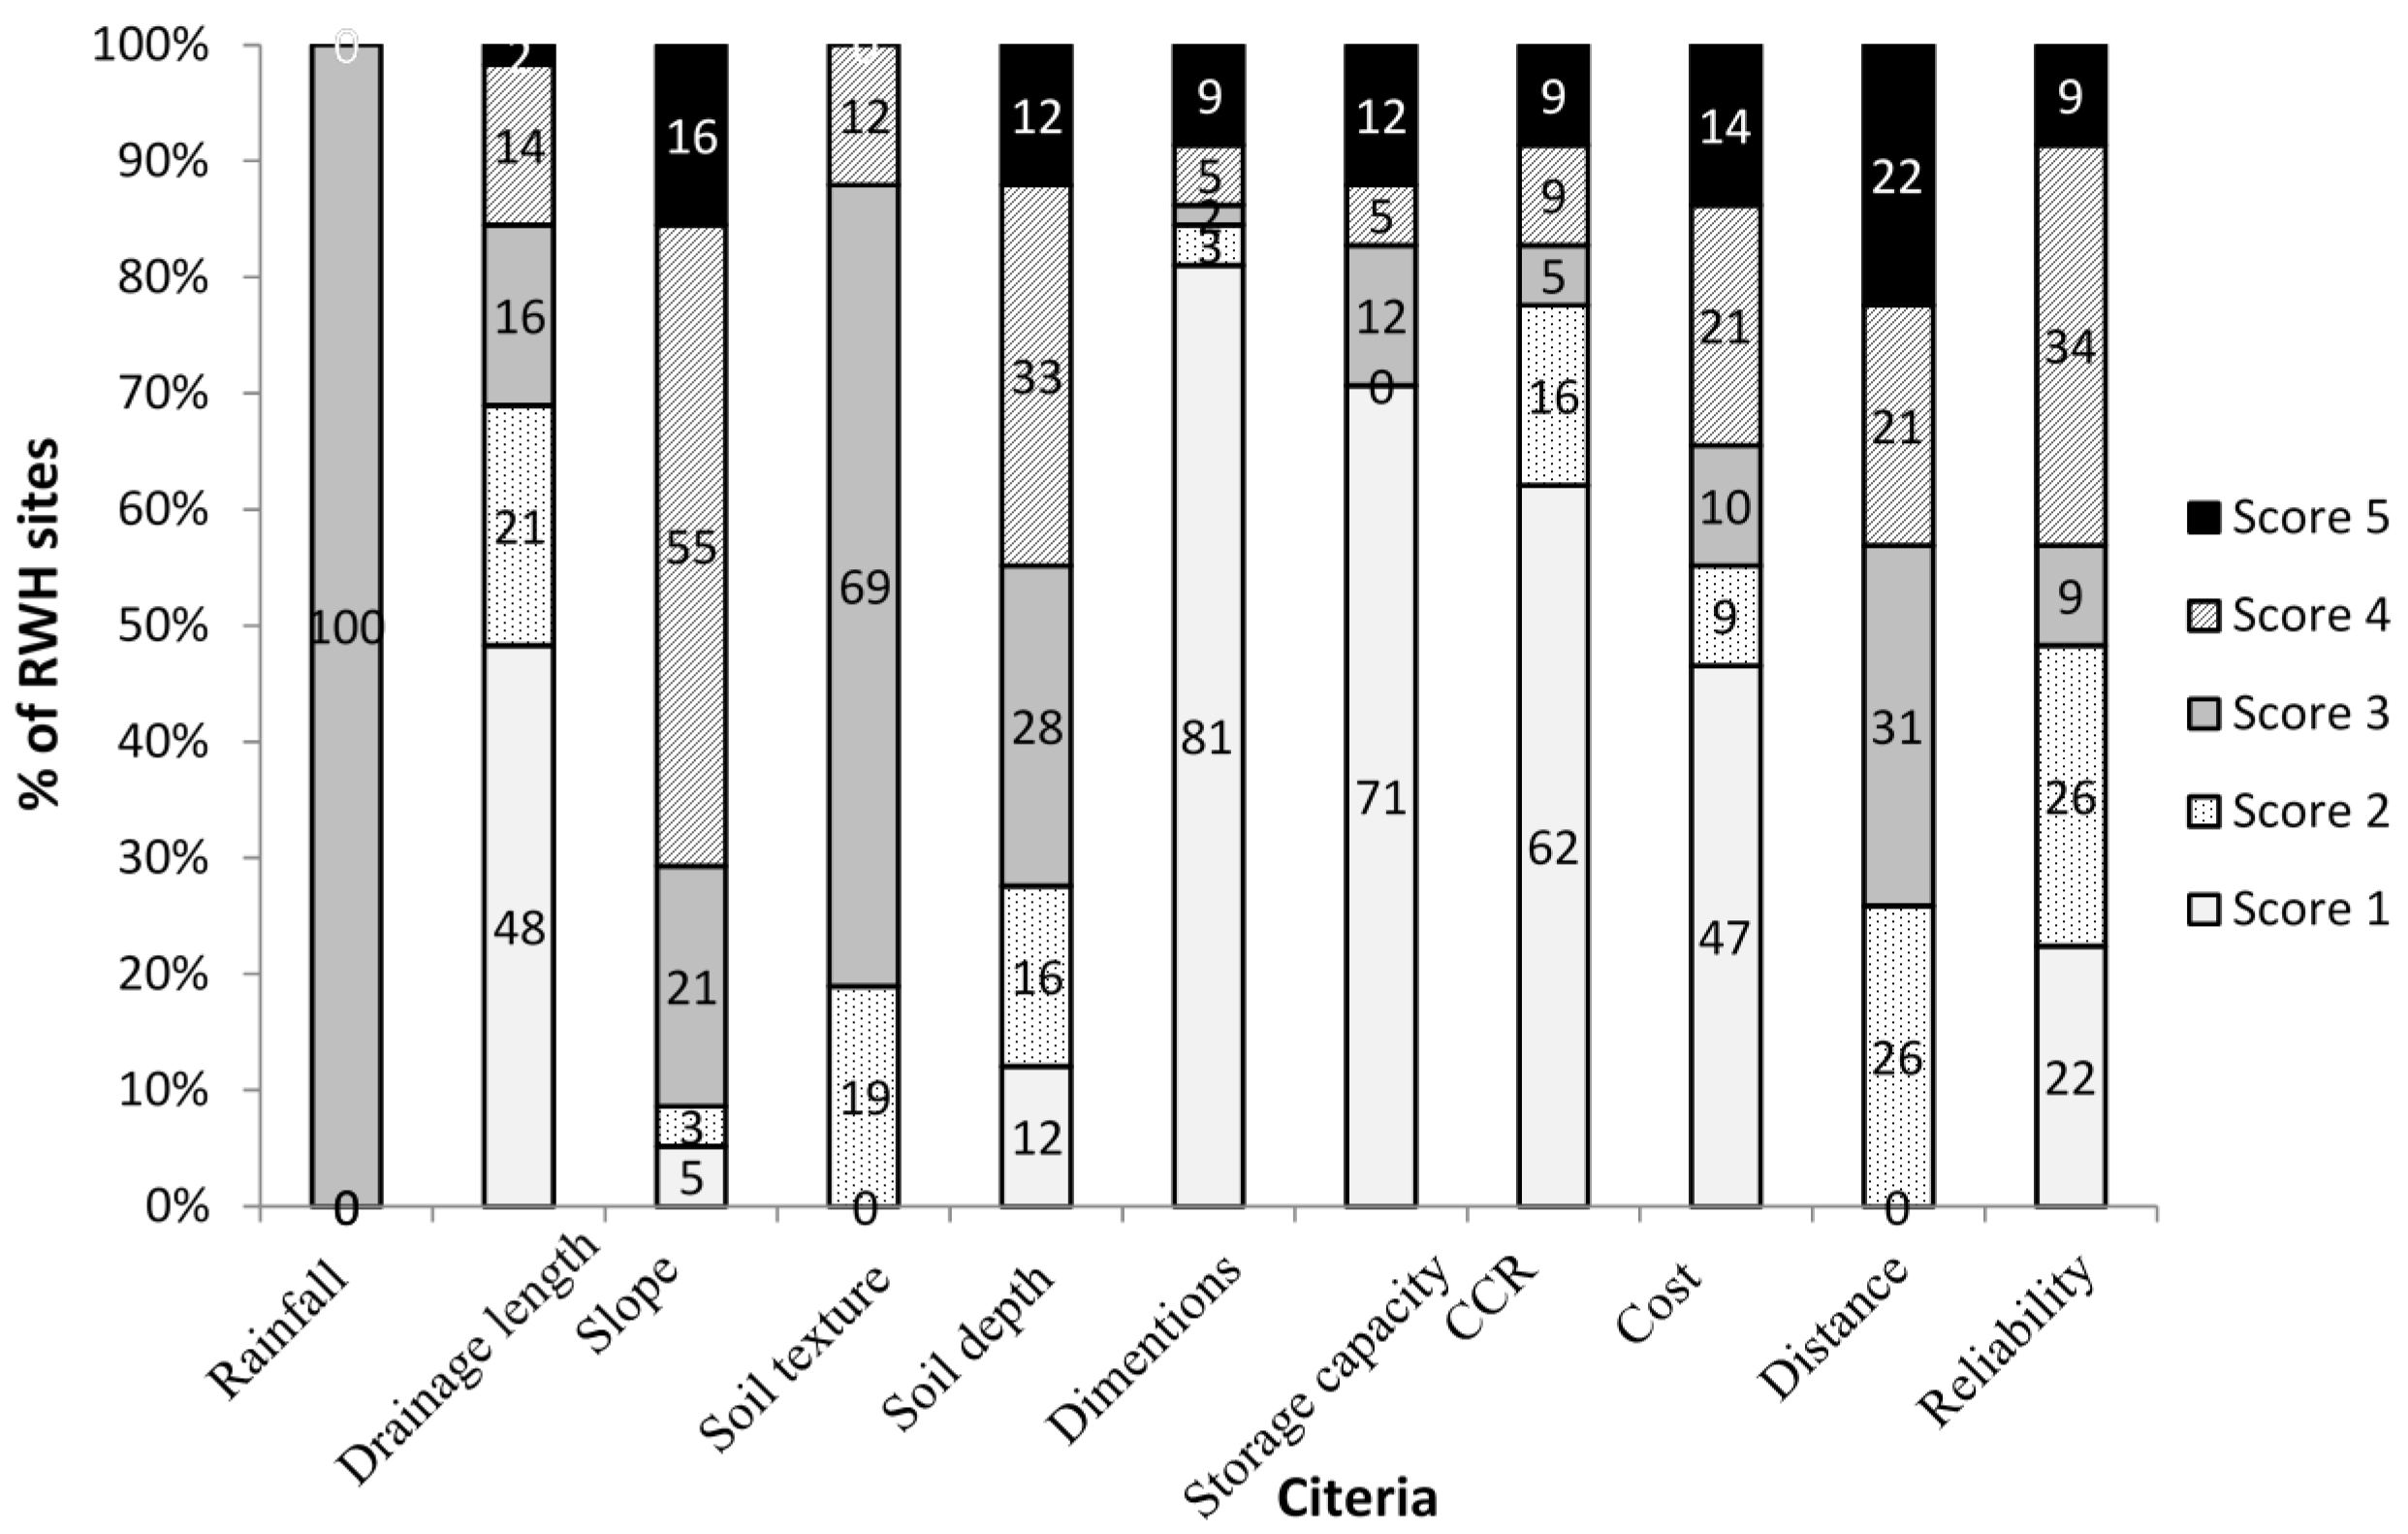
All the collected data for each site were stored and analyzed in Excel. The results for each criterion were then classified according to the five classes as defined in Table 1. Figure 4 shows the scores percentages (5 scores) of each sub-criteria (11 criteria) for all 58 sites. The rainfall criterion got a score 3 in all sites since there was no big difference in rainfall pattern nor amount (175–185 mm·y−1) in the three sub-catchments due to the relatively small area. The criteria related to the design structure, like dimensions, storage capacity, CCR, drainage flow and costs got a high percentage of scores of 1 in many sites. More details about suitability and scores for the three sub-catchments are explained in the following sections.

3.1. AHP & Suitability

During pairwise comparison, criteria were rated based on the literature review, interviews with key stakeholders, field survey information and discussions with people working and having experience with RWH, as shown in Table 4. For instance, the reliability and socio-economic criteria have similar relative importance to the main objective of the RWH system, as shown in this Table, and each of them has 1 as a relative importance rate.
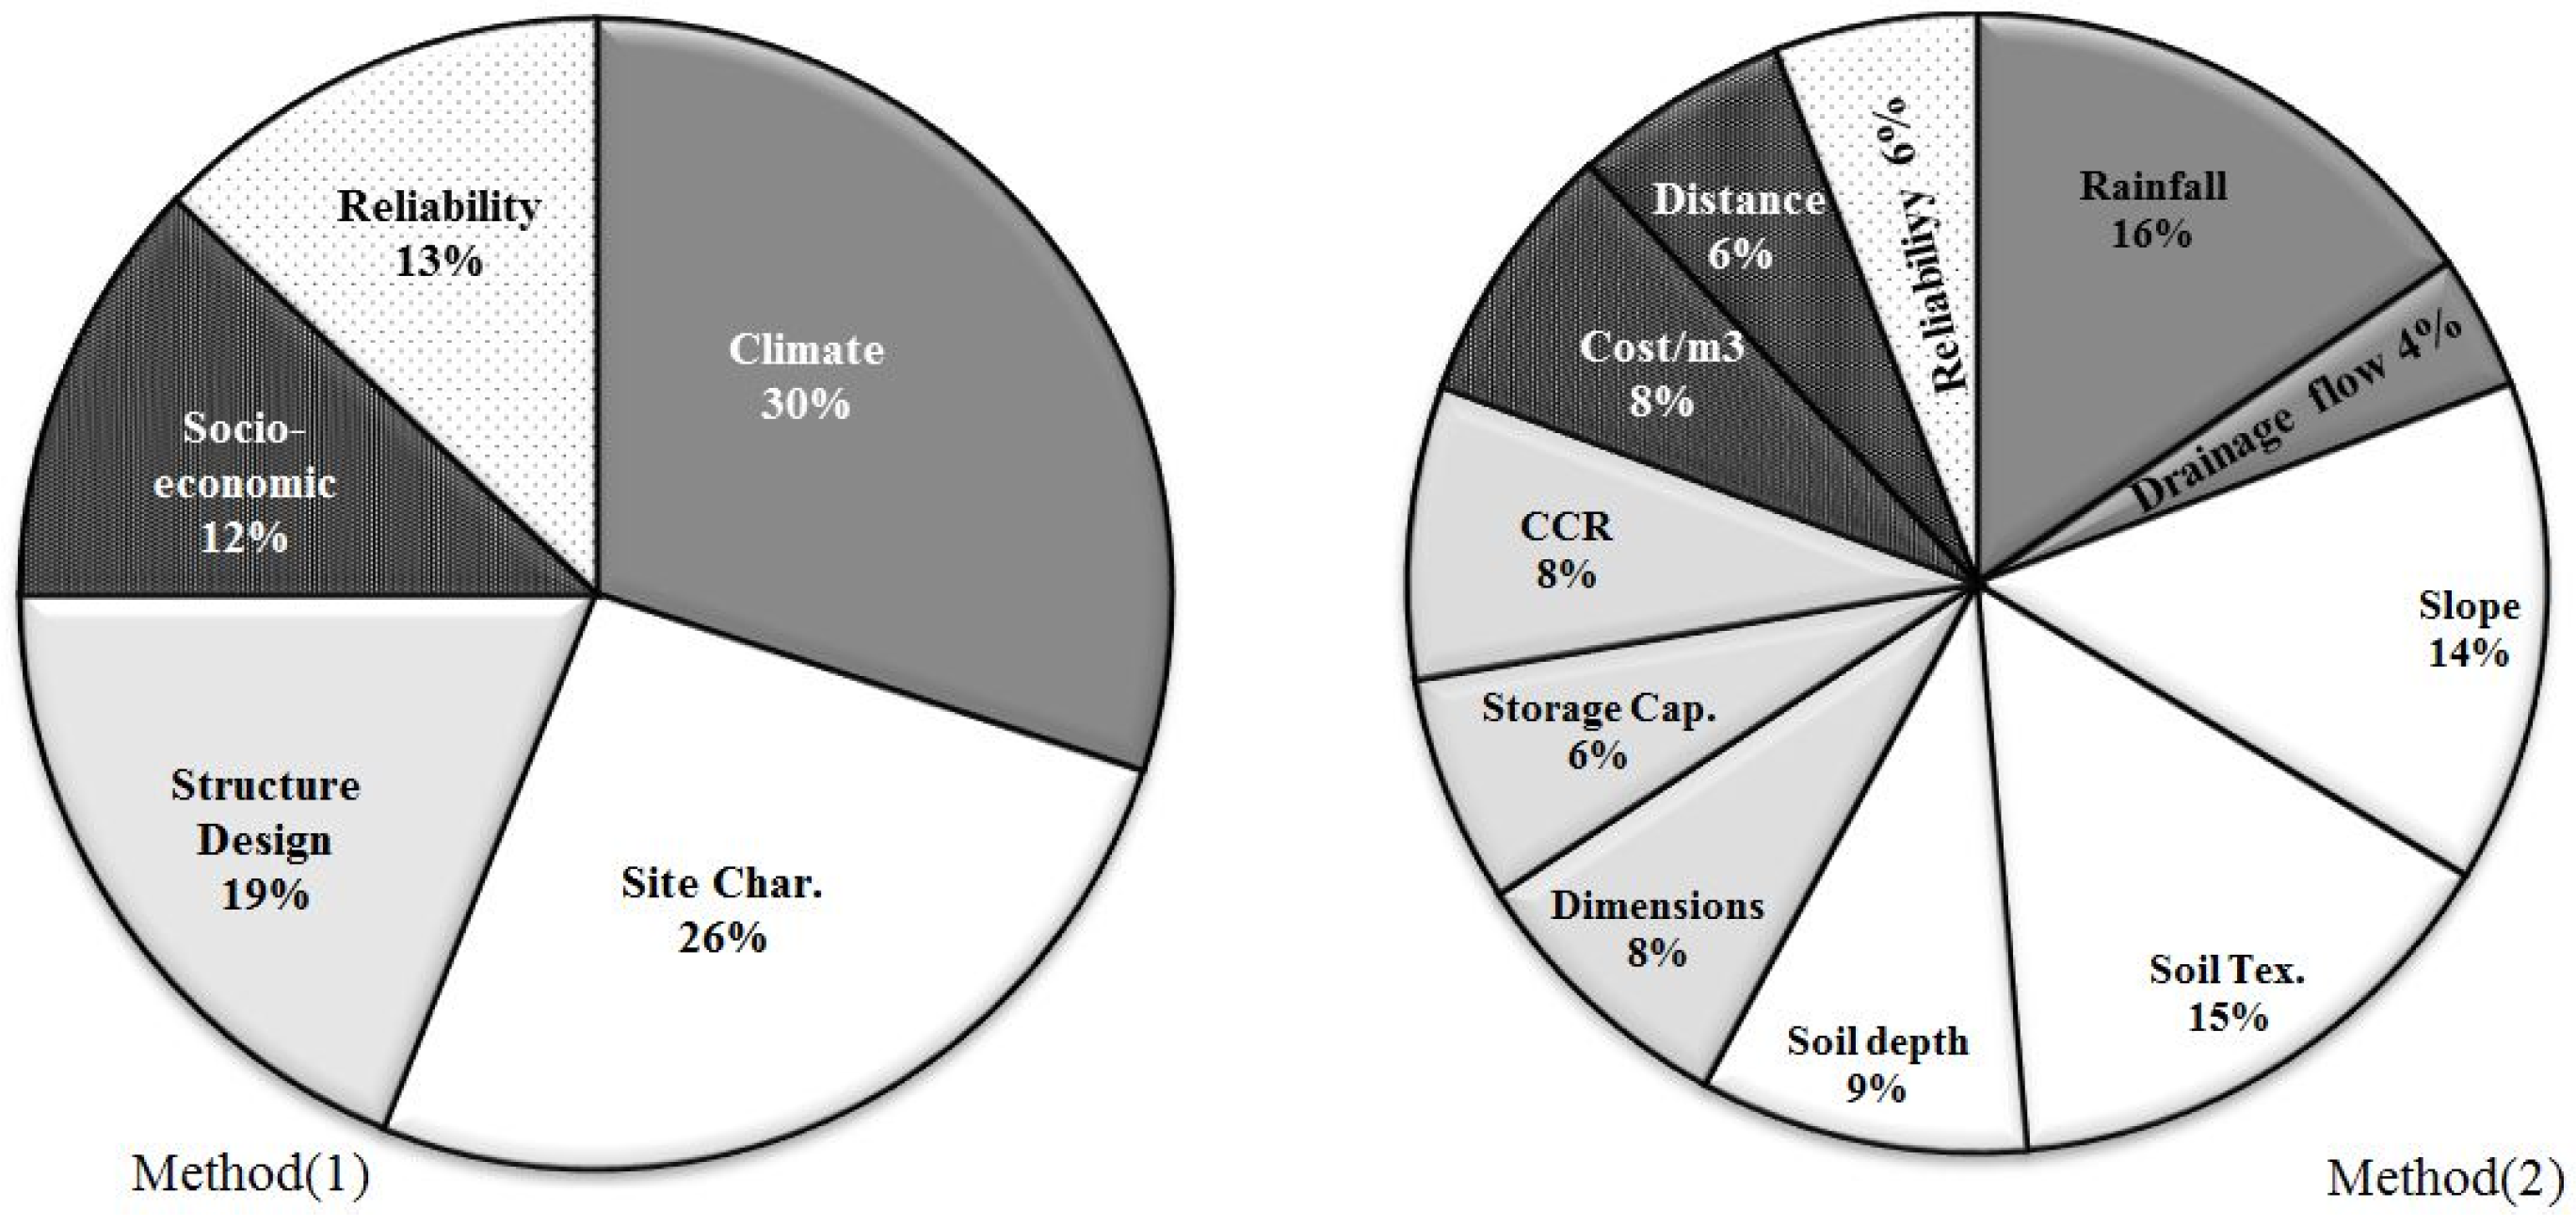
A pairwise matrix was established and the relative weights for each criterion and suitability rank for classes are assigned as shown in Figure 5 and Table 1. The climate and rainfall criteria received the highest weights in both methods (three levels and two levels AHP). The values for each criterion were calculated and reclassified based on the 5 suitability classes and Equation (1) was applied to get the final suitability score for each site.

3.2. Test Results Sub-Catchment 1

Table 5 shows measurements and scores for each criterion for the tabias receiving the highest (9 and 14) and lowest (10 and 15) suitability scores when AHP Method 1 was applied (before applying Equation (1)).
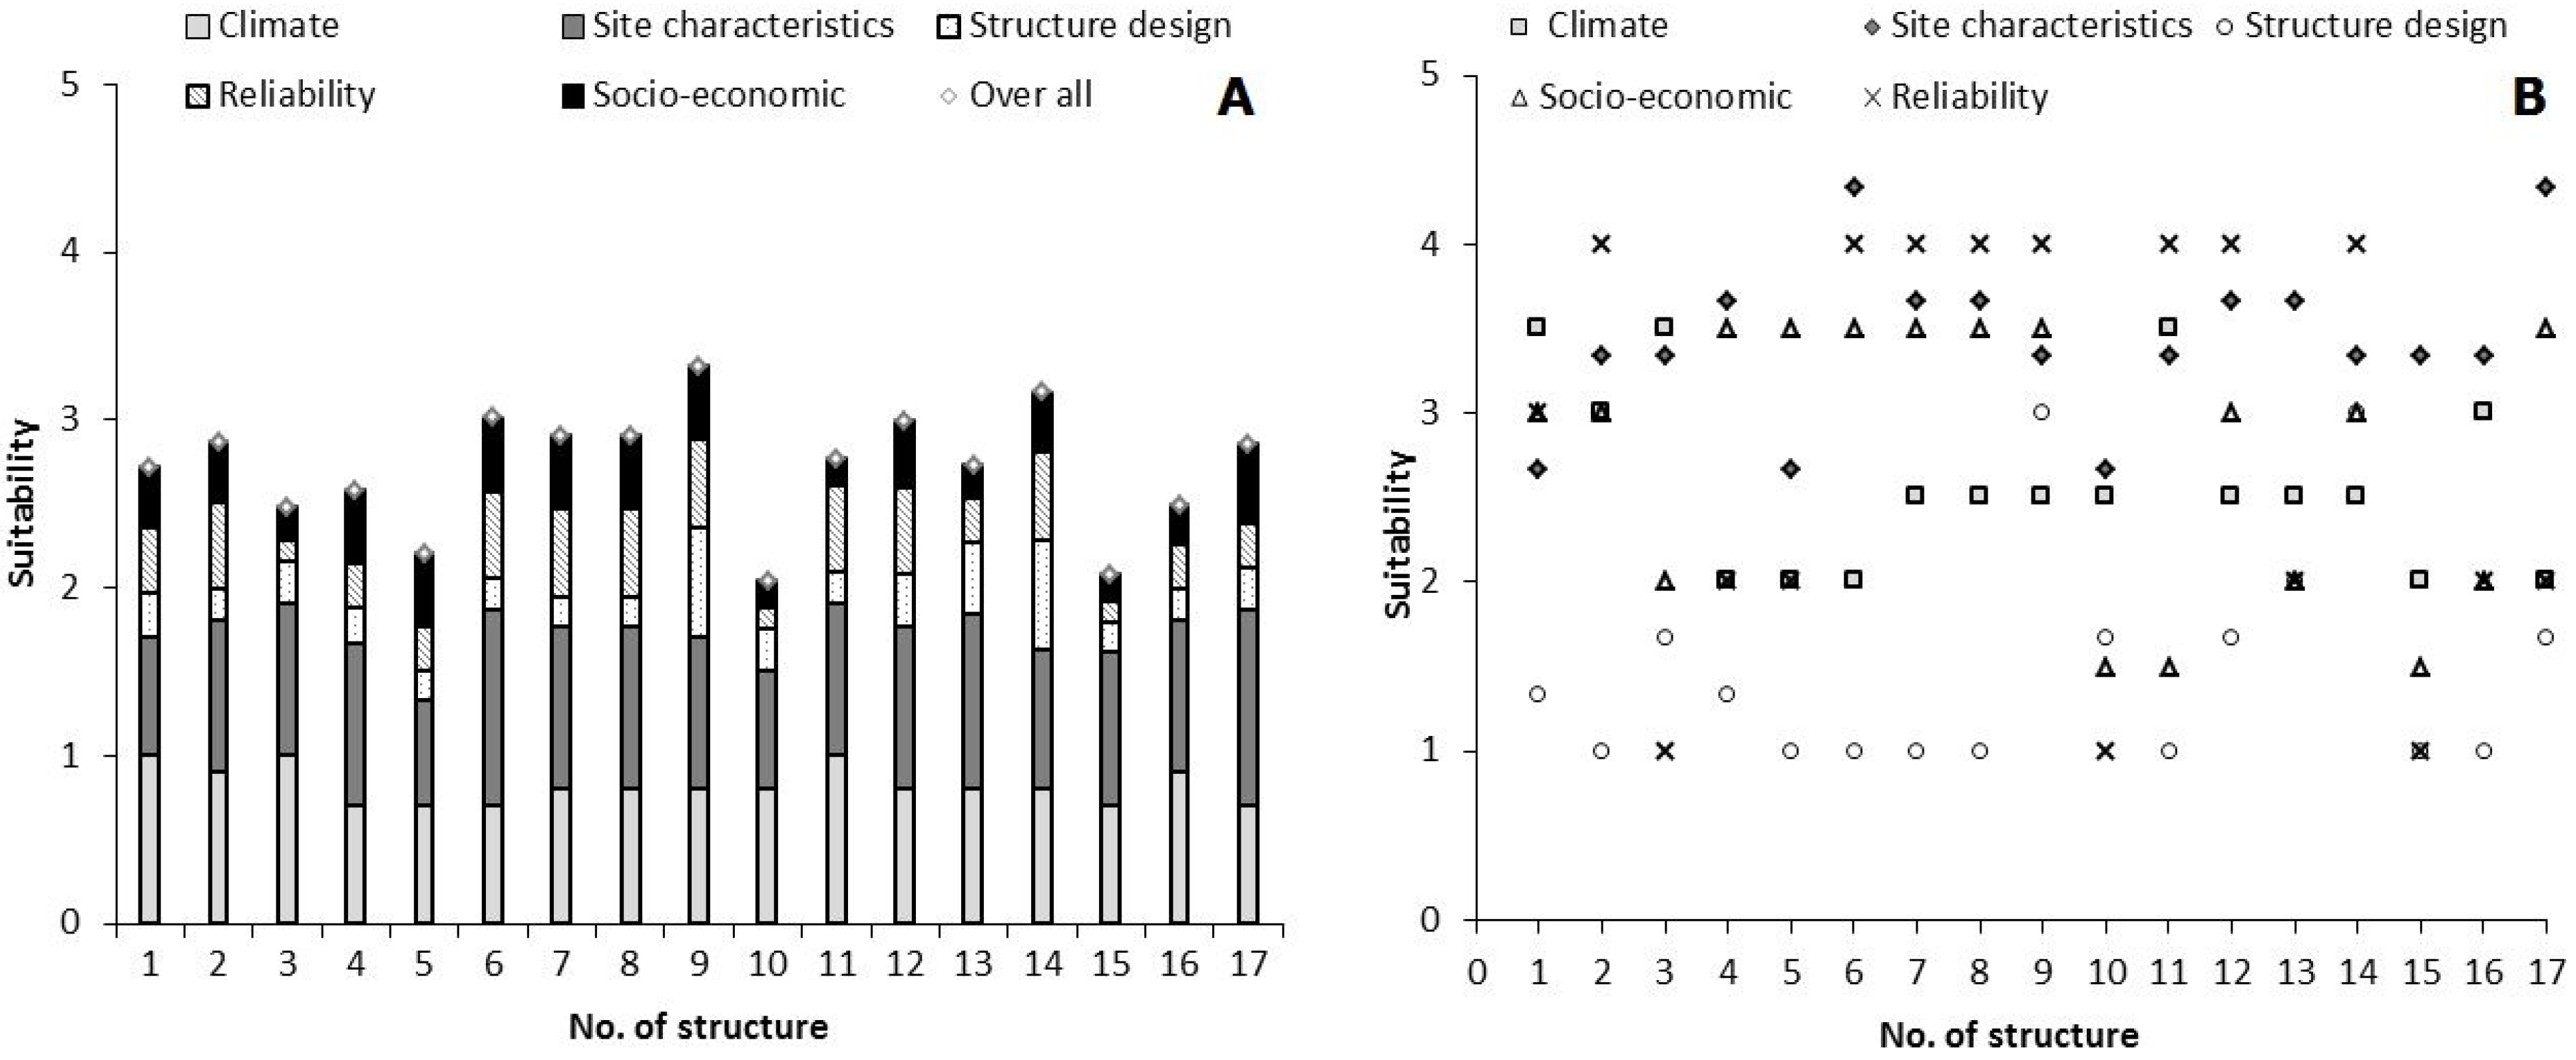
Figure 6A shows the overall suitability scores and the suitability score for each criterion based on Method 1 (three levels) after applying Equation (1). The highest overall score was 3.32 (medium suitability) for tabia 9, whereas the lowest score was 2.04 (low suitability) in tabia 10.
Design criteria (structure dimensions, storage capacity and catchment area to cropping area) are playing a significant (negative) role in the overall RWH suitability for most of the tabias in Sub-catchment 1. These sites scored the lowest on design criteria, resulting in the low overall performance of these RWH sites. This result confirmed the observations of performance in the field.
A possible reason for the poor design is a lack of selection procedure for suitable RWH sites in combination, in this case, with structures built without a proper engineering design. Figure 6B shows the suitability scores for each criterion without multiplying by the weights.
In Method two (two levels), the pairwise matrix was applied directly on the sub-criteria. Table 6 shows the overall suitability and the suitability for each criterion for the highest (9 and 14) and lowest (10 and 15) scoring tabias using this method. Once again, the design criteria of dimension and storage capacity had a significant negative impact on the difference between the high-scoring and low-scoring tabias. However with Method 2, CCR did not stand out as a differentiating factor, but reliability and cost did.

3.3. Test Results Sub-Catchments 2 and 3

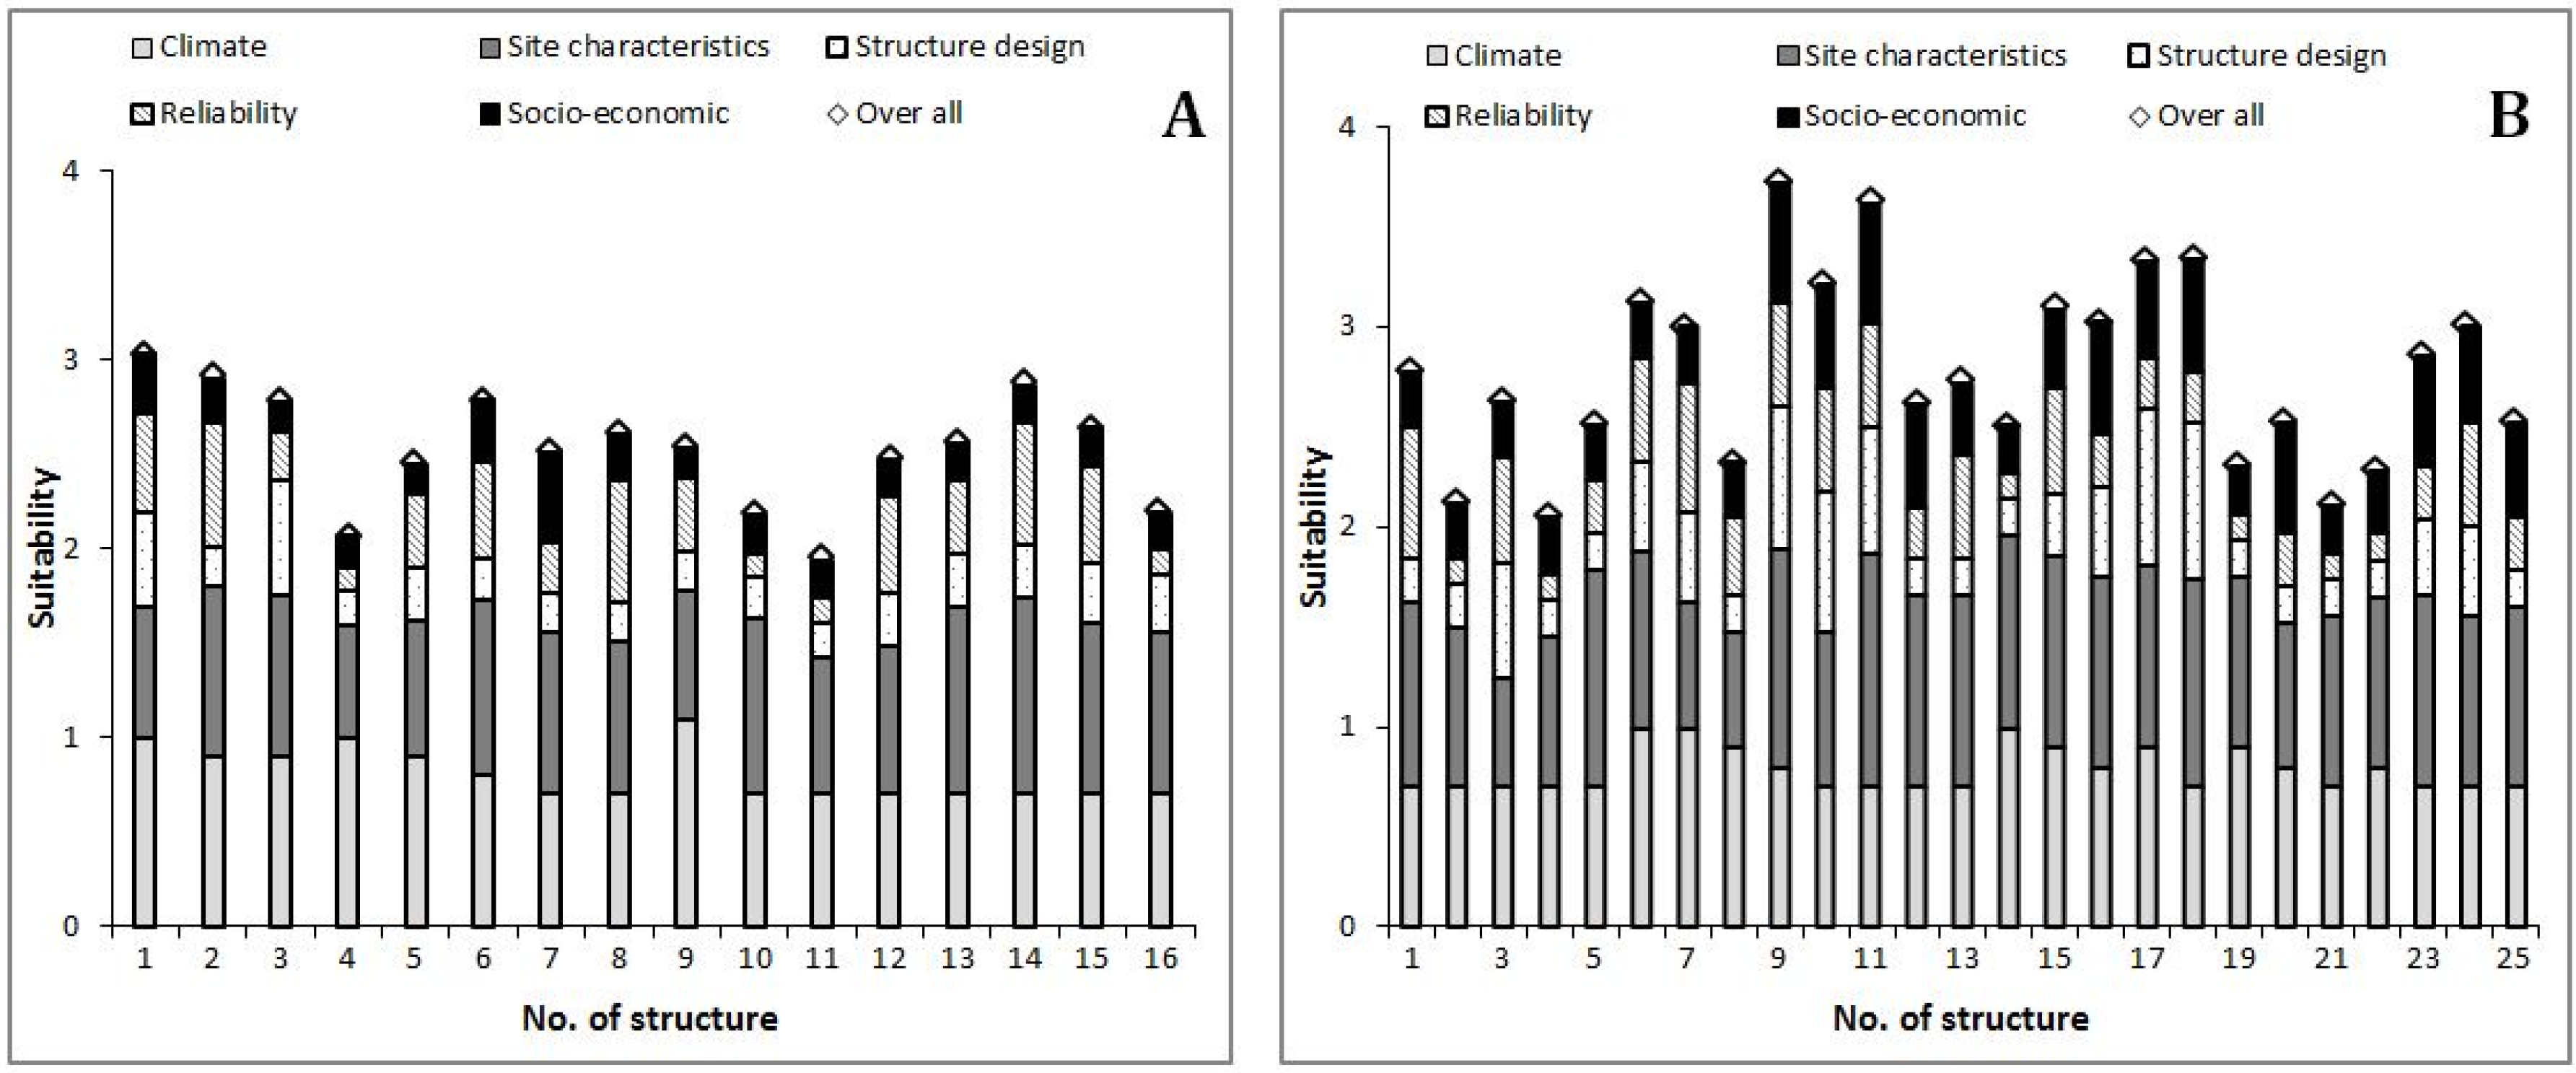
The suitability scores for each criterion and overall from applying Method 1 (three levels) in Sub-catchments 2 and 3 are shown in Figure 7. The socio-economic criteria played a significant role in the assessment methodology here, especially for jessour in these sub-catchments (8–16 in Sub-catchment 2 and 1–8 in Sub-catchment 3) because of the high cost of implementing and maintaining the RWH compared with the relatively small area and low quantity of water retained behind the dykes. Moreover, these techniques are most common in this region especially in the mountain areas. They seem to be the most suitable techniques to mitigate flood hazard, additionally, the stakeholders consider them to be part of their heritage.
Table 7 shows the individual criteria and overall suitability scores for the highest and lowest scoring sites in Sub-catchments 2 and 3 after applying method 2.
Catchment to cropping areas ratio (CCR) has a significant effect on overall suitability scores in Sub-catchment 2, whereas in Sub-catchment 3 there was not a difference in CCR between the high and low scoring structures. Moreover, slope played an important role in the overall scores in Sub-catchment 3 but not in Sub-catchment 2 (Table 7).

3.4. Comparison of Methods 1 and 2

A comparison between the two methods of applying AHP (three and two levels structure) in our methodology is shown in Figure 8. Although the results are very similar, Method 2 gives a slightly higher score for the jessour in Sub-catchment 2 (jessour 10–16) and Sub-catchment 3 (jessour 1–8).
The consistency of each matrix was calculated using the consistency ratio (cr). For the main criteria matrix in Method 1 cr was 2.9% and for the second method cr was 2.4%.
The principles of AHP call for the cr to be smaller or equal to 10%, therefore the cr values were acceptable.
These results suggest that both methods are good and easy to adapt to different criteria, thus researchers can apply either of the two methods.

3.5. Results Validation with the Stakeholders

Based on our discussions with farmers and data collection from literature, we assessed the performance of existing RWH with the evaluation tool. Then, the preliminary results were checked with our field observations and discussed with local farmers and experts. For instance, the RWH sites which scored 2 or lower (low suitability) had been abandoned and or most of their trees were dead. Whereas the sites that scored around 3 (medium suitability) showed well-maintained structures with healthy trees.

4. Discussion

Fifty-eight RWH sites (44 tabias and 14 jessr) in three sub-catchments were assessed and evaluated on their technical and economic performance as well on social aspects. Using our methodology, 65% of the assessed sites scored around 3 (medium suitability), 31% of the RWH sites got scores of about 2 (low suitability), and only 4%, two sites, scored 4 (high suitability). These results very accurately represent the real performance of each site—both overall and at individual criteria level based on the comparison of our observations and discussion with local farmers and experts. This suggests that the methodology developed is a valid way to assess the performance of RWH structures.
The percentage of each score for each criterion in all sites was shown in (Figure 4). Rainfall had the same score (Score 3) in all sites because of there was no big difference in rainfall pattern nor amount in three sub-catchments. This means the rainfall indicator has no significant impact on overall suitability between sites in our case study, but it can be very important in the comparison between sites in the larger areas [21] with a significant difference in rainfall. Moreover, significantly low score percentages were obtained by the design criteria, drainage length and cost, which was Score 1. For example, drainage length scored 1 for 48% of all sites. That means the distance between watercourses and RWH structures is big and the score would have been higher if these structures were built closer to the watercourse. If the RWH structures were located much closer to the watercourses, the contribution of drainage length to the overall RWH suitability would have been higher for our case study. Therefore, drainage flow has a significant impact on the performance of the RWH, which is not always the case for other types of RWH such as ponds, terraces, etc.
It is interesting to note that although the weight for climate criteria was higher than that for site characteristics criteria, 30% and 26% respectively (Figure 5),the latter received the highest scores in most of the sites in all three sub-catchments (Figure 6 and Figure 7). This indicates that the sites are generally well selected for their purpose, and the site characteristics criteria had more impacts on the performance of RWH than other criteria such as climate, drainage and structure design. These results are similar to other studies, such as Al-Adamat [6] and Mbilinyi [16], who concluded that site characteristics are the most important criteria to be considered for design and implementation of RWH techniques.
Where RWH performance (suitability) was low, it was in most cases related to a shortcoming in the engineering design, lack of proper maintenance and the high cost of the water storage. The low performance of these RWH sites was confirmed by getting low scores of these criteria, as shown in Figure 4. The evaluation using our methodology clearly shows which criteria should be addressed to improve the performance of, for example, RWH structure design and storage capacity criteria. Due to the small storage area relative to the dyke size, the cost per cubic meter of water, especially in the jessour, was very expensive—such as jessour 10 and 15 in Sub-catchment 1. These results confirm that water harvesting structures with small storage capacity can ultimately be more expensive than large structures, as shown by Lasage, R., & Verburg, P.H. [4]. Therefore, if farmers can improve the dyke design and storage capacity area by following some basic engineering principles such as increasing storage area, constructing a regular spillway and providing periodic maintenance, they will be able to collect more water with less cost and keep the structure working for a longer period of time. Another example is the ratio between catchment size and cultivated area. Where this is not suitable, such as structures 11 and 21 in Sub-catchments 2 and 3, respectively, RWH structure performance can be improved by adapting the cultivated area to the effective area where the water is stored and adapting the crop type or cropping density (which determines the water requirement) to the amount of water stored.
In our methodology, two methods were applied (three levels and two levels of AHP hierarchy structure), and the results for both approaches were very similar. The consistency ratio for both methods was also similar and strong. Therefore, both methods are valid and provide reliable results. Both methods are simple to apply and easy to adapt the criteria in case of different RWH techniques and/or regions in order to cater to stakeholders’ objectives. While either method can be used, it is recommended to apply Method 1 (three levels). In Method 1, the impact of any errors in scores (from expert opinion or calculations) will be reduced through the two-step calculation.
In most previous studies, the number of criteria are limited and are aimed primarily at the selection of suitable locations for RWH [1,14] and do not consider other factors or performance over time. In addition, many of those studies were mainly desktop studies using GIS and RS, without including stakeholders’ objectives and constrains. Our study showed that socio-economic aspects play an important role in RWH suitability and performance. Thus, the inclusion of such criteria as occurs in our methodology is very important to the goal of meaningful information for improving current RWH effectiveness as well as planning for future structures.
A key precondition for the methodology was that it can be widely applied for different RWH techniques in different regions. In this regard, the structure of the methodology allows it to be easily adapted and applied to different RWH techniques and social-economic settings by simply changing the criteria selected. In addition, the case study showed that it is very possible to select criteria that are easy to assess and still provide accurate results without the need for complex analysis. This keeps the time investment and costs required within reasonable limits.
While Al-Adamat 2008 [6], Jabr 2005 [37] and Mbilinyi 2005 [33] showed that MCA provides a rational, objective and non-biased method for identifying suitable RWH sites, our study demonstrates that combining MCA and expert opinion in a consistent way allows assessment and evaluation of RWH techniques beyond simply site selection. Site conditions and RWH structure performance are likely to change over time, especially in light of predicted climate change. Therefore, a methodology such as ours, which allows evaluation of the performance of current and potential RWH projects, and identification of necessary improvements, is of great value.
An important consideration in the application of our methodology that warrants mention is the establishment of the scores/weighting for each criterion. As this depends on expert opinion [24,27], it is essential to use several experts and take into consideration their area of specialty when analyzing and using their inputs.

5. Conclusions

An evaluation and decision support methodology/tool was developed and tested for assessment of the overall performance of existing RWH and criteria affecting that performance. A single-objective AHP supported by GIS was put to the test in the Oum Zessar watershed of south-eastern Tunisia to assess the performance of 58 RWH structures (jessour/tabias) in three main sub-catchments. Engineering (Technical), biophysical and socio-economic criteria were determined, weighted and assessed in this study with input from experts and stakeholders. The main conclusions are:
(a)
The methodology provides an accurate evaluation of RWH performance when compared with the field investigations;
(b)
The methodology provides a good insight into where in the system improvements are needed for a better performance;
(c)
In the case study, most sites showed low suitability scores for the criteria structure design, drainage flow and cost, which resulted in a low score on the overall performance of RWH;
(d)
Site characteristics criteria (both overall and individual criterion) play a more important role in the overall suitability than other criteria;
In addition, the methodology can be used to pre-evaluate potential new RWH projects, increasing the chances for good long-term performance. This case study application of our methodology confirmed that it is a highly flexible and applicable tool for the evaluation and improvement of RWH structures, and can employ many different, important and easy to access criteria and indicators in the assessment of different RWH techniques. The time and cost required in using this methodology are also low, making it accessible to the local RWH managers/communities.
To further validate the applicability of the methodology, it needs to be tested in different regions and with different RWH techniques. Moreover, the criteria related to socio-economic suitability/performance (i.e., ownership, family size, etc.) deserve further investigation. These suggestions will increase the reliability and applicability of our methodology so that it can be used for assessing the performance of existing and new planned RWH structures in any region. This new, scientifically-based evaluation and decision support tool provides a basis on which designers and decision makers can build efficient RWH systems to meet the objectives and needs of the communities in water-scarce regions.
Acknowledgments

This study has been conducted in the framework of the cooperation between The Higher Committee For Education Development in Iraq (HCED) and Wageningen University (The Netherlands) and was done under the European Union’s Seventh Framework Programme (FP7/2007-2013,WAHARA project). Field works have been carried out in collaboration with the Institut des Régions Arides (IRA) in Tunisia. Special thanks are due for Ammar Zerrim, Abdeladhim Mohamed Arbi and Messaoud Guied for the technical and field measurements assistance. Great thanks to Demie Moore in the Soil Physics and Land Management Group, Wageningen University, for the English reviewing and supporting.

Author Contributions

The manuscript was primarily written by Ammar Adham. Each one of the authors contributed to this work, Ammar Adham collected required data, assisted by Mohamed Ouessar in the field works/measurements and the data analysis. Ammar Adham and Michel Riksen developed the structure of the study, the manuscript, results, discussion and concluding remarks. Coen Ritsema supervised and guided this work. All authors contributed to the development of the approach, editing multiple drafts, and offering comments and corrections.

Conflicts of Interest

The authors declare no conflict of interest.

References

  1. Kahinda, J.M.; Lillie, E.S.B.; Taigbenu, A.E.; Taute, M.; Boroto, R.J. Developing suitability maps for rainwater harvesting in South Africa. Phys. Chem. Earth Parts A/B/C 2008, 33, 788–799. [Google Scholar] [CrossRef]
  2. Boers, T.M.; Ben-Asher, J. A review of rainwater harvesting. Agric. Water Manag. 1982, 5, 145–158. [Google Scholar] [CrossRef]
  3. Kahinda, J.M.; Rockström, J.; Taigbenu, A.E.; Dimes, J. Rainwater harvesting to enhance water productivity of rainfed agriculture in the semi-arid Zimbabwe. Phys. Chem. Earth Parts A/B/C 2007, 32, 1068–1073. [Google Scholar] [CrossRef]
  4. Lasage, R.; Verburg, P.H. Evaluation of small scale water harvesting techniques for semi-arid environments. J. Arid Environ. 2015, 118, 48–57. [Google Scholar] [CrossRef]
  5. Biazin, B.; Sterk, G.; Temesgen, M.; Abdulkedir, A.; Stroosnijder, L. Rainwater harvesting and management in rainfed agricultural systems in sub-Saharan Africa—A review. Phys. Chem. Earth Parts A/B/C 2012, 47, 139–151. [Google Scholar] [CrossRef]
  6. Al-Adamat, R. GIS as a decision support system for siting water harvesting ponds in the Basalt Aquifer/NE Jordan. J. Environ. Assess. Policy Manag. 2008, 10, 189–206. [Google Scholar] [CrossRef]
  7. Ammar, A.; Riksen, M.; Ouessar, M.; Ritsema, C. Identification of suitable sites for rainwater harvesting structures in arid and semi-arid regions: A review. Int. Soil Water Conserv. Res. 2016. [Google Scholar] [CrossRef]
  8. Ouessar, M.; Sghaier, M.; Mahdhi, N.; Abdelli, F.; de Graaff, J.; Chaieb, H.; Yahyaoui, H.; Gabriels, D. An integrated approach for impact assessment of water harvesting techniques in dry areas: The case of oued Oum Zessar watershed (Tunisia). Environ. Monit. Assess. 2004, 99, 127–140. [Google Scholar] [CrossRef] [PubMed]
  9. Oweis, T.Y. Rainwater harvesting for alleviating water scarcity in the Drier environments of West Asia and North Africa. In Proceedings of the International Workshop on Water Harvesting and Sustainable Agriculture, Moscow, Russia, 7 September 2004; p. 182.
  10. Mechlia, N.B.; Oweis, T.; Masmoudi, M.; Khatteli, H.; Ouessar, M.; Sghaier, N.; Anane, M.; Sghaier, M. Assessment of Supplemental Irrigation and Water Harvesting Potential: Methodologies and Case Studies from Tunisia; ICARDA: Aleppo, Syria, 2009. [Google Scholar]
  11. De Winnaar, G.; Jewitt, G.P.W.; Horan, M. A GIS-based approach for identifying potential runoff harvesting sites in the Thukela River basin, South Africa. Phys. Chem. Earth Parts A/B/C 2007, 32, 1058–1067. [Google Scholar] [CrossRef]
  12. Kadam, A.K.; Kale, S.S.; Pande, N.N.; Pawar, N.J.; Sankhua, R.N. Identifying Potential Rainwater Harvesting Sites of a Semi-arid, Basaltic Region of Western India, Using SCS-CN Method. Water Resour. Manag. 2012, 26, 2537–2554. [Google Scholar] [CrossRef]
  13. Ramakrishnan, D.; Bandyopadhyay, A.; Kusuma, K.N. SCS-CN and GIS-based approach for identifying potential water harvesting sites in the Kali Watershed, Mahi River Basin, India. J. Earth Syst. Sci. 2009, 118, 355–368. [Google Scholar] [CrossRef]
  14. Ziadat, F.; Oweis, T.; Mazahreh, S.; Bruggeman, A.; Haddad, N.; Karablieh, E.; Benli, B.; Zanat, M.A.; Al-Bakri, J.; Ali, A. Selection and Characterization of Badia Watershed Research Sites; International Center for Agricultural Research in the Dry Areas (ICARDA): Aleppo, Syria, 2006. [Google Scholar]
  15. Elewa, H.H.; Qaddah, A.A.; El-feel, A.A.; Brows, J.; St, T.; Nozha, E.; Gedida, E.; Alf-maskan, P.O.B. Determining Potential Sites for Runoff Water Harvesting using Remote Sensing and Geographic Information Systems-Based Modeling in Sinai. Am. J. Environ. Sci. 2012, 8, 42–55. [Google Scholar]
  16. Mbilinyi, B.P.; Tumbo, S.D.; Mahoo, H.F.; Mkiramwinyi, F.O. GIS-based decision support system for identifying potential sites for rainwater harvesting. Phys. Chem. Earth Parts A/B/C 2007, 32, 1074–1081. [Google Scholar] [CrossRef]
  17. Ouessar, M.; Bruggeman, A.; Mohtar, R.; Ouerchefani, D.; Abdelli, F.; Boufelgha, M. Future of drylands—An overview of evaluation and Impact Assessment Tools for water harvesting. In The Future of Drylands; Lee, C., Schaaf, T., Eds.; Springer: Berlin, Germany, 2009; pp. 255–267. [Google Scholar]
  18. Jothiprakash, V.; Sathe, M.V. Evaluation of rainwater harvesting methods and structures using analytical hierarchy process for a large scale industrial area. J. Water Resour. Prot. 2009, 1. [Google Scholar] [CrossRef]
  19. Mahmoud, S.H. Delineation of potential sites for groundwater recharge using a GIS-based decision support system. Environ. Earth Sci. 2014, 72, 3429–3442. [Google Scholar] [CrossRef]
  20. Critchley, W.; Siegert, K. Water Harvesting; FAO: Rome, Italy, 1991. [Google Scholar]
  21. Mahmoud, S.H.; Alazba, A.A. The potential of in situ rainwater harvesting in arid regions: Developing a methodology to identify suitable areas using GIS-based decision support system. Arab. J. Geosci. 2014, 72, 3429–3442. [Google Scholar] [CrossRef]
  22. Ouessar, M. Hydrological Impacts of Rainwater Harvesting in Wadi Oum Zessar Watershed (Southern Tunisia); Ghent University: Ghent, Belgium, 2007. [Google Scholar]
  23. Ouessar, M.; Zerrim, A.; Boufelgha, M.; Chniter, M. Water harvesting in south-eastern Tunisia: State of knowledge and challenges. In Water Harvesting in Mediterranean Zones: An Impact Assessment and Economic Evaluation, Proceedings of EU Wahia Project Final Seminar in Lanzarote, 2002; Wageningen University: Wageningen, The Netherland, 2002; Volume 40, pp. 13–24. [Google Scholar]
  24. Adamcsek, E. The Analytic Hierarchy Process and Its Generalizations. Ph.D. Thesis, Eotvos Lorand University, Budapest, Hungary, 2008. [Google Scholar]
  25. Ying, X.; Zeng, G.M.; Chen, G.Q.; Tang, L.; Wang, K.L.; Huang, D.Y. Combining AHP with GIS in synthetic evaluation of eco-environment quality-A case study of Hunan Province, China. Ecol. Modell. 2007, 209, 97–109. [Google Scholar] [CrossRef]
  26. Saaty, T.L. Decision making with the analytic hierarchy process. Int. J. Serv. Sci. 2008, 1, 83–98. [Google Scholar] [CrossRef]
  27. Al-Adamat, R.; Diabat, A.; Shatnawi, G. Combining GIS with multicriteria decision making for siting water harvesting ponds in Northern Jordan. J. Arid Environ. 2010, 74, 1471–1477. [Google Scholar] [CrossRef]
  28. Tumbo, S.D.; Mbilinyi, B.P.; Mahoo, H.F.; Mkiramwinyi, F.O. Determination of suitability levels for important factors for identification of potential sites for rainwater harvesting. In Proceedings of the 7th WaterNet-WARFSA-GWP-SA Symposium, Lilongwe, Malawi, 1–3 November 2006; p. 15.
  29. De Winnaar, G.; Jewitt, G.P.W.; Horan, M. A GIS-based approach for identifying potential runoff harvesting sites in the Thukela River basin, South Africa. Phys. Chem. Earth Parts A/B/C 2007, 32, 1058–1067. [Google Scholar] [CrossRef]
  30. Mekdaschi Studer, R.; Liniger, H. Water Harvesting: Guidelines to Good Practice; Centre for Development and Environment (CDE): Bern, Switzerland, 2013. [Google Scholar]
  31. Isioye, O.A.; Shebe, M.W.; Momoh, U.O.; Bako, C.N. A Multi Criteria Decision Support System (MDSS) for Identifying Rainwater Harvesting Site (S) in Zaria, Kaduna State, Nigeria. Int. J. Adv. Sci. Eng. Tech. Res. 2012, 1, 53–71. [Google Scholar]
  32. Schiettecatte, W.; Ouessar, M.; Gabriels, D.; Tanghe, S.; Heirman, S.; Abdelli, F. Impact of water harvesting techniques on soil and water conservation: A case study on a micro catchment in southeastern Tunisia. J. Arid Environ. 2005, 61, 297–313. [Google Scholar] [CrossRef]
  33. Mbilinyi, B.P.; Tumbo, S.D.; Mahoo, H.F.; Senkondo, E.M.; Hatibu, N. Indigenous knowledge as decision support tool in rainwater harvesting. Phys. Chem. Earth Parts A/B/C 2005, 30, 792–798. [Google Scholar] [CrossRef]
  34. Oweis, T.Y.; Prinz, D.; Hachum, A.Y. Rainwater Harvesting for Agriculture in the Dry Areas; CRC Press: London, UK, 2012; p. 262. [Google Scholar]
  35. Bamne, Y.; Patil, K.A.; Vikhe, S.D. Selection of Appropriate Sites for Structures of Water Harvesting in a Watershed using Remote Sensing and Geographical Information System. Int. J. Emerg. Tech. Adv. Eng. 2005, 2025, 270–275. [Google Scholar]
  36. Nasr, M. Assessing Desertification and Water Harvesting in the Middle East and North Africa: Policy Implications; Zentrum f{ü}r Entwicklungsforschung-ZEF: No. 10; Center for Development Research: Bonn, Germany, 1999; p. 59. [Google Scholar]
  37. Jabr, W.M.; El-Awar, F.A. GIS & analytic hierarchy process for siting water harvesting reservoirs, Beirut, Lebanon. J. Environ. Eng. 2005, 122, 515–523. [Google Scholar]
Figure 1. Location of Oum Zessar and test sub-catchments; (A) Sub-catchment 1; (B) Sub-catchment 2, and (C) Sub-catchment 3.
Water 08 00198 g001
Figure 2. (A) An example of jessour (Ouessar 2007) and (B) properties of jessr.
Water 08 00198 g002
Figure 3. The schematic of the RWH (Rain Water Harvesting) suitability model, criteria and hierarchy structure for two methodologies. Method 1 consists of three levels and method two consists of two levels (Level 1 and Level 3).
Water 08 00198 g003
Figure 4. The score percentages for each criterion in all RWH sites (n = 58), the five scores were determined based on classifications by experts and previous studies.
Water 08 00198 g004
Figure 5. The weights for main criteria in two methods: Method 1 consists of three levels, the objective in the first level, five main criteria in the second level and 11 sub-main criteria in the third level; while Method 2 has just two levels, the objective in the first level and the 11 indicators (main criteria) on the second level.
Water 08 00198 g005
Figure 6. The overall suitability and the suitability for each criterion in each site of Sub-catchment 1 (Method 1), the left figure (A) shows the results after applying weights and Equation (1), the right figure (B) shows the scores without applying weights to compare weight effecting on the suitability scores for each criteria as shown in the left figure.
Water 08 00198 g006
Figure 7. The overall suitability and the suitability for each criterion in each site in Sub-catchment 2 (A) and 3 (B) according to Method 1. In Sub-catchment 2 the overall suitability is hovering between 1.94 and 3.03 and site suitability in most of the sites got the highest scores among other criteria, and in Sub-catchment 3 the overall suitability is hovering between 2.05 and3.72 and the site suitability almost got the highest scores too.
Water 08 00198 g007
Figure 8. The comparison between overall scores for the two methods in the three test sub-catchments (A) Sub-catchment 1, (B) Sub-catchment 2 and (C) Sub-catchment 3. The results are very similar, Method 2 gives a slightly higher score for the jessour/tabia in Sub-catchment 1 (tabias 3, 4, 6 and 17), Sub-catchment 2 (tabia 3 and 7, jessour 10–16) and Sub-catchment 3 (jessour 1-6 and tabias 11, 18 and 23).
Water 08 00198 g008
Table 1. Classification, suitability levels and scores for each criterion for assessment of existing RWH sites in arid and semi-arid regions. Each value, class and score were rated based on the literature review, information from the field survey and discussions with stakeholders and experts.
Criteria (Indicator)ClassesValuesScores Jessr/Tabia)Scores (Tabia) *
Rainfall (mm·y−1), more rainfall on any particular area means higher possibilities of harvesting part of it. [27]Very low suitability<1001
Low suitability100–1752
Medium suitability175–2503
High suitability250–3254
Very high suitability>3255
Drainage length (m), the distances from the water courses to each dyke (short distance means fewer losses). [15]Very high suitability0–505
High suitability50–1254
Medium suitability125–2003
Low suitability200–3002
Very low suitability>3001
Storage capacity ratio (-), the ratio between the total volume of water inflow and existing storage capacity. The ratio that is close to one is ranked as highly suitable.Over requirement (too large a storage capacity area)<0.52
Sufficient0.5–1.04
Optimum requirement1.0–2.05
Critical2.0–4.03
Very critical requirement (too small a storage capacity area)>4.01
Structure dimensions ratio (-), the ratio between the required design height and the existing height of dykes or barriers for each RWH structure. The ratios that are close to one are ranked as highly suitableOver design (existing height is double what is required)<0.53
Suitable0.5–0.754
Optimum0.75–1.05
Under design1.1–1.252
Critical (existing height is lower than required)>1.251
Catchment to cropping area (CCR ratio (-))Medium suitability<0.52
Very high suitability0.5–0.754
Suitable0.75–1.255
Low suitability1.25–2.03
Very low suitability>2.01
Soil texture (Clay content %) [28]Very high suitability (Clay)>205
High suitability (Silty clay)15–204
Medium suitability (Sandy clay)11–153
Low suitability (Sandy clay loam & sandy loam)8–112
Very low suitability (other)<81
Soil depth(m) [1]Very deep>1.55
Deep0.9–1.54
Moderately deep0.5–0.93
Shallow0.25–0.52
Very shallow<0.251
Slope (%) [29]Flat<1.512 *
Undulating1.5–335
Rolling3–544
Hilly5–1053
Mountainous>1021
Reliability ratio (-), the ratio between the total demand and the total supply of water. High suitability scores for the ratio are close to oneSufficient (required water is largely less than supply)<0.352
Medium Sufficient0.35–0.754
High Sufficient0.75–1.15
Large deficit1.1–1.753
Very large deficit (required water is largely higher than supply)>1.751
Distance to settlements (km), highest scorers are ranked to the closest distance to the settlements (high suitability). [6]Very high suitability (too short a distance)<0.55
High suitability0.5–0.754
Medium suitability0.75–1.253
Low suitability Very low suitability (too far a distance)1.25–1.752
>1.751
Cost ($·m−3 of water), low cost indicates high scores (profitable). Costs are estimated based on the WOCAT database [30] and farmer interviewsVery high cost (very low suitability)>121
High cost9–122
Medium cost6–93
Suitable cost3–64
Profitable cost (very high suitability)<35
* Different suitability classes for slopes between jessour and tabias.
Table 2. Rainfall, potential evapotranspiration (PET), maximum crop evapotranspiration (ETc) and olive crop coefficient kc results [32], by applying the Penman-Monteith method and using meteorological data from Medenine station.
MonthRainfallPETETckc
(mm)/year(mm)(mm)for Olive
January37.569.627.80.40
February30.688.635.40.40
March40.0121.266.70.55
April16.3159.379.60.50
May11.2198.489.30.45
June1.0213.585.40.40
July0.0234.882.20.35
August2.0220.977.30.35
September17.1166.675.00.45
October23.0126.863.40.50
November19.991.141.00.45
December36.767.426.90.40
Table 3. Typical values for final infiltration rate for various soil textures [34].
Soil TypeInfiltration Rate (mm·h−1)
Coarse sand>22
Fine sand>15
Fine sandy loam12
Silt loam10
Silty clay loam 9
Clay loam7.5
Silty clay5
Clayey soil4
Table 4. The pairwise comparison matrix for the main criteria (Method 1).
Climate and DrainageStructure DesignSite CharacteristicsReliabilitySocio-Economic
Climate and drainage12132
Structure design1/21112
Site characteristics11123
Reliability1/311/211
Socio-economic1/21/21/311
Table 5. The measurements and scores for each criterion (indicator) for the tabias receiving the highest (9 and 14) and lowest (10 and 15) suitability scores in Sub-catchment 1, when AHP Method 1 was applied (before applying Equation (1)).
Criteria (Indicator)Sub-Catchment 1, Tabia No.
HighLow
9 14 10 15
M *S **MSMSMS
Rainfall (mm·y−1)180.003180.003180.003180.003
Drainage length (m)255.002243.002257.002340.001
Slope (%)3.5047.9035.7634.604
Soil Texture (clay contents %)14.30312.6038.70211.103
Soil depth (m)0.8030.9540.8030.753
Structure dimensions ratio (-)0.9351.0354.8814.301
Storage Capacity ratio (-)2.4933.02334.00134.501
CCR ratio (-)3.8014.2011.3039.601
Cost ($·m−3 of water)5.9046.40348.00143.001
Distance to settlements (km)1.2031.2431.5621.322
Reliability ratio (-)0.5040.6844.4612.471
* measurements/calculation data; ** scores.
Table 6. The overall suitability and the suitability for each criterion for the highest (9 and 14) and lowest (10 and 15) scoring tabias in Sub-catchment 1, according to Method 2 and after applying Equation (1).
CriteriaSub-Catchment 1, Tabia No.
highlow
9141015
Rainfall (mm·y−1)0.4650.4650.4650.465
Drainage length (m)0.0760.0760.0760.038
Slope (%)0.5720.4290.4290.572
Soil Texture (clay contents %)0.4500.4500.3000.450
Soil depth (m)0.2790.3720.2790.279
Structure dimensions ratio (-)0.3950.3950.0790.079
Storage Capacity ratio (-)0.1950.1950.0650.065
CCR ratio (-)0.0830.0830.2490.083
Cost ($·m−3 of water)0.3000.2250.0750.075
Distance to settlements (km)0.1860.1860.1240.124
Reliability ratio (-)0.2280.2280.0570.057
Overall score3.233.102.202.29
Table 7. The individual criteria and overall suitability scores for the highest and lowest scoring sites in Sub-catchments 2 and 3 after applying Method 2.
CriteriaTabia/Jessr No.
Sub-Catchment 2 Sub-Catchment 3
High LowHighLow
14111121
Rainfall (mm·y−1)0.4650.4650.4650.465
Drainage length (m)0.0380.0380.0380.038
Slope (%)0.5720.4290.7150.572
Soil Texture (clay contents %)0.6000.4500.6000.450
Soil depth (m)0.3720.1860.3720.186
Structure dimensions ratio (-)0.0790.0790.3160.079
Storage Capacity ratio (-)0.0650.0650.2600.065
CCR ratio (-)0.3320.0830.0830.083
Cost ($ m−3 of water)0.0750.0750.3750.075
Distance to settlements(km)0.1860.1860.3100.248
Reliability ratio (-)0.2850.0570.2280.057
Overall suitability3.071.923.762.32