3.1. Validation of the Tracer Transport Simulation
The tracer concentration at the outlet of the contact tank is normalized using the following definition in order satisfy the mass balance for pulse injection to be consistent with the previous studies [
7,
12],
where
is the injection period (
t = 2.5 s) for the pulse injection,
is tracer pulse at the inlet
,
is theoretical mean residence time of the tank (
, where
is the volume of the contact tank and
is the volumetric flow rate), which is calculated as 109.2 s for the present contact tank volume and discharge based on the assumption of plug flow in the contact system, and
is the dimensionless time. Normalized tracer RTD at the outlet of the contact tank is monitored during the simulation and compared with the numerical results reported in the literature [
7,
12] for validation. A comparison of both RANS and LES cases are shown in
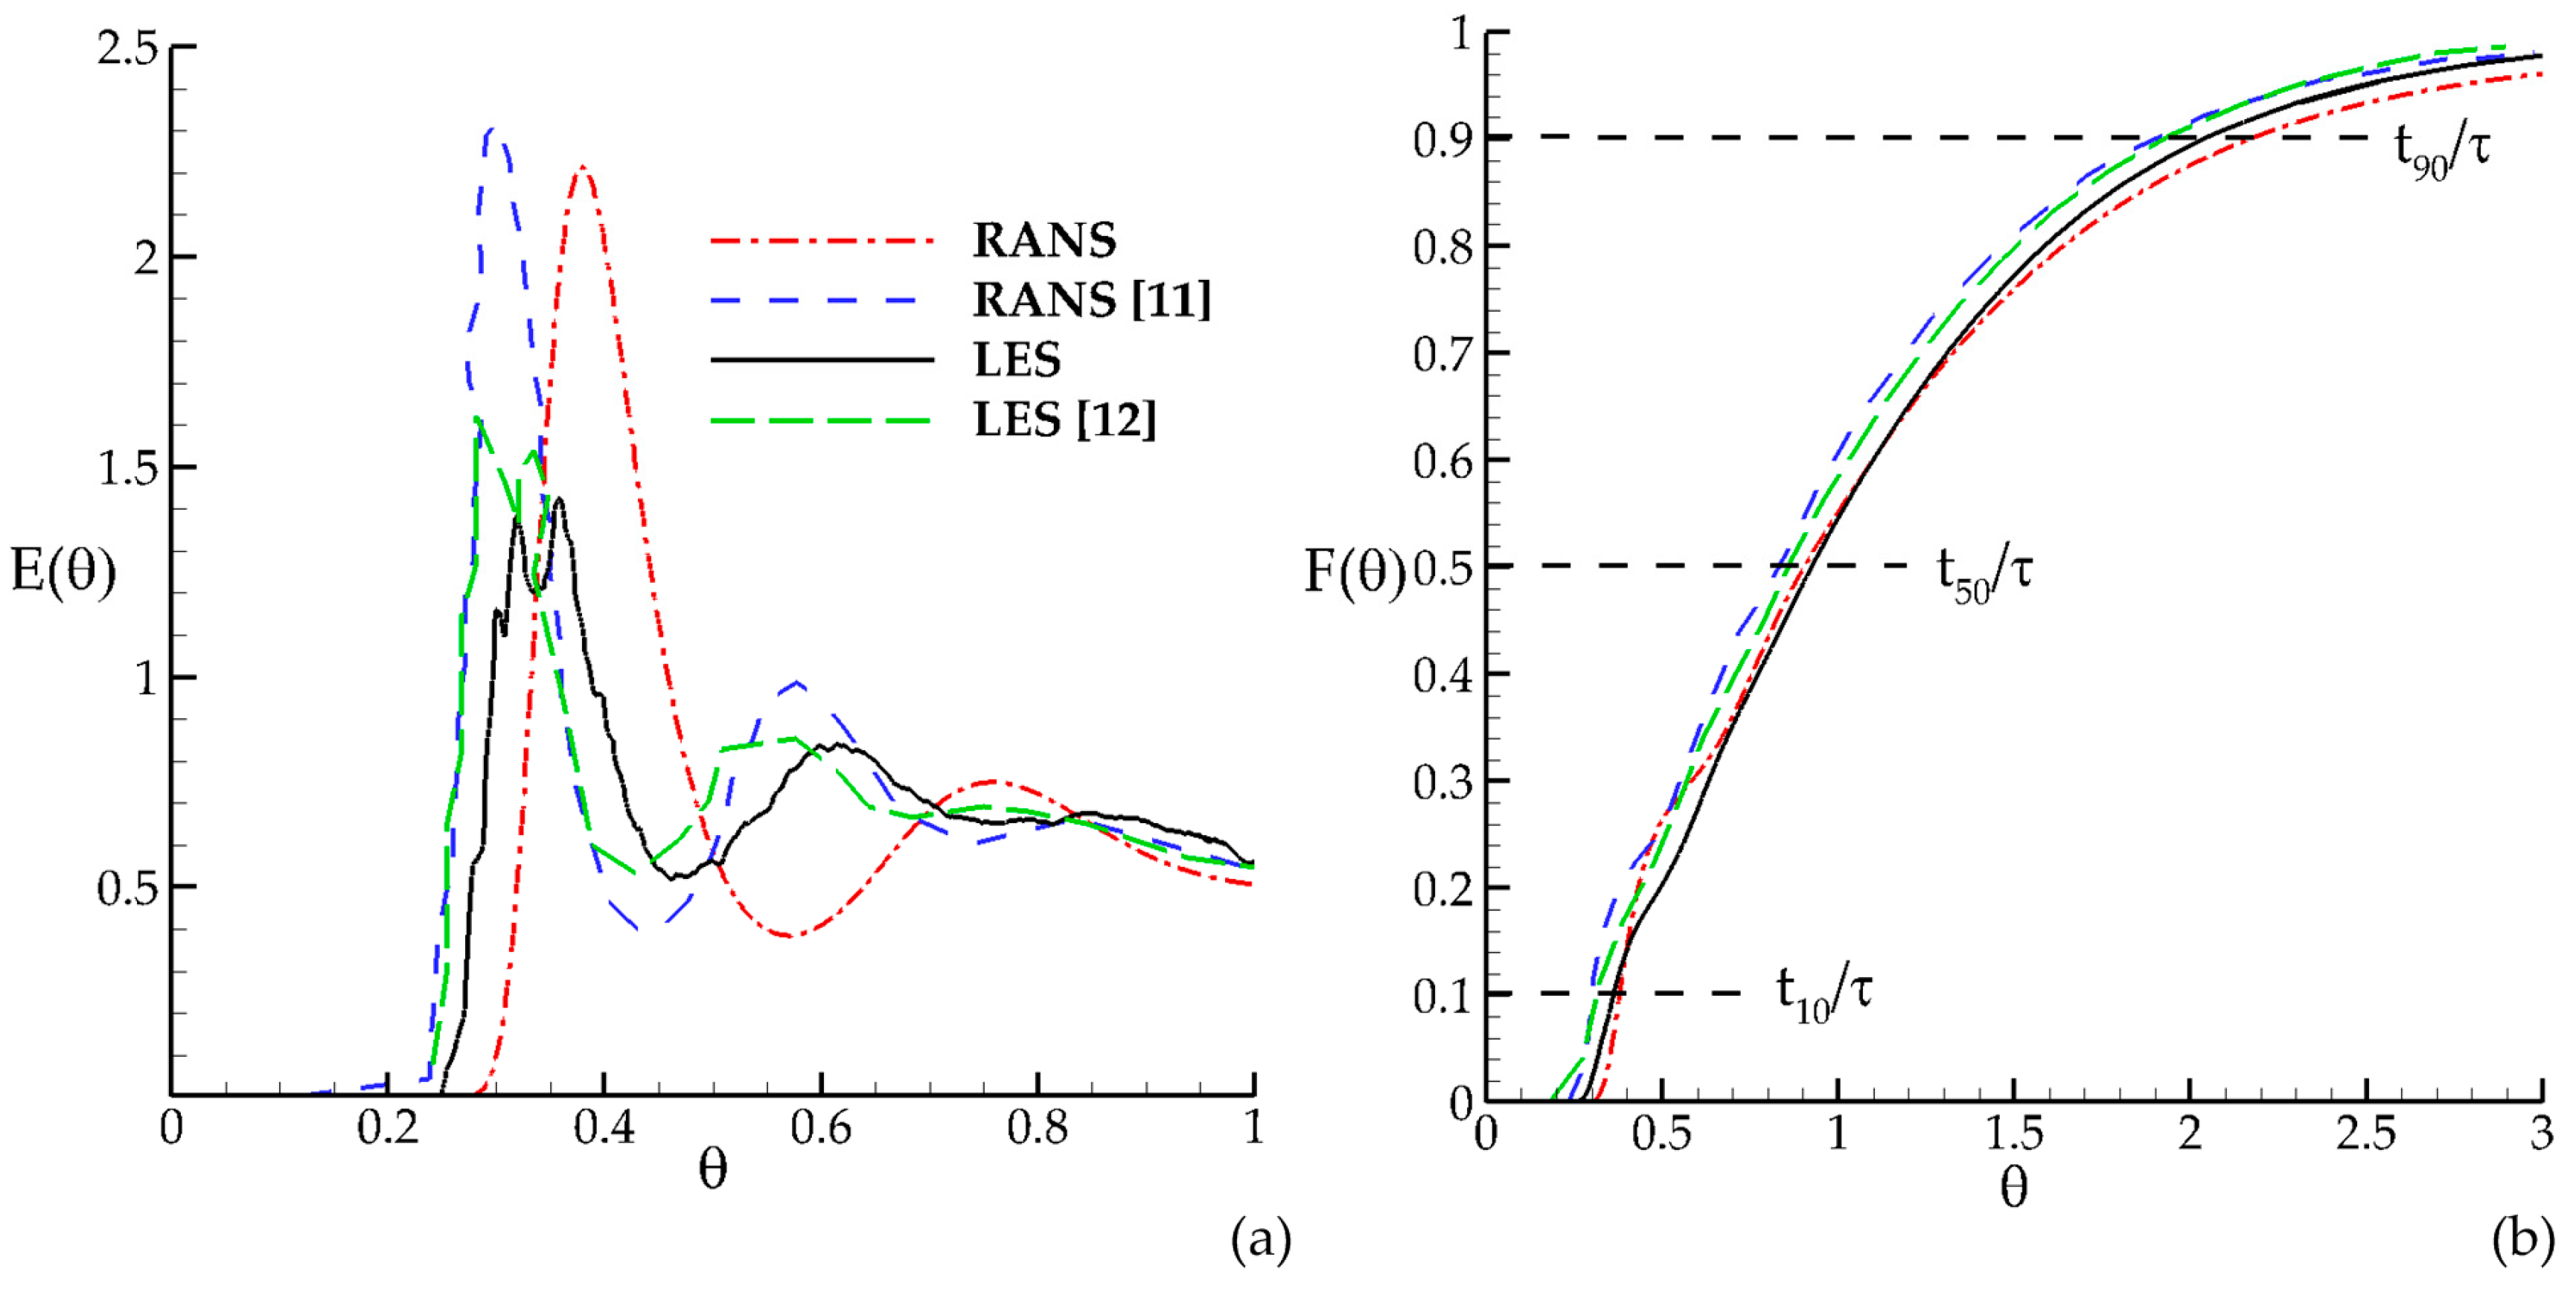
Figure 1, where
t50 is the time required for 50% of the cumulative normalized tracer concentration to be observed at the outlet of the contactor.
The variation of normalized RTD is shown in
Figure 1a for the dimensionless time interval between 0 and 1 since significant change in RTD is observed during this time interval. After this period the data collapse to a single curve. The time-shift between the present and previous results in
Figure 1a may be associated with the difference in the definition of stable flow field used in the solution [
1] and the difference in the resolution of the computational mesh since short circuiting effects can be observed strongly as the mesh gets coarser and the RTD curve shifts to the left having a greater peak, as also observed in [
11]. Comparisons of the present numerical results with the previous results show that present numerical results are consistent with the previously reported results for the data obtained at the outlet of the tank.
The first peak in RANS is significantly higher than that in LES indicating that dispersion effects in LES are stronger than RANS since LES could accurately simulate the mixing effects due to dynamically varying turbulent eddies. This increases eddy mixing between the recirculation and jet zones due to turbulent diffusion. We note that this difference in concentration peak occurs even though the jet thickness in LES is smaller than RANS [
1], which indicates higher short circuiting in LES solution. The smaller jet thickness obtained in LES, which increases the jet momentum and short circuiting effects, is due to the additional recirculation zones that develop in the vicinity of the chamber inlet as described in detail in [
1].
Figure 1a shows that in LES simulation the injected tracer arrives at the tank outlet in a shorter period than that in RANS, which is more evidence of short circuiting effects for LES solution. In the literature, it is reported that tracer transport results of RANS shows more short circuiting effects when compared to LES results [
12]. Higher short circuiting effects were attributed to RANS solution since a larger amount of tracer substance leaves the contact system in RANS relative to LES (
Figure 1a) during the initial stages of transport simulation. This concept and interpretation needs to be reconsidered, since for the overall transport time, the total time required for the tracer to leave the contactor is less in LES solution. This observation indicates the necessity to introduce a new tracer index which will characterize the short circuiting effects in a better way by accounting for the total travel time of the tracer in the tank and recognizing the importance of the mean transport time relative to the total travel time in the overall definition of short circuiting and mixing. In this study, we introduce a new index definition which may clarify this point.
Interaction of different flow zones due to unsteady eddy motion in LES improves the mixing efficiency of the contact system although the calculated volumetric efficiency coefficients based on the time-averaged flow field in LES showed that short circuiting effects were also stronger in LES when compared to RANS [
1]. This indicates that mixing analysis of the contact system must be performed based on the instantaneous flow field, and not on the time-averaged flow field since time-averaged flow field may not reflect the mixing properties of the contact system accurately. This observation also indicates that tracer is retained, mixed and released in the recirculation zone during the mixing process, even though the recirculation zones are identified to be the main reason for reducing the mixing efficiency of the contact system [
5]. The residence time of the tracer between recirculation and jet zones will be analyzed later on using the volumetric mixing efficiency definitions to clarify this point. The second and third peaks after the first concentration peak in
Figure 1a correspond to the release of entrapped concentration in the recirculation zone in the upstream chambers as a function of time.
The shape of cumulative tracer concentration curve (
Figure 1b) provides insight to the flow characteristics inside the contact system which are the jet and recirculation zones. The steep slope at the initial stage of the curve corresponds to the advection of the tracer with the jet, which is similar to the plug flow conditions since diffusion effects are not yet established in the flow system. When the slope of the curve flattens, especially after
, the transport of the tracer is dominated by the diffusive effects that is caused by the retention and timed release of the tracer inside recirculation zone of the tank and turbulent interaction between the two zones. The characteristic residence time indexes are determined form
Figure 1b and compared with the previously reported results in
Table 1. The tracer index
t10 computed from LES solution is less than that obtained from RANS, showing that the short circuiting effects are more severe in LES due to the effect of higher jet momentum [
1]. The tracer index
t90 computed from LES solution is also less than that obtained from RANS, showing that mixing effects are more dominant in LES due to the effect of turbulent eddy mixing [
1]. There are some discrepancies between the present and previous results, which may be due to the effects of the numerical methods used in the discretization of the unsteady, advection and diffusion components of the AD equation. In this study,
Gauss limited scheme was used for the discretization of convective terms and
Gauss linear method was used for the diffusion terms in the AD equation. Unsteady term in the AD equation was discretized using Crank–Nicolson numerical scheme, as mentioned earlier. The comparisons of the predicted residence time indexes are in good agreement with the previously reported experimental and numerical results that are given in the literature [
7,
8,
9,
12].
The RTD analysis of the tracer is performed at the end of each chamber, as well as inside the chambers using the volumetric efficiency definitions given below.
3.2. Breakthrough Data at the End of Each Chamber
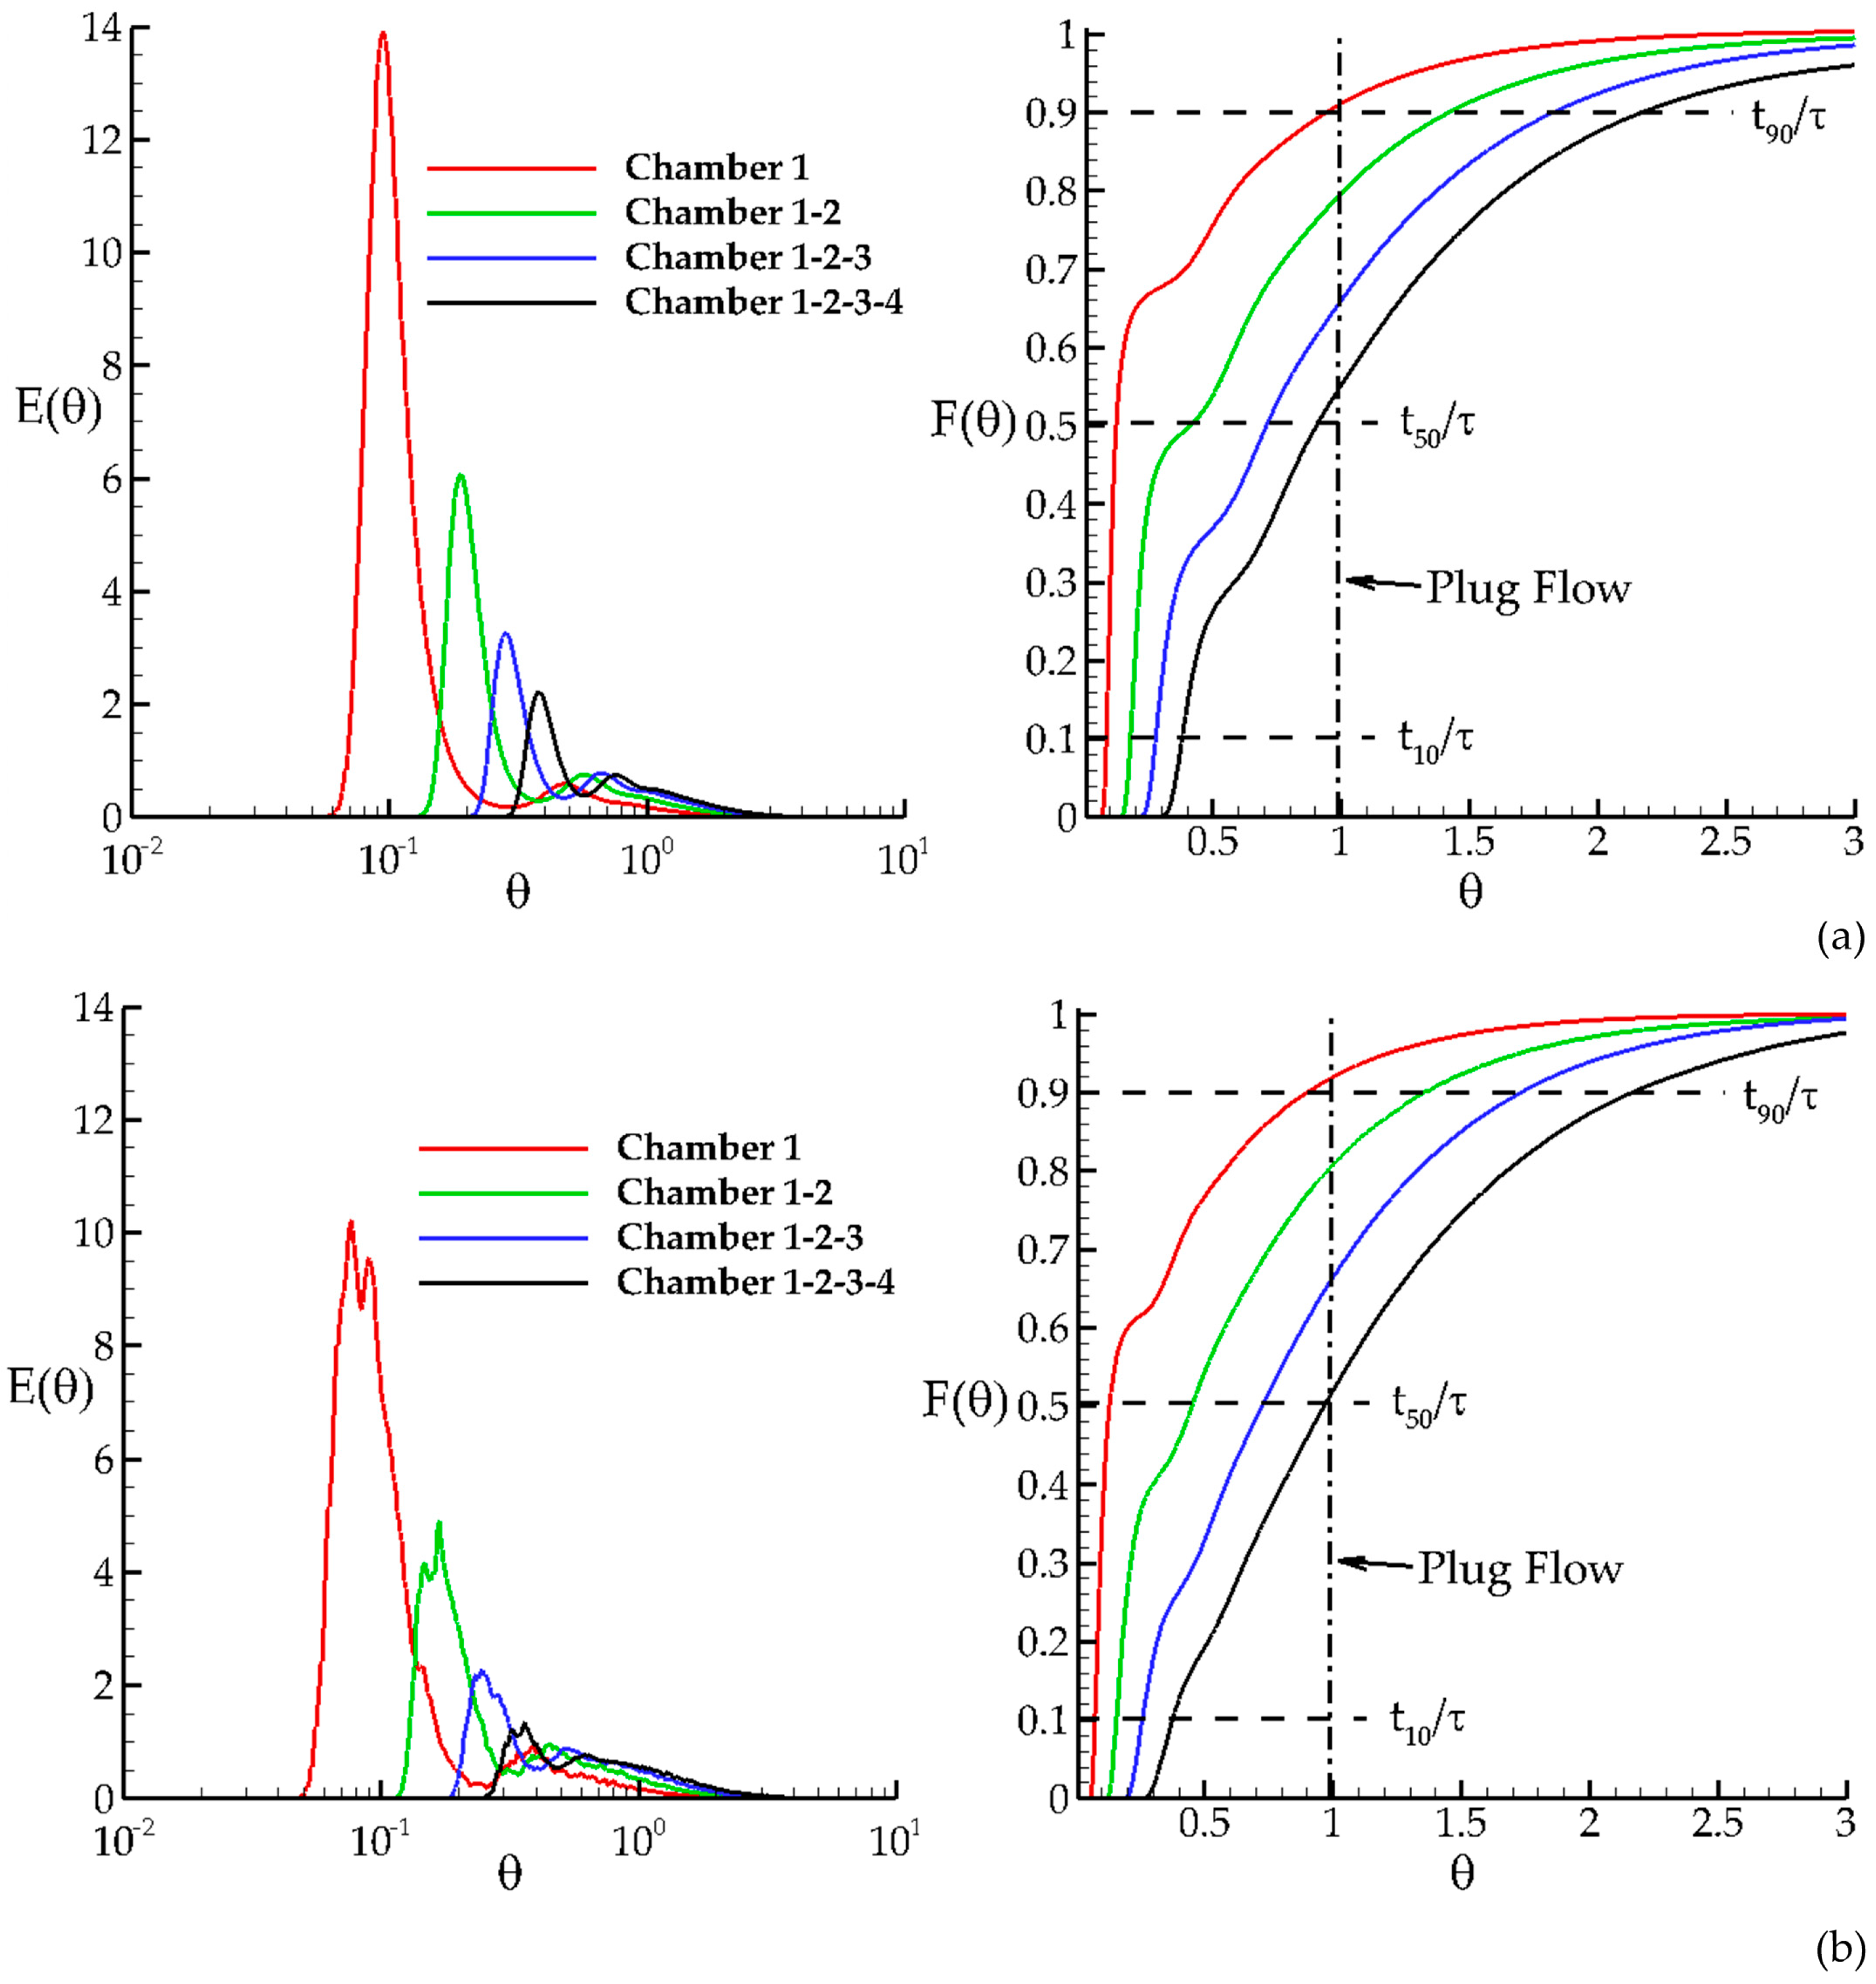
The normalized tracer concentration and the cumulative normalized tracer concentration are computed at the outlet section of each chamber during the simulation and plotted as function of dimensionless time in
Figure 2 for both RANS and LES simulations in order to observe the effect of turbulence model on the evaluation of tracer indexes. The normalized tracer concentration plots for RANS and LES show that the short circuiting effects are decreasing in downstream direction since
curve shifts to the right and mixing efficiency of the contact system is increasing in downstream direction. Among the tracer indexes defined earlier,
t10 is a good indicator for the short circuiting effects in a chamber [
5]. It is clearly seen in
Figure 2 that the short circuiting affects are the highest in Chamber 1 due to high speed of the jet and it is decreasing in downstream direction due to the retention of the tracer in the recirculation zones in each chamber and dissipation of jet velocity (momentum) in the downstream direction, which reduces the short circuiting effects in the contact system. This observation can also be seen in the plots of cumulative normalized tracer concentration since the cumulative curves for each chamber shifts to the right in downstream direction which increases the
t10 index. We also note the second and third peaks observed in each of these plots (
Figure 2) are due to the timed release of the tracer from the recirculation zones. The effect of timed release of concentration from recirculation zones can also be seen in the cumulative RTD plots. The magnitudes of these peaks reduce and become insignificant towards the end of observation period. This indicates that the recirculation zones are not dead zones, as described in the literature. As can be seen in
Figure 2, the first peak of the RTD obtained from LES solution is less than that of RANS. The main reason for this is the retention effects which are stronger in LES since energetically important eddies increase the turbulence induced mixing between the two zones in each chamber. The retention effects are weak in RANS since only the time-averaged variation of turbulence effects are modeled and turbulence induced mixing is not simulated instantaneously in RANS. The magnitudes of the peaks of E curves in
Figure 2 reduce in downstream direction due to the diffusion effects.
The Morrill dispersion index,
, is another widely used index to evaluate the amount of diffusion and mixing in the contact system [
5]. Most commonly used indexes that are used for this purpose are calculated from the cumulative RTD plots and are shown in
Table 2 for both RANS turbulence closure model and LES solution in order to show the effect of turbulence approach on the tracer indexes, which provides crucial information for the assessment of mixing efficiency of the contact system.
As can be seen in
Table 2, the
t10 is increasing in downstream direction for both RANS and LES indicating that the short circuiting effects are decreasing due to increasing diffusion effects, jet momentum dissipation and hence increasing contact length in the contact system. Based on this observation, an alternative design concept can be developed in order to reduce the short circuiting effects with alternating the properties of the geometric design criteria in downstream direction. Comparison of
t10 indexes for RANS and LES shows that short circuiting effects are stronger in LES since the thickness of the jet is thinner in LES which increases the jet velocity (momentum) and thus the short circuiting effects. The volumetric efficiency coefficients in LES were also computed to be much less than that in RANS in [
1] showing that the short circuiting effects were stronger in LES due to the additional recirculation zones that were observed near the inlet of the chambers. This result shows that the proposed volumetric efficiency coefficients in [
1] can be used for the assessment of short circuiting effects in the contact system without performing a transport analysis, which is a time consuming process, especially for LES.
The comparison of Morrill indexes for RANS and LES shows that Mo is higher for LES solution for all cases. This may imply that mixing effects are weaker in LES since the Mo values should decrease when the degree of mixing increases for a constant short circuiting. However, given the definition of Mo, there is a double sided interaction between
t10 and
t90 values in this ratio. It is clear that Mo also increases as
t10 gets smaller as well, which it does for LES solution. Thus, there is an inconsistency in an effort to interpret two different processes with opposing effects within one index which is expressed as a ratio. As will be pointed out, the short circuiting effects in LES are also increasing, which yields a higher Mo index in this case. This observation indicates that a better index definition would be needed to distinguish this pattern clearly [
13].
Dispersion index
is the most common index that is used for the assessment of mixing characteristics of a contact system [
4,
5], which is defined as the ratio of variance of the RTD function and the square of the mean residence time,
where
and
are the mean residence time (the center of mass of the RTD curve) and the variance of RTD function, respectively. These parameters can be calculated from the following equations,
where
is the area-averaged concentration at the outlet section at dimensionless time
. A Matlab computer program is developed for the computation of the above integrals based on the area averaged time-series data
at the outlet of each chamber obtained from the transport simulation during
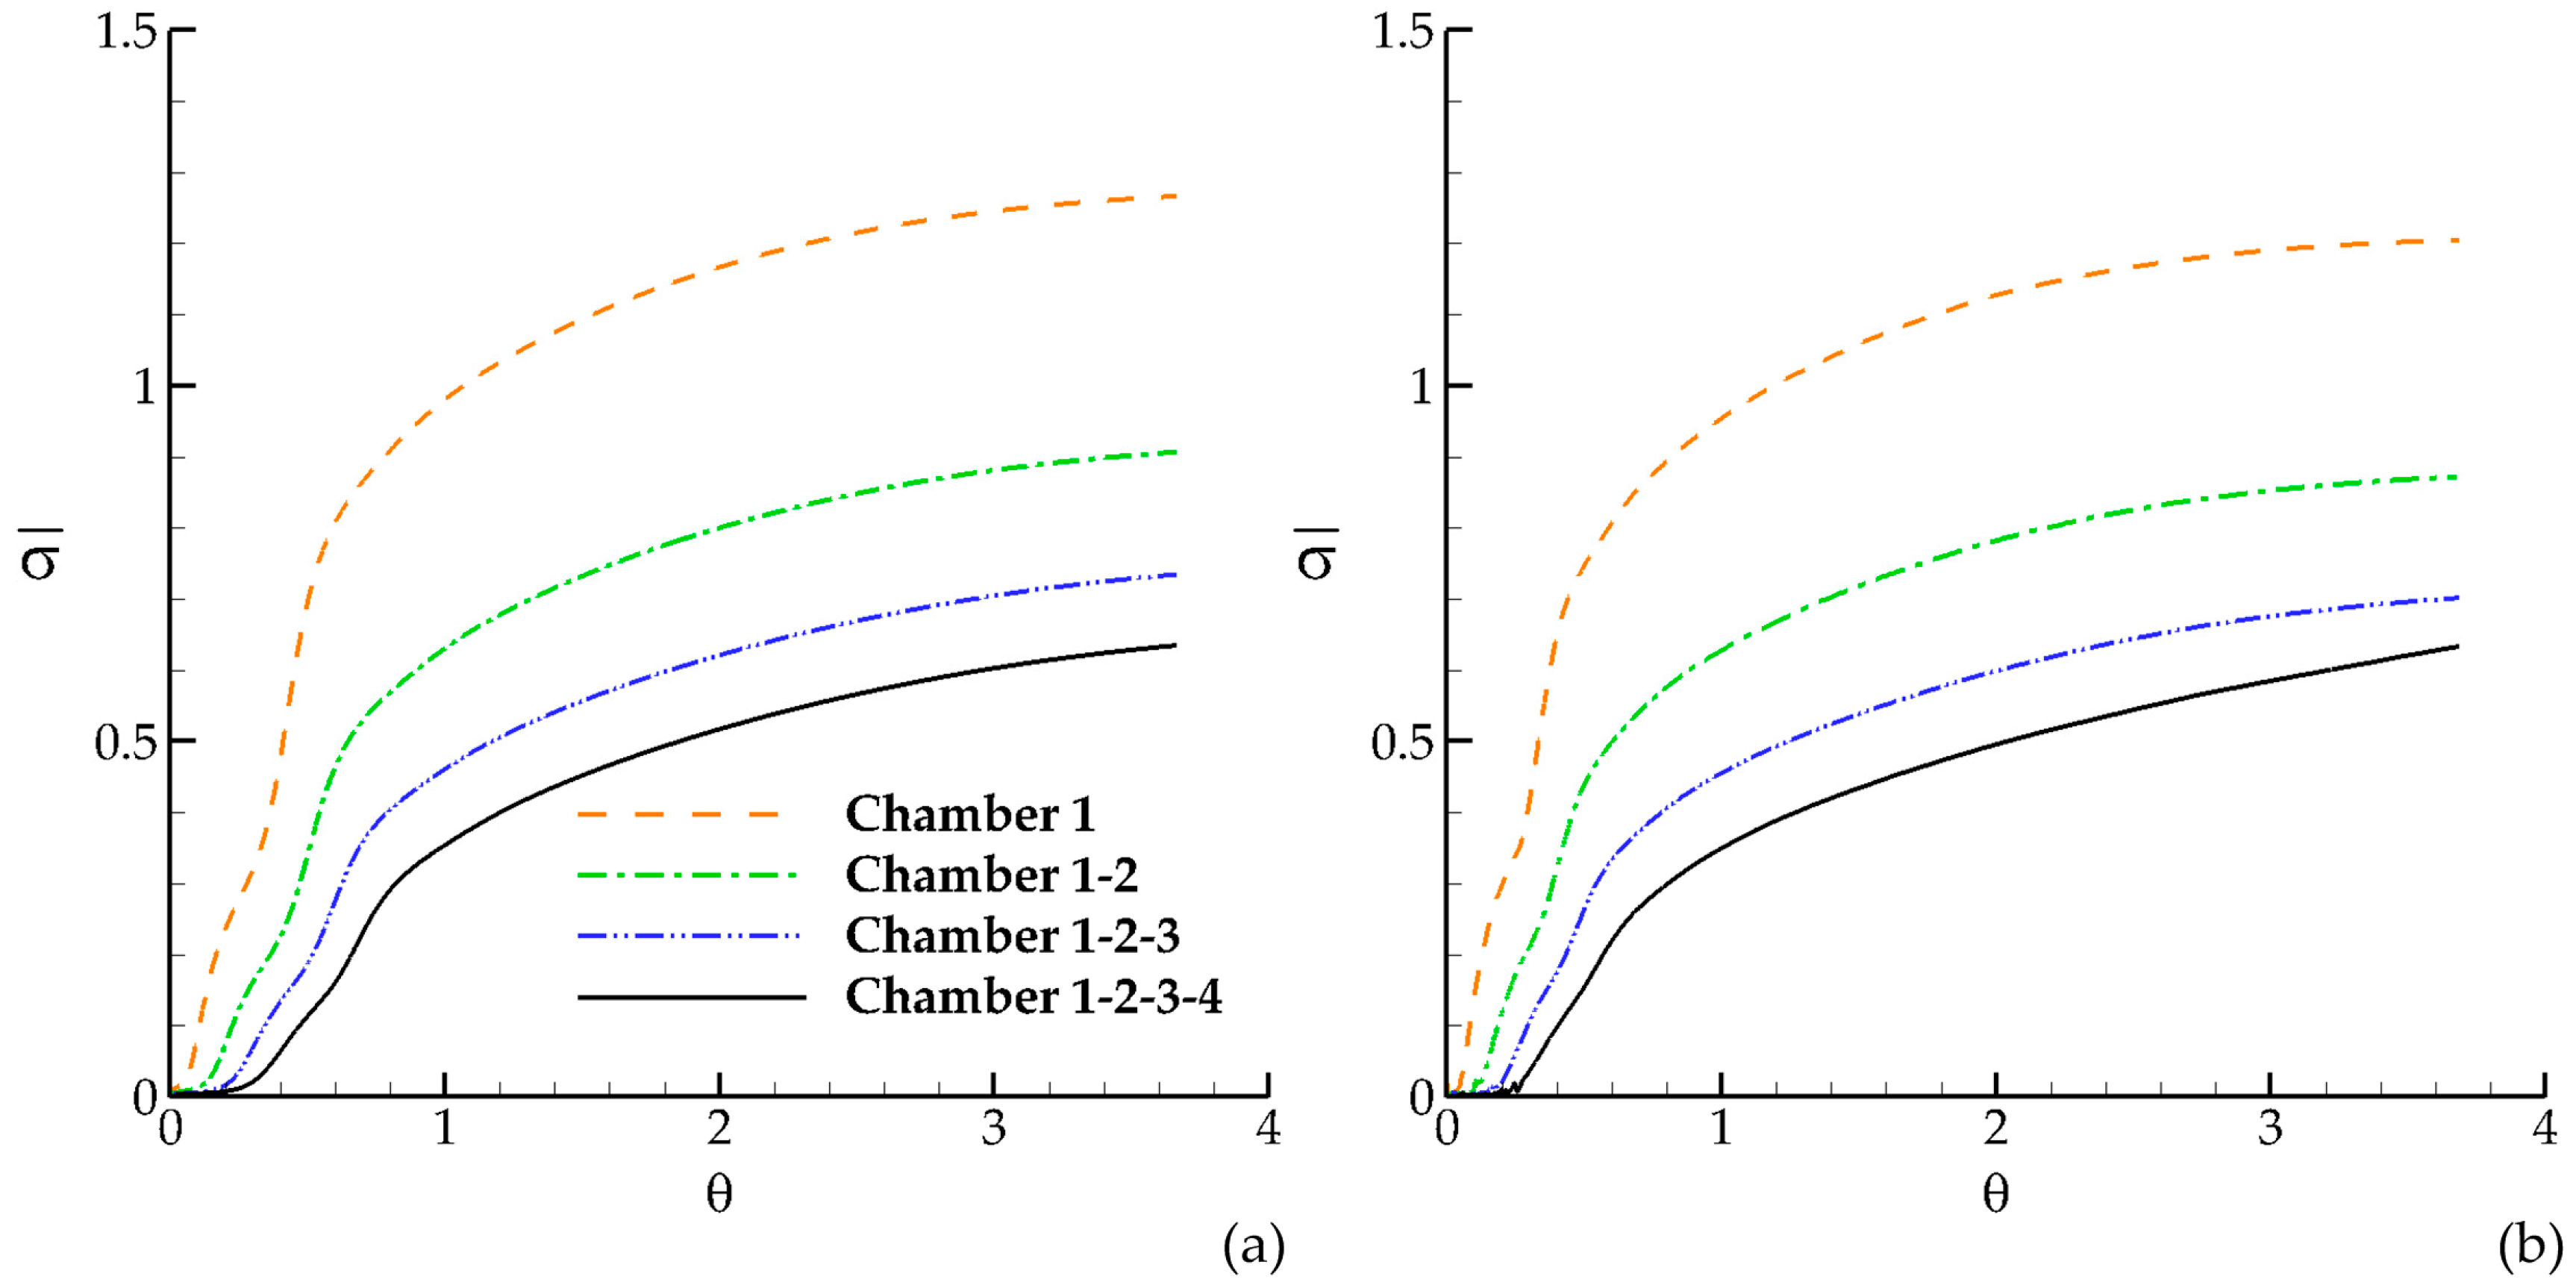
(≈400 s). The definitions given above are calculated as a function of dimensionless time as shown in
Figure 3 for both RANS and LES cases. Mixing efficiency of the contact system is increasing in the downstream direction since the dispersion index is low for high mixing levels [
5]. Dispersion index equals zero for the plug flow, which indicates no dispersion effects due to ideal flow conditions. The slopes of these curves are decreasing with time since the dispersion effects are low in early stages of the simulation and increasing due to the retention, release and mixing of the tracer in the recirculation zones of each chamber. However, as indicated earlier, the recirculation zones narrow the jet thickness to increase the short circuiting effects in the contact system. Thus, the recirculation zones in the chamber are not only increasing the mixing efficiency due to turbulence effects, but they are also the cause of short circuiting effects in the contact system. This is a give and take situation which can be taken advantage of in a modified design of chamber geometry. The comparisons of RANS and LES results show that the dispersion index in LES is less than in RANS for each chamber which shows again that the mixing characteristics are relatively strong in LES since the unsteady motion of turbulent eddies in the recirculation zones increases the mixing efficiency although the time-averaged volumetric efficiency is lower as reported earlier [
1]. This observation again emphasizes that proper design of chamber geometry is needed, which would increase the volumetric efficiency coefficients [
1] as well as mixing efficiency.
3.3. Volumetric Mixing Efficiency Definitions
The flow regions in the contact system were separated using the vorticity gradient concept and the flexion product in [
1]. The computational cells in the tank are tagged as recirculation or jet cells based on the information obtained from separated flow zones. We can now define volumetric mixing efficiency indexes for each zone based on the separated flow regions such as the jet and the recirculation zone and the concentration time history within each zone. The proposed definitions can be exploited to investigate the residence time of the tracer in different flow zones in order to see the mixing interaction between these zones at different instants of time during the tracer transport process.
The following dimensionless residence time distribution functions are defined for the recirculation zone, jet zone and the total chamber,
where
EV represents the volumetric
E function;
is the concentration value at the cell at time
,
is the cell volume; superscripts
R,
J and
T indicate the recirculation zone, the jet zone and the total tank, respectively; and the subscript
m respresents the chamber number for the present contact system. The volumetric definitions are non-dimensonalized with respect to the product of the injected concentration and the flow rate.
It is important to note that in
Figure 4 we are looking inside the chambers from a Eulerian viewpoint since the volumetric indexes for jet, recirculation and total chamber (Equations (6)–(8)) are computed inside the chamber after zone separation [
1]. In
Figure 4, one can see the time variation of tracer concentration that enters to the chamber and leaves the chamber and the interaction of each zone. It is clear from
Figure 4 that all zones are active zones that contribute to mixing.
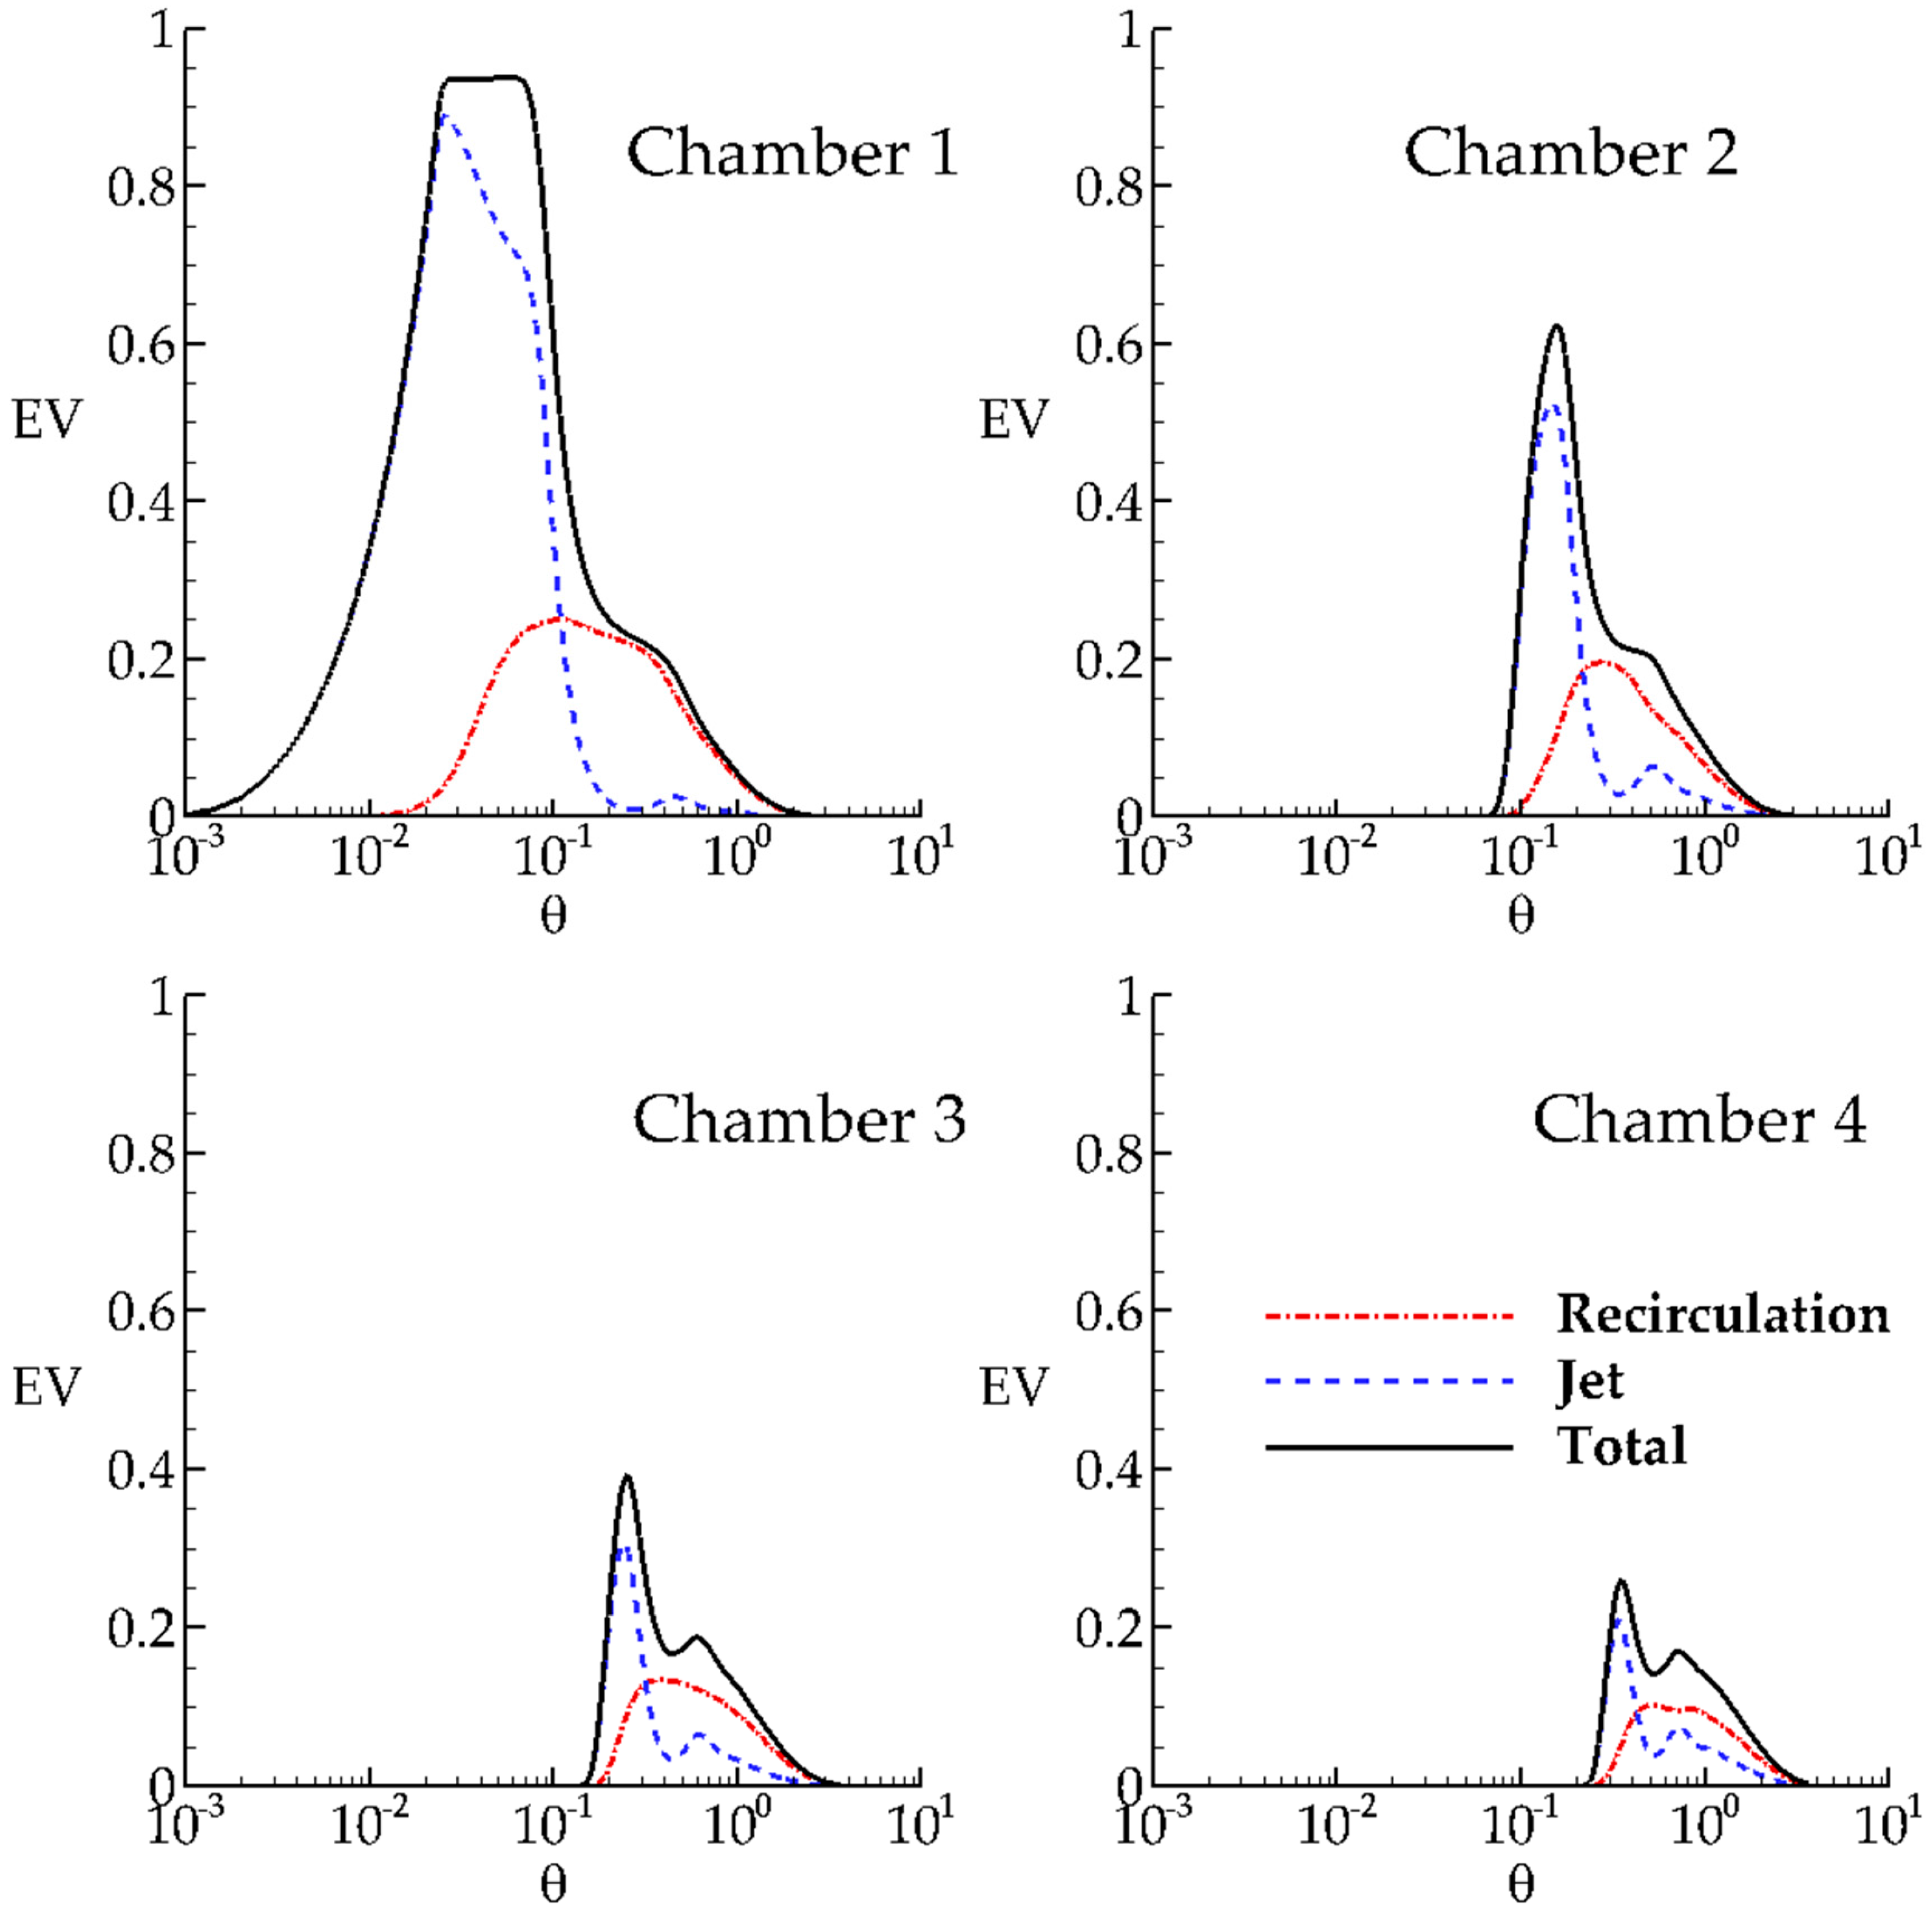
The time variations of volumetric RTD functions in each chamber are shown in
Figure 4 for RANS results. The time variations of volumetric functions in Chamber 1 show that the total concentration volume in Chamber 1 remains constant for a short duration due to pulse injection and starts to decrease since the transported concentration leaves the chamber. The concentration volume in the jet starts to decrease after
since some part of injected concentration enters to the recirculation zone and is retained for a time period. The concentration volume in the recirculation zone first increases due to mixing from the jet zone, and then starts to decrease after
. Eventually, both the concentration in the jet and also the recirculation zone leaves Chamber 1 over time. This observation highlights that a larger percentage of concentration volume is transported by the jet and the remaining part of the concentration is retained by the recirculation zone for a period, which is then released.
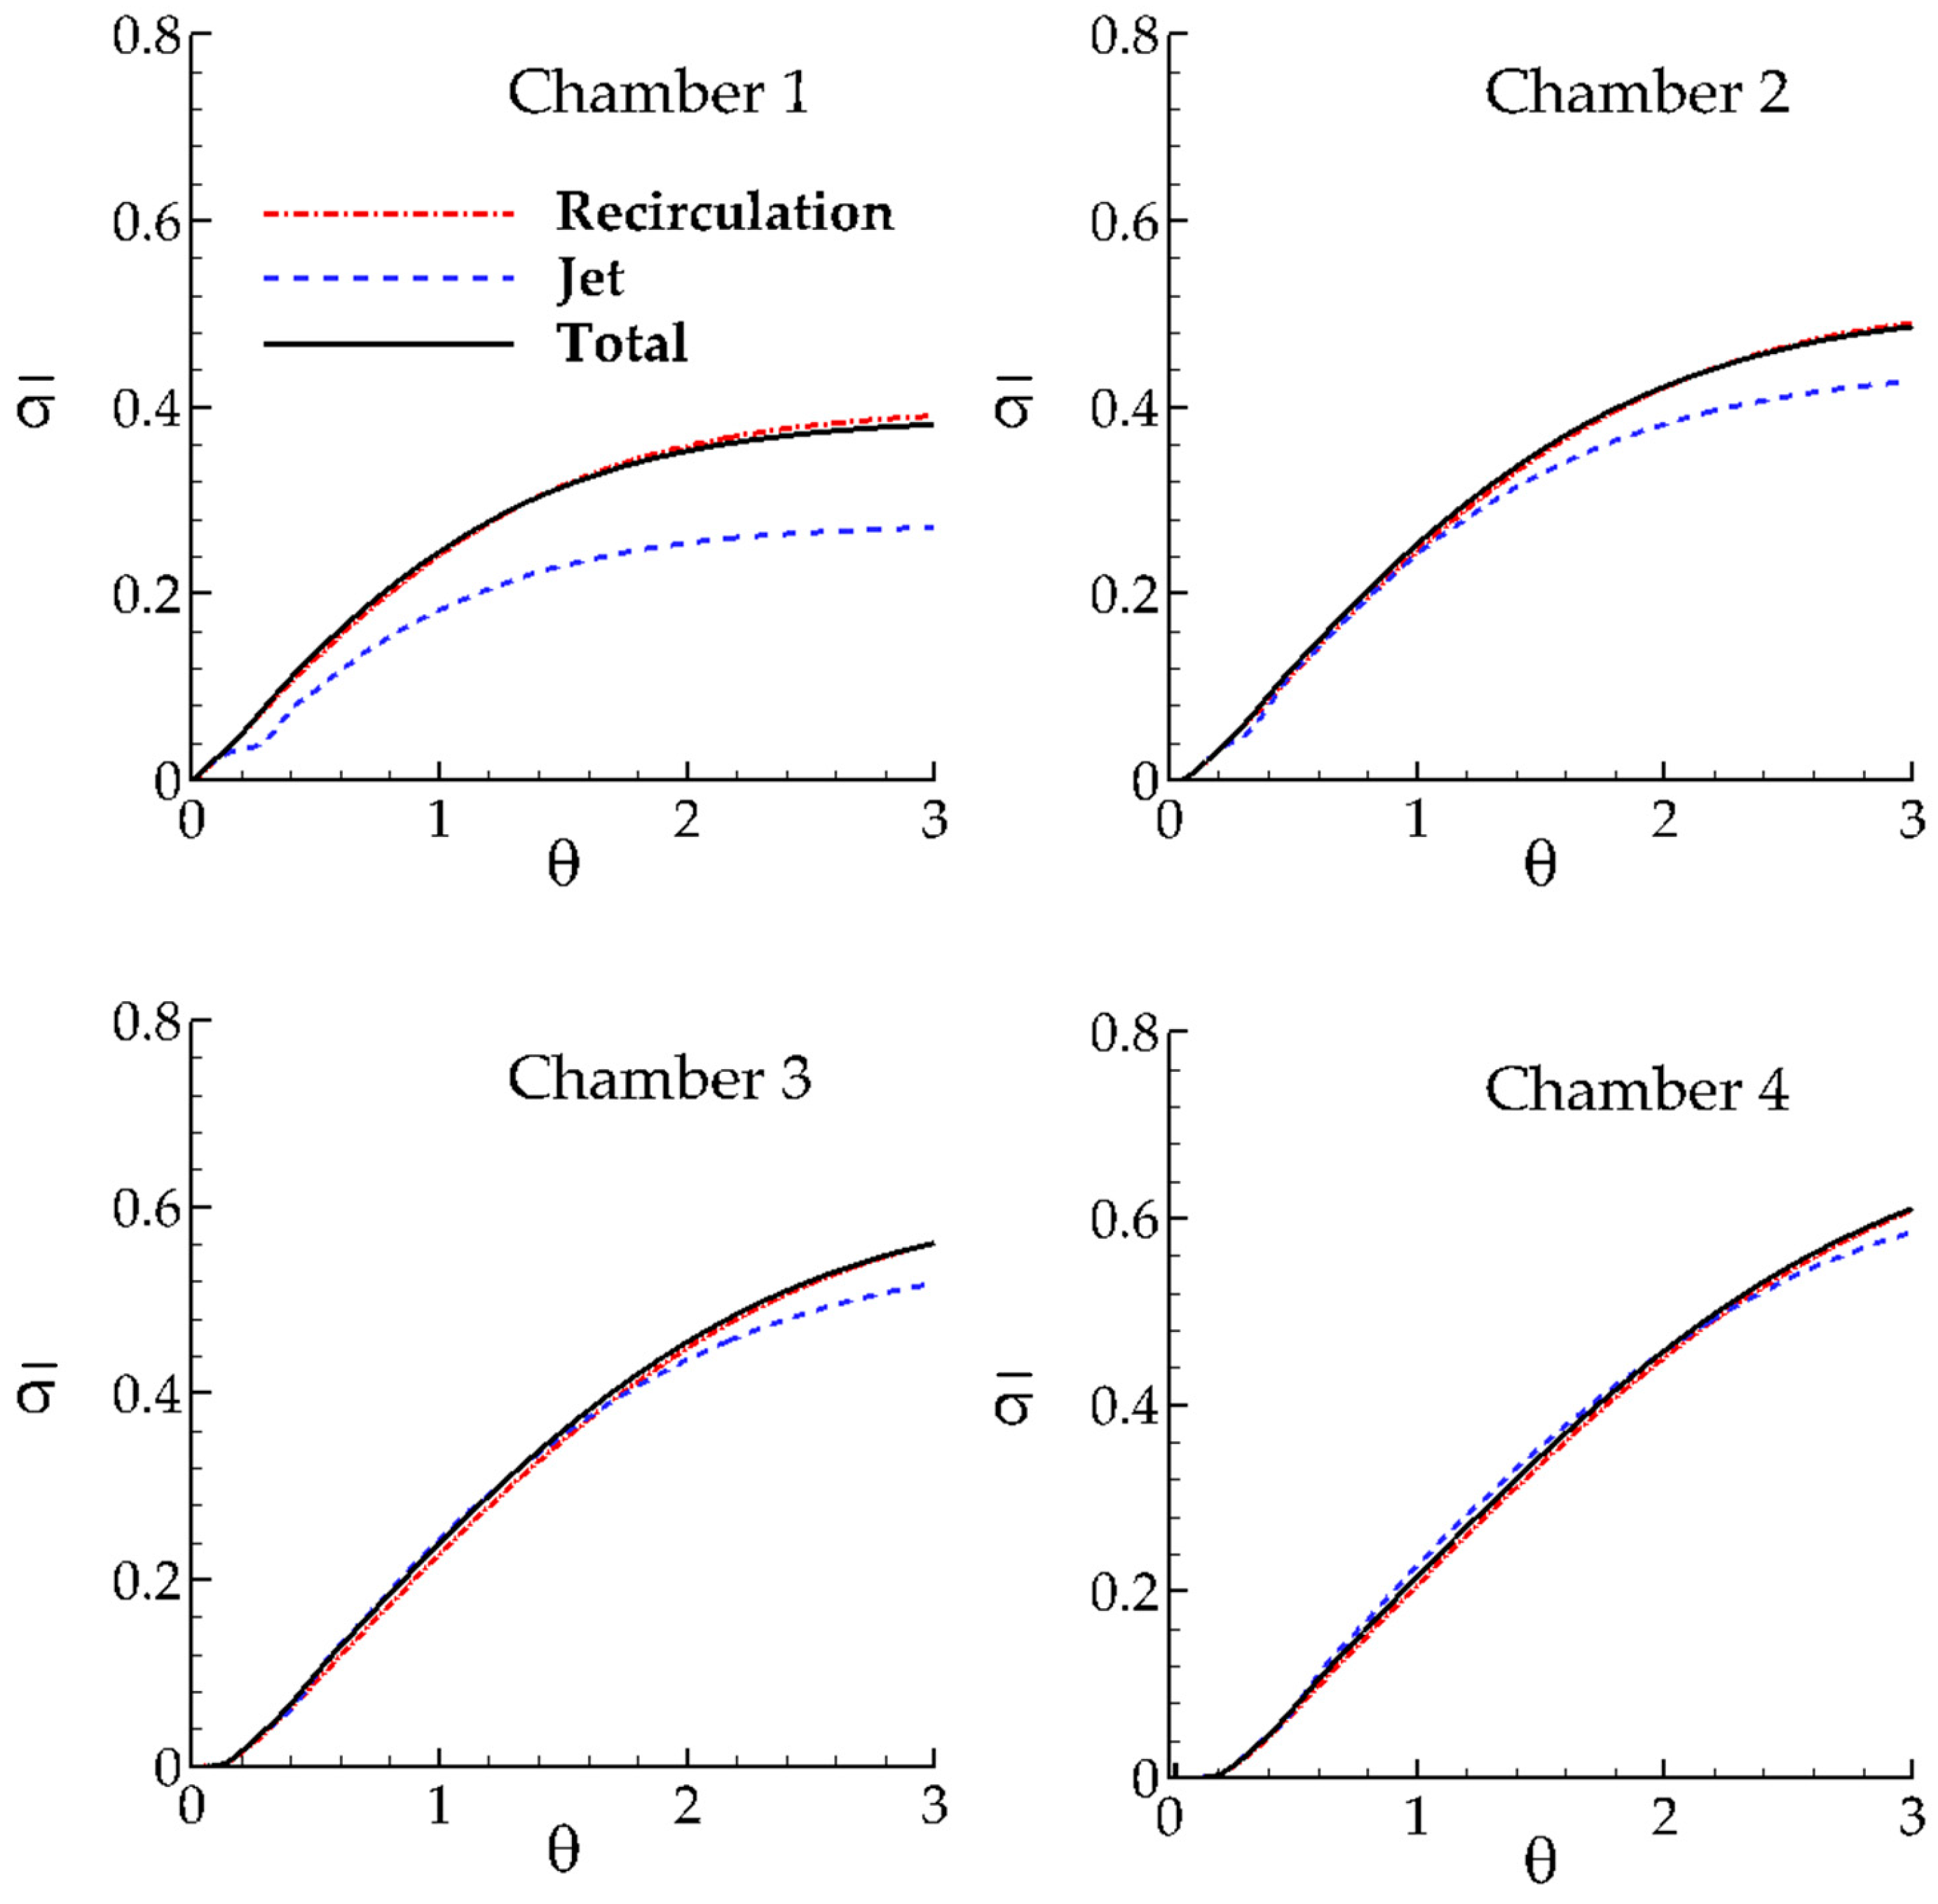
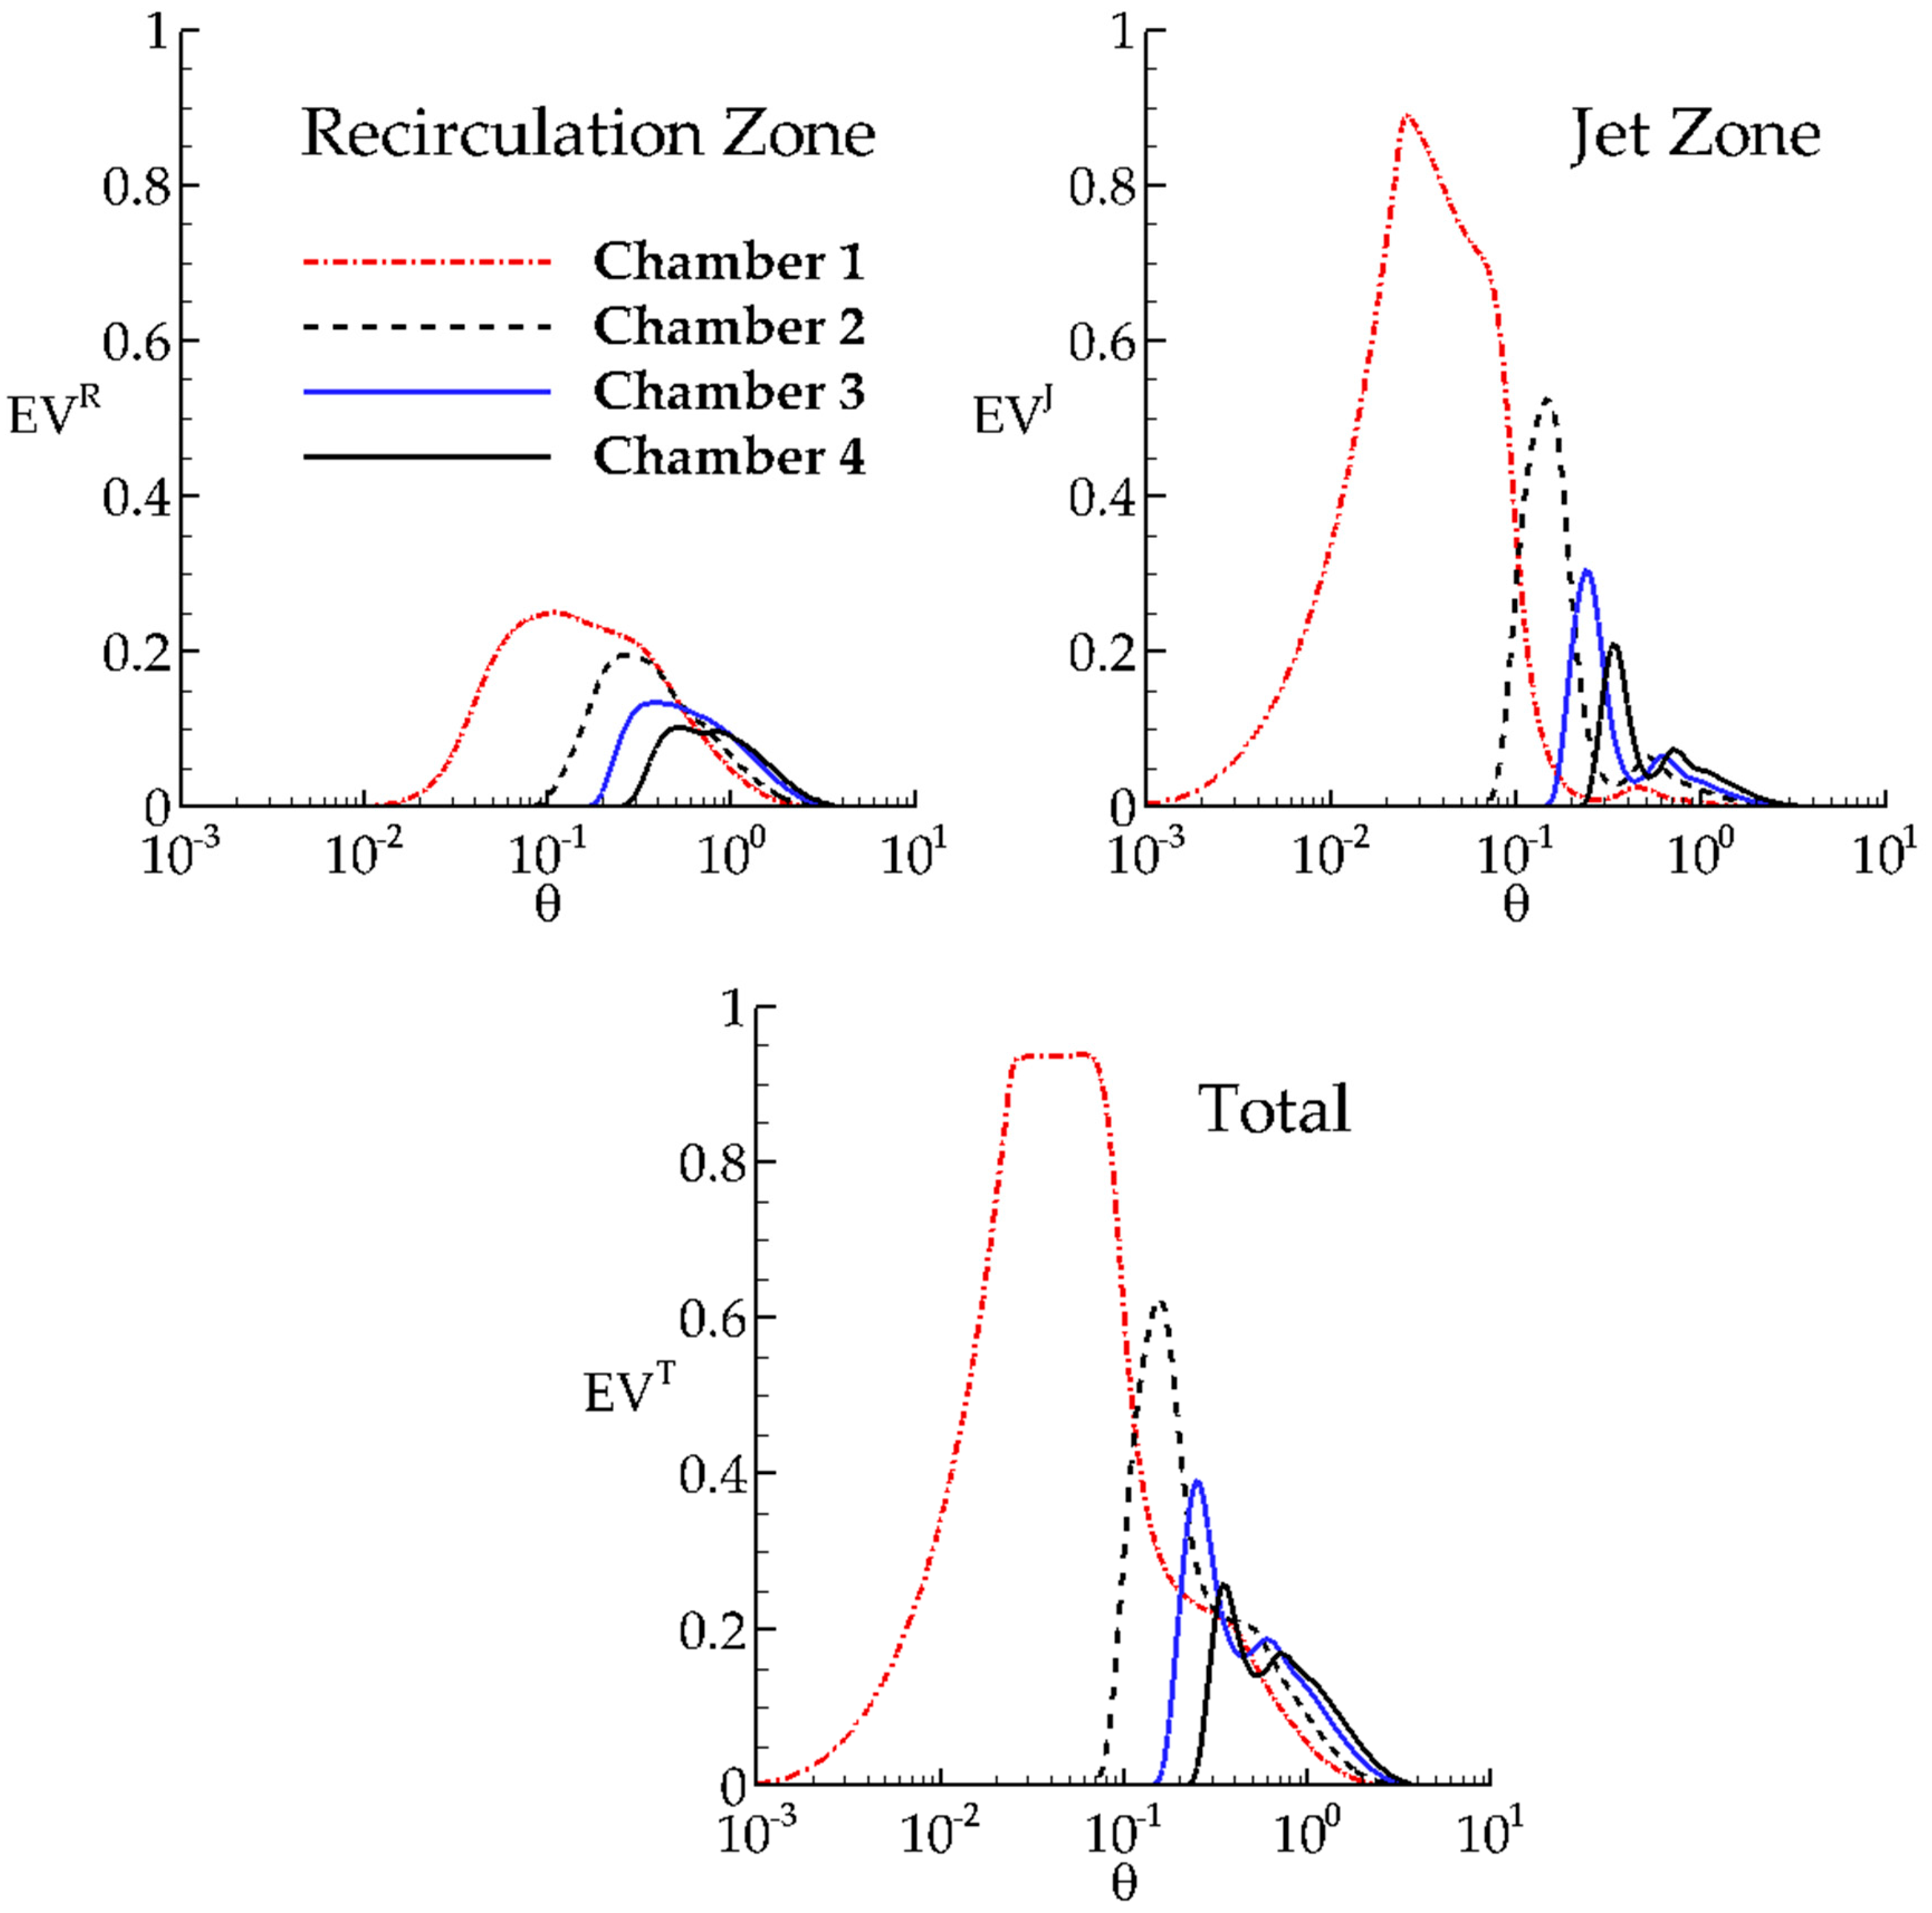
The same data are plotted in
Figure 5 where the recirculation zone, jet zone and the total zone in each chamber are compared in order to interpret the time variation on volumetric mixing efficiency definitions for each chamber. The mixing characteristics in the recirculation zone are decreasing in downstream direction. The peak of the time variation of
EV function in Jet Zone is decreasing in downstream direction due to fact that the short circuiting effects are decreasing in downstream direction and tracer concentration is retained in recirculation zones to reduce the short circuiting.
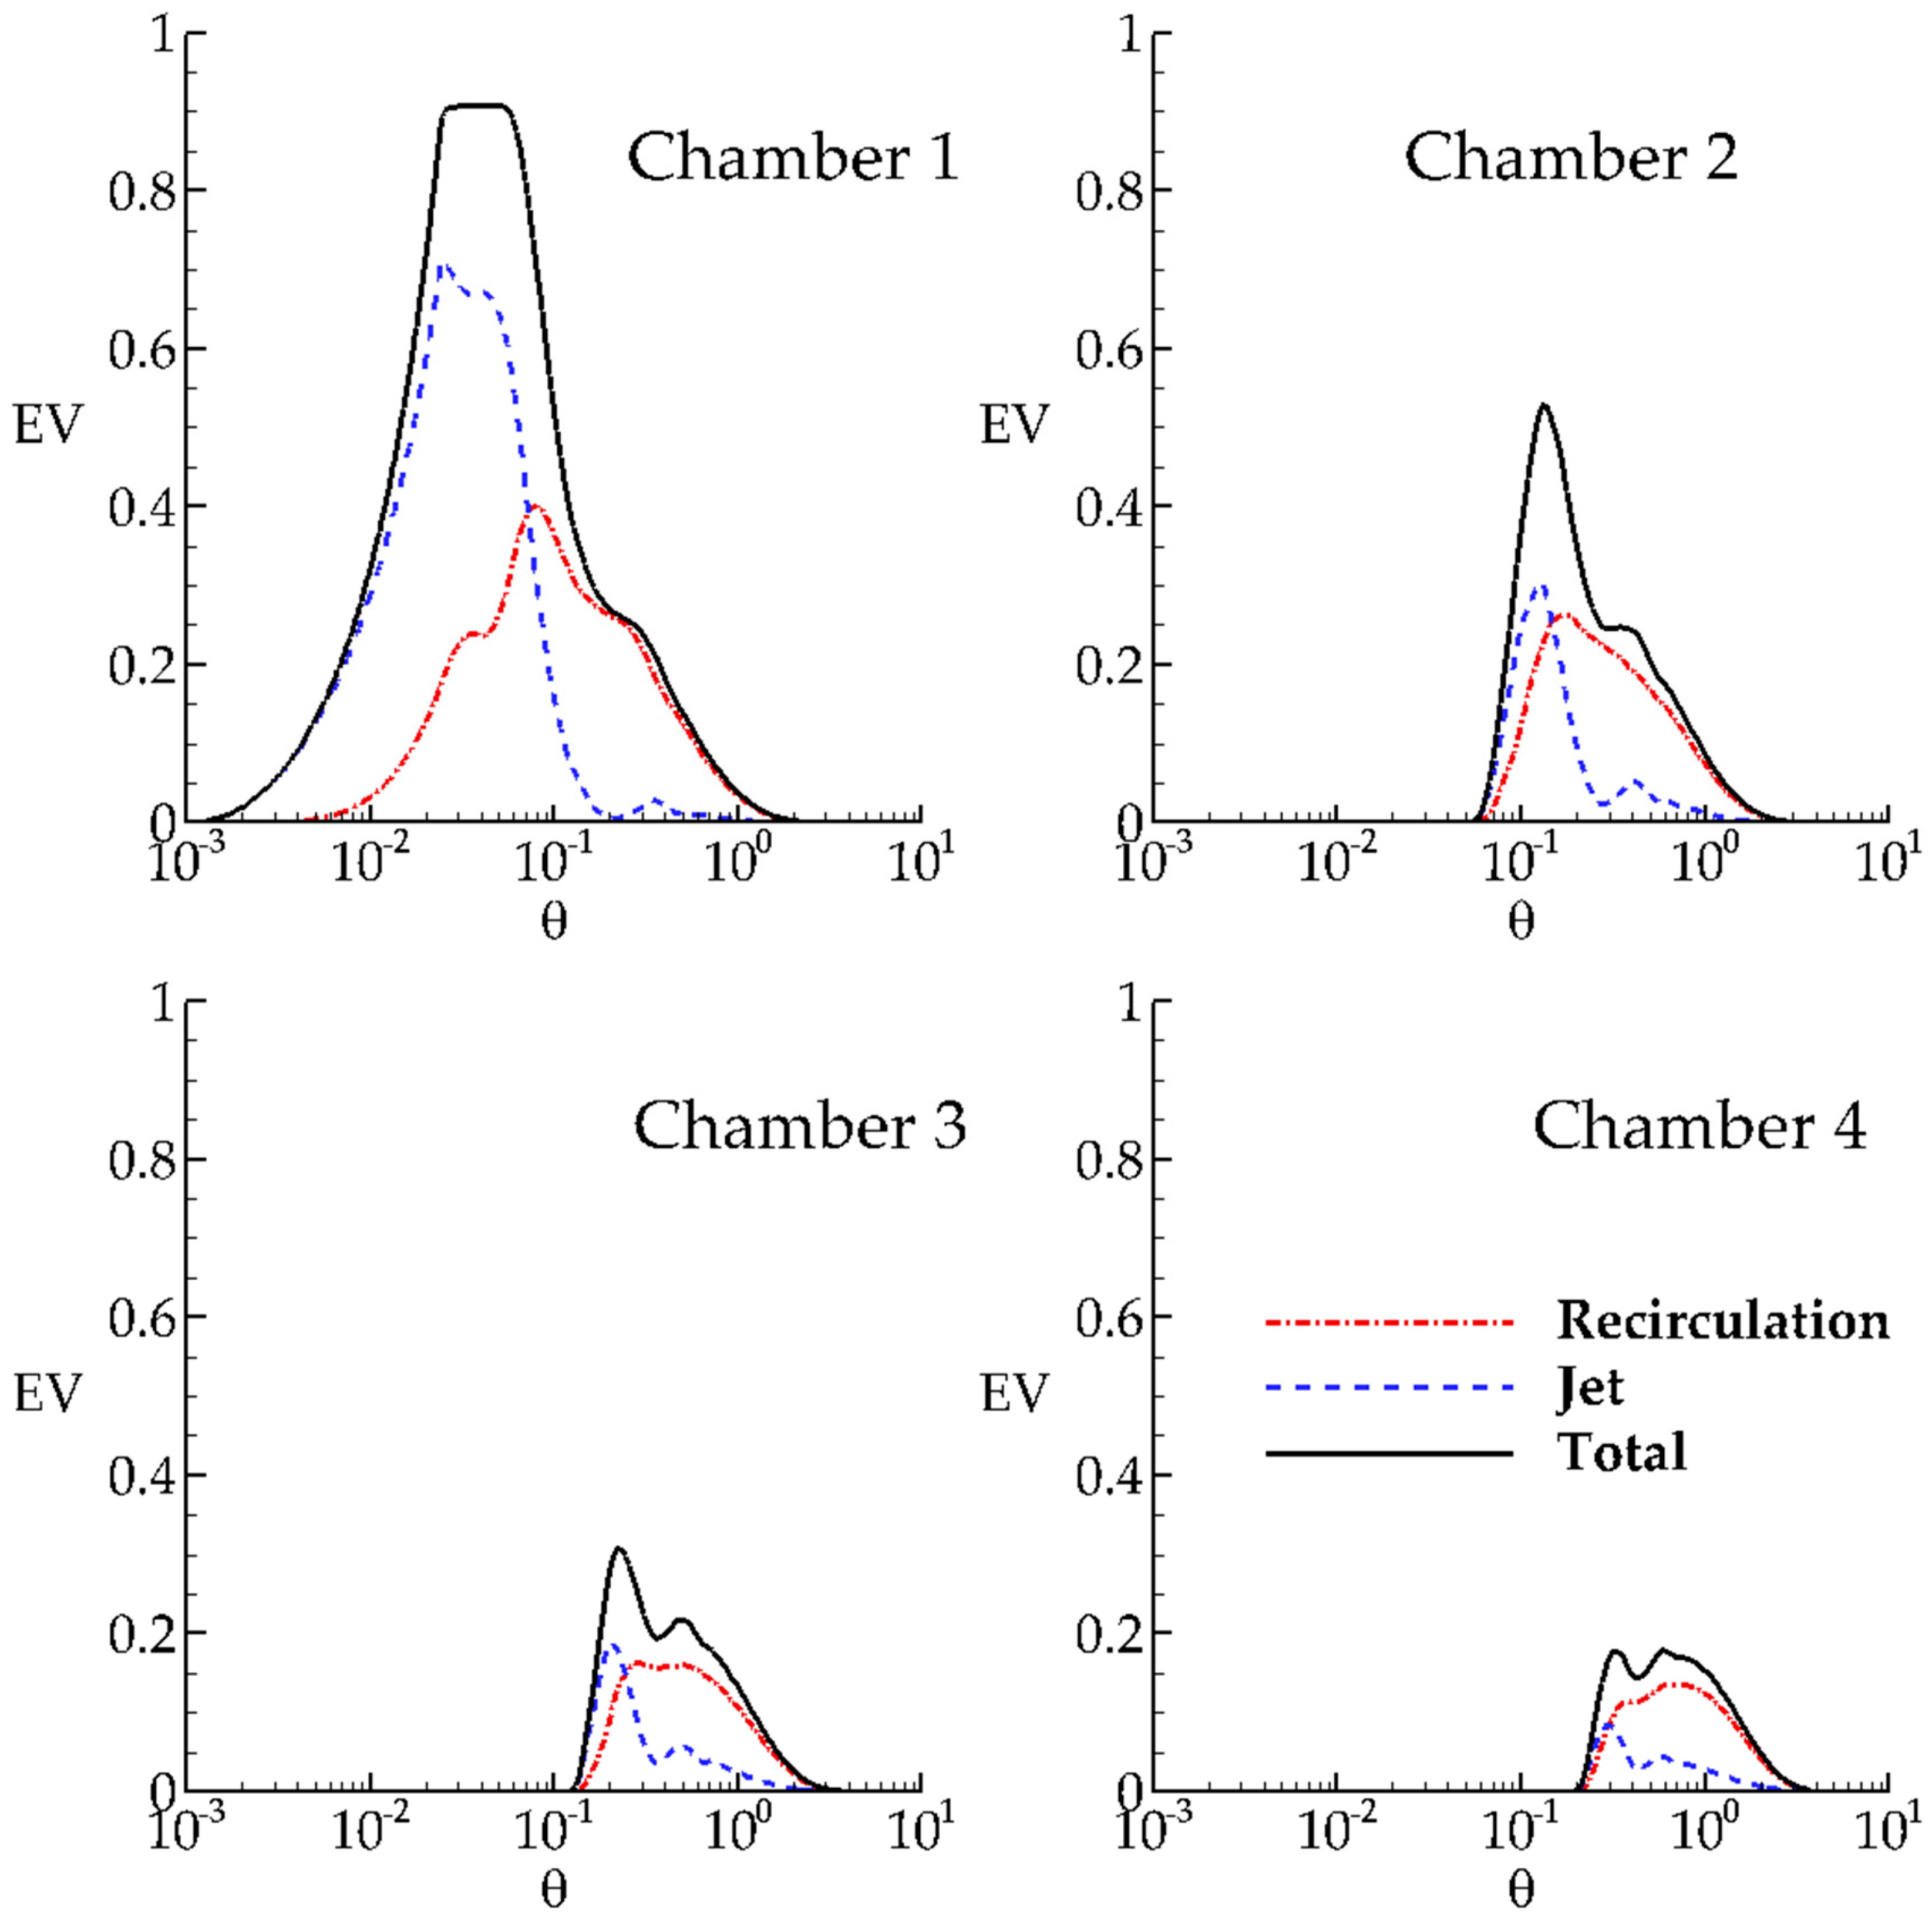
The time variations of volumetric RTD functions in each chamber are shown in
Figure 6 for LES results. The shapes of the curves in LES (
Figure 6) resemble that obtained in RANS (
Figure 4). However, there are differences between LES and RANS results that need to be highlighted. In RANS, the injected tracer is transported by the jet until the dimensionless time
and the concentration starts to enter to the recirculation zone after that time. In the case of LES, the tracer concentration starts to enter the recirculation zone after
. This observation shows that the interaction of tracer concentration between jet zone and recirculation zone starts earlier and it is more effective in LES since turbulence diffusion due to the energetic eddies is more accurately identified in LES. This observation can also be seen in the time variation of volumetric tracer concentration in the recirculation zone. The concentration volume in the jet zone in LES is also less than that of RANS. The total concentration volume in Chamber 2 in LES is less than that of RANS since higher amount of concentration is entrapped in the recirculation zone of both Chamber 1 and Chamber 2 in LES due to turbulent mixing. We can now conclude with more computational evidence that the mixing of the chemical substance is simulated more realistically in LES due to the turbulence induced mixing and recirculation zones are also effective mixing zones.
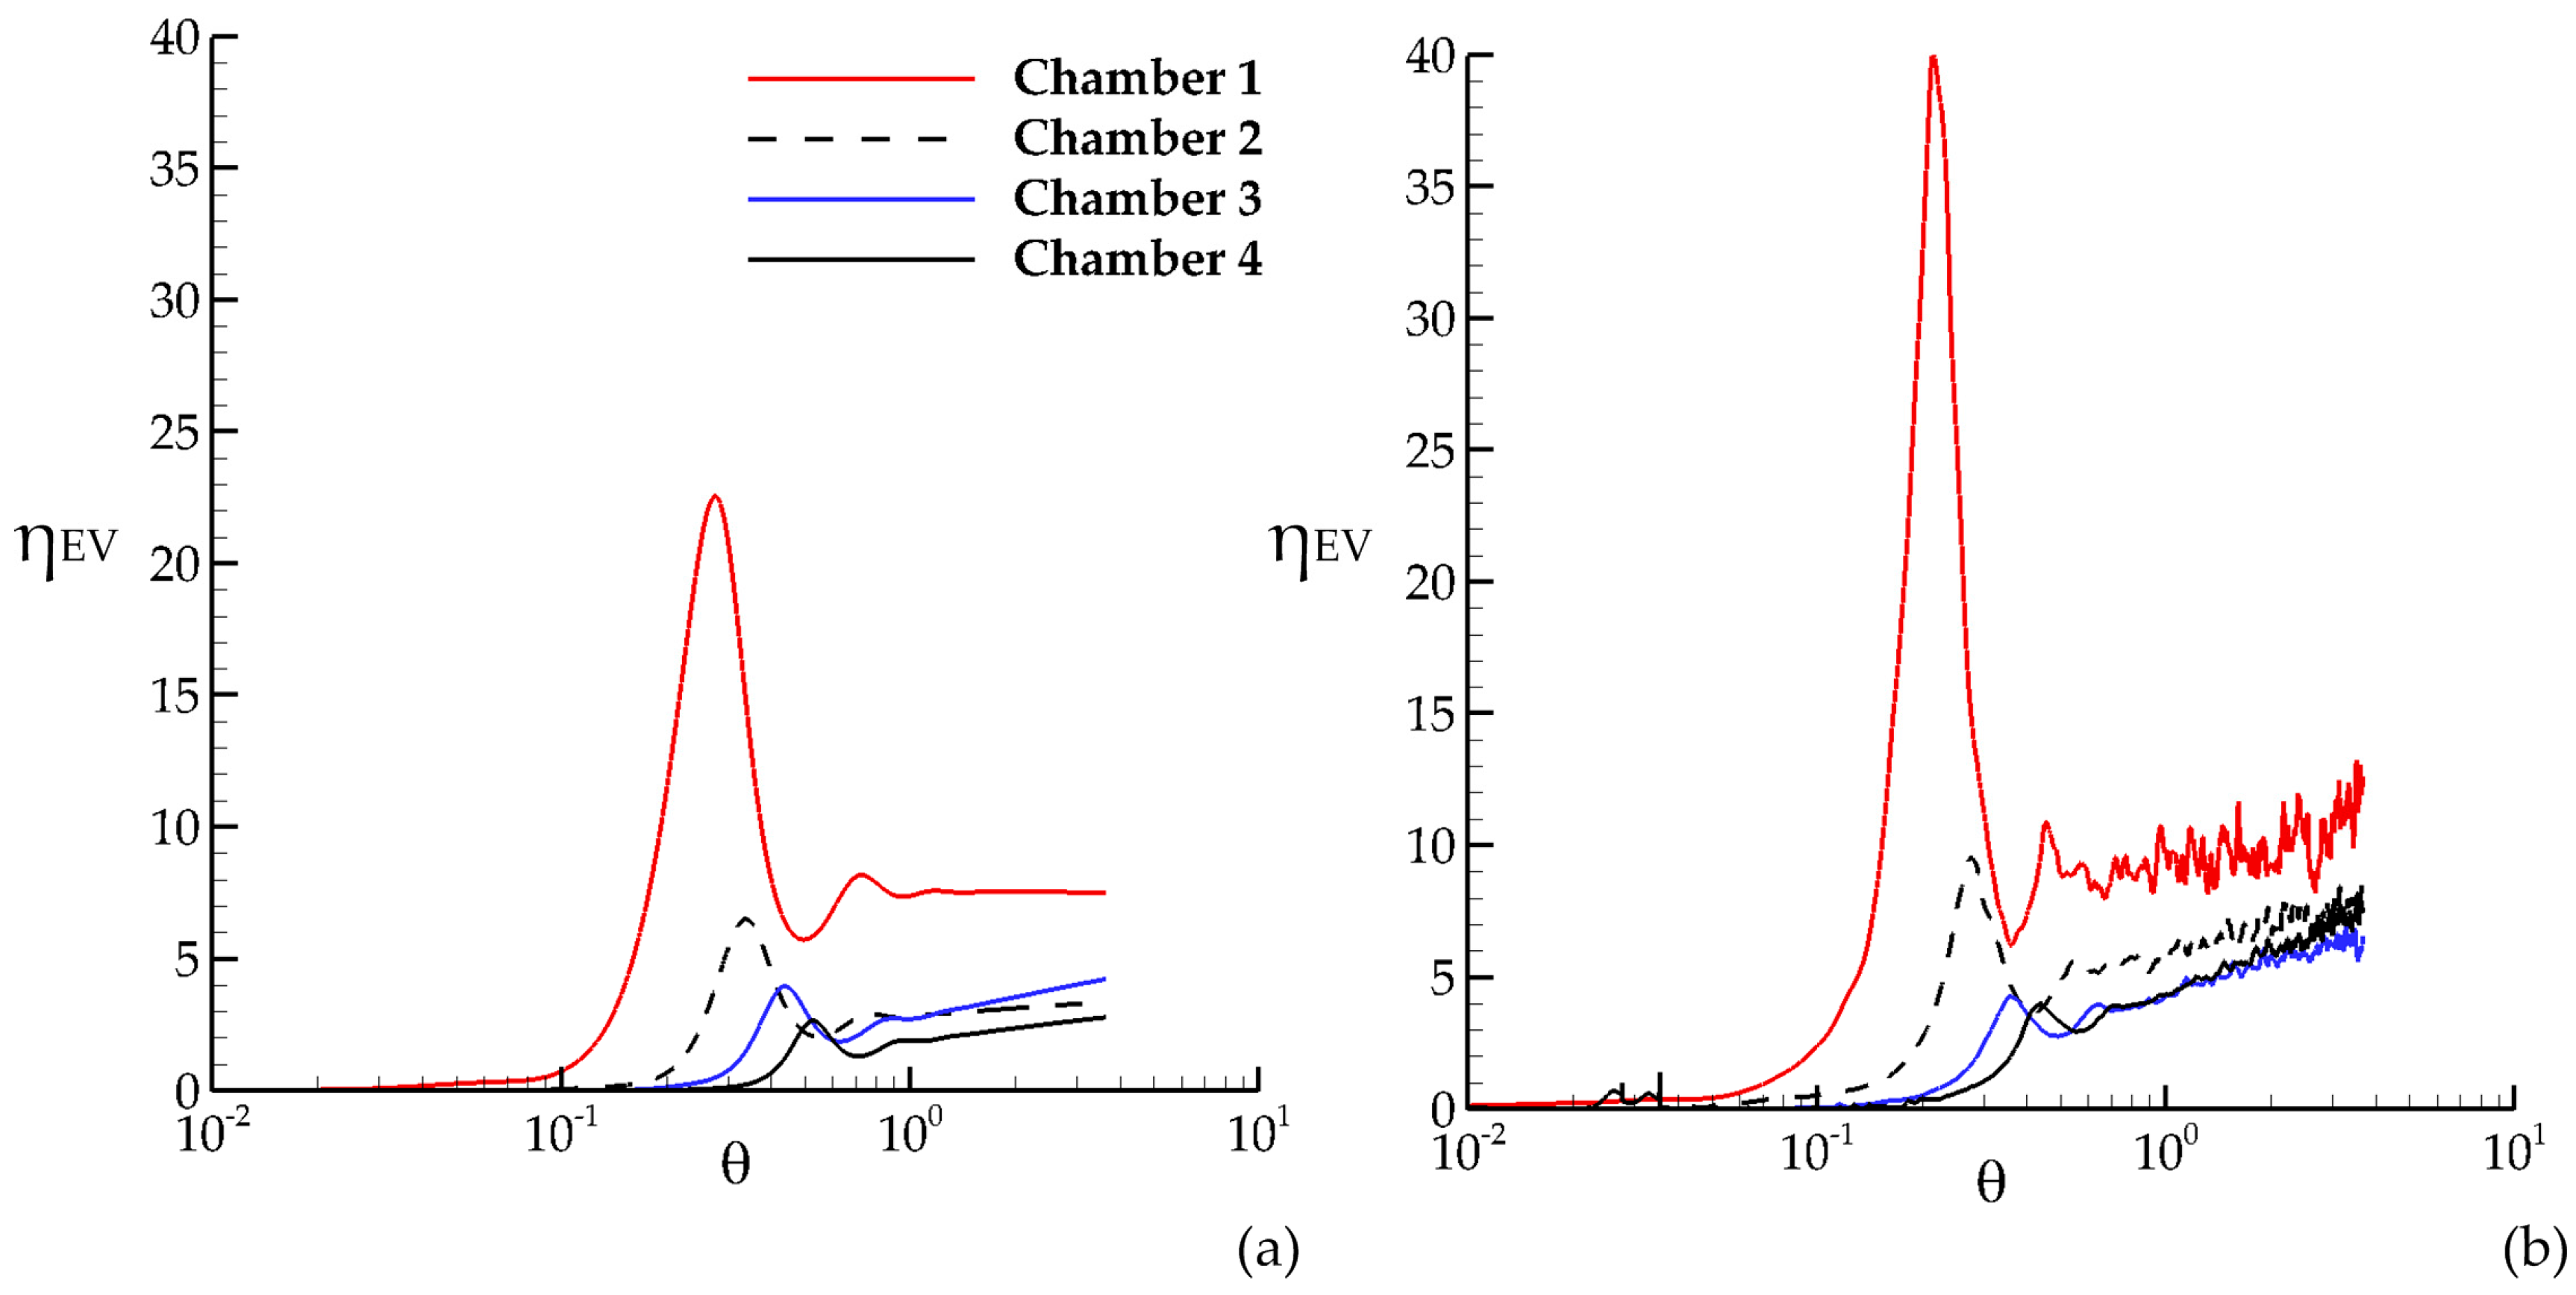
Time variation of the ratio of the retained concentration volume in the recirculation zone to the transported concentration volume in the jet
of each chamber is shown in
Figure 7 for both RANS and LES results. As can be seen in
Figure 7, the ratio
decreases as the chamber number increases since larger amount of tracer leaves the tank due to jet zone transport. In
Figure 7a, the ratio
flattens out for Chamber 1 since a small portion of concentration is entrapped in Chamber 1, whereas the ratio
shows an increasing trend for other chambers since concentration is still being diffused into the recirculation zone as time progresses during the simulation period. This indicates that the interaction of different flow zones has not finished yet within 400 s. Comparison of the peak values in Chamber 1 for RANS and LES results shows that not only the short circuiting effects are more severe but also the mixing effects are stronger in LES. The peak value of the ratio
can be used as an index for the performance assessment of the contact system since it includes both the short circuiting effects in the jet zone and mixing characteristics in the recirculation zone. The noisy variation at the later stage of the data in LES (
Figure 7b) indicates that interaction of jet and recirculation zones in LES continues after short circuiting occurs in the chamber, which is evidence of stronger interaction between recirculation and jet zones in LES than in RANS.
Dispersion index for the recirculation zone, jet zone and the total chamber can be calculated from Equation (3). The mean residence time
is calculated from the following volumetric definitions for the recirculation zone, jet zone and the total chamber:
where
m represents the chamber number. The variance of RTD function
is calculated for each flow zone as follows:
Time variations of dispersion indexes in each chamber are shown in
Figure 8 for RANS and in
Figure 9 for LES.
From
Figure 8 and
Figure 9, since dispersion index values are smaller for LES, one may observe that LES solution shows more mixing than RANS solution as expected. In all cases, LES solution has a flatter dispersion coefficient profile over time, which indicates that effective mixing occurs over a longer period in LES than RANS. Further, as time progresses, mixing efficiency decreases in a sequence of chambers. Initially, the mixing process in the jet zone is more dominant and towards the last chamber mixing efficiency of the chamber is more uniform. Thus, although there is mixing in the recirculation zone, the mixing in the jet zone is more effective.
3.4. The AD Index
The deficiencies of current indexes that are used in the literature are obvious based on the discussion provided above. Thus, it is important to revisit these definitions and possibly define a new index that would capture the mixing and the short circuiting effects better. For this purpose, we propose the
AD index (
Aral-Demirel Index), which is defined as follows,
This index is significantly different to the Mo index since it captures the effect of the overall transport process indicated by the value of mean residence time
relative to
in the numerator, and also relative to
in the denominator. It is expected that
will decrease and will get closer to
as mixing increases. Thus, as mixing increases, numerator of the
AD index will tend to zero. Similarly, as short circuiting increases,
is expected to decrease; thus, the difference between the
and
will increase. In this case, the
AD index will also tend to zero. Thus, when
AD index tends to zero, it will imply better mixing and less short circuiting. This computation does not have the reverse and confusing effect of the Mo index ratio in its definition relative to
and
variations as an indicator of mixing and short circuiting. As
AD index tends to larger values, it implies less mixing and higher short circuiting. Further, the
AD index values can be complemented by the trends observed in the numerator as well as the denominator when making comparisons between several case studies as shown below for the RANS and LES results of Chamber sequence analysis. The denominator, numerator and the
AD index are computed from Equation (15) based on the data plotted in
Figure 2 and are shown in
Table 3 for both RANS and LES results.
From
Table 3, one may observe that as
AD gets smaller it implies higher mixing and also relatively higher short circuiting. Thus, LES simulation results for all chambers have higher mixing efficiency and also higher short circuiting effects. To distinguish between the two trends, one may observe the values in the previous columns of
Table 3. One can clearly see higher mixing in LES results for all chambers since
values in the numerator are always less than the RANS solution for all chambers. Further, one may also observe that there is higher short circuiting in all chambers of the tank since the
values in the denominator are always higher in LES solution when compared to RANS. In addition, one may observe that the denominator of the
AD index is smaller than the numerator of the
AD index for all cases, which indicate that short circuiting processes are more dominant for this chamber sequence and also the tank than the mixing process. Thus, this implies that this is not a good design for a contact tank as expected. All of these trends indicate that LES shows more mixing and also higher short circuiting than RANS. This result confirms the expectations developed throughout this study and shows that
AD index may be a valuable tool for efficiency analysis.


