1. Introduction
As a consequence of continued economic growth and population expansion, freshwater demands are increasing worldwide, with local water shortages occurring more frequently than ever before. Nearly one billion people in the developing world do not have access to clean and safe drinking water. Many regions in the world are facing serious water scarcity [
1], mainly due to the consumption of water for agricultural production [
2]. Porkka et al. [
3] report that in Central Asia, over 80% of the population suffer from water stress and approximately 50% suffer from water shortage. Water demand and appropriation continue to increase while the available resources are comparatively fixed. Nõges et al. [
4] note that multiple stresses on surface and groundwater resources from natural and man-made disturbances have become the rule rather than the exception.
Virtual water trade, the trade in commodities such as crops that consume a lot of water in production, thus saving water in the importing country [
5], is a mechanism that has reduced water demand and shortages in some of the most water-scarce nations in the world [
6]. Through virtual water imports, a lot of countries have substantially externalized their water footprint. The water footprint, a concept introduced by Hoekstra [
7], indicates the volume of water used to generate a product, accounting for all water use along the supply chain of a product. The concepts of the water footprint and virtual water trade are widely used for the study of water resources use in relation to consumption and trade [
8]. Comprehensive global studies have been undertaken to quantify virtual water flows between countries [
2,
9,
10,
11,
12]. A substantial volume of the virtual water flows is directed from countries with lower water stress to countries with higher water stress [
13]. Over the past decades, international virtual water trade has increased [
14], with a global trend towards increasing domestic dependence on foreign water resources [
15].
The projected growth in the world population will lead to a growing scarcity of freshwater, which demands intensified efforts to make water use more efficient and sustainable. In addition, climate change will influence water availability patterns and thus impact the global virtual water trade pattern [
16]. In order to increase water use efficiency at the global level, it has been suggested to look more closely at the pattern of international virtual water flows, particularly in relation to trade in crop and livestock products [
10]. The implementation of virtual water trading policy at a national scale may potentially contribute to alleviating water scarcity [
6]. Considering that the majority of water use is for food production, virtual water trade studies have focused primarily on water resources used to generate food products. The literature shows quite a number of detailed country and regional studies on virtual water trade, for instance for China [
17,
18,
19], India [
20], the Netherlands [
21], Spain [
22], Italy [
23], the UK [
24], the European Union [
25], the US [
26], Latin America and the Caribbean [
27], the Nile basin countries [
28], Morocco [
29], Kenya [
30] and Jordan [
31].
Most virtual water trade studies have been carried out from the perspective of reducing the pressure on domestic water resources in importing countries or on the issue of virtual water import dependence and related food security. Apart from the continental study for Latin America and the Caribbean as a whole [
27], there has been little attention paid to the water footprints and virtual water trade of water-abundant virtual water exporters. The current paper is the first country study to look specifically at the combination of net virtual water export and relative water abundance on a national level, focusing on Brazil, because it is the fifth biggest net virtual water exporter in the world [
2] and is generally regarded as relatively water abundant [
1]. Brazil is a world leader in the production and export of various agricultural and livestock products.
The objective of this paper is to assess the international virtual water trade of Brazil in the period 1997–2012 related to international trade in agricultural commodities and to estimate the water footprint of national consumption. In addition, the study aims to establish the international virtual water trade balances per state within Brazil, which is relevant given the fact that water scarcity varies within the country, so the origin of virtual water exports matters. The current study is the first study that evaluates water use for producing for international export per state rather than at the country level. As in most countries, water resources in Brazil are unevenly distributed and in various places the frequency of drought incidences is increasing. Semiarid areas in Brazil have even undergone agricultural abandonment due to frequent and severe droughts [
32]. At the scale of the country as a whole, Brazil shows abundant water resources, but about 73% of the fresh water available is located in the Amazon basin, where less than 5% of the population lives.
2. Materials and Methods
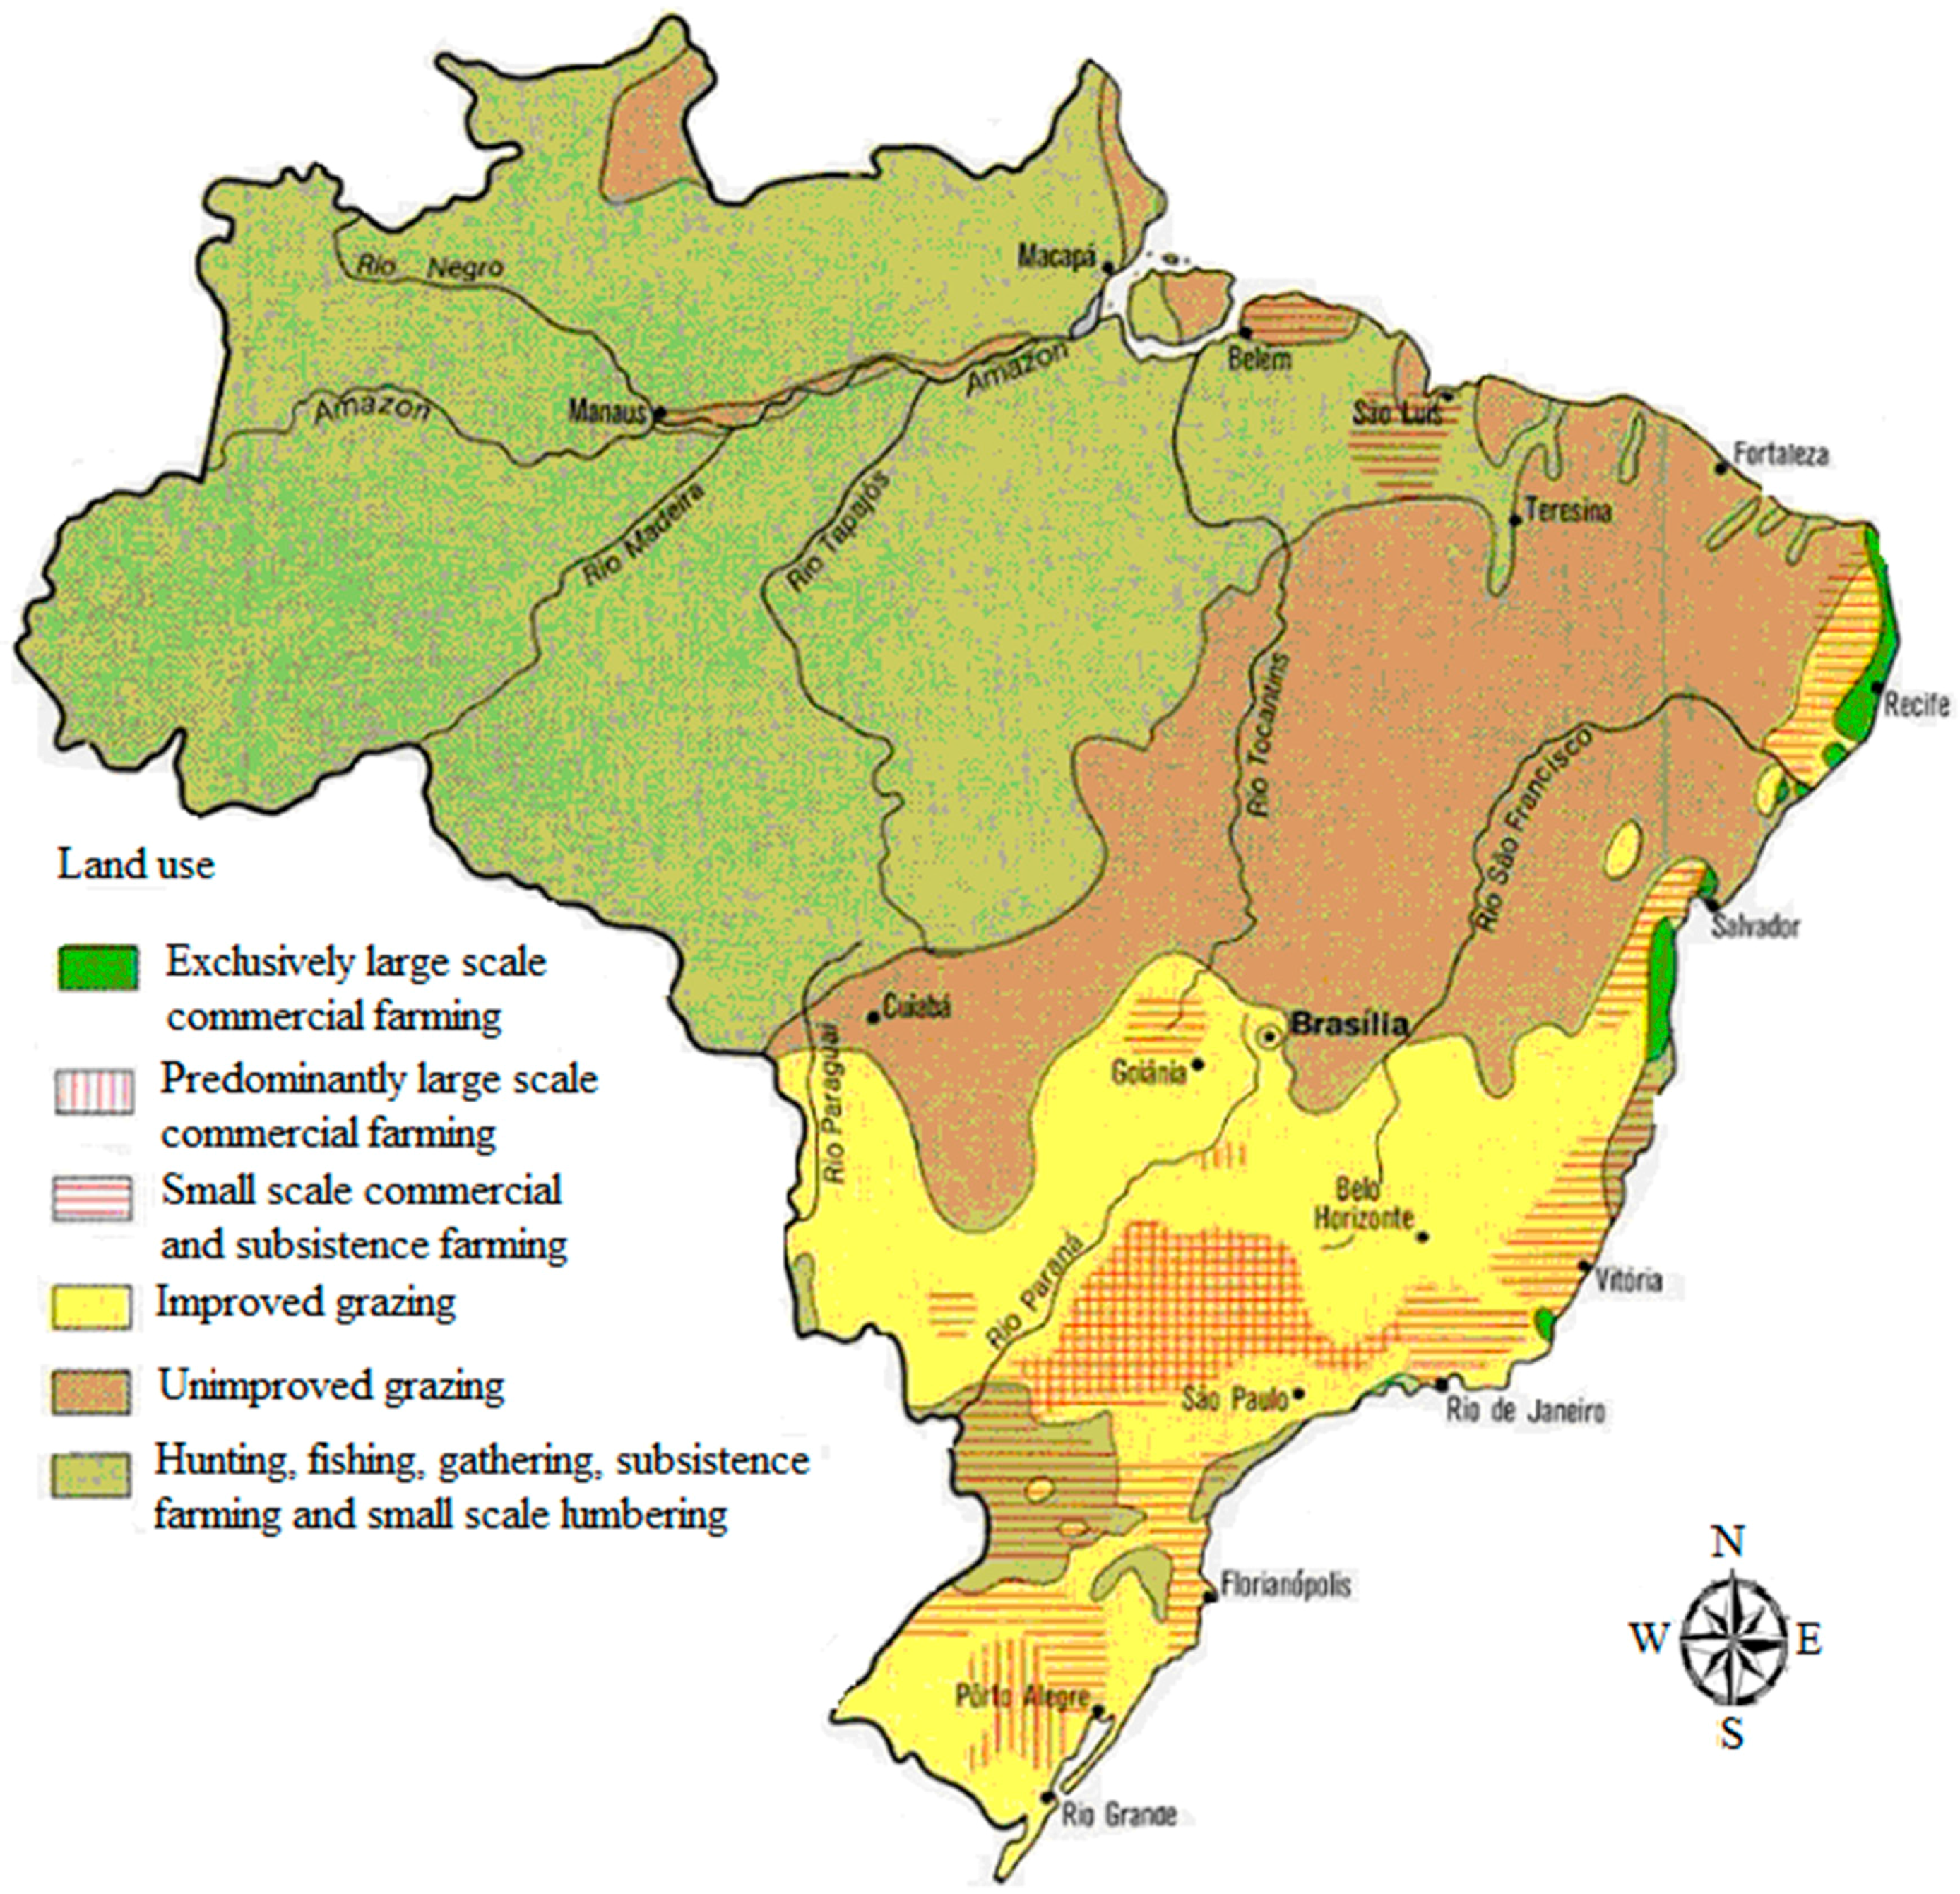
Data on population and annual production and consumption of agricultural products are provided by the Brazilian Institute of Geography and Statistics (IBGE); trade data are obtained from AliceWeb, an online platform developed and maintained by the Secretariat of Foreign Trade (Secex) of the Ministry of Development, Industry and Commerce (MDIC). The trade data from AliceWeb are at state scale. AliceWeb is updated monthly with data from the Integrated Foreign Trade System (SISCOMEX, in Portuguese). The analysis concerns average annual values for the 15-year period 1997–2012, which is considered long enough to avoid influence of annual fluctuations in climate and trade. The Brazil land use map is show in
Figure 1.
The water footprint (WF) of a product depends on several aspects, such as its production conditions, including water use efficiency and the place and time of production. There are different modelling approaches to estimate the WF of crops [
33]; here, we applied the same approach as Hoekstra and Hung [
10]. WFs are calculated per crop and per state as the ratio of crop water use (m
3·ha
−1) to the crop yield (ton·ha
−1).
WFs of imported products per origin country were obtained from [
2]. Yields are taken from the FAOSTAT database of the Food and Agriculture Organization. Crop water use was calculated using FAO’s CropWat model [
34], by accumulating crop evapotranspiration (ET in mm·day
−1) over the growing period of the crop. ET over time is obtained by multiplying the time-dependent reference crop evapotranspiration (ET
o, mm·day
−1) by the time-dependent crop coefficient (K
c). In 2012, the total cultivated area in Brazil was estimated at 80 million ha, of which 91% (73 million ha) for annual crops and the rest for permanent crops. Looking at crops with a harvested area of over one million ha, the largest relative increases were in the harvested areas of soybeans, from 14 to 24 million ha, and of sugarcane, from 5.0 to 9.6 million ha [
35].
The following crops and livestock products are included in this study: coffee, maize (corn), wheat, rice, barley, rye, cassava, bean, potatoes, vegetables (lettuce, cabbage, mustard, celery, beet, watercress, etc.), onions, garlic, tomato, orange, apple, pear, banana, grape, refined sugar, and sunflower oil. In addition, we consider the following livestock products: milk, buttermilk, cheese, chicken eggs, chicken meat, pork and beef. The study focuses on the consumptive water footprint of commodities, that is sum of green and blue water consumption to produce them, and hence focuses on the sum of green and blue virtual water trade as well.
The water footprint (WF) of crop products is based on product and value fractions, following the method of Hoekstra et al. [
36]. The product fraction is equal to the amount of crop product obtained per unit of primary crop, while the value fraction is the market value of a single crop product divided by the aggregated market value of all crop products derived from one primary crop. The WFs of livestock products are calculated considering the food, drinking water and service water consumed during the lifetime of the animal and based on so-called production trees showing the derivation of the different products per animal [
37,
38].
Virtual water trade (VWT, m3·year−1) between nations was calculated by multiplying international crop trade flows (CT, ton·year−1) by the crop-specific water footprints (WF, m3·ton−1) and similarly for processed crop products and livestock products. The gross virtual water import (GVWI) to a country is the sum of all volumes of water imported; the gross virtual water export (GVWE) from a country is the sum of all volumes of water exported; the net virtual water import (NVWI) of country (m3·year−1) equals GVWI minus GVWE. NVWI can have a positive sign (net import) or a negative sign (net export).
The water footprint of national consumption—defined as the total volume of freshwater used to produce the goods and services consumed by the people of the nation—is calculated following Hoekstra et al. [
36], whereby the internal water footprint of consumption is defined as the use of domestic water resources to produce the products consumed by the inhabitants of the country, and the external water footprint as the annual volume of water resources used in other countries to produce a products consumed by its inhabitants. The external water footprint is calculated by taking the total virtual water import into the country and subtracting the volume of virtual water exported to other countries as a result of re-export of imported products.
The calculation of national water scarcity, water dependency and water self-sufficiency was done per state, following the definitions of Hoekstra and Hung [
10]: a Water Scarcity Index (WSI) is calculated as the ratio of water withdrawal to availability, a Water Dependency Index (WDI) as the ratio of the Net Virtual Water Import (NVWI) into a country to the total national water appropriation and a Water Self-Sufficiency Index (WSSI) as 1-WDI.
3. Results
3.1. National Virtual Water Exports and Imports
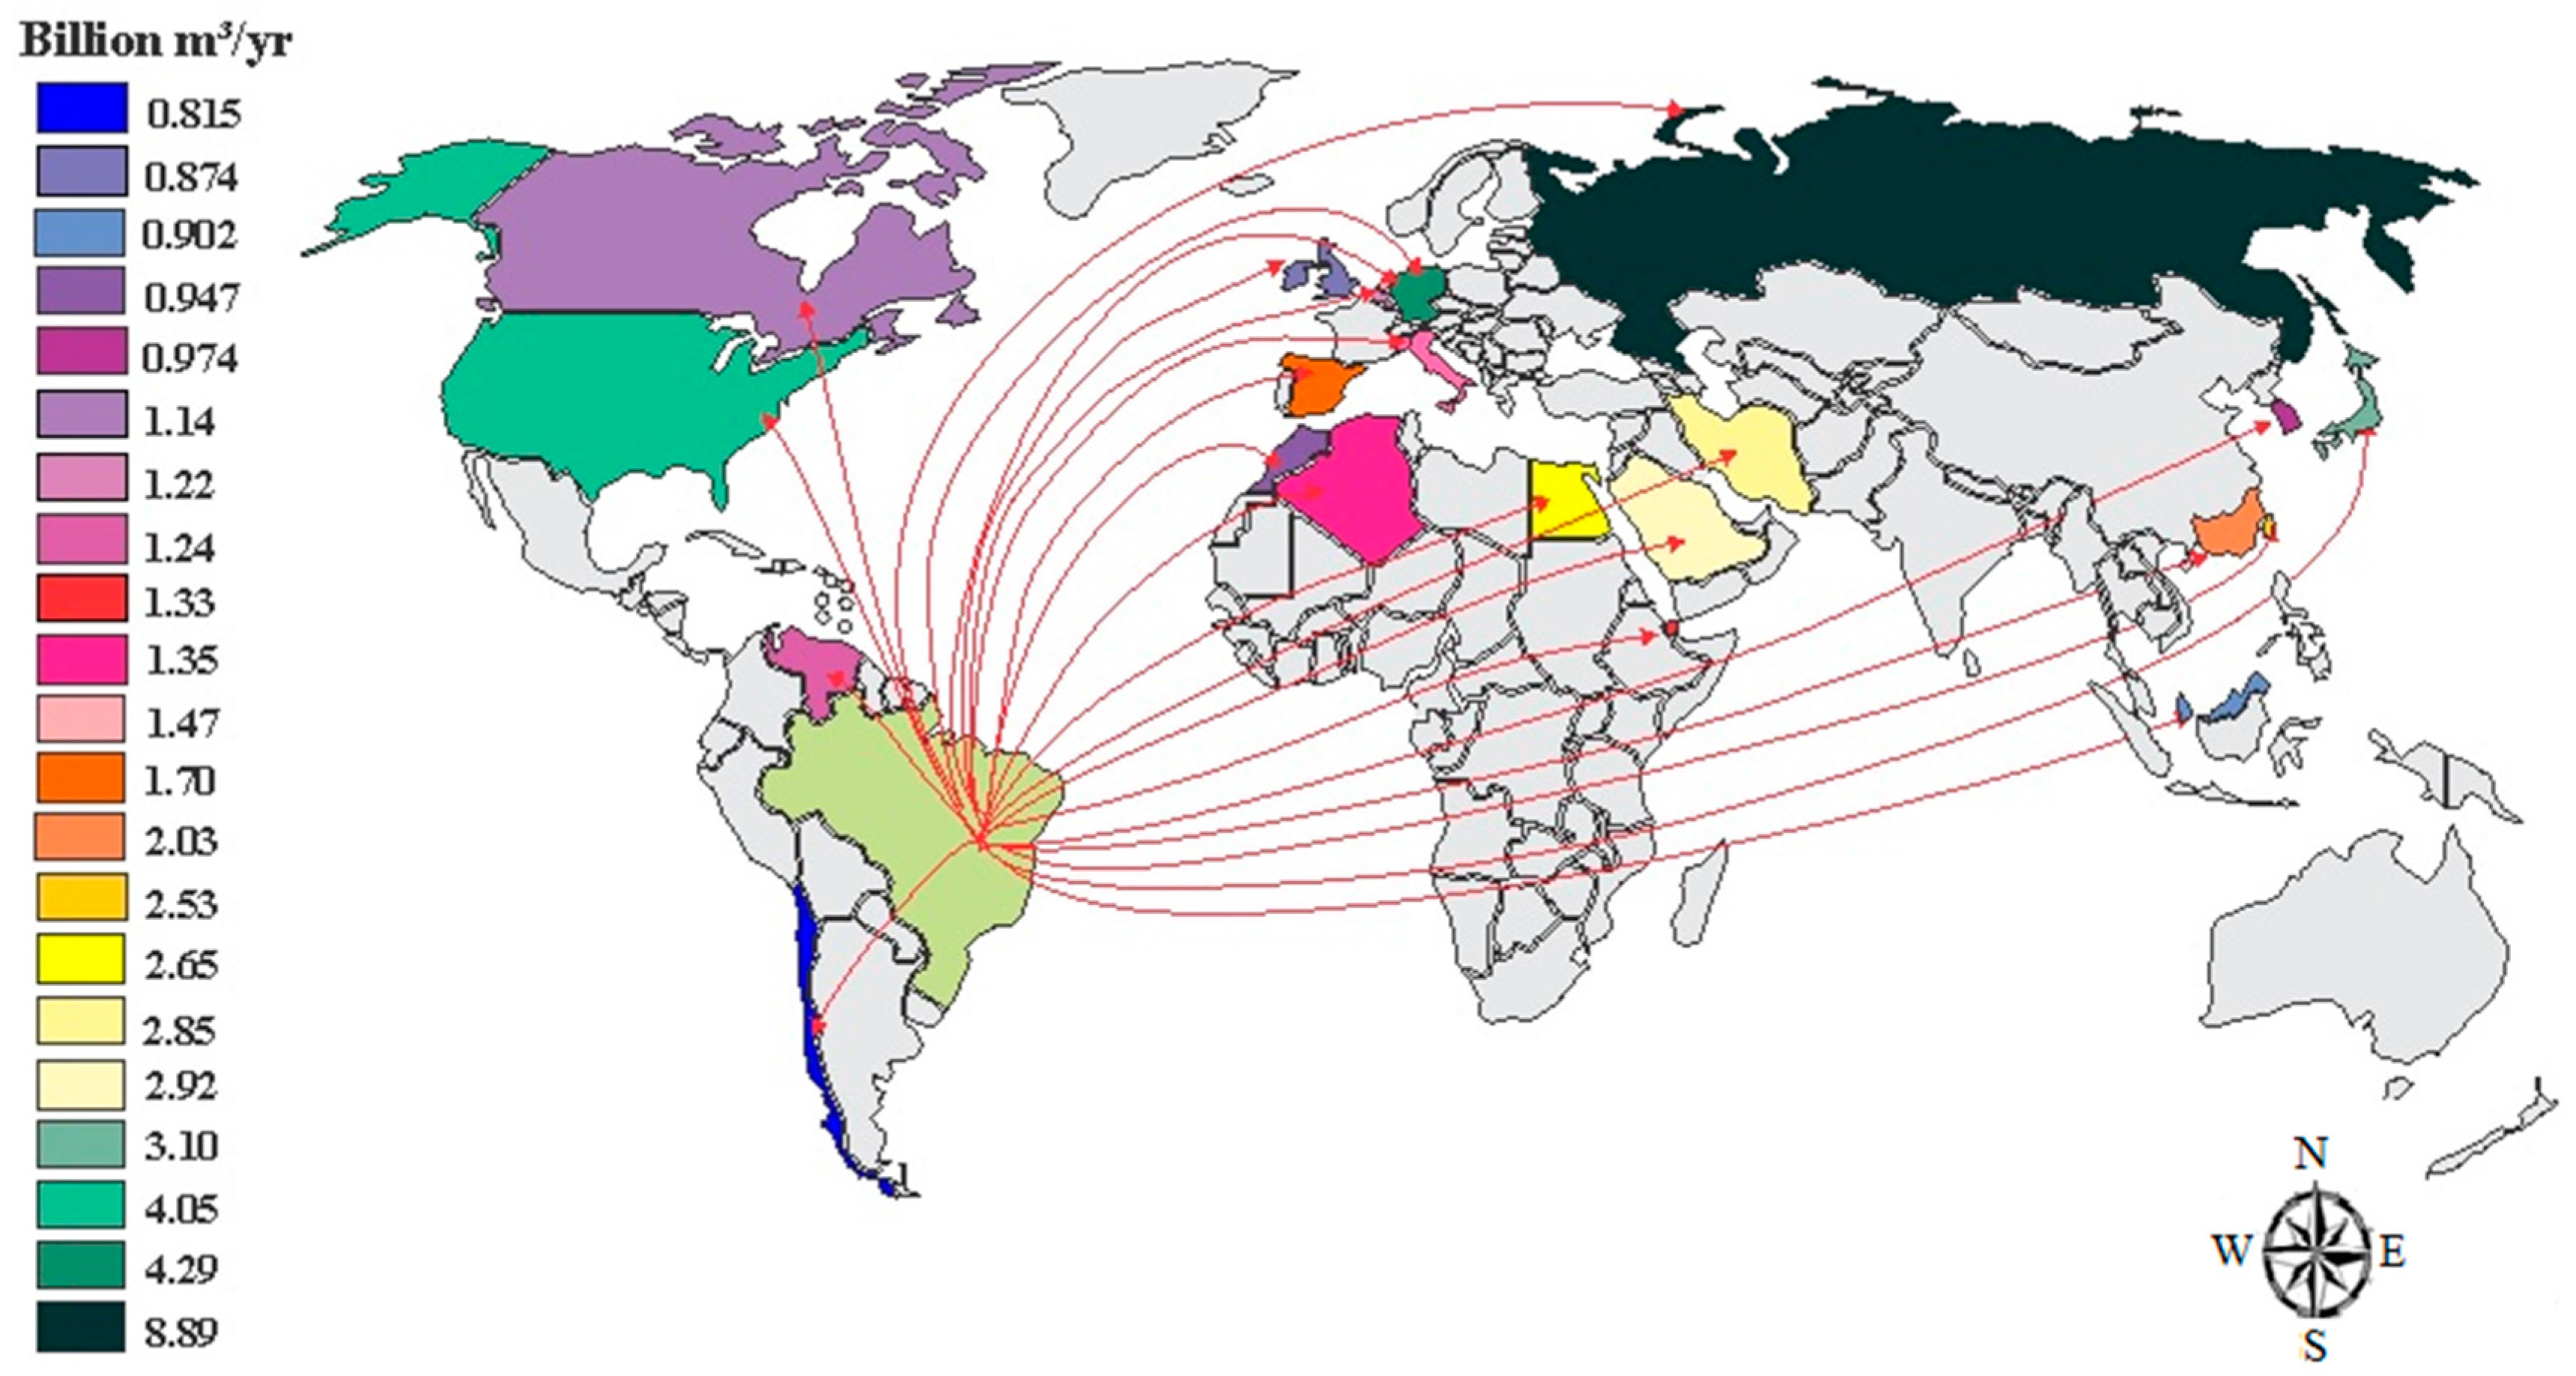
Brazil is currently one of the leading agricultural producers in the world. The agricultural production grew significantly in recent years due to technological advances in production. The virtual water exports from Brazil related to the export of agricultural products are presented in
Figure 2 for the major destination countries. The country has a gross virtual water export of 67.1 billion m
3/year and a net virtual water export of 54.8 billion m
3/year, mainly to Europe.
Europe is the largest importer of virtual water in agricultural commodities from Brazil, with a gross export of 27.7 billion m3/year, which corresponds to 41% of the total amount of gross virtual water export. For comparison, the Sobradinho Reservoir, located in the northeast region of Brazil, is the 12th largest artificial lake in the world and its storage capacity is 34.1 billion cubic meters.
Russia imports 8.9 billion m3/year of virtual water, mainly in the form of sugar, beef and pork (4.0, 2.9 and 1.2 billion m3/year, respectively). In Europe, Germany occupies the second position with 4.3 billion m3/year and Italy the third position with 2.5 billion m3/year. In Germany and Italy, coffee gives the largest contribution to these virtual water flows. The Asian continent also imports a large volume of virtual water embedded in traded commodities, with a total of 21.6 billion m3/year, corresponding to 32% of all virtual water exported from Brazil. The virtual water flow from Brazil to Japan amounts to 3.1 billion m3/year in total, with 1.5 billion m3/year related to coffee trade, 1.2 billion m3/year to chicken trade and 0.4 billion m3/year to maize trade. In Asia, Saudi Arabia occupies the second position with 2.9 billion m3/year of virtual water imported from Brazil.
The main commodities imported from Brazil are chicken (1.6 billion m3/year) and sugar (0.5 billion m3/year). After Europe and Asia, the Americas represent the third destination for Brazilian virtual water export, receiving an average virtual water volume of 9.3 billion m3/year. The United States of America and Canada import 4.1 and 1.1 billion m3/year of virtual water, respectively, while Venezuela imports 1.2 billion m3/year, mainly embedded in the commodities beef, chicken and sugar. Africa imported 8.2 billion m3/year of water in virtual form from Brazil, which corresponds to 12% of the total gross virtual water export from Brazil. Approximately 2.7 billion m3/year of water resources flowed in virtual form from Brazil to Egypt, mainly due to the trade in beef (51%) and sugar (33%).
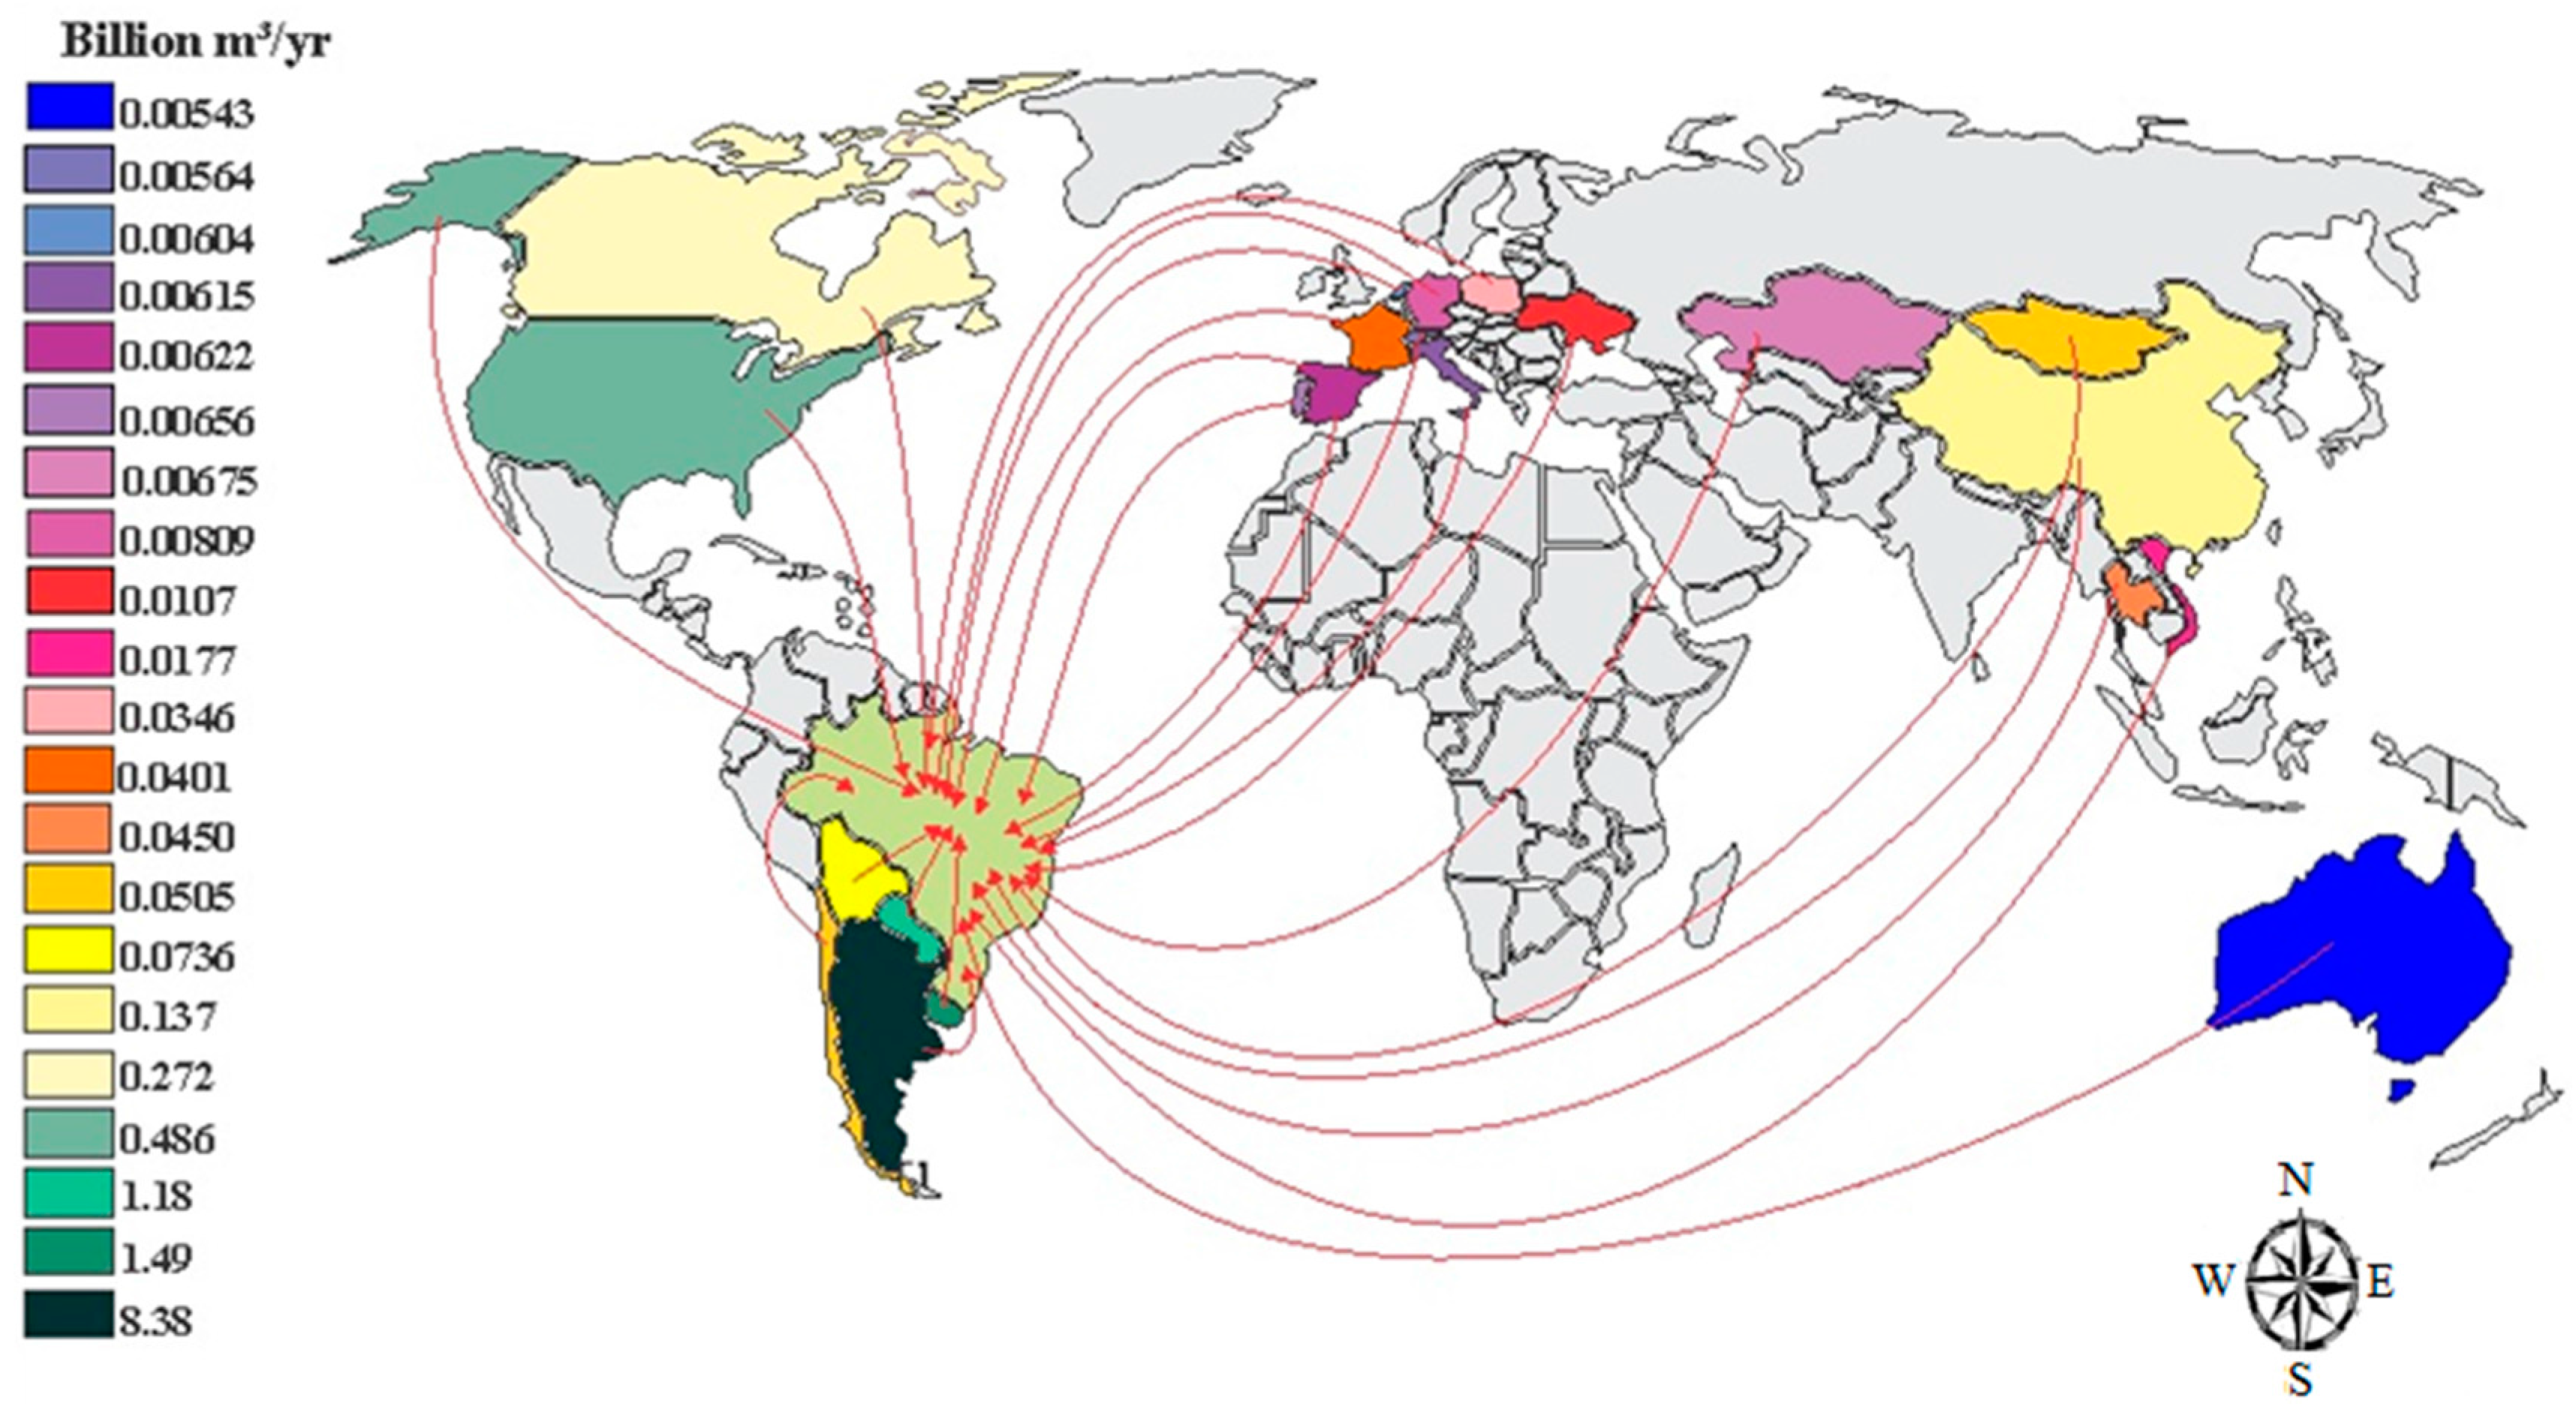
Figure 3 shows the international virtual water imports to Brazil related to trade in agricultural commodities during the period 1997–2012. These virtual water imports are much smaller than the exports. The average volume of water resources transferred to Brazil from other counties in virtual water form in this period was 12.3 billion m
3/year. Other South American countries exported 11.2 billion m
3/year of virtual water to Brazil, accounting for 91% of the total.
The exporting countries leading with regard to the export of virtual water to Brazil are Argentina, Uruguay and Paraguay, with 6.4, 1.5 and 1.2 billion m3/year, respectively. These countries exported mainly rice and beans (Argentina), rice and wheat (Uruguay) and maize, wheat and beef (Paraguay). North America contributed 0.76 billion m3/year (6.2%) to the gross virtual water transfer to Brazil. Asia, Europe, Oceania and Africa contributed even less to the virtual flows towards Brazil, with 1.6%, 0.99%, 0.17% and 0.11%, respectively. The largest virtual water flow from Asia to Brazil comes from China (0.14 billion m/year).
Table 1 shows the international virtual water trade of Brazil by type of commodity. The largest net virtual water export relates to the export of coffee, sugar, beef, chicken and maize. The largest net virtual water import relates to the import of wheat and rice. The total gross virtual water export amounts to 67.1 billion m
3/year, while the virtual water import is 12.3 billion m
3/year.
3.2. Water Footprint of National Consumption
We find an average (green plus blue) water footprint of agricultural products consumption in Brazil of 1619 m
3/person/year (
Table 2), which is a bit less than the figure of 1865 m
3/person/year given by Hoekstra and Mekonnen [
2]. This may be caused by the fact that the other study included all crops rather than a selection of the most important ones as in this study. The internal and external components of the total water footprint of consumption are 96% and 4%, respectively. This reflects a high self-sufficiency and low dependence on external water resources. Among the crops, large contributions to the total WF of consumption come from maize (180 m
3/person/year), rice (133 m
3/person/ton) and sugar (137 m
3/person/year). Beef gives the largest contribution of 336 kg/person/year (21%) to the total water footprint of national consumption.
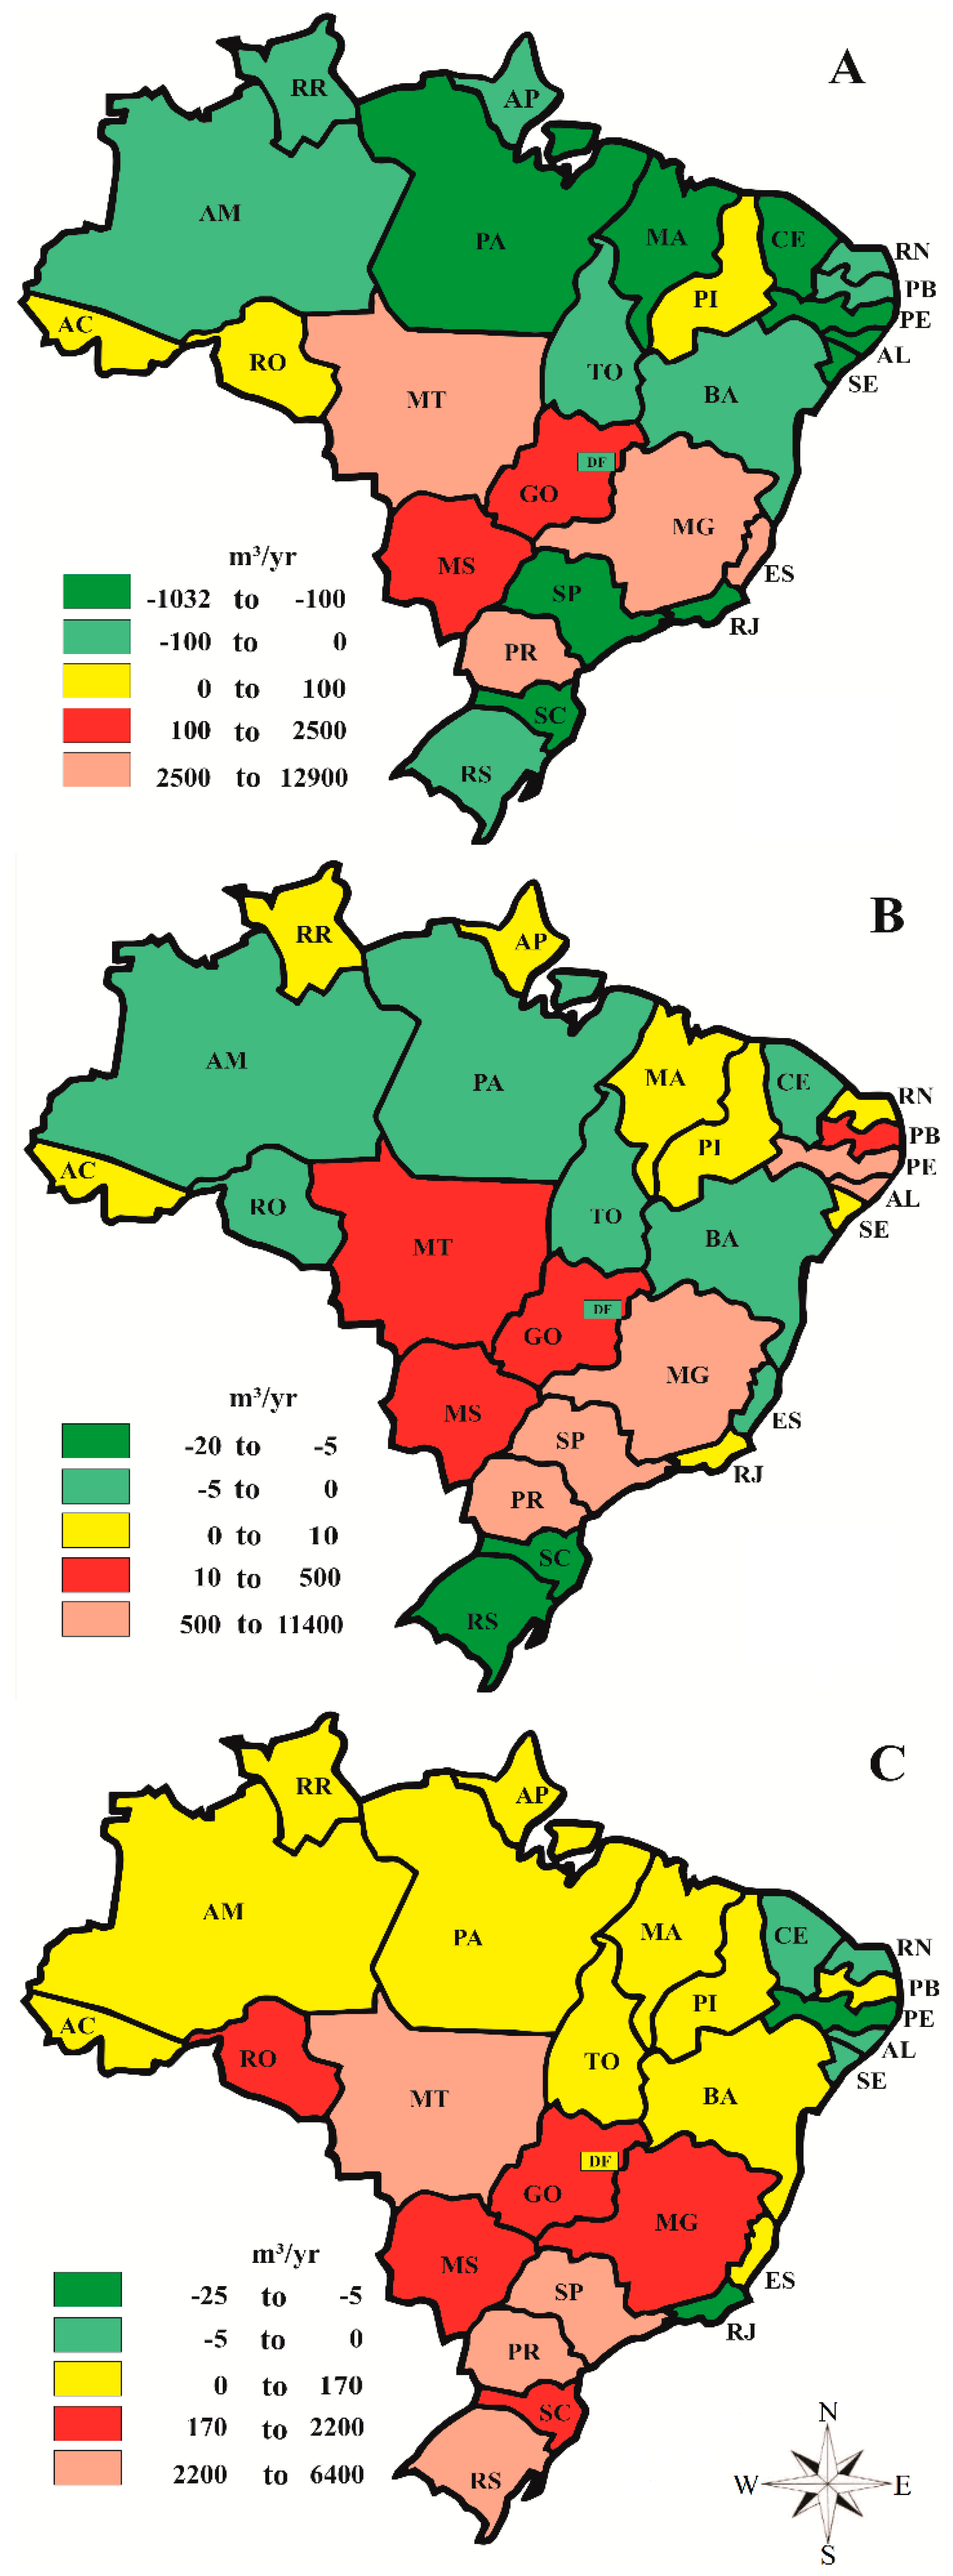
3.3. Net International Virtual Water Export per State
Figure 4 shows the net international virtual water export per state in Brazil during the period 1997–2012 for different commodity groups. The region in Brazil with the lowest water availability is the northeast region, which is connected to imports of agricultural commodities and thus the import of virtual water. The region with the highest water availability in the country, the north region, which is located in the Amazon (AM) state, does, on the contrary, not show a high virtual water export rate.
The central-west region, which contains two major biomes of Brazil, the Pantanal and the Cerrado, has substantial virtual water exports. The southeast region shows large virtual water exports as well, mainly related to the export of sugar. The south region is recognized as one of the most humid regions in the country and shows a high volume of virtual water export embedded in exported livestock products. However, this region imports virtual water embedded in crop products, except the Paraná (PA) state, which is a large exporter of virtual water in these products.
The water scarcity index for Brazil as a whole is 5%, which masks the high water scarcity that occurs in several states (
Table 3). The WDI for Brazil is 13%, which again masks the fact that several states substantially depend on external water resources. The north region of Brazil, which includes the sparsely populated Amazon rainforest, has very high levels of water availability, with a mean annual rainfall of 2272 mm [
32]. We find a mean water scarcity index (WSI) value in this region of less than 1%.
The states in the northeast region have very high WSI values, with a mean value of 76.7%. This region is extremely vulnerable to climatic variations where the periodicity of the droughts especially affects subsistence agriculture in the semiarid part of the region [
32]. The region inhabits extensive livestock, low-yield farming and the cultivation of subsistence crops on small farms. On the other hand, the states of Piauí (PI) and Maranhão (MA) have relatively low levels of WSI due to the surface water available in these states.
The central-west region presents low WSI values, ranging from 1% to 4%, except for Distrito Federal (DF) with a value exceeding 100%. The central-west region is almost entirely covered by the Cerrado biome. It is occupied by medium and large farming enterprises due to the high amount of water available mainly in the states of Goias (GO), Mato Grosso (MT) and Mato Grosso do Sul (MS).
The large growth of agriculture in this area started with the increasing cultivation of soybeans. Later, other crops came, such as maize and beans. Recently, sugarcane began to expand throughout the region. However, Brasília (DF) has been experiencing high water scarcity for several decades. The considerable population growth in DF has led to peripheral settlement expansion, which in turn has resulted in the increase of domestic water consumption. The southeast region of Brazil has high mean values of WSI, due to the high population densities of the states of São Paulo (SP) and Rio de Janeiro (RJ). This mean WSI value for all three states of South Brazil (Parana—PA, Santa Catarina—SC, and Rio Grande do Sul—RS) comes to 11%, and, therefore, is the lowest among all regions in the country. The south region has the lowest WDI of all the Brazilian states.
4. Discussion
The finding that Brazil is a substantial net virtual water exporter related to agricultural trade corresponds to previous studies, but the figures differ across the studies due to a variety of reasons, such as the scope of agricultural products included, the period considered, and the models and data sources used. Hoekstra and Hung [
10], who excluded animal products, report a gross virtual water export of 32 billion m
3·year
−1 and a gross import of 23 billion m
3·year
−1. Zimmer and Renault [
39], including both crop and animal products, reported a gross virtual water export of 75 billion m
3·year
−1 and a gross import of 19 billion m
3·year
−1. Chapagain and Hoekstra [
11], also including both crop and animal products, found a gross virtual water export of 66 billion m
3·year
−1 and a gross import of 19 billion m
3·year
−1. In the most comprehensive assessment to date, Hoekstra and Mekonnen [
2] report a (green plus blue) virtual water export from Brazil related to the export of agricultural products of 107 billion m
3·year
−1, a (green plus blue) virtual water import related to the import of agricultural products of 32 billion m
3·year
−1 and a net (green plus blue) virtual water export from Brazil related to trade in agricultural products of 75 billion m
3·year
−1. Due to the numerous differences in the various studies, it is difficult to attribute different outcomes to specific reasons. Unlike previous studies, which were all global in nature and made use of global datasets, the current study used national data provided by government departments (IBGE and AliceWeb). We also made use of the latest available data (for the period 1997–2012), while previous global studies used older data sets. Estimated water footprints include uncertainties in all studies. Silva et al. [
40] compared the sugarcane water footprint estimates derived from modeling with the CropWat model and those obtained from field studies and found that Mekonnen and Hoekstra [
41] significantly overestimated the water footprints of sugarcane grown in rain-fed systems in Brazil.
The study shows that the water scarcity, the water footprint of crops and the production for export greatly vary between regions within Brazil. This is relevant when assessing the local impacts of virtual water exports. As Flach et al. [
42] recently show, the virtual water exports related to the export of sugarcane from Brazil to China are disproportionally less associated with areas with higher water stress when compared to those related to export to the European Union(EU), due to the EU’s much higher reliance on sugarcane from water-scarce areas in northeast Brazil. They also show that 17% of the total virtual water export related to Brazilian sugarcane export occurs in regions with medium and high water stress, while this figure drops to 8% for soybean exports. In the current study we have not linked the virtual water export per state to specific trade partners, but this could generate additionally relevant insight as shown by Flach et al. [
42].
The current study has been limited to a consideration of green and blue water footprints and virtual water trade flows, excluding grey water footprints and virtual water trade flows. Water pollution, however, is an additional relevant concern in Brazilian agriculture [
27]. In our presentation we have not explicitly distinguished between green and blue water consumption, as was done in some other studies [
2,
27], which would further enrich the analysis, particularly when analyzing the results in terms of local environmental impacts.
5. Conclusions
We find that beef gives the largest contribution (21%) to the total water footprint of the national consumption of agricultural commodities in Brazil. We further find that Brazil is self-sufficient in food production, with a gross virtual water export of 67.1 billion m3/year and a net virtual water export of 54.8 billion m3/year, mainly to Europe, which accounts for 41% of the total gross virtual water exports. The export of virtual water is almost twice the volume of the Sobradinho Reservoir, the largest artificial lake in Brazil and the 12th largest artificial lake in the world, with a storage capacity of 34.1 billion cubic meters. The average (green plus blue) water footprint of Brazilian consumption of agricultural products is found to be 1619 m3/person/year. The north region of Brazil has the highest water availability, but does not show high export rates of virtual water embedded in agricultural products. However, the northeast region, with low water availability, shows substantial import of agricultural commodities, as expected. The water resources transferred from other countries in virtual water form to Brazil make up 12.3 billion m3/year. Other South American countries export 11.2 billion m3/year to Brazil, accounting for 91% of the total. The leading virtual water-exporting countries to Brazil are Argentina, Uruguay and Paraguay, with 6.4, 1.5 and 1.2 billion m3/year, respectively, mainly through trade in rice, beans, wheat, maize, and beef.


 ,
, 
