Abstract
Industrial tomatoes are cultivated in about 4000 ha of the Pinios river basin (central Greece), providing significant income to the farmers. In this study, the water footprint (WF) of industrial tomatoes between planting and harvest was estimated in 24 different farms for three consecutive years. The selected farms were representative of the main agro-climatic zones and soil textural classes within the river basin. Green, blue and grey WF calculations were based on datasets of the experimental plots for each farm, including irrigation water volume, meteorological, soil, and crop yield data. The results showed that the WF of tomatoes ranged from 37 to 131 m3 water/ton tomatoes with an average of 61 m3/ton. The WF variation depended mainly on crop yield, local agro-climatic and soil conditions. The green, blue, and grey WF components averaged 13, 27 and 21 m3/ton, respectively. The results reveal the importance of WF in understanding how tomato production relates to the sustainable use of freshwater and pollution at local level.
1. Introduction
Agriculture is the most significant water user in the European Union, consuming up to 80% of the total water in some parts of the Mediterranean region [1]. In Greece, irrigation of crops accounts for almost all agricultural water use and in some cases, has reached unsustainable levels [2]. In the catchment of the Pinios River, which is the most important region of Greek agricultural production, agriculture represents 90%–95% of the annual water demand of the area [3]. Irrigated land (200,000 ha) covers half of the total cultivated area and corresponds to about 18% of irrigated land in the country. Irrigation water is derived mostly from groundwater sources which have been over-exploited for many years. This has led to a lower groundwater table, costly pumping from bigger depths and enhanced saline water intrusion in coastal areas [4]. Cotton is the main crop of the region, covering ~150,000 ha, and is followed by corn, alfalfa, and tomatoes. Recently, farmers have become more sensitive to environmental problems being caused by agricultural practices including water scarcity issues. Due to the high economic value of industrial tomatoes, farmers are interested in adopting progressive production systems, such as the integrated management system promoted by the Greek Ministry of Rural Development and Food. Industrial tomatoes are an important agricultural crop in Greece covering an area of ~15,000 ha that corresponds to a production of 1 million tones/year. In the Pinios River basin, industrial tomatoes cover an area of ~4000 ha with an annual irrigation demand of ~24 billion m3 of irrigation water.
The water footprint (WF) is one of the analytical tools employed in order to understand the impact of tomato production on the sustainable use of freshwater and pollution. The WF is an indicator of freshwater use that examines not only the direct water use of a consumer or producer, but also the indirect water use. In agricultural production, the WF can be regarded as a comprehensive indicator of fresh water resources appropriation next to the traditional and restricted measure of water withdrawal. WF could be used to identify water-related hot-spots and to guide actions for better water management, including its use and allocation by supporting decisions on different alternative processes and products [5,6,7,8,9]. The WF of a product is the volume of freshwater used to produce the product measured over the full supply chain [5]. It is a multidimensional indicator of water consumption volumes by source and polluted volumes by type of pollution; all components of the total WF are specified geographically and temporally. The blue water footprint (WFblue) refers to consumption of surface and groundwater resources along the supply chain of a product. The green water footprint (WFgreen) refers to consumption of rainwater resources in so far as it does not become run-off. The grey water footprint (WFgrey) refers to pollution and is defined as the volume of freshwater that is required to assimilate the load of pollutants given natural background concentrations and existing ambient water quality standards. As a tool, a water footprint assessment provides insight; it does not tell people “what to do”, rather it helps people to understand what can be done.
Estimations of tomato WF products across the life cycle vary depending on the determination methods and specific characteristics of each study. According to Life Cycle Assessment (LCA)-based approaches, the WFblue of the tomato supply chain in Australia ranges from 5 to 50 litres (L) per kilogram (kg) of fresh product [10], while the freshwater use of tomatoes produced in unheated greenhouses in Morocco and consumed in France equals 28 L of water per kg of tomatoes [11]. Although many WF estimations refer to the full supply chain, most of the water use for tomato products occurred in the agricultural stage of the life cycle [12]. In the Mediterranean region, tomato cultivation occurs in the hot and dry summer conditions and WF values have significant differences among different regions and countries. In Italy, for example, WF values have been reported to vary from 37 to 137 m3/ton for WFblue, from 26 to 51 m3/ton for WFgreen and from 19 to 31 m3/ton for WFgrey [13]. In Spain, the percentages of WF components to the total WF reported by Chico et al. [14] vary from 0.3% to 3% for WFgreen, from 4% to 68% for WFblue and from 12% to 68% for WFgrey. However, WF reliability and robustness is affected by the lack of proper data that can bias the results [15,16,17] and increase uncertainty. In addition, only 46% of studies relevant to agricultural production include WFgrey [18]. In many of those studies, the quantification of fertilizer impact on fresh water pollution relies on simplified assumptions, i.e., they use a constant fraction of 10% of the N application rate which is subject to leaching and run-off [19,20], or 15% in the case of Manzardo et al. [21]. This approach, however, inherently implies that reduction of fertilizer inputs is the only management option to minimize pollution. The application of high quantities of nitrogen, without taking into account between-farm differences in soil properties and the period of greater nitrogen demand, leads to decrease of nitrogen use efficiency (NUE). The tomato crop generally does not exceed 50% in NUE and generates a substantial increase of mineral nitrogen remaining in the soil that could be subject to leaching [22].
Nowadays, the focus at field level is to decrease the field consumptive water footprint [5], increasing thus the water productivity [23,24].
Studies on WF estimation of industrial tomato cultivation in Greece are missing. The purpose of the present study was to estimate the WF of industrial tomatoes at the field level in representative areas of Thessaly plain and to explore possible correlations with individual soil properties that regulate soil water retention capacity. Another objective was to compare the WF values obtained by the estimation of WFgrey component by using the constant leaching fraction approach (10% of applied fertilizer N) with the technique of soil samplings for the determinations of real N losses.
2. Material and Methods
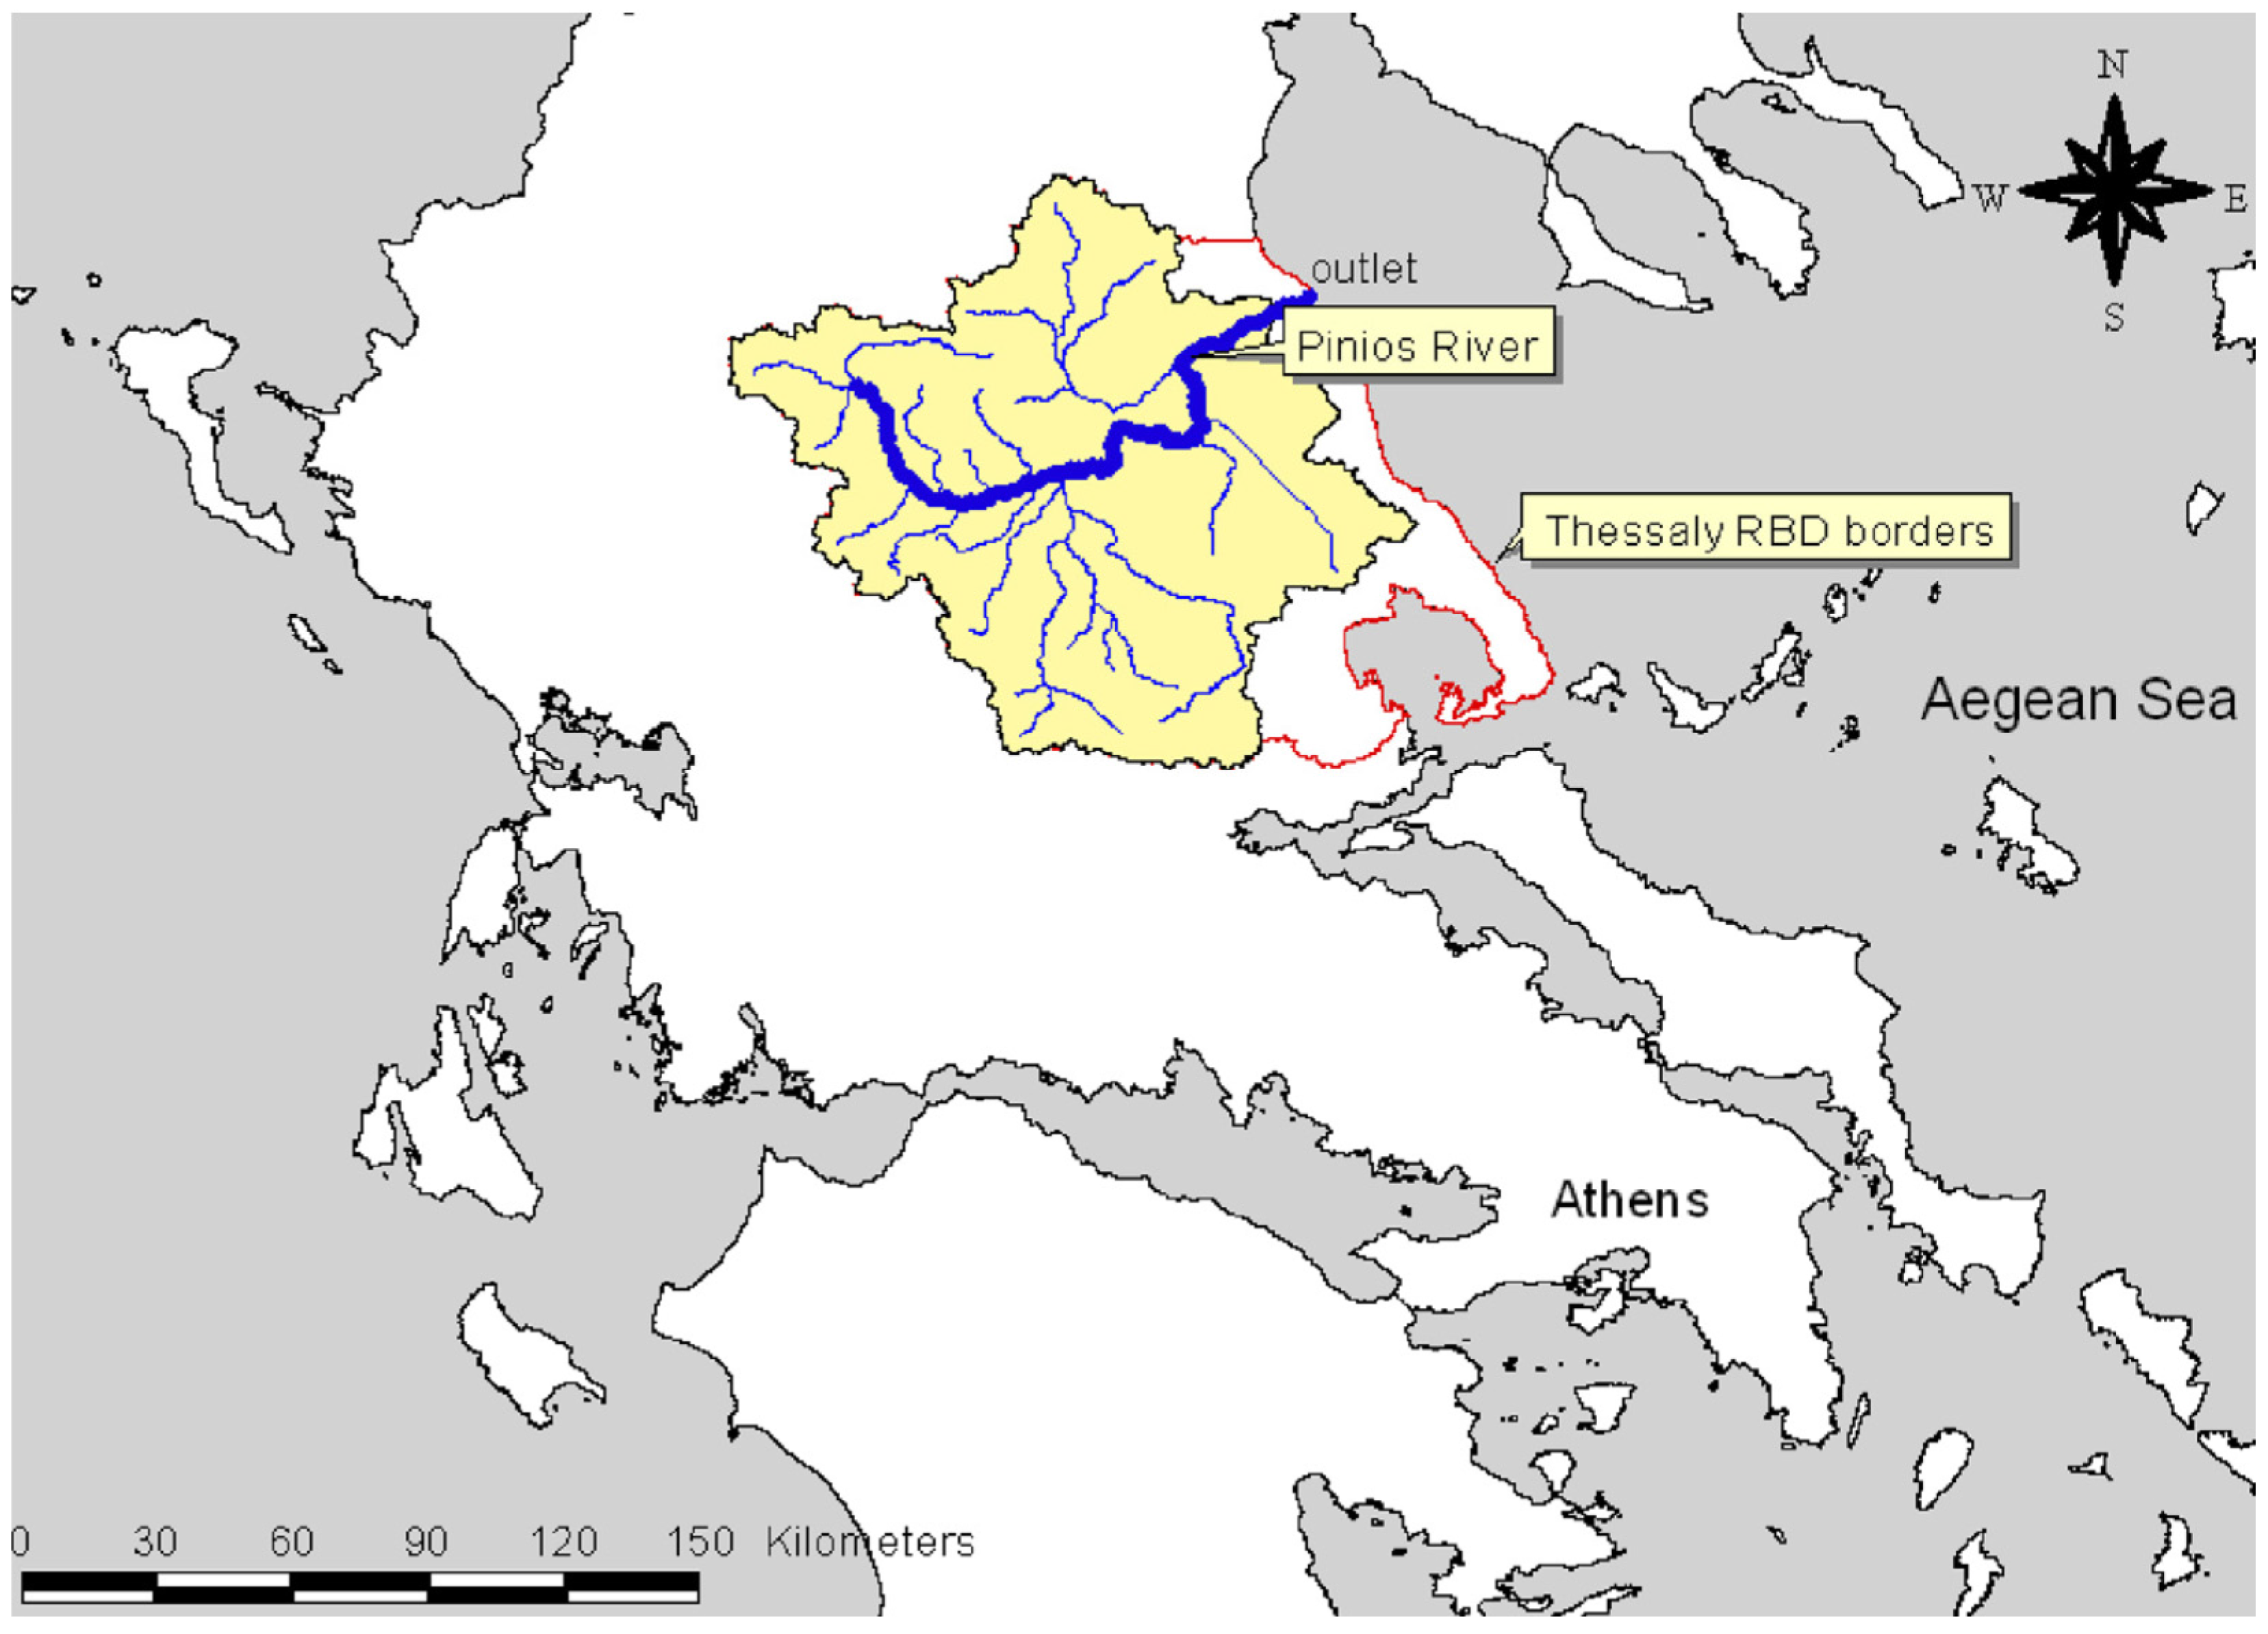
The study area (10,600 km2) was in the Thessaly plain of central Greece at the Pinios river basin (Figure 1). The catchment is the most extensive agricultural area in Greece with fertile soils but very dry climate during the summer. The unfavorable climatic conditions adversely affect both the natural vegetation and the agricultural production resulting in irrigation cutbacks; over-exploitation of groundwater and significant losses of crop yields [25].
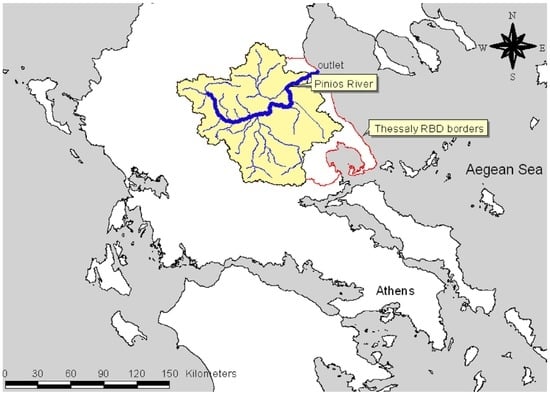
Figure 1.
Study area of the research.
For the research needs, 24 farms were selected in representative flat areas cultivated with industrial tomatoes in 2013, 2014 and 2015 growing seasons. Some properties of the soils under study, cultivated following the protocol of the integrated management system [26], are presented in Table 1. The soils are classified as Entisols, Inceptisols, and Vertisols. Clay content ranged widely from 13% to 66%, pH was neutral to slightly alkaline (6.9–8.4) and above the optimum recommended level of 5.5–6.8 for tomato cultivation, electrical conductivity (EC) ranged from 132 to 549 μS/cm, the amount of calcium carbonate was small (0%–7.9%) and organic matter content was very low to medium (0.7%–2.4%) [27].

Table 1.
Selected soil properties of the experimental fields.
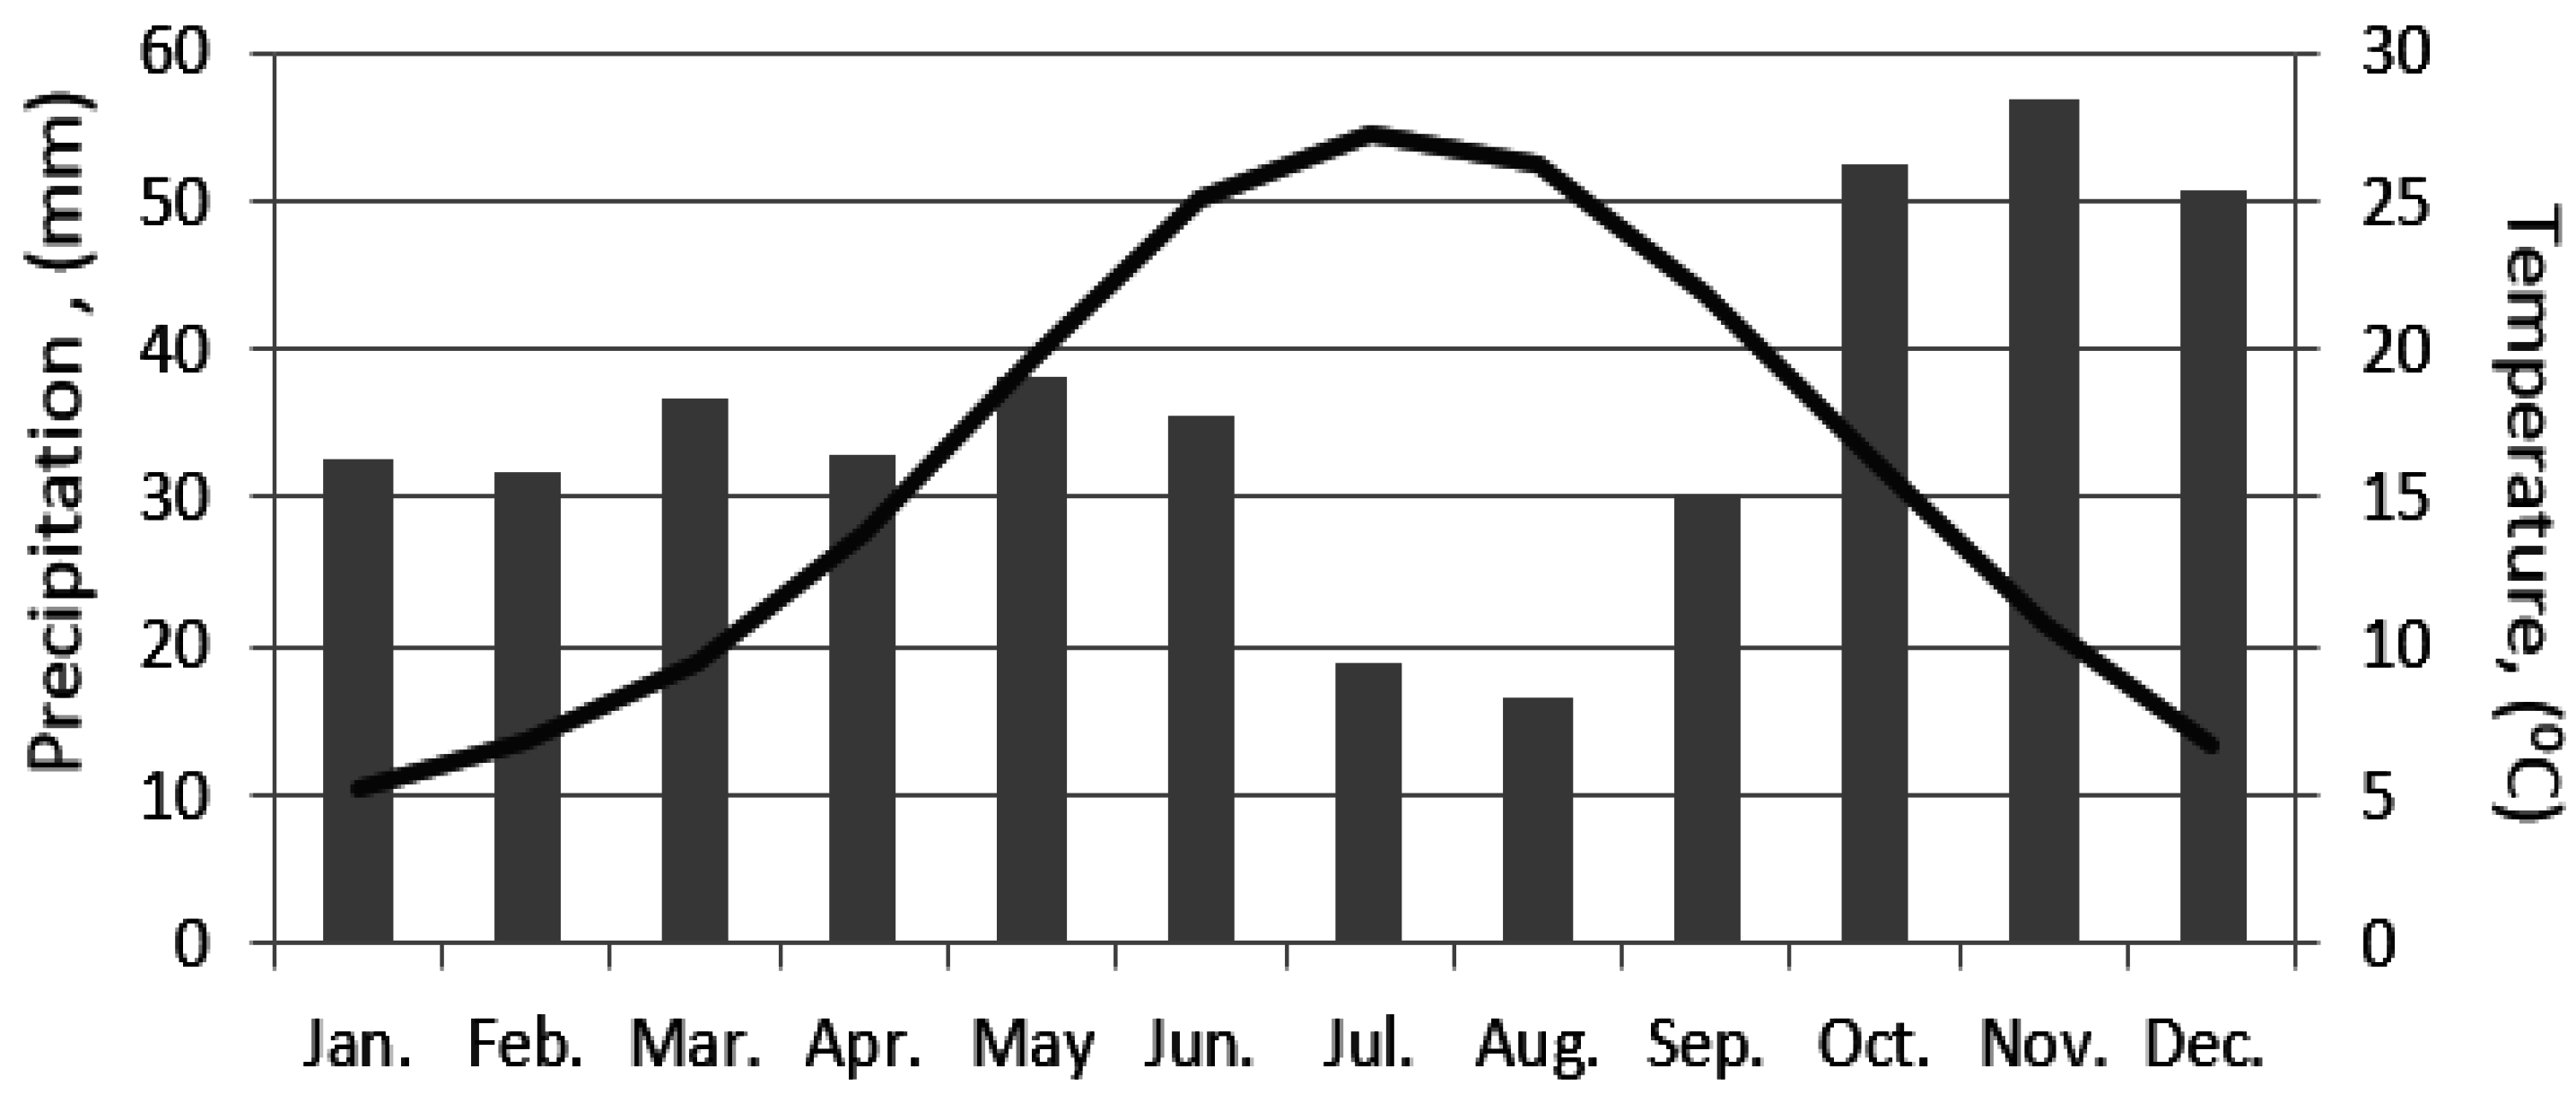
The climate is continental at the western and central side of Thessaly and Mediterranean at the eastern side. Winters are cold and wet and summers are hot and dry with a large temperature difference between the two seasons. Mean annual precipitation over the Thessaly region is about 700 mm and it is distributed unevenly in space and time. The mean annual precipitation varies from about 400 mm in the central plain area to more than 1850 mm at the western mountain peaks. Generally, rainfall is rare from June to August. The mountain areas receive significant amounts of snow during the winter months. The mean annual temperature and mean monthly rainfall of the broader area for the period 2013–2015 are presented in Figure 2.
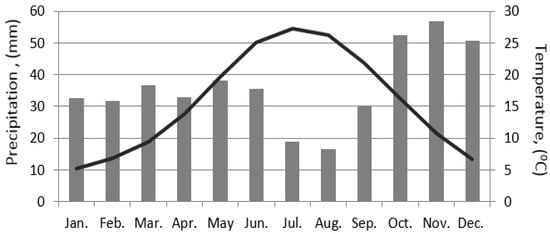
Figure 2.
Mean monthly temperature and rainfall during the period 2013 to 2015 in the study area.
Green, blue and grey WF of 1000 kg of tomato fruit produced in the three growing periods were determined by the method described by Hoekstra et al. [5]. The study focuses on the production stage from sowing to harvest of the integrated management system. The total water footprint during the growing season in water volume per mass (m3/ton) is calculated as the sum of the green, blue and grey components:
WFproc = WFproc, green + WFproc, blue + WFproc, grey (volume/mass)
The green and blue component of the water footprint (WFproc, green, m3/ton) was calculated as the green and blue component in crop water use (CWUgreen, m3/ha, CWUblue, m3/ha) divided by the tomato yield (Y, ton/ha). The green and blue component (WFproc, m3/ton) are calculated as follows:
WFgreen = CWUgreen/Y (m3/ton)
WFblue = CWUblue/Y (m3/ton)
The green and blue components of crop water use (CWU, m3/ha) were calculated by accumulation of daily evapotranspiration (ET, mm/day) over the whole growing season:
ETgreen represents green water evapotranspiration and ETblue blue water evapotranspiration. The factor 10 was used to convert water depths in millimeters into water volumes per land surface in m3/ha. The summation is done over the period from the day of planting (day 1) to the day of harvest. The green and blue water evapotranspiration has been estimated by using the CROPWAT model developed by the Food and Agriculture Organization of the United Nations [29] which is based on the method described by Allen et al. [30]. Within this model, the ‘irrigation schedule option’ was applied that includes a dynamic soil water balance and keeps track of the soil moisture content over time. The actual evapotranspiration (Eta) during the entire growing season is partly fulfilled by the rain and partly by irrigation. The blue water evapotranspiration (ETblue) is equal to the ‘total net irrigation’ as specified in the model. The green water evapotranspiration (ETgreen) of the tomato crop is equal to the difference between the total actual evapotranspiration and the net irrigation. The calculations have been done using climatic data from meteorological stations located near the experimental fields and irrigation volumes data from hydrometers established in each field. Tomato fruits were harvested by hand in three different plots of each farm and the yield (kg tomatoes/ha) was estimated just before harvest (between the middle of August and the end of September). Tomato samples were transferred to the laboratory and air dried at 65 °C to determine water content.
The grey water footprint of the cultivation was estimated as the volume of freshwater that is required to assimilate the load of pollutants based on existing ambient water quality standards.
As it is generally the case, the production of tomato concerns more than one form of pollution. In this study, the grey water footprint was estimated only for nitrogen (N). The total volume of water required to assimilate a ton of N was calculated considering the surplus N negligible in the selected farms. The natural concentration of N in the receiving water body was assumed to be negligible whereas the maximum allowable concentration in the ambient water system was considered 50 mg NO3-/L (EU Nitrates Directive, 91/676/EEC). This value is very close to the limit for drinking water set by the Environmental Protection Agency [31], i.e., 10 mgN/L equating to ~45 mg NO3/L. In this study, the standard of 10 mg/L was used to calculate the water volume required for the dilution of the N loads to acceptable levels.
The final equation that calculates the grey WF was:
where:
- ■
- WFgrey, the grey WF in m3/ton,
- ■
- Excess N, the quantity of N that escapes from the tomato rhizosphere in kg/ha,
- ■
- Cmax, the maximum allowable N concentration,
- ■
- Cnat, the N concentration of the environment in kg/m3 and,
- ■
- Y, the crop yield in ton/ha.
Nitrogen losses were estimated by two methods: (a) by assuming that 10% of the total nitrogen applied was lost [17] for the 24 farms studied; and (b) at farm level by NO3-N determination through soil analysis in the effective rooting depth (60–90 cm). The second method was used for only the nine farms in 2015 in order to compare the estimated values of N losses to the constant leaching fraction approach.
Different methods have been employed to assess N leaching in unsaturated soils [32,33,34,35]. The soil core method used in this study is simple, relatively inexpensive, widely used and applicable to most soils [36]. The amount of nitrate-N that remains below root zone at 60–90 cm depth after tomato harvest was estimated in each experimental field. Potential nitrate losses (kg·N/ha) were calculated as the difference in nitrate-N concentration between harvest and before N fertilization in the same depth of 60–90 cm. It is assumed that the surplus N below the root zone will reach the aquifer by leaching during next fall and winter rainfall. Soil analysis was performed according to Page et al. [11]. Statistical analysis was performed by softwear package SPSS.
3. Results and Discussion
The estimated WF and its components, as estimated by the constant leaching fraction of 10% N applied, are presented in Table 2. Total WF for industrial tomato cultivations ranged widely from about 37 to 131 m3 water/ton with an average of 61 m3/ton tomato. WFgreen ranged from 2 to 50 m3/ton with an average 13 m3/ton and WFblue from 6 to 68 m3/ton with an average 27 m3/ton. WFgrey ranged from 10.2 to 42.7 m3/ton with an average 21 m3/ton.
Table 2.
Tomato yield, irrigation volumes and values of estimated water footprint components.
WF values of this study are comparable to those reported in other studies carried out in the Mediterranean region. For example, Chapagain and Orr [37] reported 14 and 60 m3/ton and Aldaya and Llamas [38] reported 6 and 113 m3/ton for WFgreen and WFblue, respectively, in Spain. In Italy, Aldaya et al. [39] reported 35 and 60 m3/ton for green and blue WF, respectively. Proportionally, Chico et al. [14] estimated the WFgrey between 10 and 68 m3/ton with an average of 35 m3/ton for industrial tomatoes cultivated in different regions of Spain while Aldaya et al. [39] estimated the WFgrey between 19 and 31 m3/ton in Italy. Differences in estimated WF values of tomato cultivation among studies reflect the different agro-climatic conditions, the overall management practices that affect yields and the assumptions adopted by the models used.
WF values estimated in this study are significantly different from those reported by Mekonmen and Hoekstra [19] as global averages for WFtotal (214 m3/ton), WFgreen (108 m3/ton), WFblue (63 m3/ton), and WFgrey (43 m3/ton). The WFgreen component of our study presents the most significant deviation from the global average, indicating the different growing conditions of tomato cultivation in Mediterranean dry and hot summer where rainfall is rare.
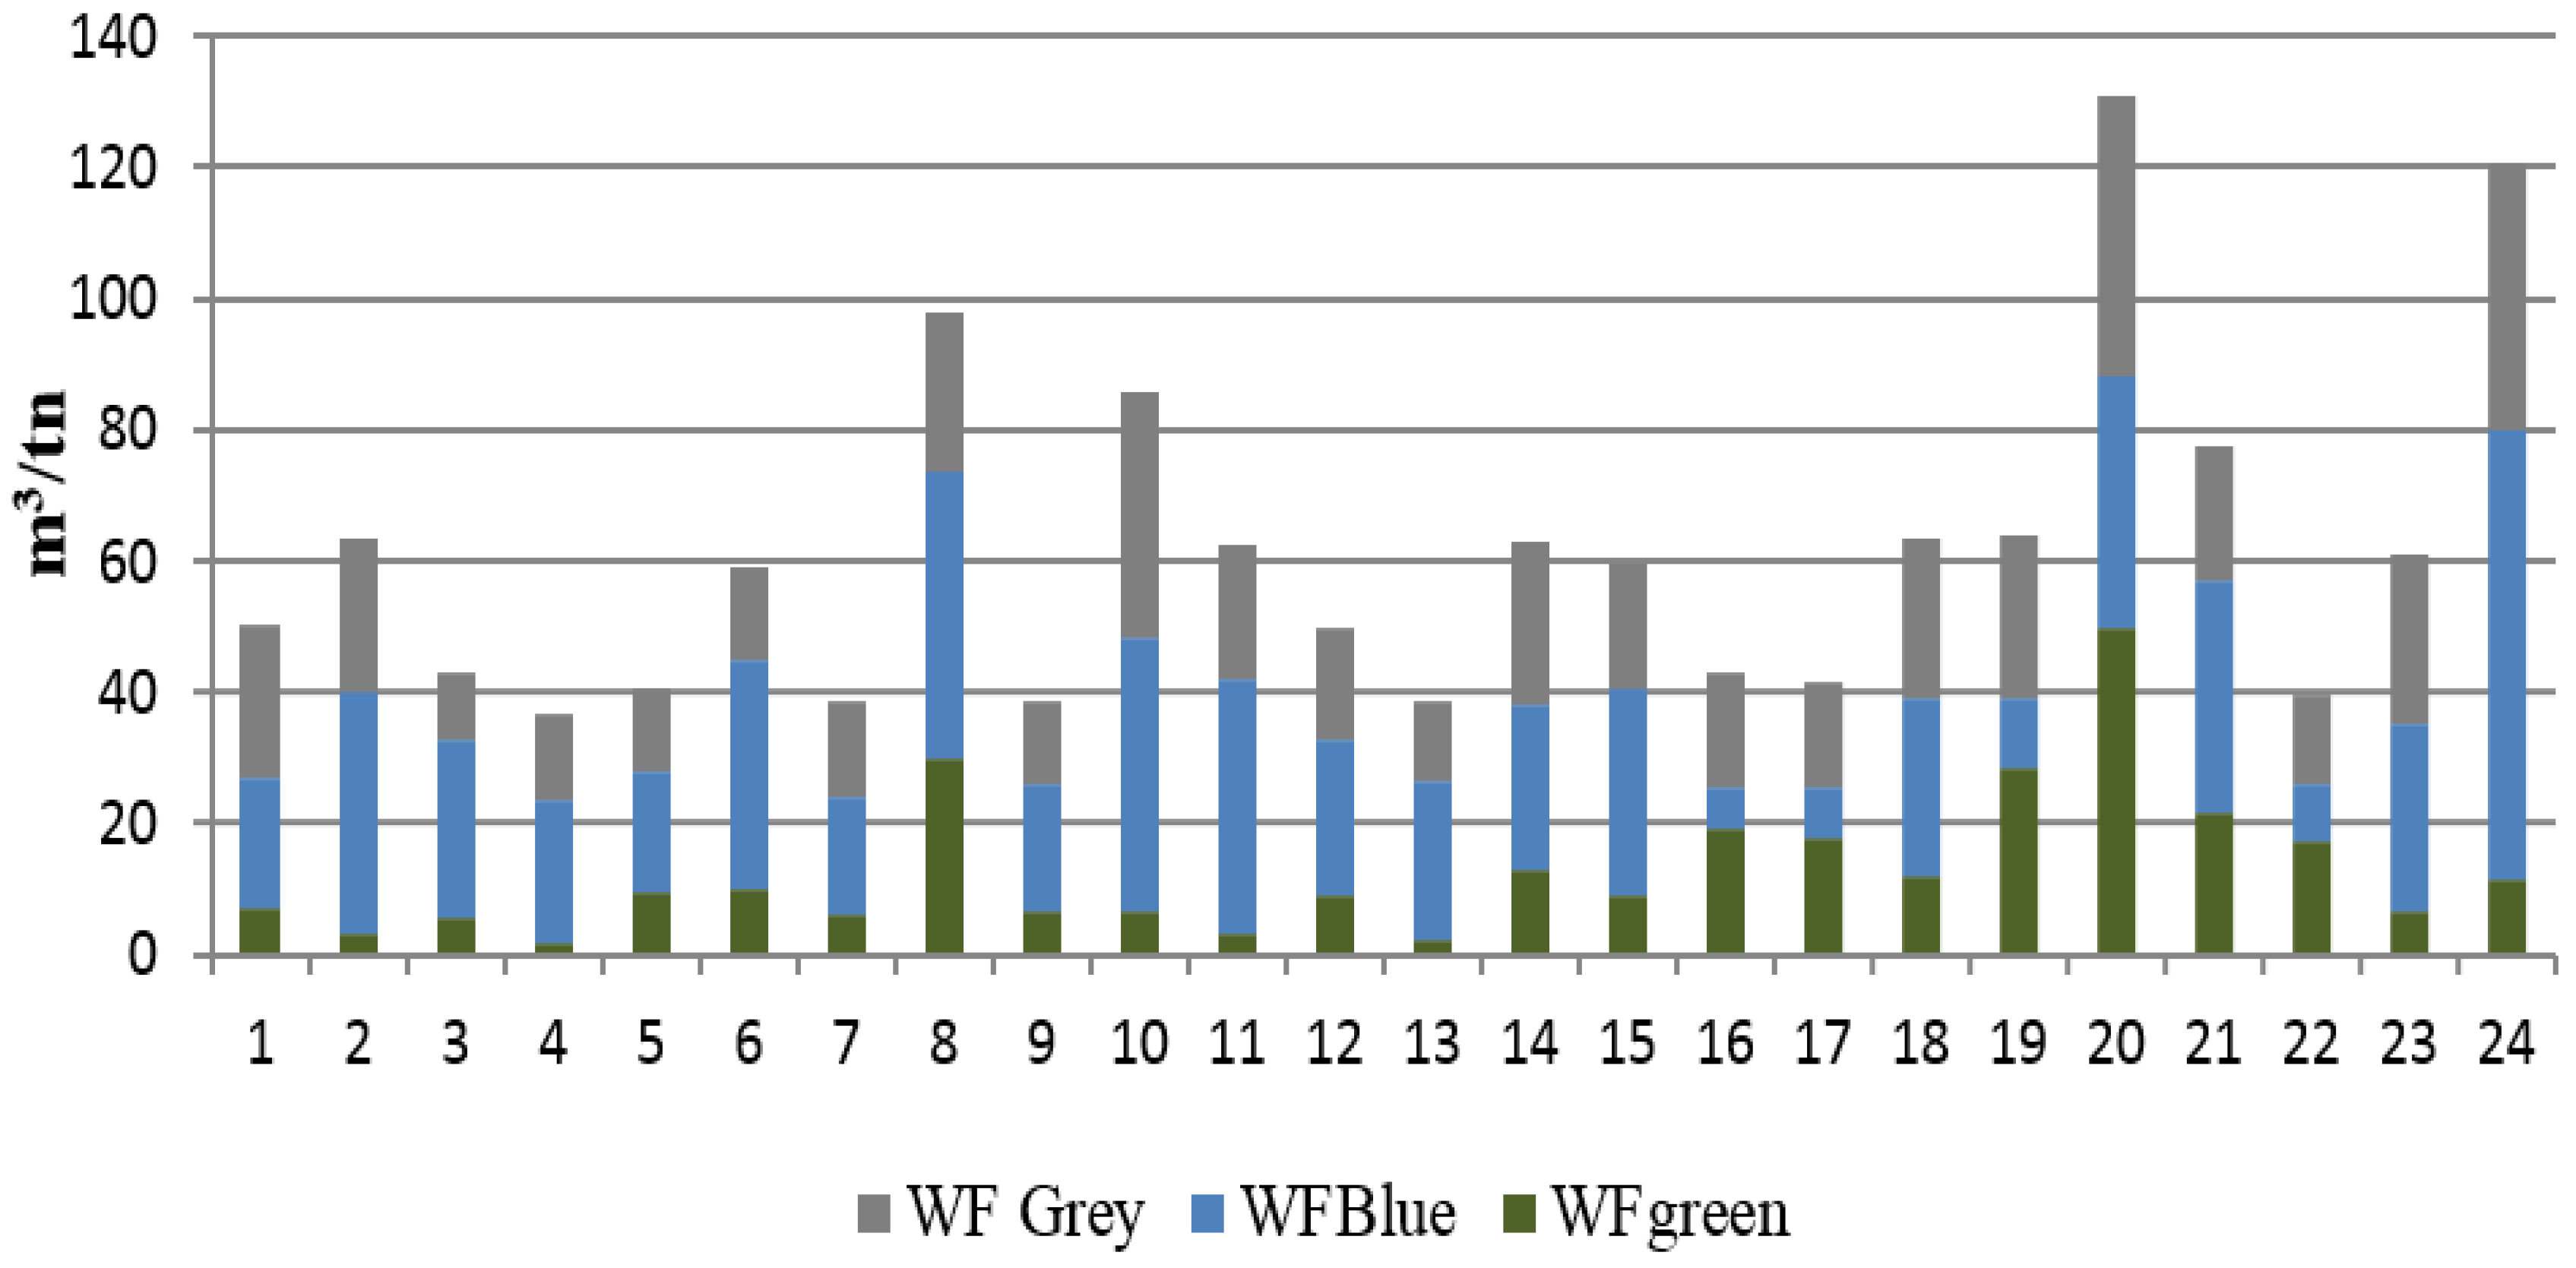
WF values and the contribution of the green, blue and grey components to total WF varied significantly between fields (Table 3, Figure 3). Highest variability was found in the WFgreen component that ranged from 5% to 45.2%. WFblue ranged from 14.3% to 63.6% and WFgrey from 23.8% to 46.5% in regard to WFtotal.
Table 3.
Contribution of green, blue and grey footprints to total WF of industrial tomatoes, % to the total WF.

Figure 3.
Grey, Blue and Green Water Footprint of the 24 farms in the Pinios River Basin.
The high variability of WFblue among different farms reveals the significant potential for improving the efficiency of water management. The WFgrey had the lowest variability that could be attributed to the similar N fertilizer management of industrial tomatoes in the Pinios River Basin, although many farmers use an empirical and inefficient way of N management. The method of WFgrey estimation with the 10% constant fraction, however, does not include field specific soil properties and N losses potential and it is anticipated to lower the variability between different fields. Nonetheless, the high WFgrey values of the study imply a pressure to water resources that is related to N pollution as was found in other relevant studies for tomato cultivations [15,40]. The use of N-based fertilizer in tomato production was found to be particularly significant in terms of grey water [7].
Between farms, differences in WF values are attributed to the combined effects of soil type, yield, climate parameters (mainly precipitation and atmospheric evapotraspiration demand) and irrigation management practices followed by each one farmer. This combined effect is clearly shown in the correlation matrix of WF with yield, soil properties related to water retention and irrigation volumes (Table 4). Apart from the correlation with yield, and irrigation volume, WF values were not correlated to soil properties. This indicates the multidimensional character of WF as an index for sustainable water management in crop production. Clay content showed a better (yet not significant) correlation with WFblue relative to WFgreen.
Table 4.
Pearson Correlations of Water Footprint component with yield, irrigation volumes and selected soil properties.
More research is needed on the effect of different management practices on WF values. Chukala et al. [41], for example, found an 8% to 28% reduction of green and blue WF in tomato cultivation in regards to combinations of different irrigation management and use of mulching at arid, semi-arid, sub-humid and humid environments in Israel, Spain, Italy and the UK, respectively. Any crop management that increases irrigation use efficiency can decrease WF values. In the Pinios river basin, site specific management that reduced water use by 5%–35%, without affecting yields in cotton as reported by Evangelou and Tsadilas [42] could be an alternative crop management to improve WF in agricultural production. The water footprint indicator, however, should be used together with other irrigation management indicators as a diagnostic tool to determine the efficiency of an irrigated agricultural system.
Water footprint in this study refers to “virtual water” used for the cultivation of tomato and does not include the incorporated water in tomato fruits. The average percentage of water concentration in tomato fruits harvested from the experimental fields amounts to 94.3% or 0.94 m3/ton of water incorporated in tomato fruits without significant differences between fields. This value represents a percentage ranging from 1.5% to 4.0% of WFtotal associated with the evapotranspirated water in the tomato cultivation during the entire growing season.
Table 5 presents the amounts of nitrogen losses and the resulted WFgrey according to both estimations used for the nine farms of 2015 growing period i.e., the constant leaching fraction approach and the determination of N losses by soil samplings at farm level.
Table 5.
N losses and resulting WFgrey according to the method used for N losses estimation.
The constant leaching fraction approach, overestimated N losses by 18%–64% in five farms compared to the soil N losses determination through the soil samplings approach. In contrast, by the constant leaching fraction approach, N losses were underestimated by 6%–125% in four farms, indicating a significant uncertainty of the WFgrey determination when specific field characteristics are disregarded. The soil sampling method resulted in a 25% higher coefficient of variation (CV %) in N losses compared to the constant leaching fraction approach (Table 5). Besides the amount of nitrogen fertilizer applied, N losses at field level were also affected by all other N sources such as N content of irrigation water, soil N at the beginning of the crop cycle, and soil N mineralized during the crop period. Castellanos et al. [43] reported that if only the amount of N fertilizer is considered, WFgrey is underestimated in some cases and overestimated in others. Therefore, more research is needed for the development of a more precise method of determination of N losses to be involved in the estimation of the WFgrey.
The estimations of the two approaches, however, were strongly correlated (r = 0.573, p < 0.01).
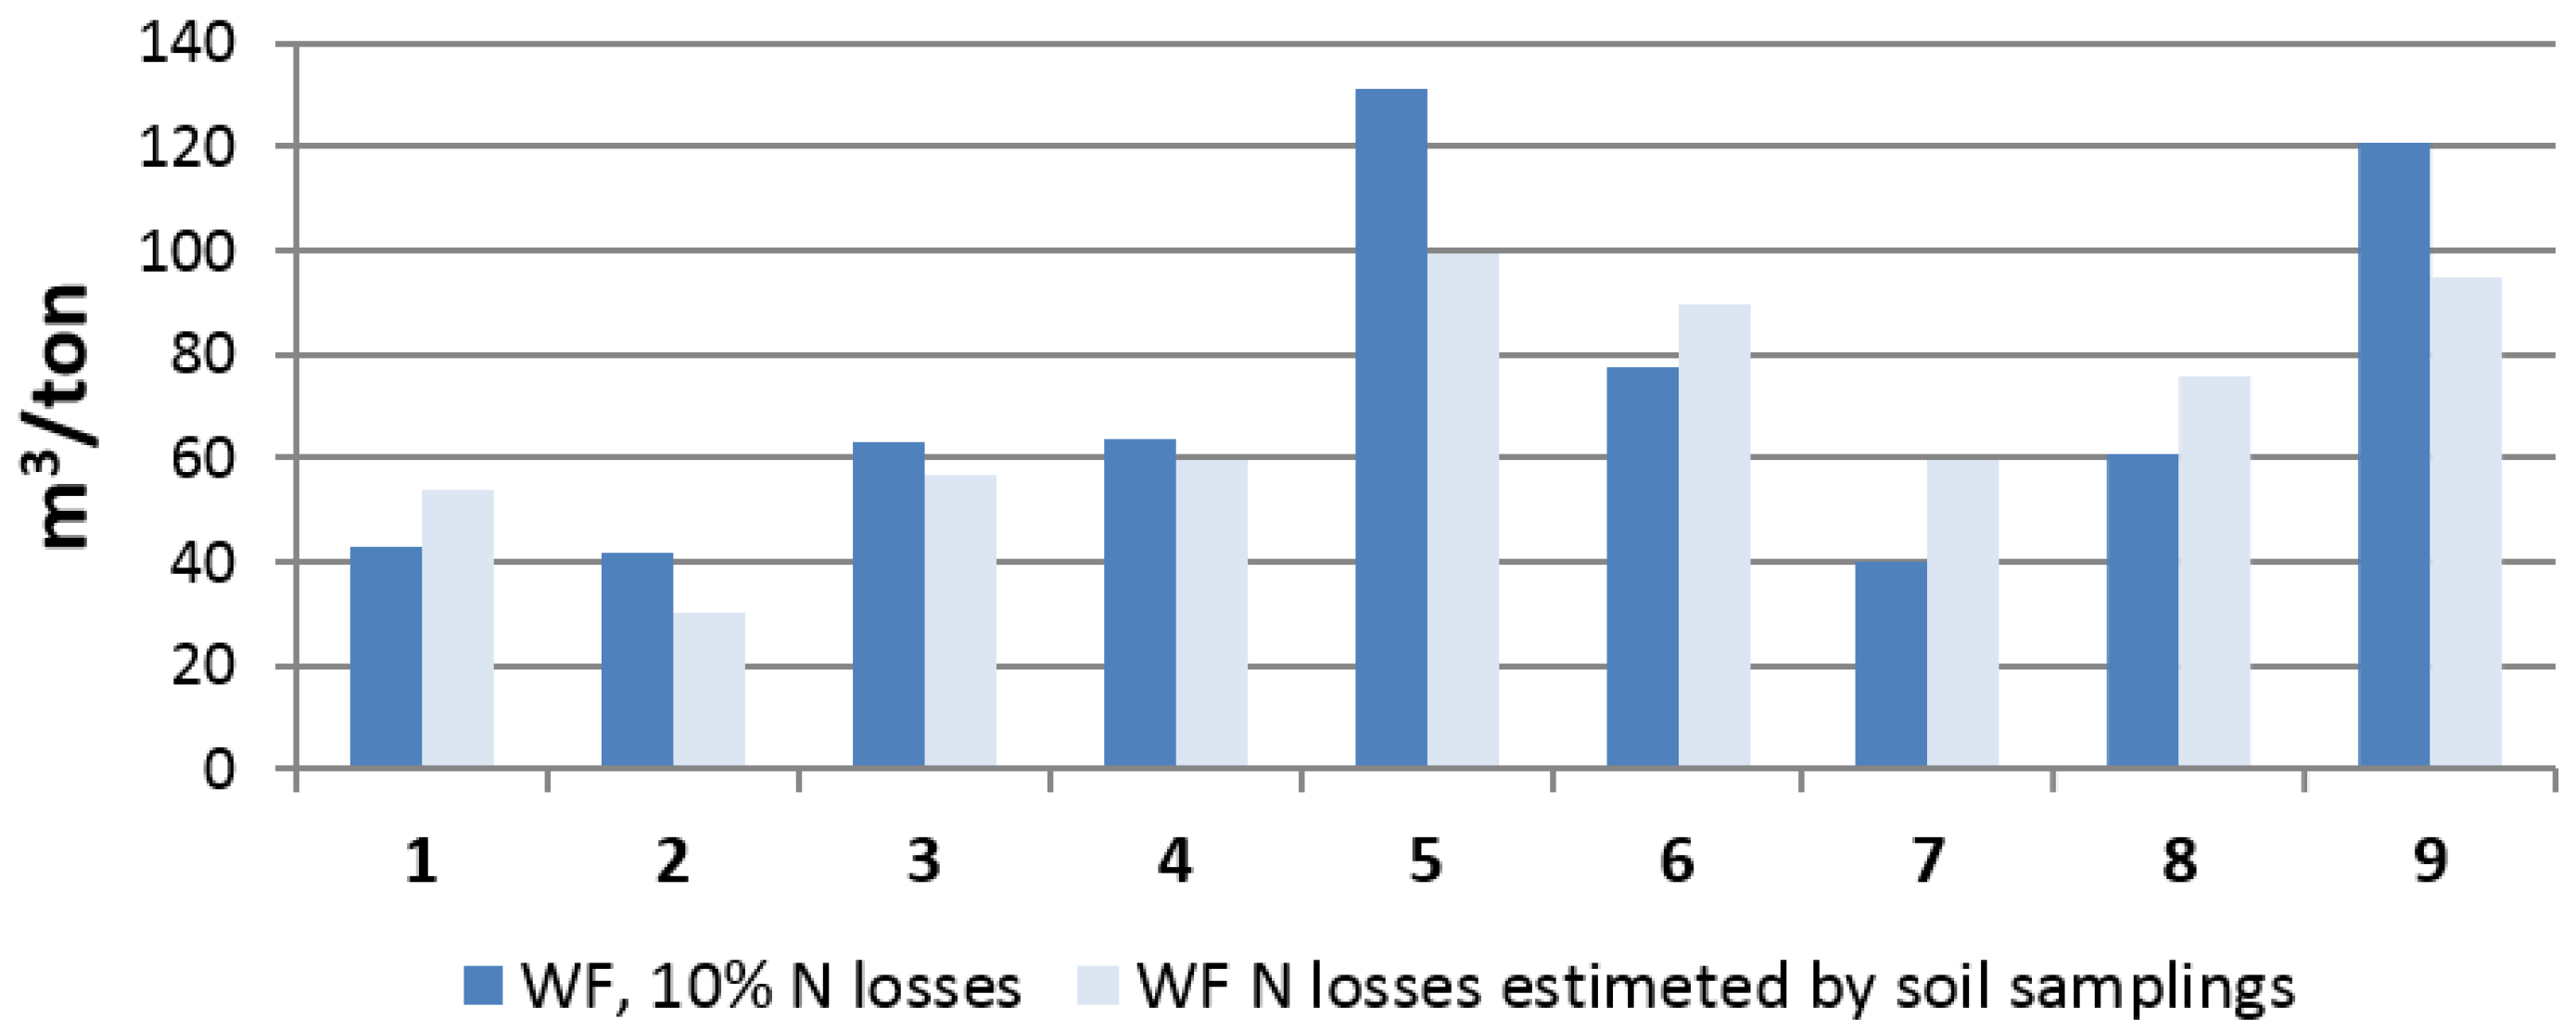
Differences in N losses estimations by the two approaches resulted in different WFgrey values and subsequently in different total WF values. Higher WF values were estimated in five of the nine farms, when the constant leaching fraction approach was used (Figure 4). It is widely accepted that the WFgrey in agricultural production systems must be calculated by using a more detailed methodology which should consider site-specific parameters such as daily precipitation, field slope, soil characteristics (e.g., texture, carbon content) and run-off [18].

Figure 4.
WFtotal estimated by the different WFgrey estimation methods.
The overall correlations of total WF values obtained by calculating WFgrey by the different approaches, however, was strong (R2 = 0.73 ***, Figure 5) suggesting that in the case that N losses cannot be estimated by measurements in the field, the constant leaching fraction approach of 10% losses of total N applied may give a satisfactory estimation of the total WF for industrial tomato cultivations in the Pinios river basin. Estimation of N losses for each field with soil samplings however, is more precise, resulting in more realistic WF values.
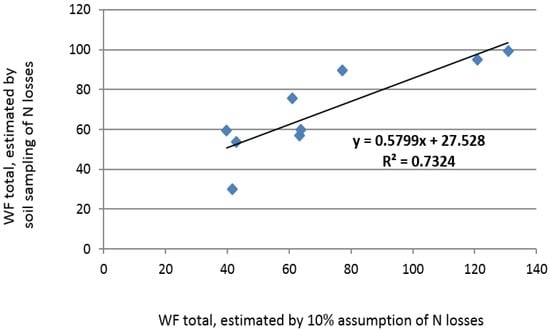
Figure 5.
Correlation of total WF values estimated by the two approaches.
4. Conclusions
Under the integrated management system protocol, the total water footprint of industrial tomatoes produced in the Pinios river basin of central Greece is about 60 L/kg tomato and ranges from 37 to 130 L/kg. The average values of the different WF components were 20.6% green, 44.6% blue and 34.7% grey. Still, these averages vary greatly depending on soil properties, local climatic conditions and water management systems although no significant correlation was found with any individual soil property related to water retention. The high variability of WF values highlights the importance of considering water issues at the local scale level. Soil-based assessment of N losses at the farm level leads to a more precise estimation of WF. When contextualized in space and time, the water footprint can identify best practices for an integrated water resource management with economic and environmental benefits.
Acknowledgments
This work was financed by the tomato processing company D. Nomikos S.A. under the contract No. 1207/21-12-2013. Special thanks are expressed to the technical staff of the Institute of Soil Mapping and Classification for carrying out the field and lab works and to Stamatis Stamatiadis for his contribution to the editing and proofreading of the manuscript. Finally thanks are expressed to the reviewers who shared their time, expertise and critical views to improve this work and to the editorial team of the Water journal for the collaboration throughout the editorial process.
Author Contributions
All authors contributed to this work significantly. Eleftherios Evangelou, Christos Tsadilas, and Aristotelis Kyritsis contributed to the subject of the research. Nikolaos Tserlikakis performed the experiments. Alexandros Tsitouras collected and processed climatic data. Eleftherios Evangelou performed modeling work, and statistical analysis. Evangelou Eleftherios and Christos Tsadilas wrote the paper.
Conflicts of Interest
The authors declare no conflict of interest.
References
- Wriedt, G.; Vander, V.M.; Aloe, A.; Bouraoui, F. Estimating irrigation water requirements in Europe. J. Hydrol. 2009, 373, 527–544. [Google Scholar] [CrossRef]
- The European Economic Area (EEA). Towards Efficient Use of Water Resources in Europe; EEA Report No. 1/2012; EEA: Copenhagen, Denmark, 2012. [Google Scholar]
- Panagopoulos, Y.; Makropoulosa, C.; Gkiokas, A.; Kossida, M.; Evangelou, L.; Lourmas, G.; Michas, S.; Tsadilas, C.; Papageorgiou, S.; Perleros, V.; et al. Assessing the cost-effectiveness of irrigation water management practices in water stressed agricultural catchments: The case of Pinios. Agric. Water Manag. 2014, 139, 31–42. [Google Scholar] [CrossRef]
- Loukas, A.; Mylopoulos, N.; Vasiliades, L. A modeling system for the evaluation of water resources management strategies in Thessaly, Greece. Water Resour. Manag. 2007, 21, 1673–1702. [Google Scholar] [CrossRef]
- Hoekstra, A.Y.; Chapagain, A.K.; Aldaya, M.M.; Mekonnen, M.M. Water Footprint Manual: State of the Art; Water Footprint Network: Enschede, The Netherlands, 2009. [Google Scholar]
- Boulay, A.M.; Hoekstra, A.Y.; Vionnet, S. Complementarities of water-focused Life Cycle Assessment and Water Footprint Assessment. Environ. Sci. Technol. 2013, 47, 11926–11927. [Google Scholar] [CrossRef]
- Manzardo, A.; Ren, J.; Piantella, A.; Mazzi, A.; Fedele, A.; Scipioni, A. Integration of water footprint accounting and costs for optimal chemical pulp supply mix in paper industry. J. Clean. Prod. 2014, 72, 167–173. [Google Scholar] [CrossRef]
- Hess, T.; Andersson, U.; Mena, C.; Williams, A. The impact of healthier dietary scenarios on the global blue water scarcity footprint of food consumption in the UK. Food Policy 2015, 50, 1–10. [Google Scholar] [CrossRef]
- Morillo, J.G.; Diaz, J.A.R.; Camacho, E.; Montesinos, P. Linking water footprint accounting with irrigation management in high value crops. J. Clean. Prod. 2015, 87, 594–602. [Google Scholar] [CrossRef]
- Page, G.; Ridoutt, B.; Bellotti, B. Fresh tomato production for the Sydney market: An evaluation of options to reduce freshwater scarcity from agricultural water use. Agric. Water Manag. 2011, 100, 18–24. [Google Scholar] [CrossRef]
- Payen, S.; Basset-Mens, C.; Perret, S. LCA of local and imported tomato: An energy and water trade-off. J. Clean. Prod. 2014, 87, 139–148. [Google Scholar] [CrossRef]
- Ridoutt, B.G.; Pfister, S. A revised approach to water footprinting to make transparent the impacts of consumption and production on global freshwater scarcity. Glob. Environ. Chang. 2010, 20, 113–120. [Google Scholar] [CrossRef]
- Aldaya, M.M.; Hoekstra, A.Y. The water needed for Italians to eat pasta and pizza. Agric. Syst. 2010, 103, 351–360. [Google Scholar] [CrossRef]
- Chico, D.G.; Salmoral, M.R.; Llamas, A.; Garridoand, M.; Aldaya, M. The Water Footprint and Virtual Experts of Spanish Tomatos; Papeles de Agua Virtual, No. 8; Botin Foundation: Santander, Spain, 2010. [Google Scholar]
- Bulsink, F.; Hoekstra, A.Y.; Booij, M.J. The water footprint of Indonesian provinces related to the consumption of crop products. Hydrol. Earth Syst. Sci. Discuss. 2010, 6, 5115–5137. [Google Scholar] [CrossRef]
- Galli, A.; Wiedmann, T.; Ercin, E.; Knoblauch, D.; Ewing, B.; Giljum, S. Integrating ecological, carbon and water footprint into a “footprint family” of indicators: Definition and role in tracking human pressure on the planet. Ecol. Indic. 2012, 16, 100–112. [Google Scholar] [CrossRef]
- Hoekstra, A.Y.; Chapagain, A.K. Globalization of Water: Sharing the Planet’s Freshwater Resources; Blackwell Publishing: Oxford, UK, 2008. [Google Scholar]
- Lovarelli, D.; Bacenetti, J.; Fiala, M. Water Footprint of crop productions: A review. Sci. Total Environ. 2016, 1, 236–251. [Google Scholar] [CrossRef]
- Mekonnen, M.M.; Hoekstra, A.Y. The green, blue and grey water footprint of crops and derived crop products. Hydrol. Earth Syst. Sci. 2011, 15, 577–600. [Google Scholar] [CrossRef]
- Chapagain, A.K.; Hoekstra, A.Y. The blue, green and grey water footprint of rice from production and consumption perspectives. Ecol. Econ. 2011, 70, 749–758. [Google Scholar] [CrossRef]
- Manzardo, A.; Mazzi, A.; Loss, A.; Butler, M.; William, A.; Scipioni, A. Lessons learned from the application of different water footprint approaches to compare different food packaging alternatives. J. Clean. Prod. 2016, 112, 4657–4666. [Google Scholar] [CrossRef]
- Araujo, J.S.; Andrade, A.P.; Ramalho, C.I.; Azevedo, C.A.V. Características de frutos de pimentão cultivado emambiente protegido sob doses de nitrogênio via fertirriga ção. Rev. Bras. Eng. Agríc. Ambient. 2009, 13, 152–157. (In Portuguese) [Google Scholar] [CrossRef]
- Amarasinghe, U.A.; Smakhtin, V. Water productivity and water footprint: Misguided concepts or useful tools in water management and policy. Water Int. 2014, 39, 1000–1017. [Google Scholar] [CrossRef]
- Molden, D.; Oweis, T.; Steduto, P.; Bindraban, P.; Hanjra, M.A.; Kijne, J. Improving agricultural water productivity: Between optimism and caution. Agric. Water Manag. 2010, 97, 528–535. [Google Scholar] [CrossRef]
- Evangelou, L.; Vlouchos, C.; Moustaka, K.; Tsadilas, C. DPSIR Study for Desertification in Pinios. In Deliverable for the Task B of the Project I-Adapt: Innovative Approaches to Halt Desertification in Pinios; Final Report; DG Environment, School of Civil Engeneering National Technical University of Athens: Athens, Greece, 2012. [Google Scholar]
- Anonymous. AGRO 2-1 Standard AGROCERT. In Management of Rural Environment—Integrated Management in Agricultural Production. Part 1: Specification; Ministry of Rural Development and Food—Agency Certification and Supervision of Agricultural Products: Athens, Greece, 2008; p. 12. [Google Scholar]
- Hazelton, P.; Murphy, B. Interpreting Soil Test Results: What Do All the Numbers Mean? CSIRO Publishing: Collinwood, Victoria, Australia, 2007; pp. 1–66. [Google Scholar]
- Page, A.L. (Ed.) Methods of Soil Analysis, Agron. 9, Part 2: Chemical and Mineralogical Properties, 2nd ed.; American Society of Agronomy, Soil Science Society of America: Madison, WI, USA, 1982.
- Food and Agriculture Organization (FAO). CROPWAT 8.0 Model; FAO: Rome, Italy, 2010. [Google Scholar]
- Allen, R.G.; Pereira, L.S.; Raes, D.; Smith, M. Crop Evapotranspiration: Guidelines for Computing Crop Water Requirements; FAO Irrigation and Drainage Paper No. 56; FAO: Rome, Italy, 1998. [Google Scholar]
- Environmental Protection Agency. Drinking Water Contaminant Candidate List 2; Final Notice; US Environmental Protection Agency: Washington, DC, USA, 2005.
- Barbee, G.C.; Brown, K.W. Comparison between suction and free-drainage soil solution samplers. Soil Sci. 1986, 141, 149–153. [Google Scholar] [CrossRef]
- Lord, E.I.; Shepherd, M.A. Developments in the use of porous ceramic cups for measuring nitrate leaching. J. Soil Sci. 1993, 44, 435–449. [Google Scholar] [CrossRef]
- Webster, C.P.; Shepherd, M.A.; Goulding, K.W.T.; Lord, E. Comparison between methods for measuring the leaching of mineral nitrogen from arable land. J. Soil Sci. 1993, 44, 49–62. [Google Scholar] [CrossRef]
- Pampolino, M.F.; Urushiyama, T.; Hatano, R. Detection of nitrate leaching through bypass flow using pan lysimeter, suction cup, and resin capsule. Soil Sci. Plant Nutr. 2000, 46, 703–711. [Google Scholar] [CrossRef]
- Zotarelli, L.; Scholberg, J.M.; Dukes, M.D.; Carpen, R.M. Monitoring of Nitrate Leaching in Sandy Soils: Comparison of Three Methods. J. Environ. Qual. 2007, 36, 953–962. [Google Scholar] [CrossRef]
- Chapagain, A.K.; Orr, S. An improved water footprint methodology linking global consumption to local water resources: A case of Spanish tomatoes. J. Environ. Manag. 2009, 90, 1219–1228. [Google Scholar] [CrossRef]
- Aldaya, M.M.; Llamas, M.R. Water Footprint Analysis (Hydrologic and Economic) of the Guadiana River Basin within the NeWater Project; Third Edition of the United Nations World Water Development Report (WWDR-3); NESCO-IHE Institute for Water Education: Delft, The Netherlands; University of Twente: Enschede, The Netherlands; Delft University of Technology: Delft, The Netherlands, 2009. [Google Scholar]
- Aldaya, M.M.; Martinez-Santos, P.; Llamas, M.R. Incorporating the water footprint and virtual water into policy: Reflections from the Mancha Occidental Region, Spain. Water Resour. Manag. 2010, 24, 941–958. [Google Scholar] [CrossRef]
- Salmoral, G.; Chico, D. Lessons learnt from analyses of the water footprint of tomatoes and olive oil in Spain. In Water, Agriculture and the Environment in Spain: Can We Square the Circle? Taylor & Francis Group: London, UK, 2013. [Google Scholar]
- Chukalla, A.D.; Krol, M.S.; Hoekstra, A.Y. Green and blue water footprint reduction in irrigated agriculture: Effect of irrigation techniques, irrigation strategies and mulching. Hydrol. Earth Syst. Sci. 2015, 19, 4877–4891. [Google Scholar] [CrossRef]
- Evangelou, L.; Tsadilas, C. Pilot of a Precision Irrigation Experiment of Cotton in Pinios River Basin. In Deliverable for the Task D of the Project I-Adapt: Innovative Approaches to Halt Desertification in Pinios; Final Report; DG Environment, School of Civil Engeneering National Technical University of Athens: Athens, Greece, 2012. [Google Scholar]
- Castellanos, M.T.; Cartagena, M.C.; Requejo, M.I.; Arce, A.; Cabello, M.J.; Ribas, F.; Tarquis, A.M. Agronomic concepts in water footprint assessment: A case of study in a fertirrigated melon crop under semiarid conditions. Agric. Water Manag. 2016, 170, 81–90. [Google Scholar] [CrossRef]

© 2016 by the authors; licensee MDPI, Basel, Switzerland. This article is an open access article distributed under the terms and conditions of the Creative Commons Attribution (CC-BY) license (http://creativecommons.org/licenses/by/4.0/).