
A New Rapid Simplified Model for Urban Rainstorm Inundation with Low Data Requirements


Abstract
:1. Introduction
2. Materials and Methods
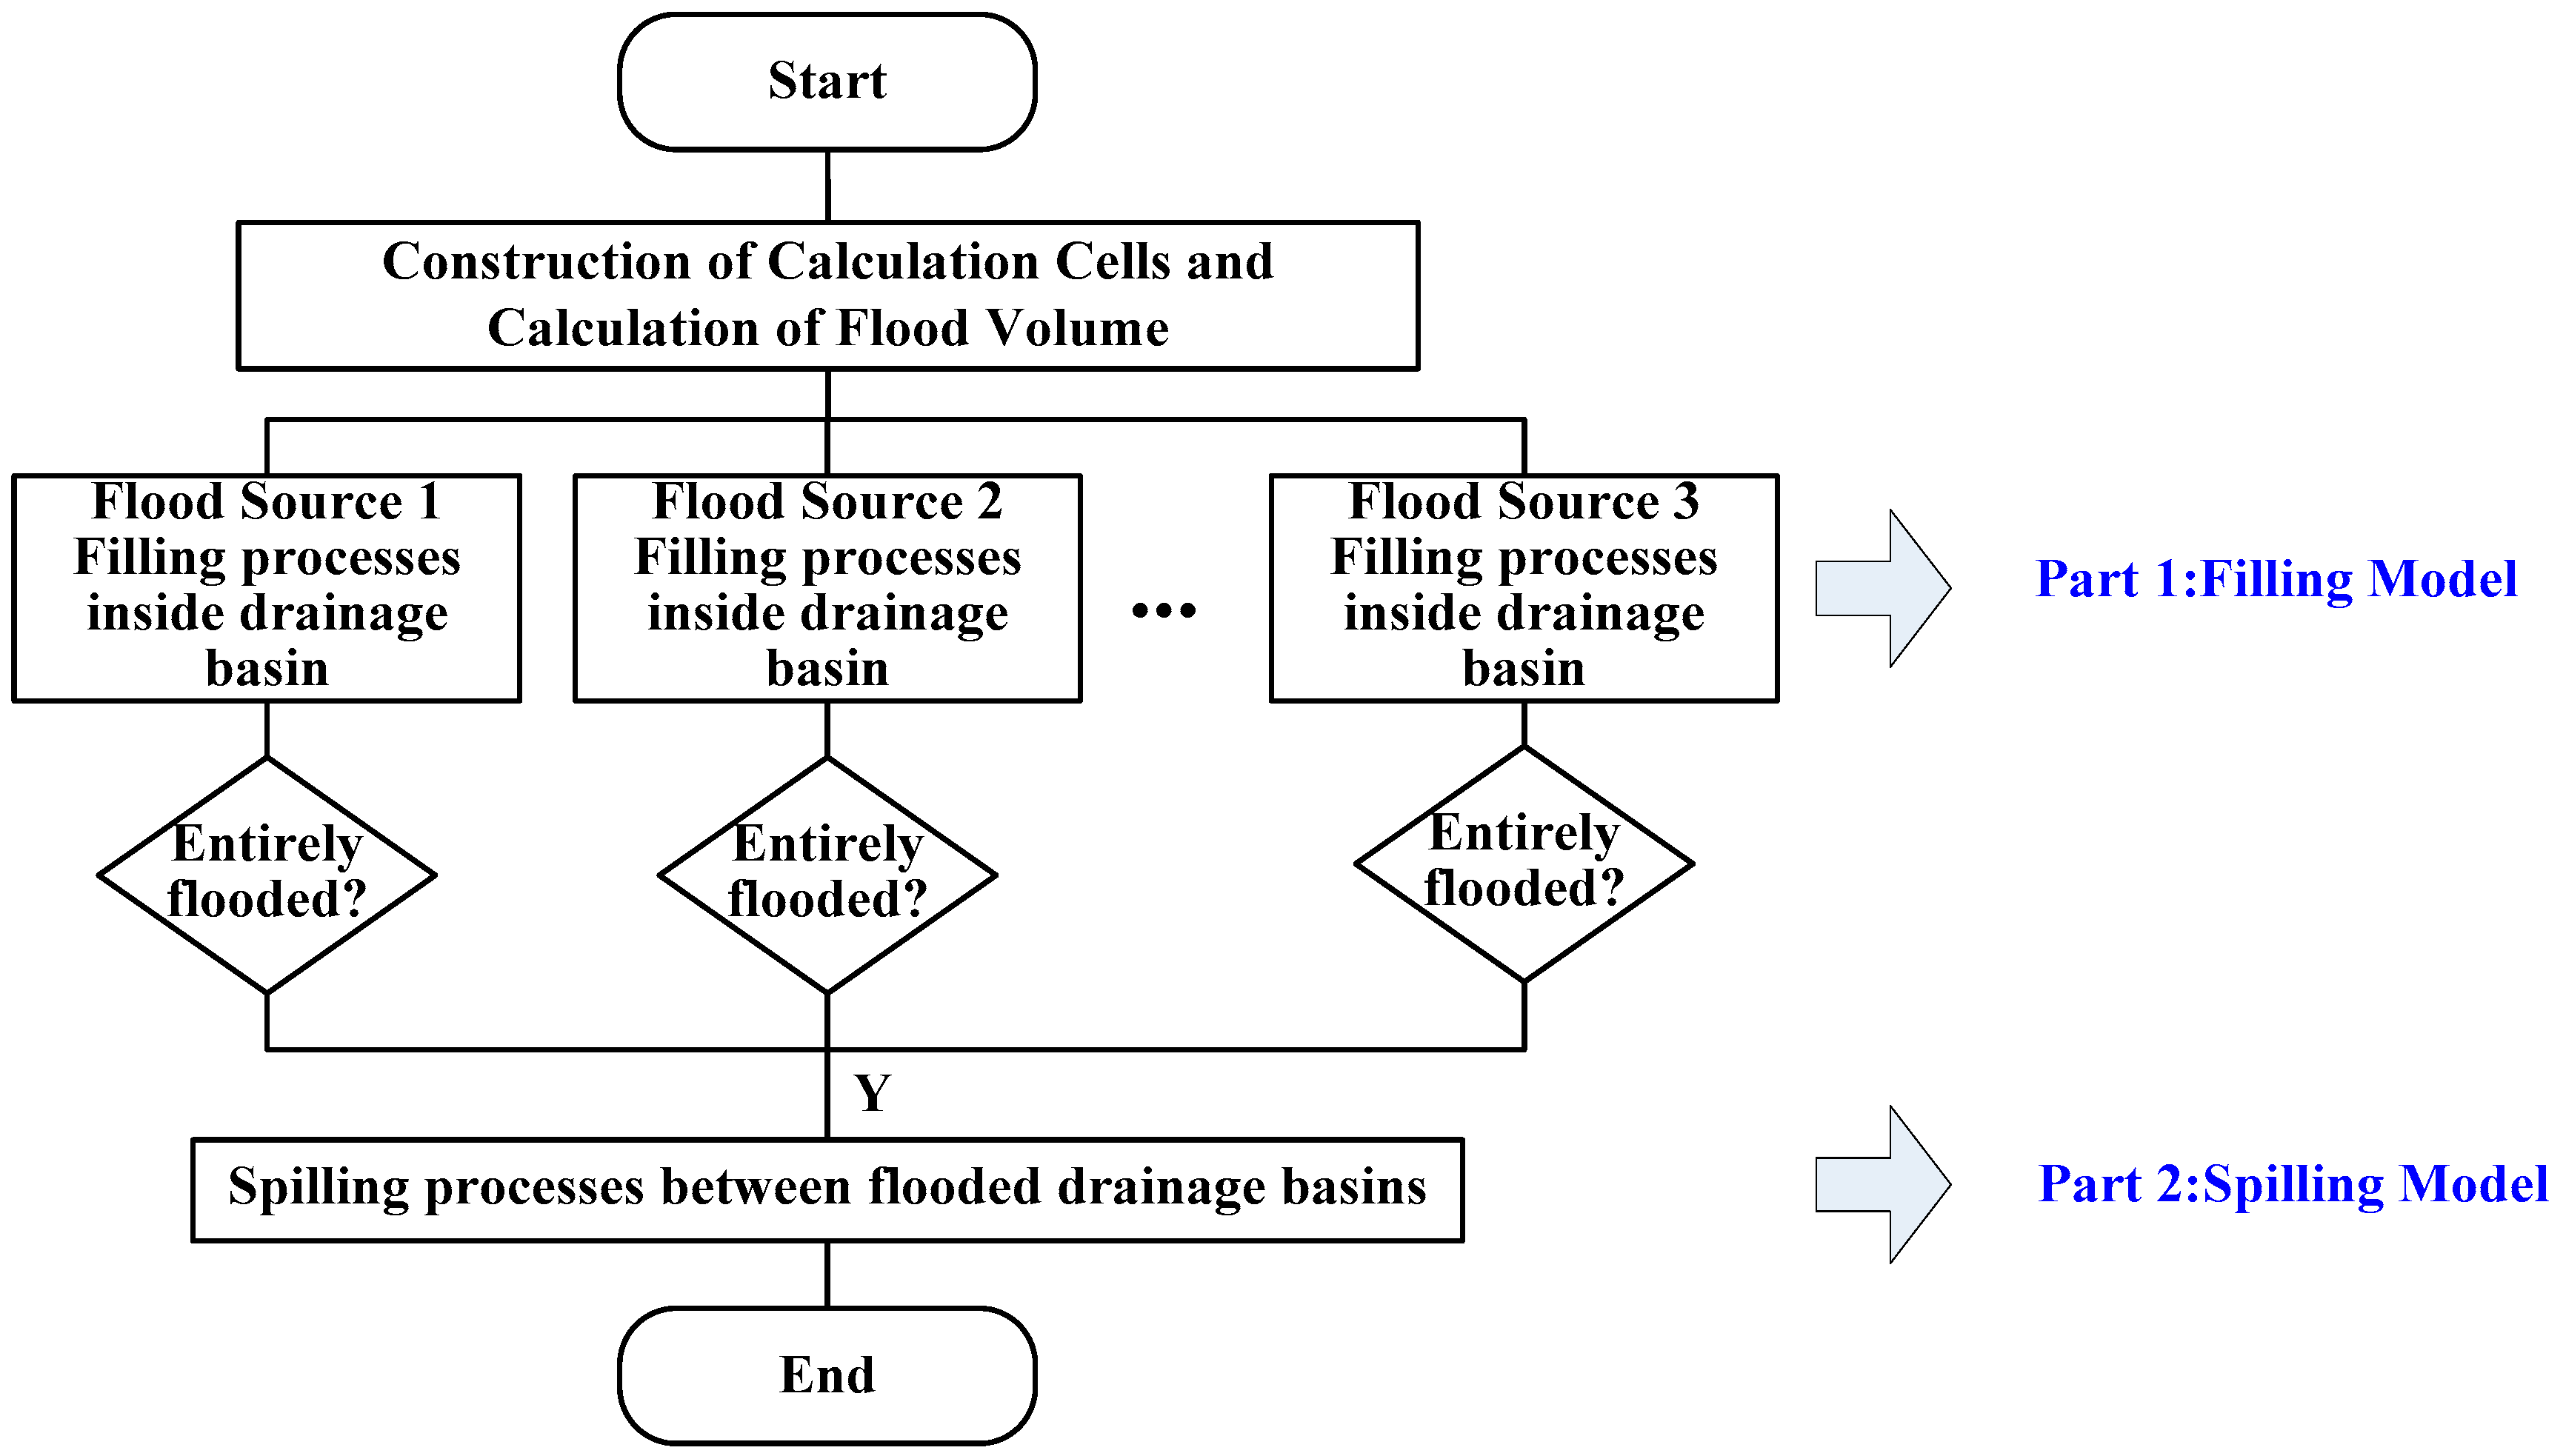
2.1. Overview
- (1)
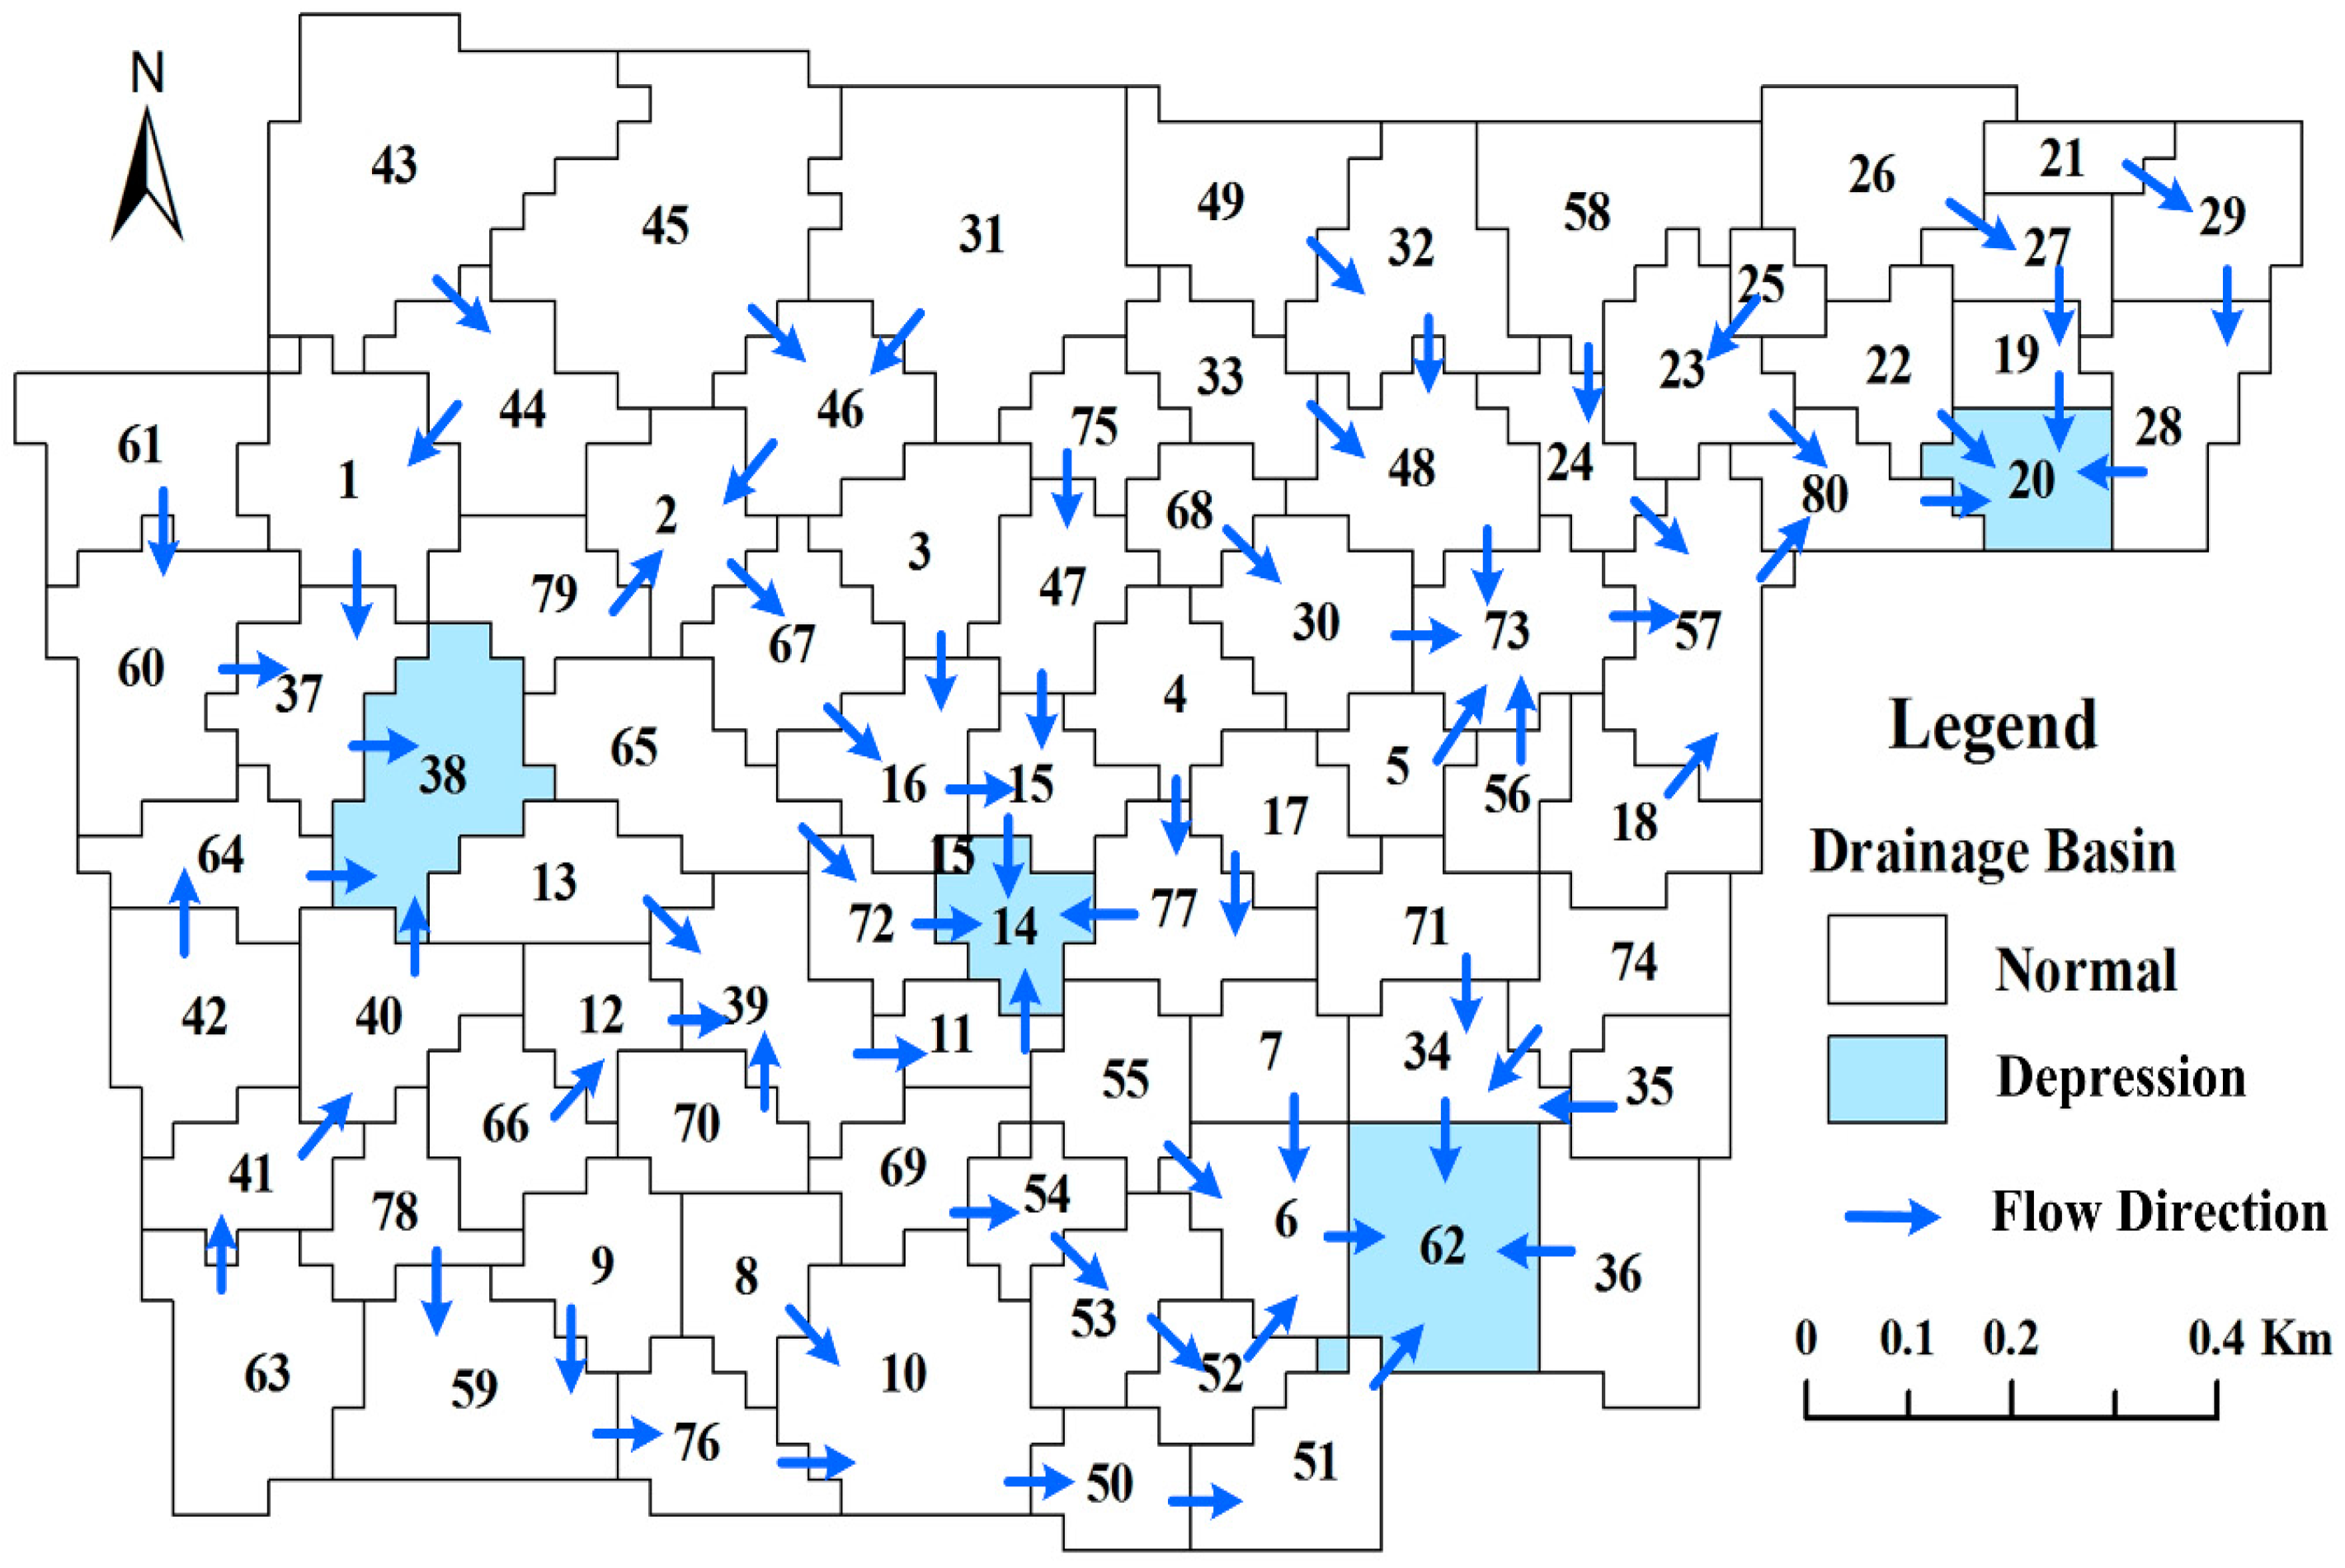
- Because there is a one-to-one correspondence between drainage basins and multiple flood sources, the fill/spilling processes of inundation from each flood source can be simulated in a distributed way.
- (2)
- Compared with irregular storage cells in existing models, drainage basins with larger sizes can reduce the number of calculation cells. The fewer the calculation cells in the model, the fewer are the calculation steps that need to be carried out, thus raising the computation efficiency of the inundation model.
- (3)
- By simplifying the inundation spaces of drainage basins to regular spatial geometries, inundation modeling with a good balance between accuracy and cost-efficiency can be achieved when detailed topographic features cannot be represented explicitly in input data.
2.2. Construction of Calculation Cells
- (1)
- Area. The area of each calculation cell (m2) can be calculated according to the number and resolution of DEM cells inside each calculation cell.
- (2)
- Mean elevation. The mean elevation of all DEM cells located in each calculation cell (m) can be obtained based on the statistical analysis tools in ESRI ArcGIS.
- (3)
- Mean slope. The average value of the slopes at all DEM cells located in the calculation cell (%). The slope of each DEM cell can be calculated by the surface analysis tools in ESRI ArcGIS.
- (4)
- Storm gate capacity. To simplify the interactions between the surface and the drainage sewer system, this study assumes that the capacity of the storm gate inside each calculation cell is equal to the full design capacity of the downstream drain pipe (Qf, m3/s), which can be computed by [33]:where nc is the Manning’s roughness coefficient of the drain pipe, Af (m2) is the full cross-section area of the drain pipe, Rf (m) is the hydraulic radius for full drain pipe flow, and Sf is the friction slope of the drain pile, which can be defined as:where es and ee (m) are elevations of the start node and end node of the drain pipe, respectively, and l (m) is the length of the drain pipe.
- (5)
- Flood Volume. The flood volume q (m3) of each calculation cell is expressed as follows:where qs (m3) is the overflow volume from the storm gates when the corresponding drain pipes reach their capacities and qe (m3) is the volume of water that cannot be conveyed in time by the drainage system after the storm begins. Both qs and qe can be obtained by establishing the Storm Water Management Model (SWMM) developed by the U.S. Environmental Protection Agency (EPA), which can provide reliable simulation for the water flow in drainage sewer systems and surcharged flow at storm gates.
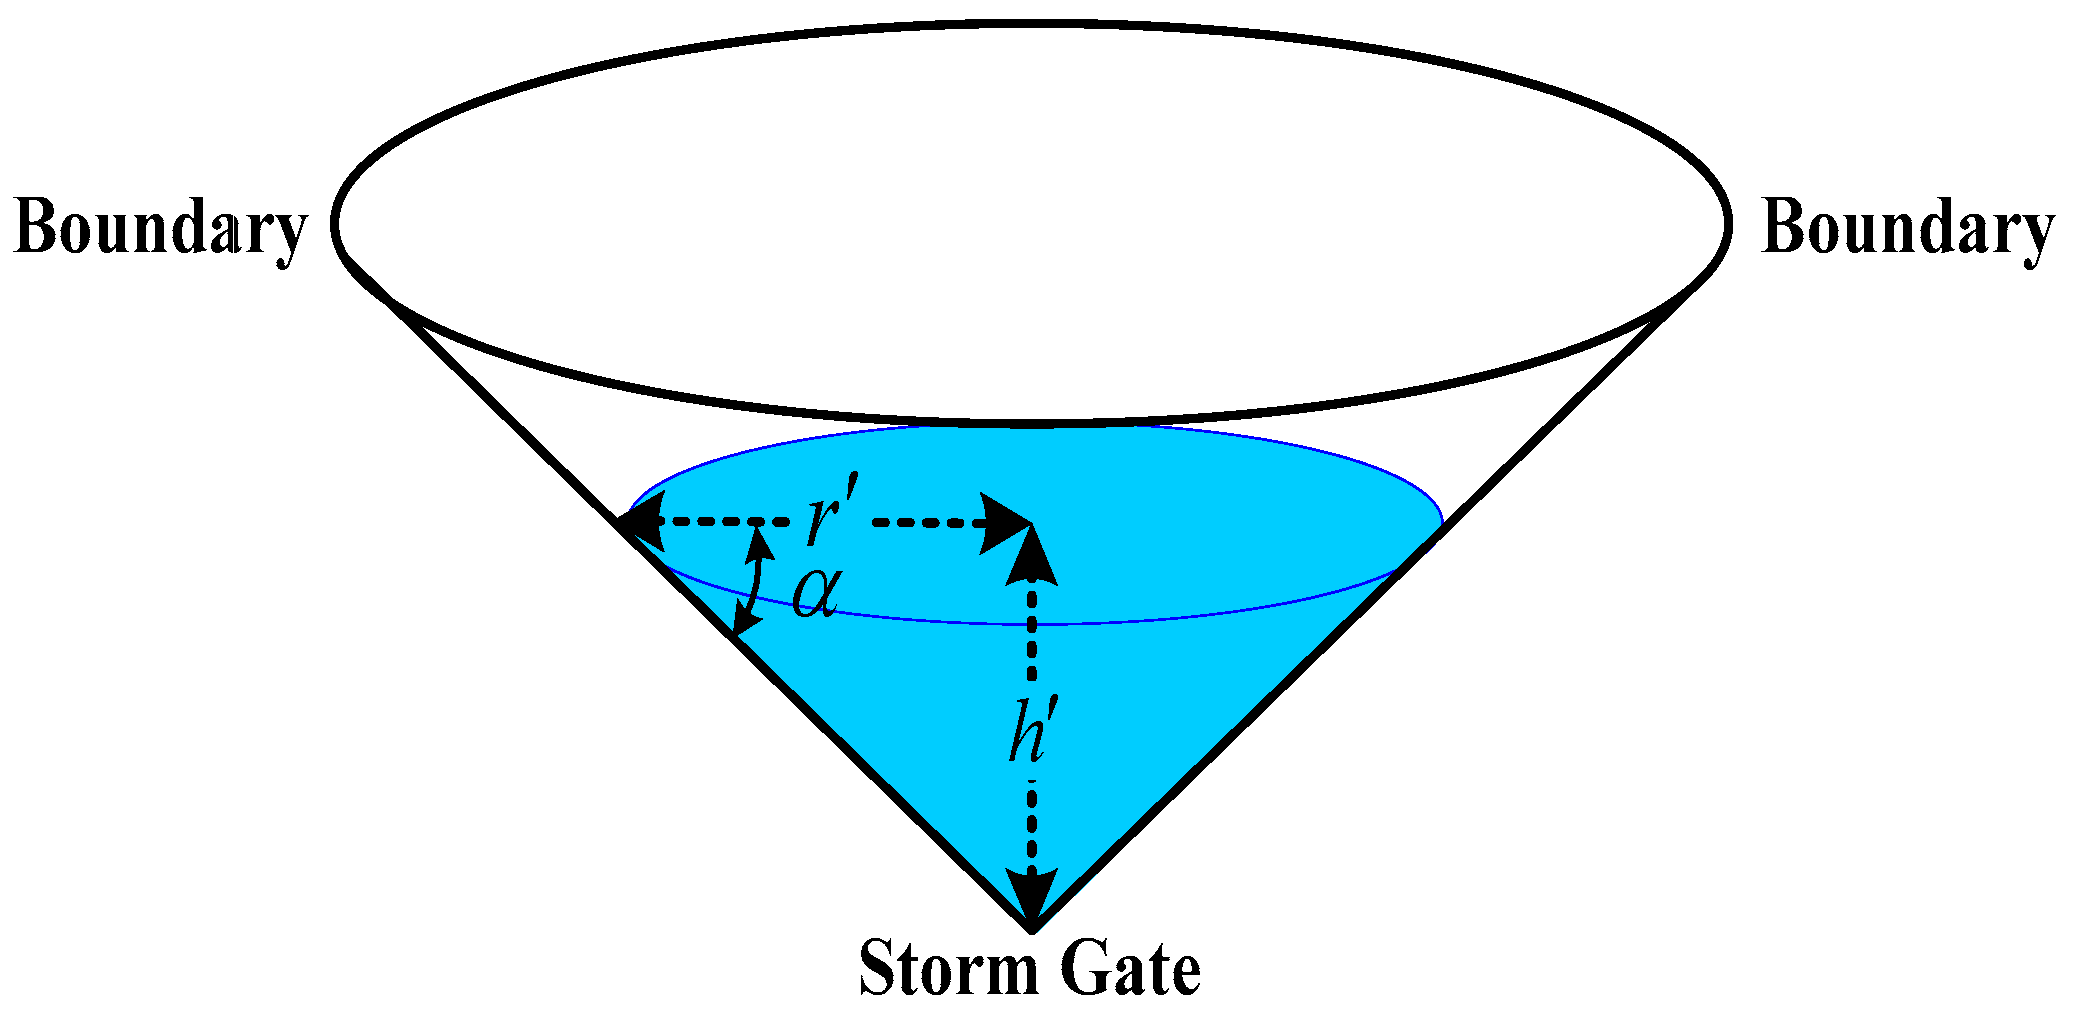
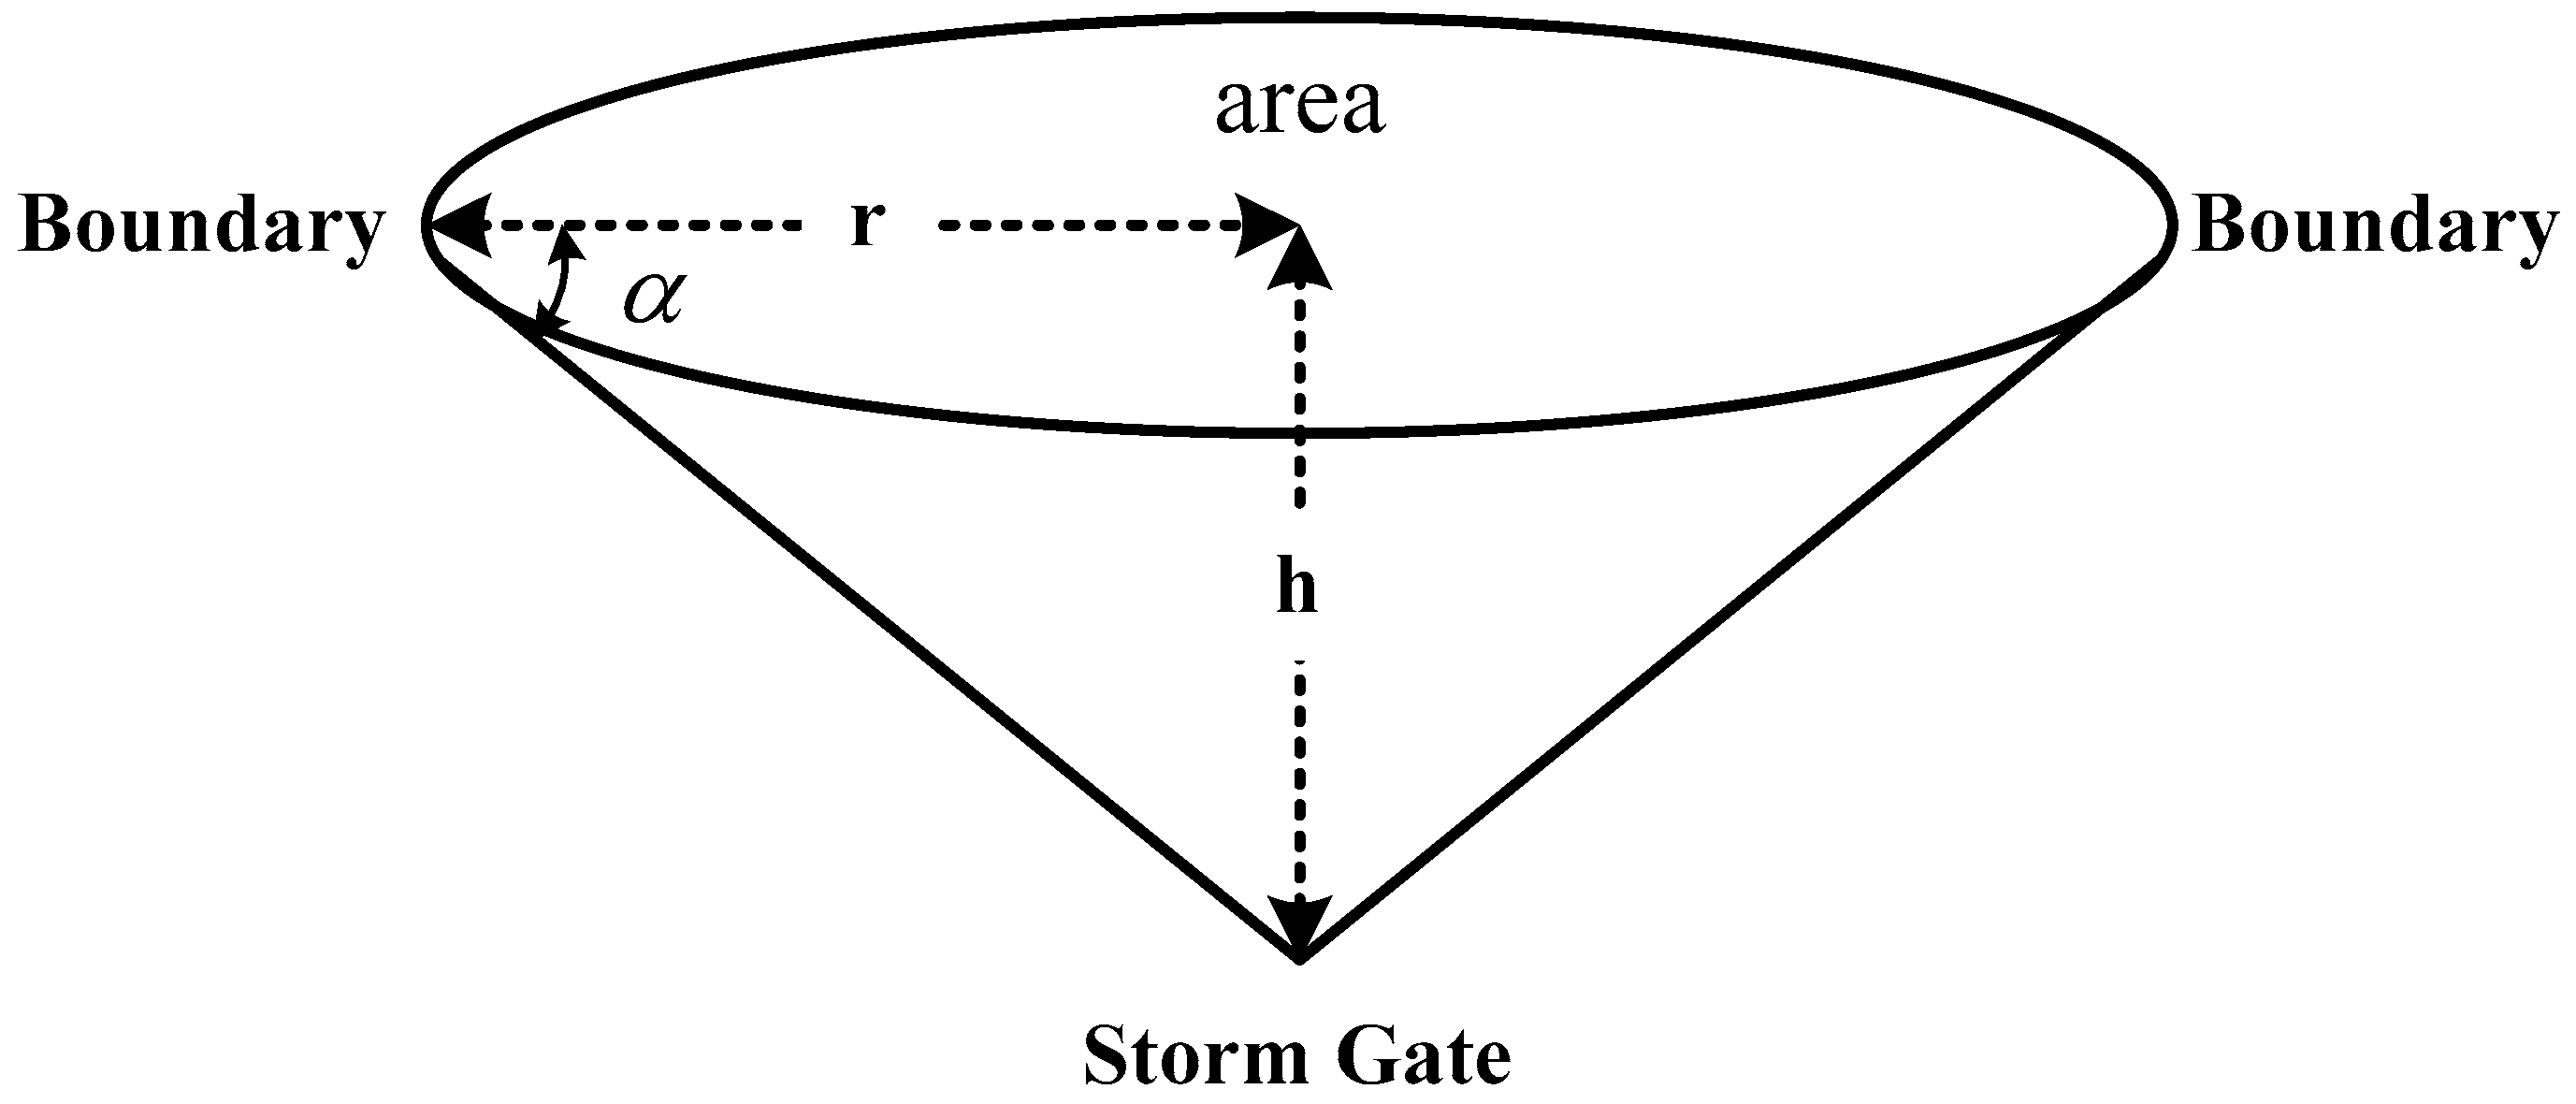
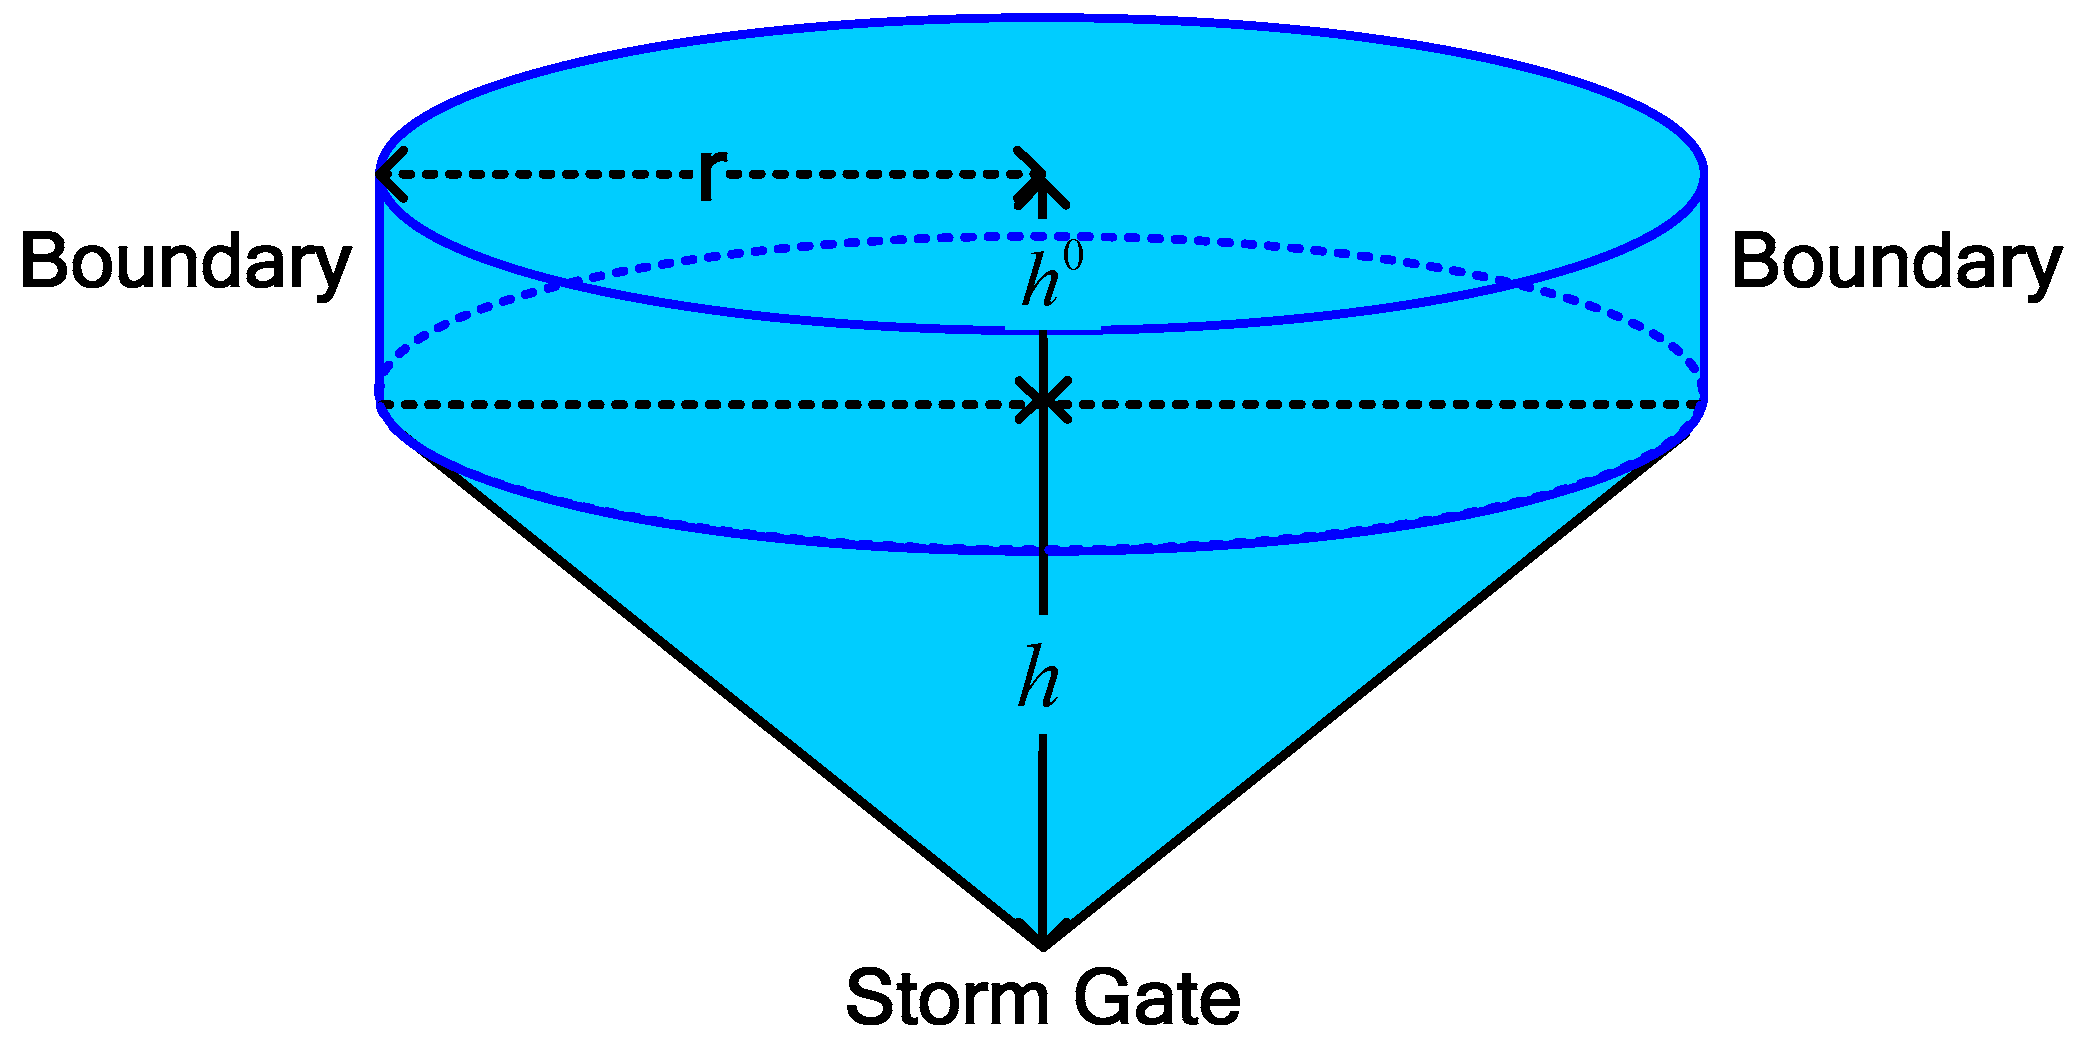
2.3. Filling Processes inside Each Calculation Cell
2.4. Spilling Processes between Calculation Cells
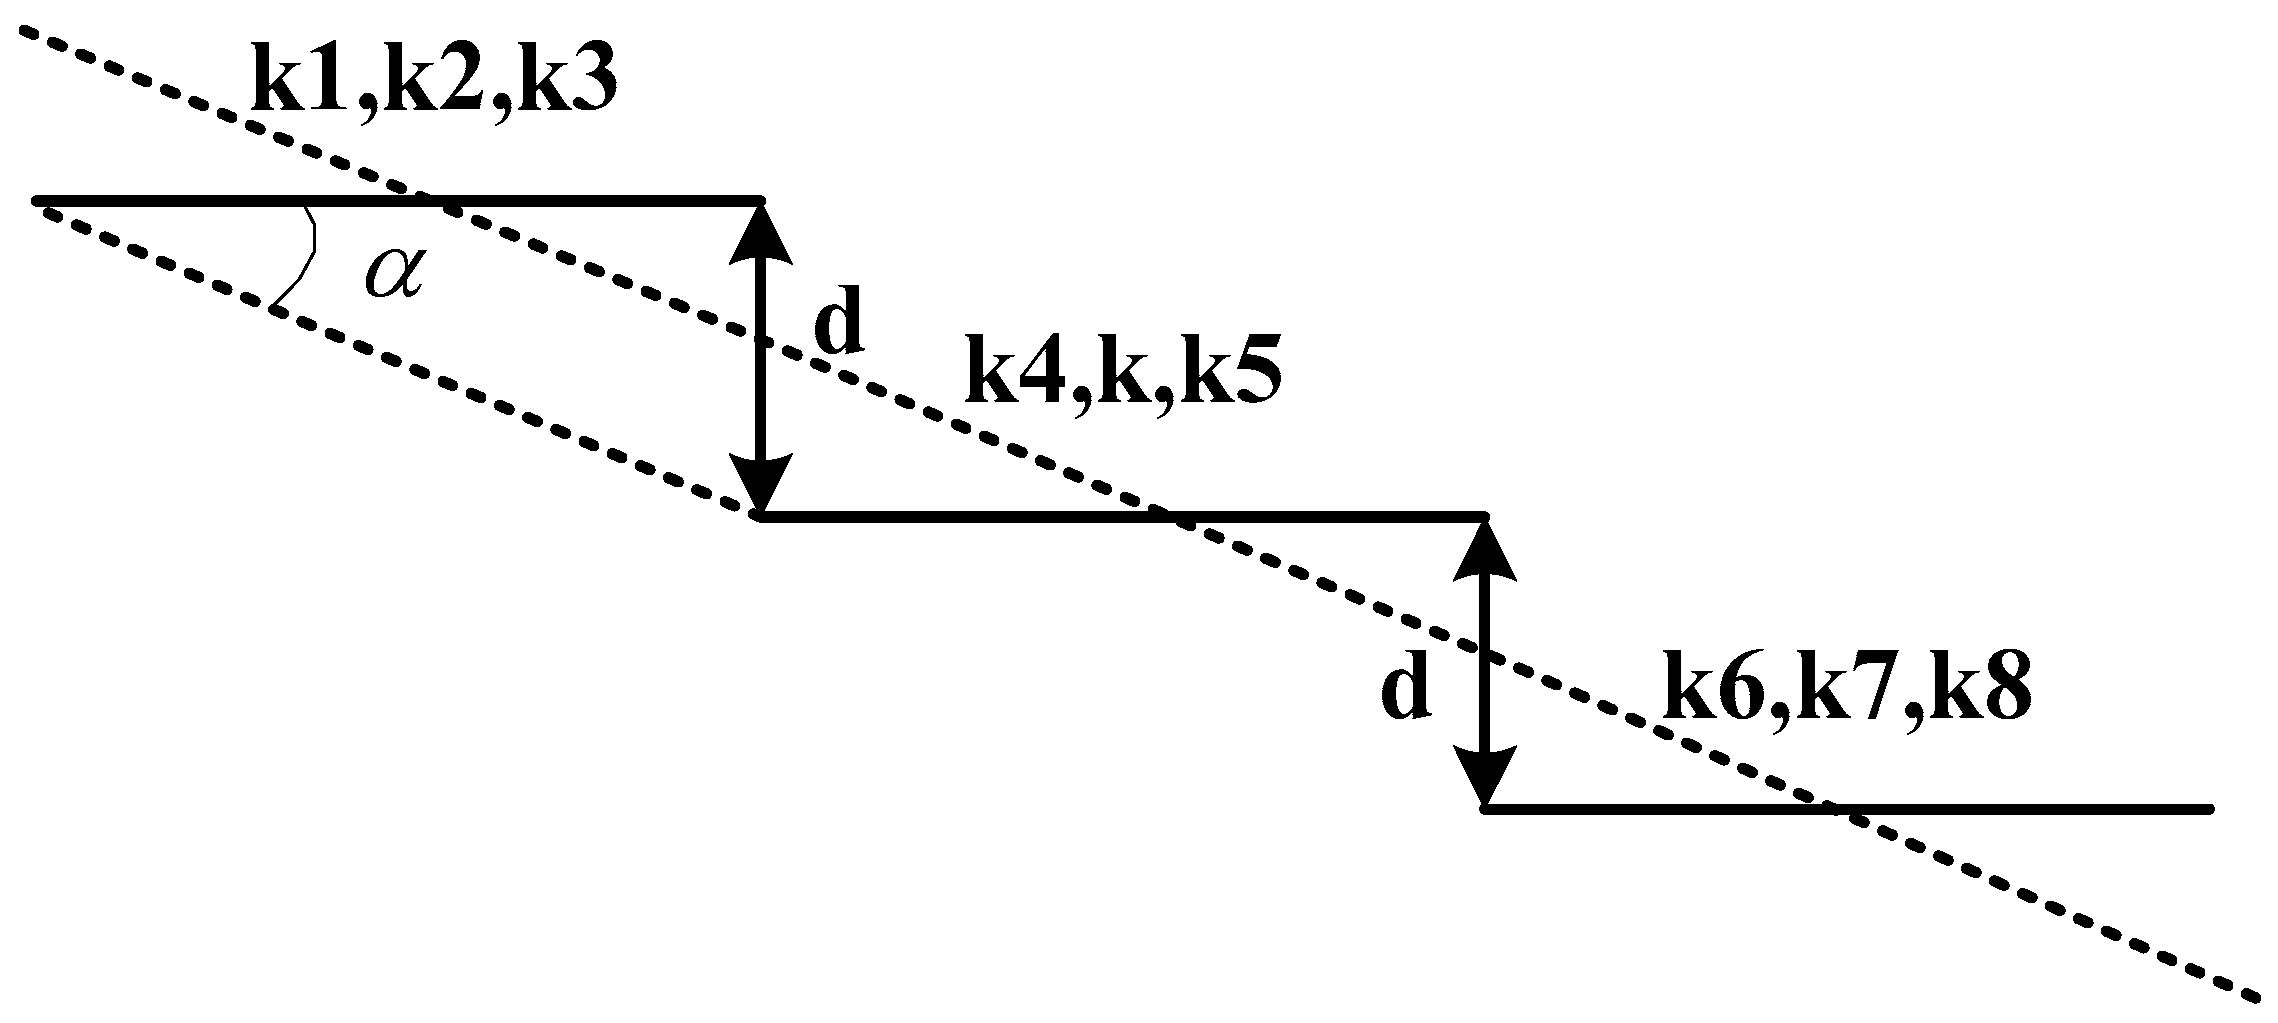
- (1)
- For a current calculation cell in an urban setting, let E be its mean elevation; the downward slope from the current cell to one of its adjacent cells can then be written as:where is the mean elevation of the adjacent cell. p and are the centre points of the current cell and the adjacent cell, respectively, and d is the distance between p and . If the coordinates of p and are (p.x, p.y) and (, ), d can be calculated according to the principle of Euclidean distance:
- (2)
- For each calculation cell adjacent to the current one, the downward slope is calculated and its value is recorded. Then, the adjacent cell with the maximum downward slope can be defined as the destination of the residual water.
- (3)
- For each normal cell in the study area, Steps (1) and (2) are used to find the flow direction of the spreading water.
- (4)
- For the current cell, if all of the adjacent cells satisfy , the current cell is a depression cell. When a depression cell has been entirely flooded, the residual water will not immediately spread to the other cells but will accumulate above the inundation cone until the water level is higher than the mean elevation of any neighbour cell that has not yet been entirely flooded.
3. Case Study
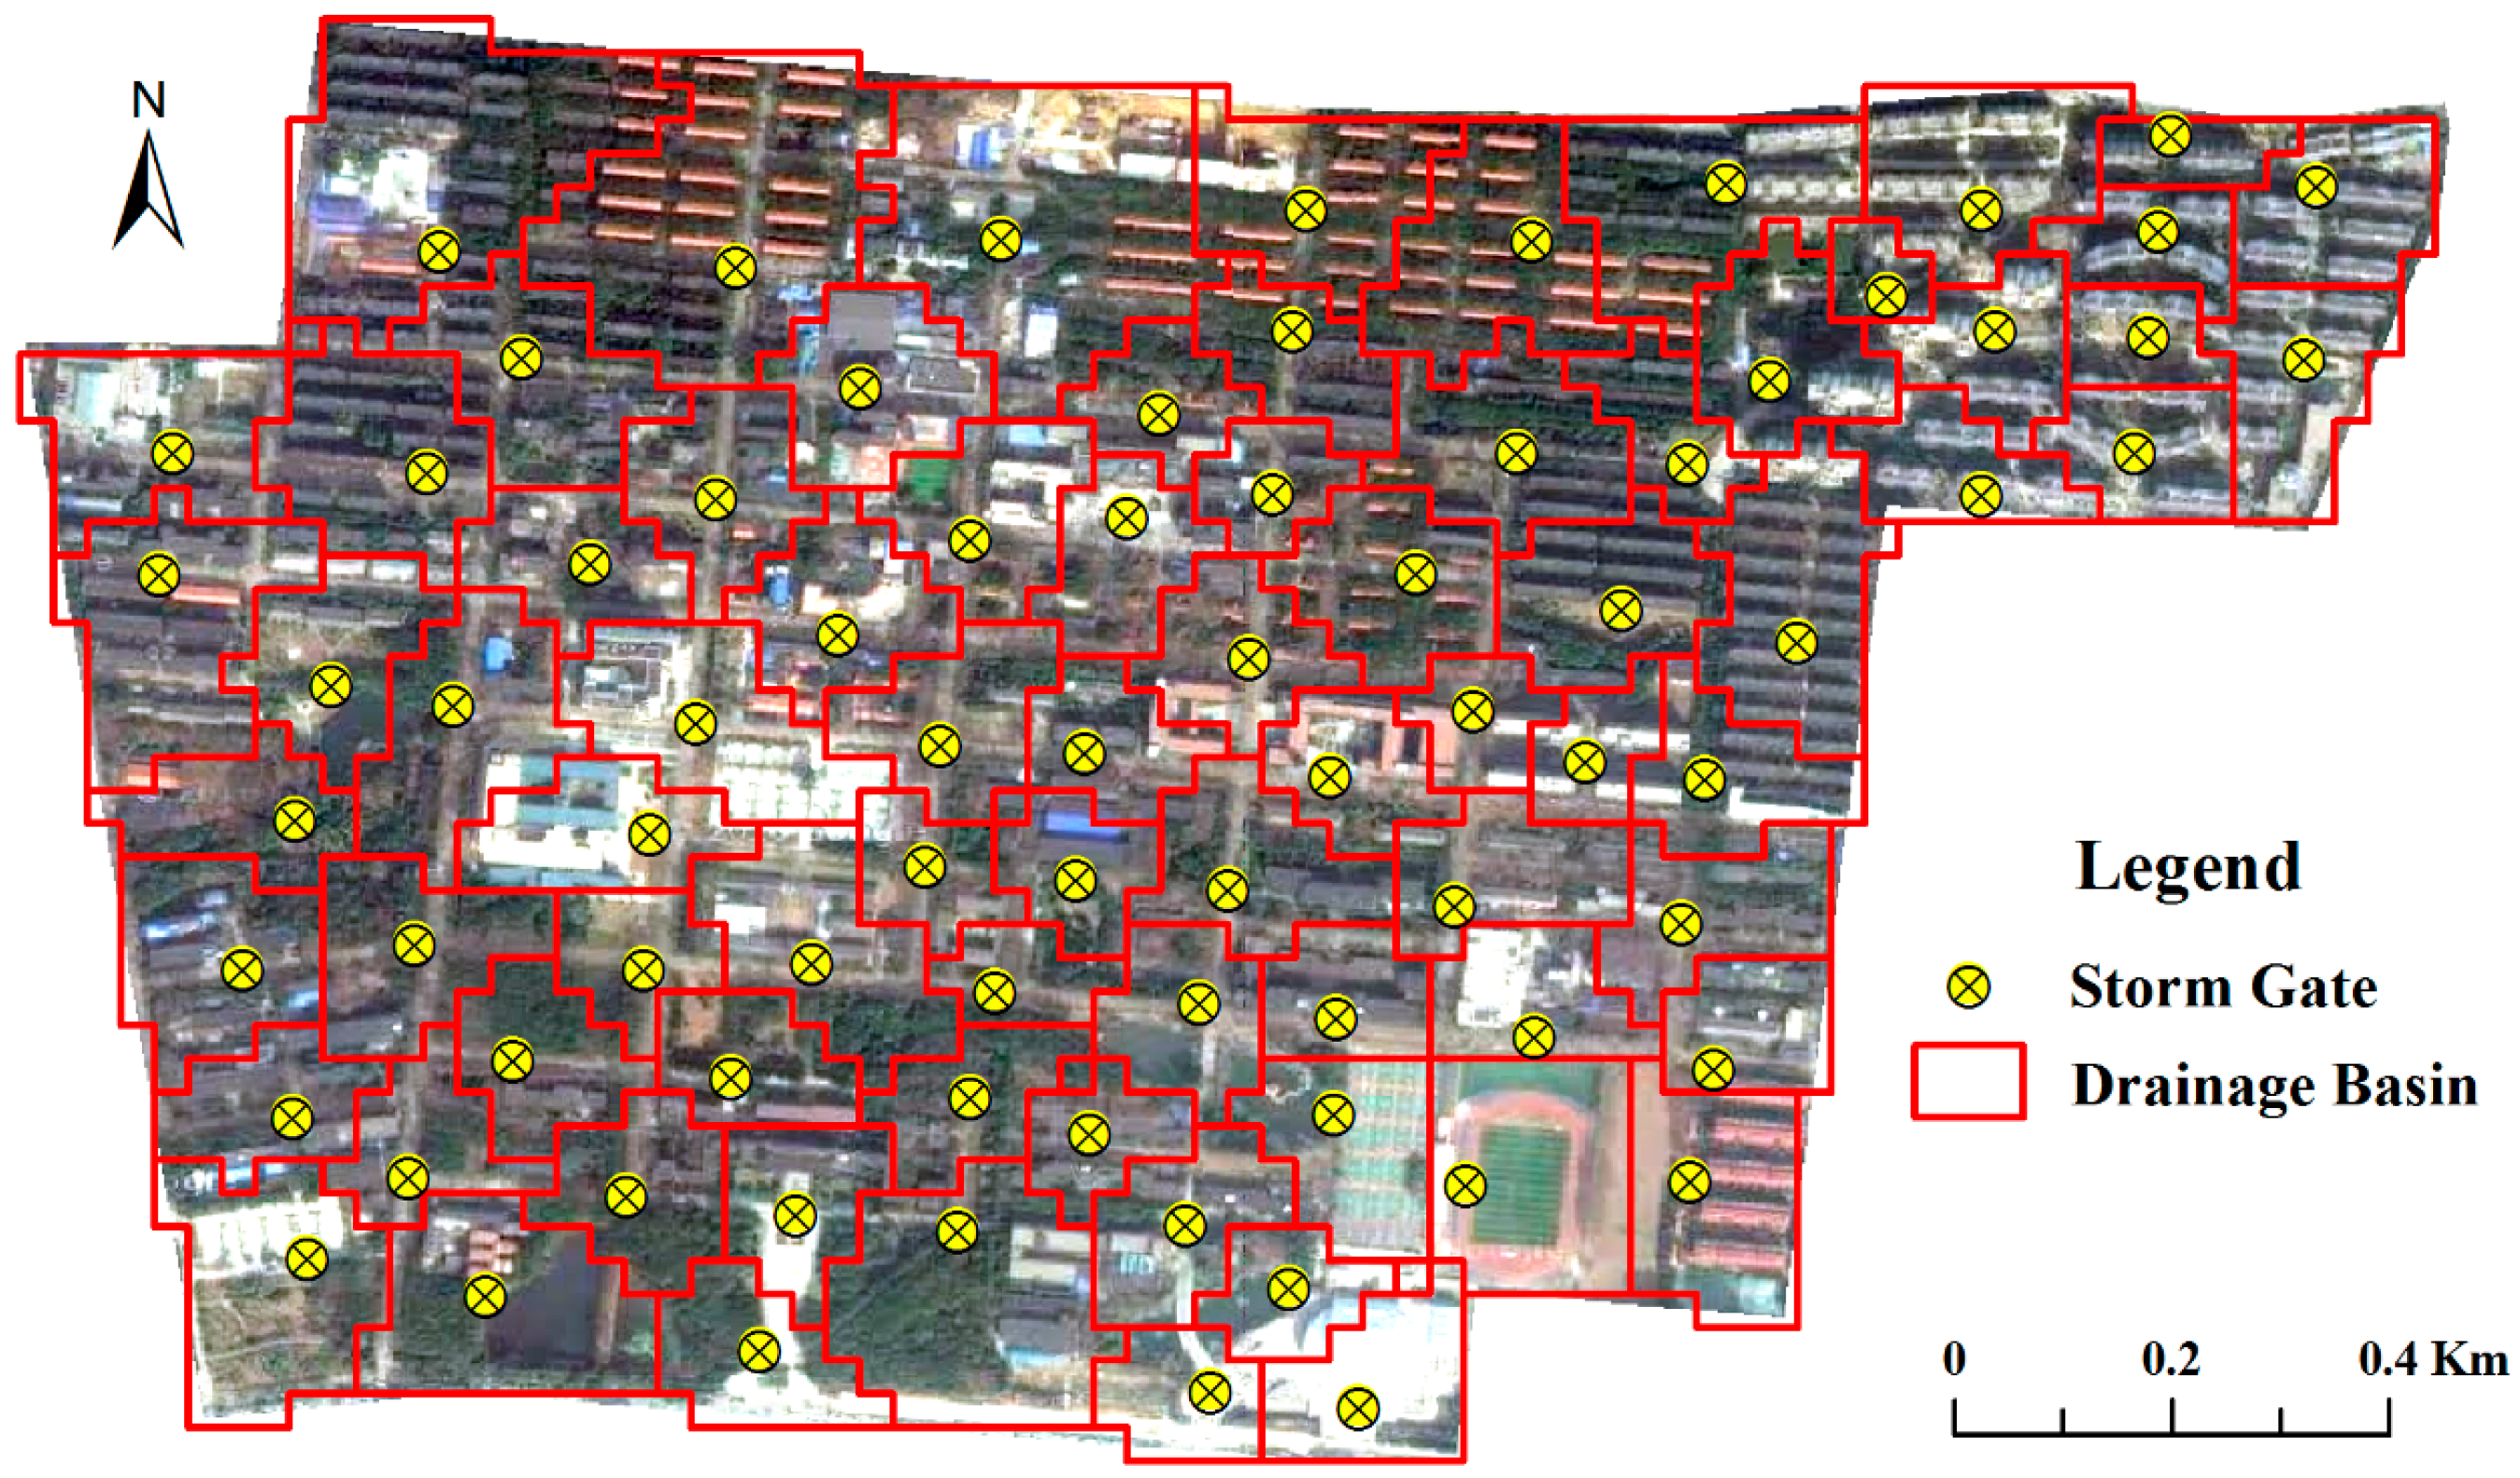
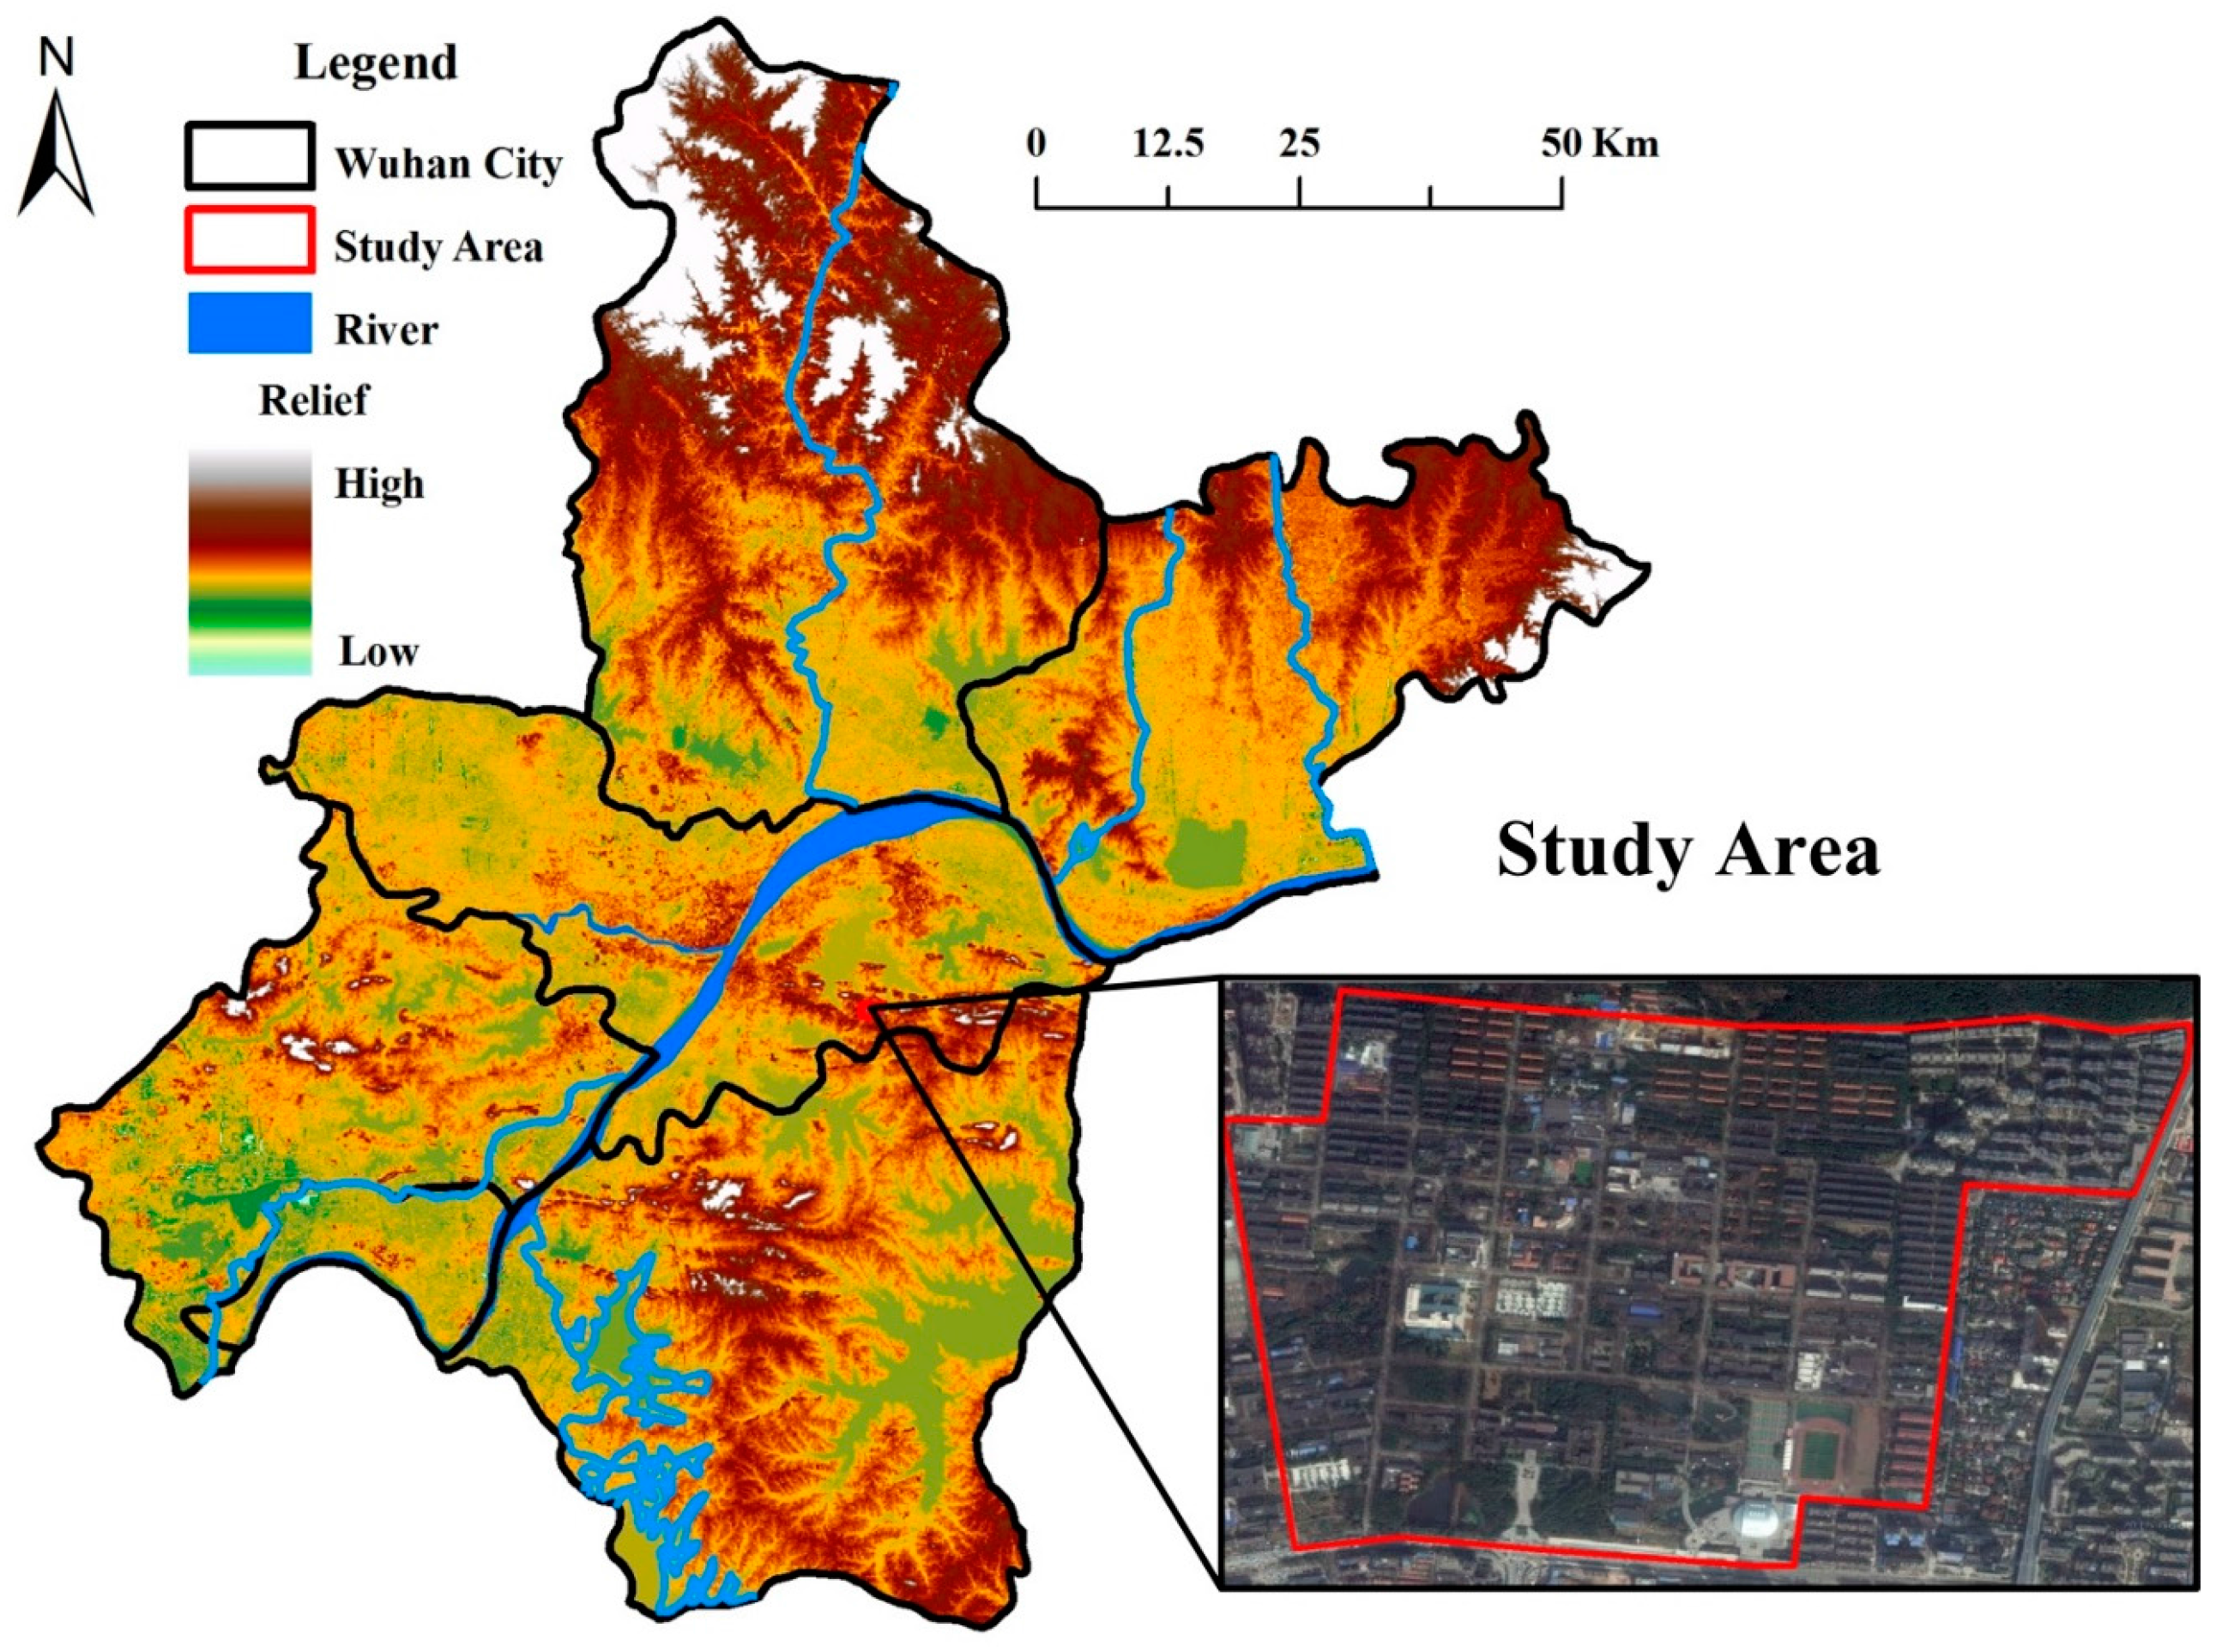
3.1. Study Area
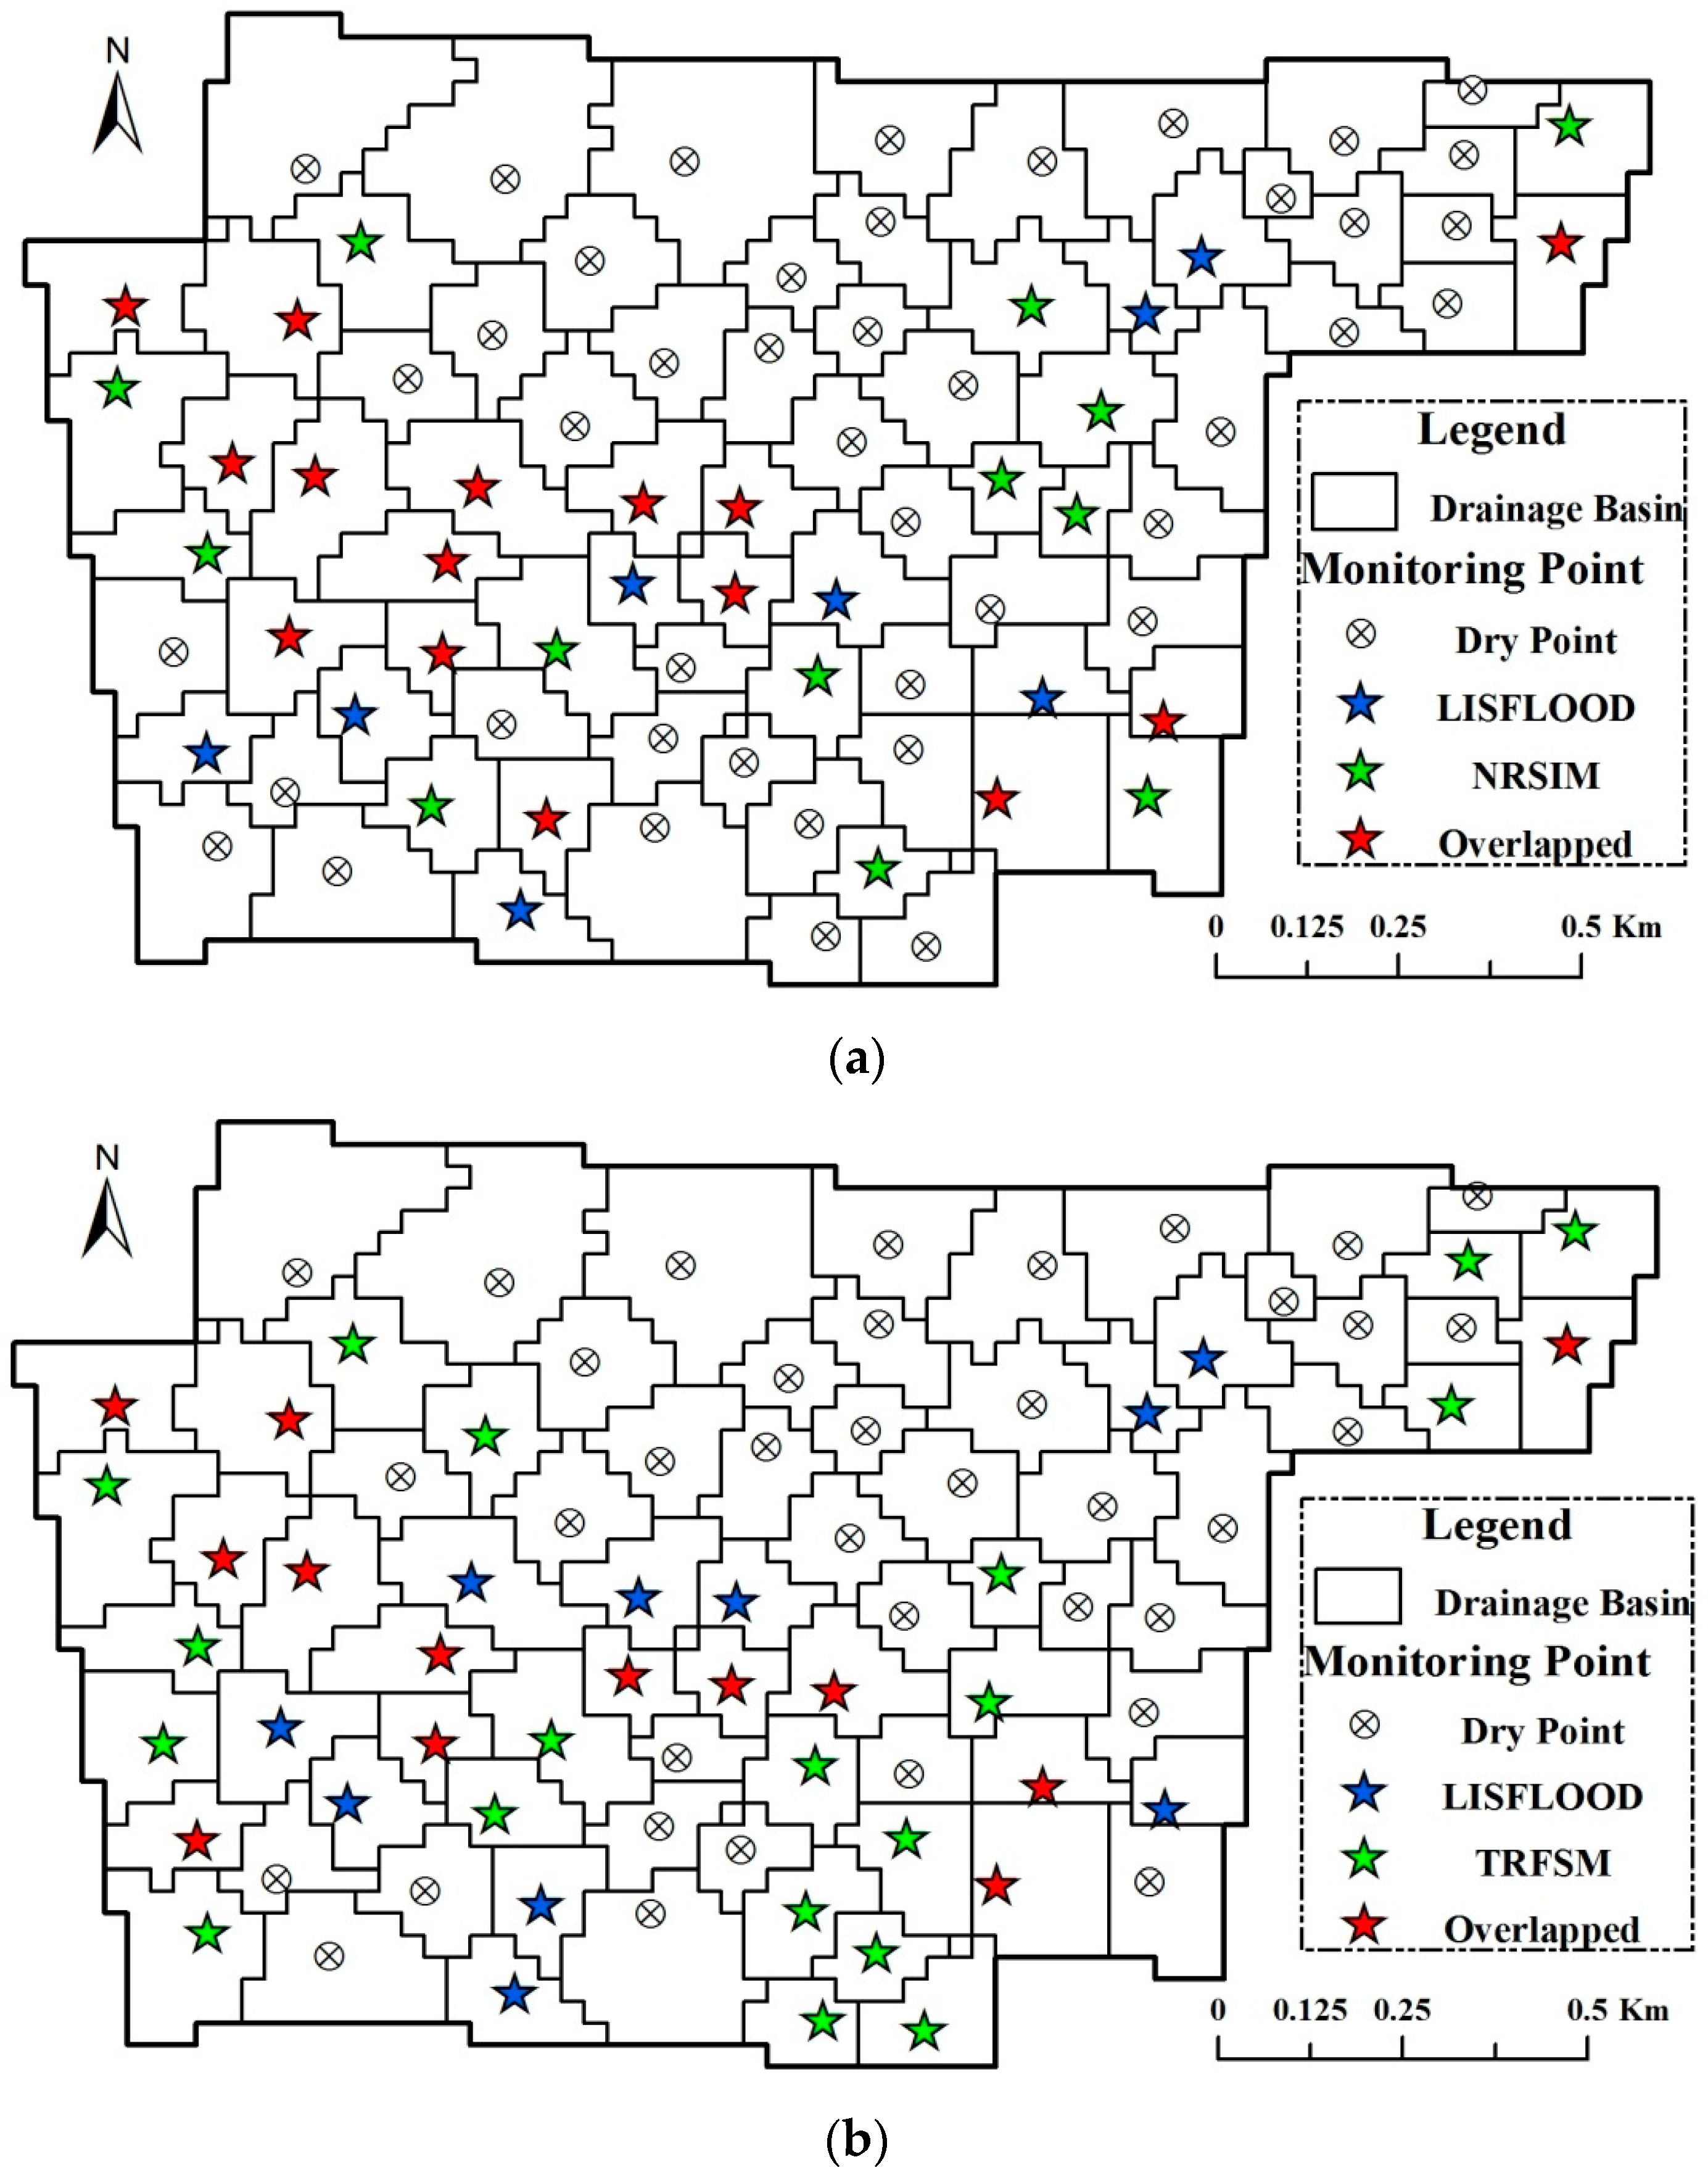
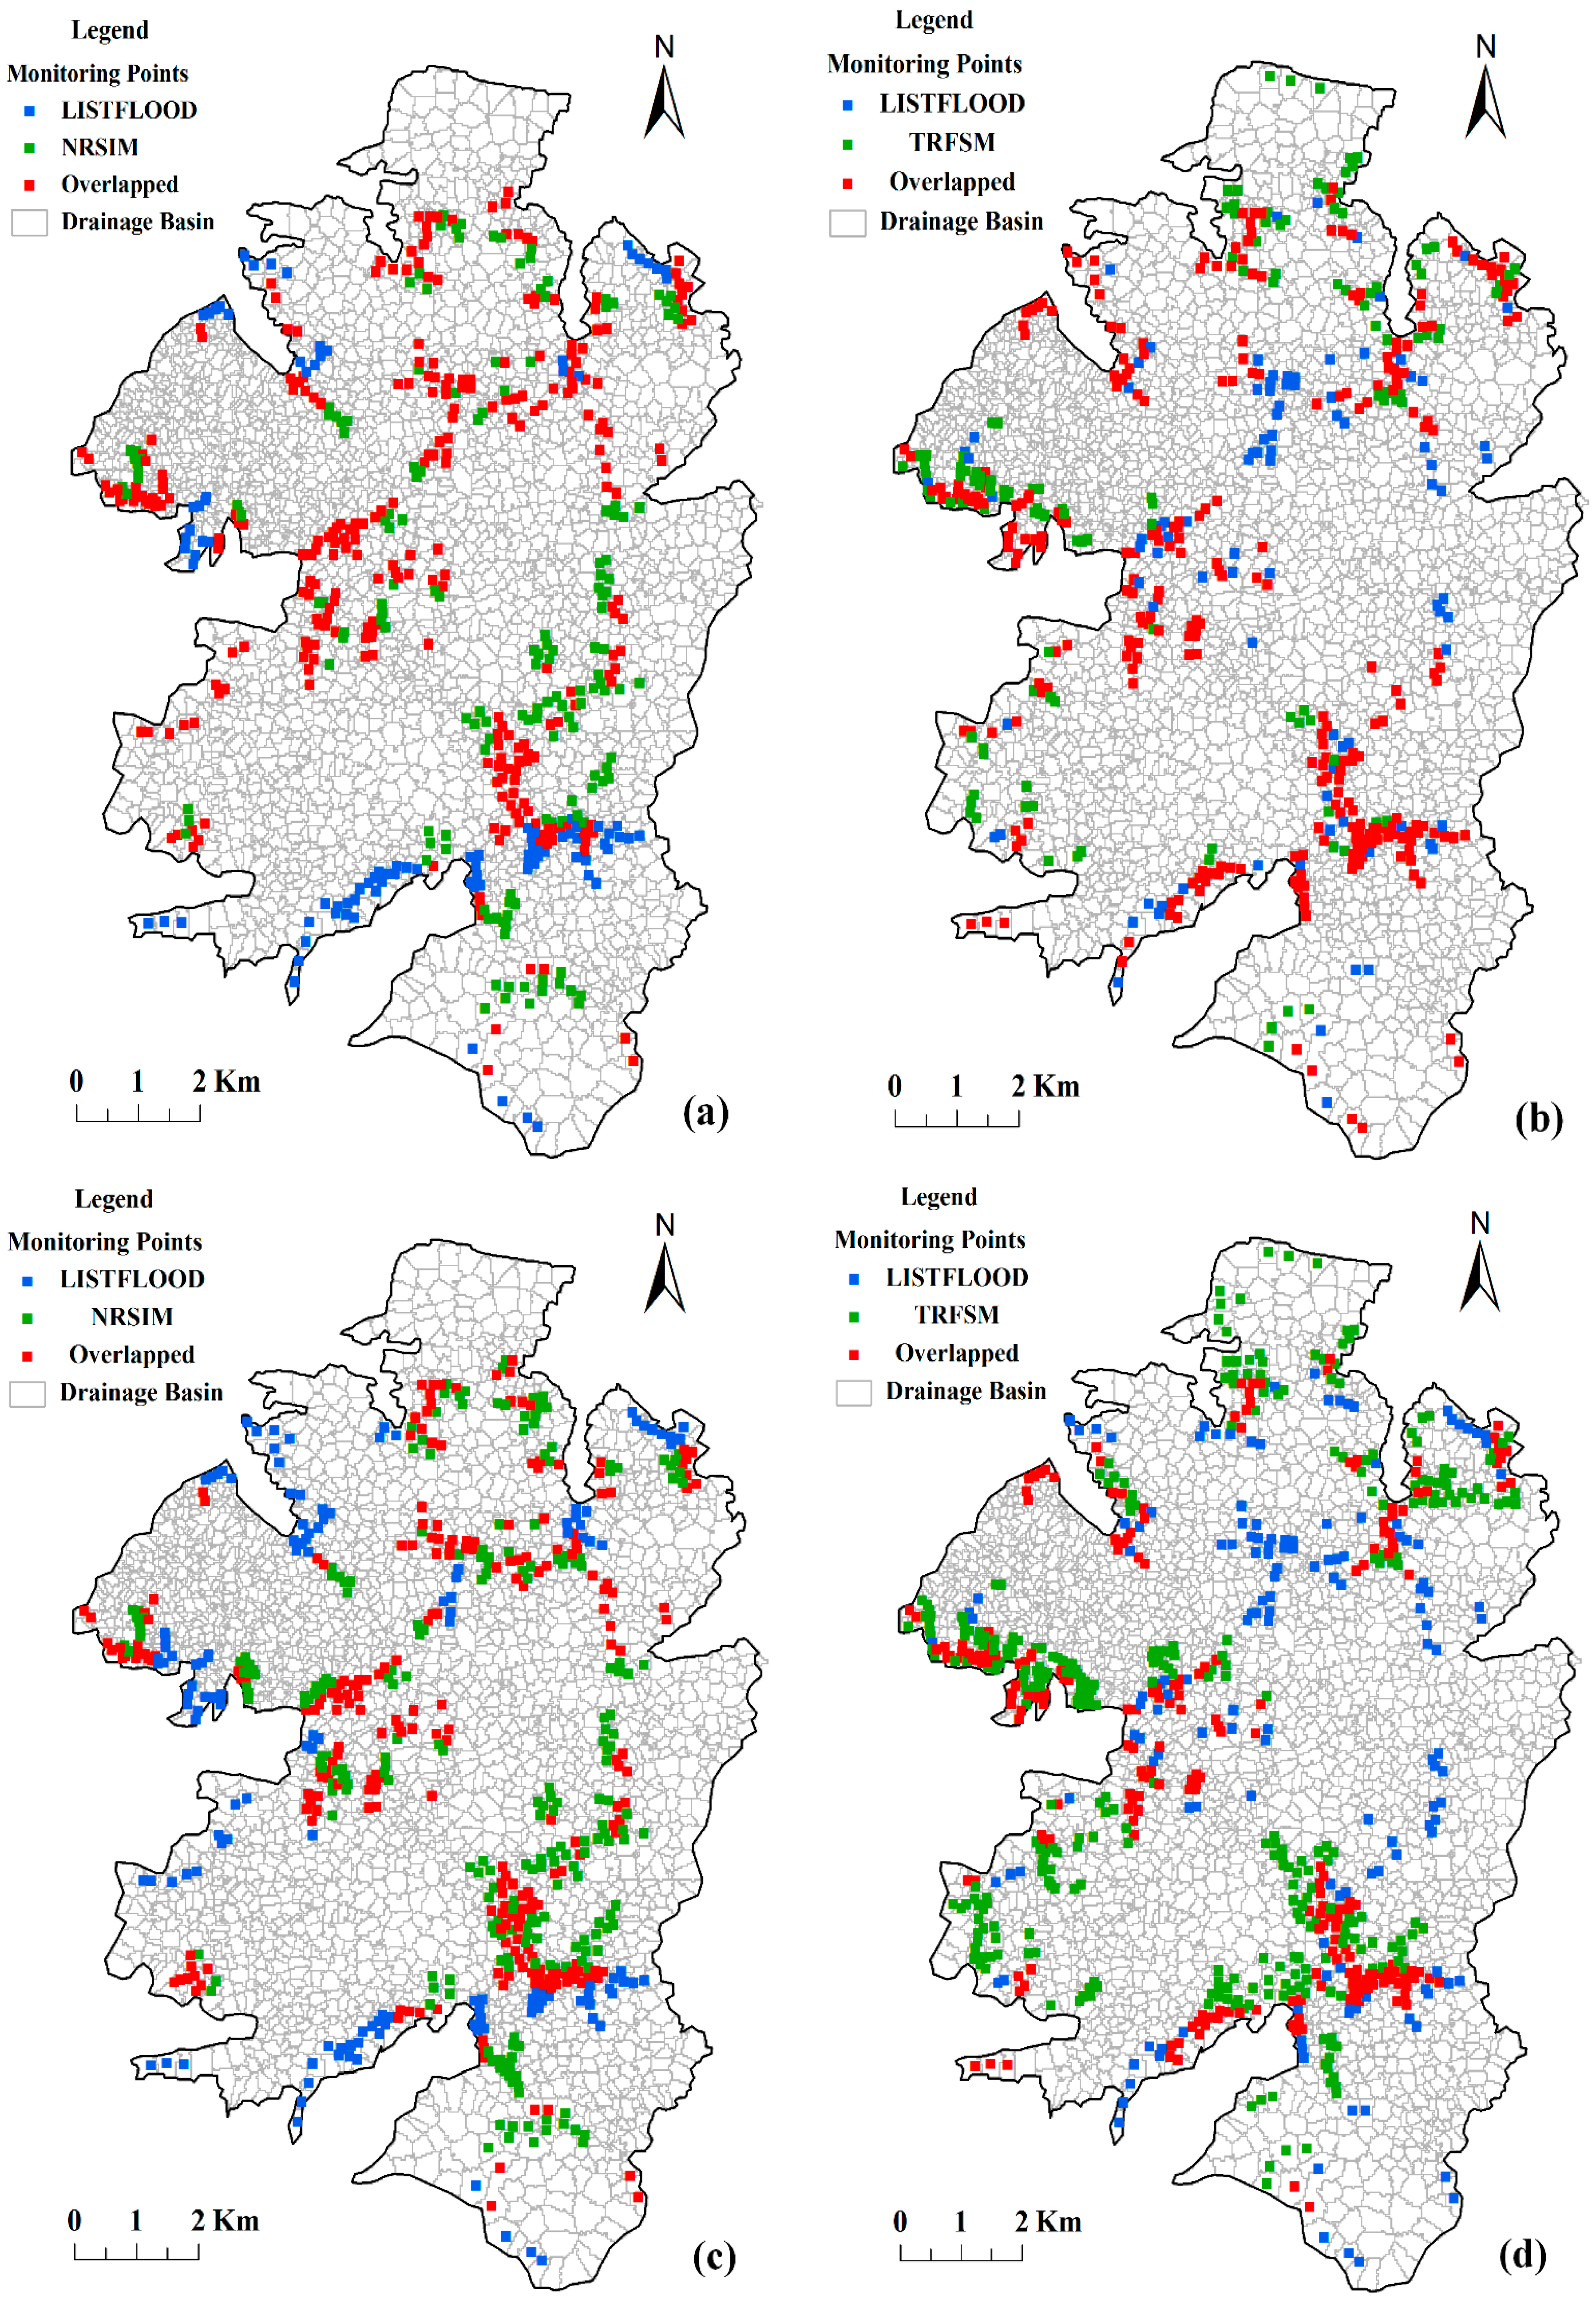
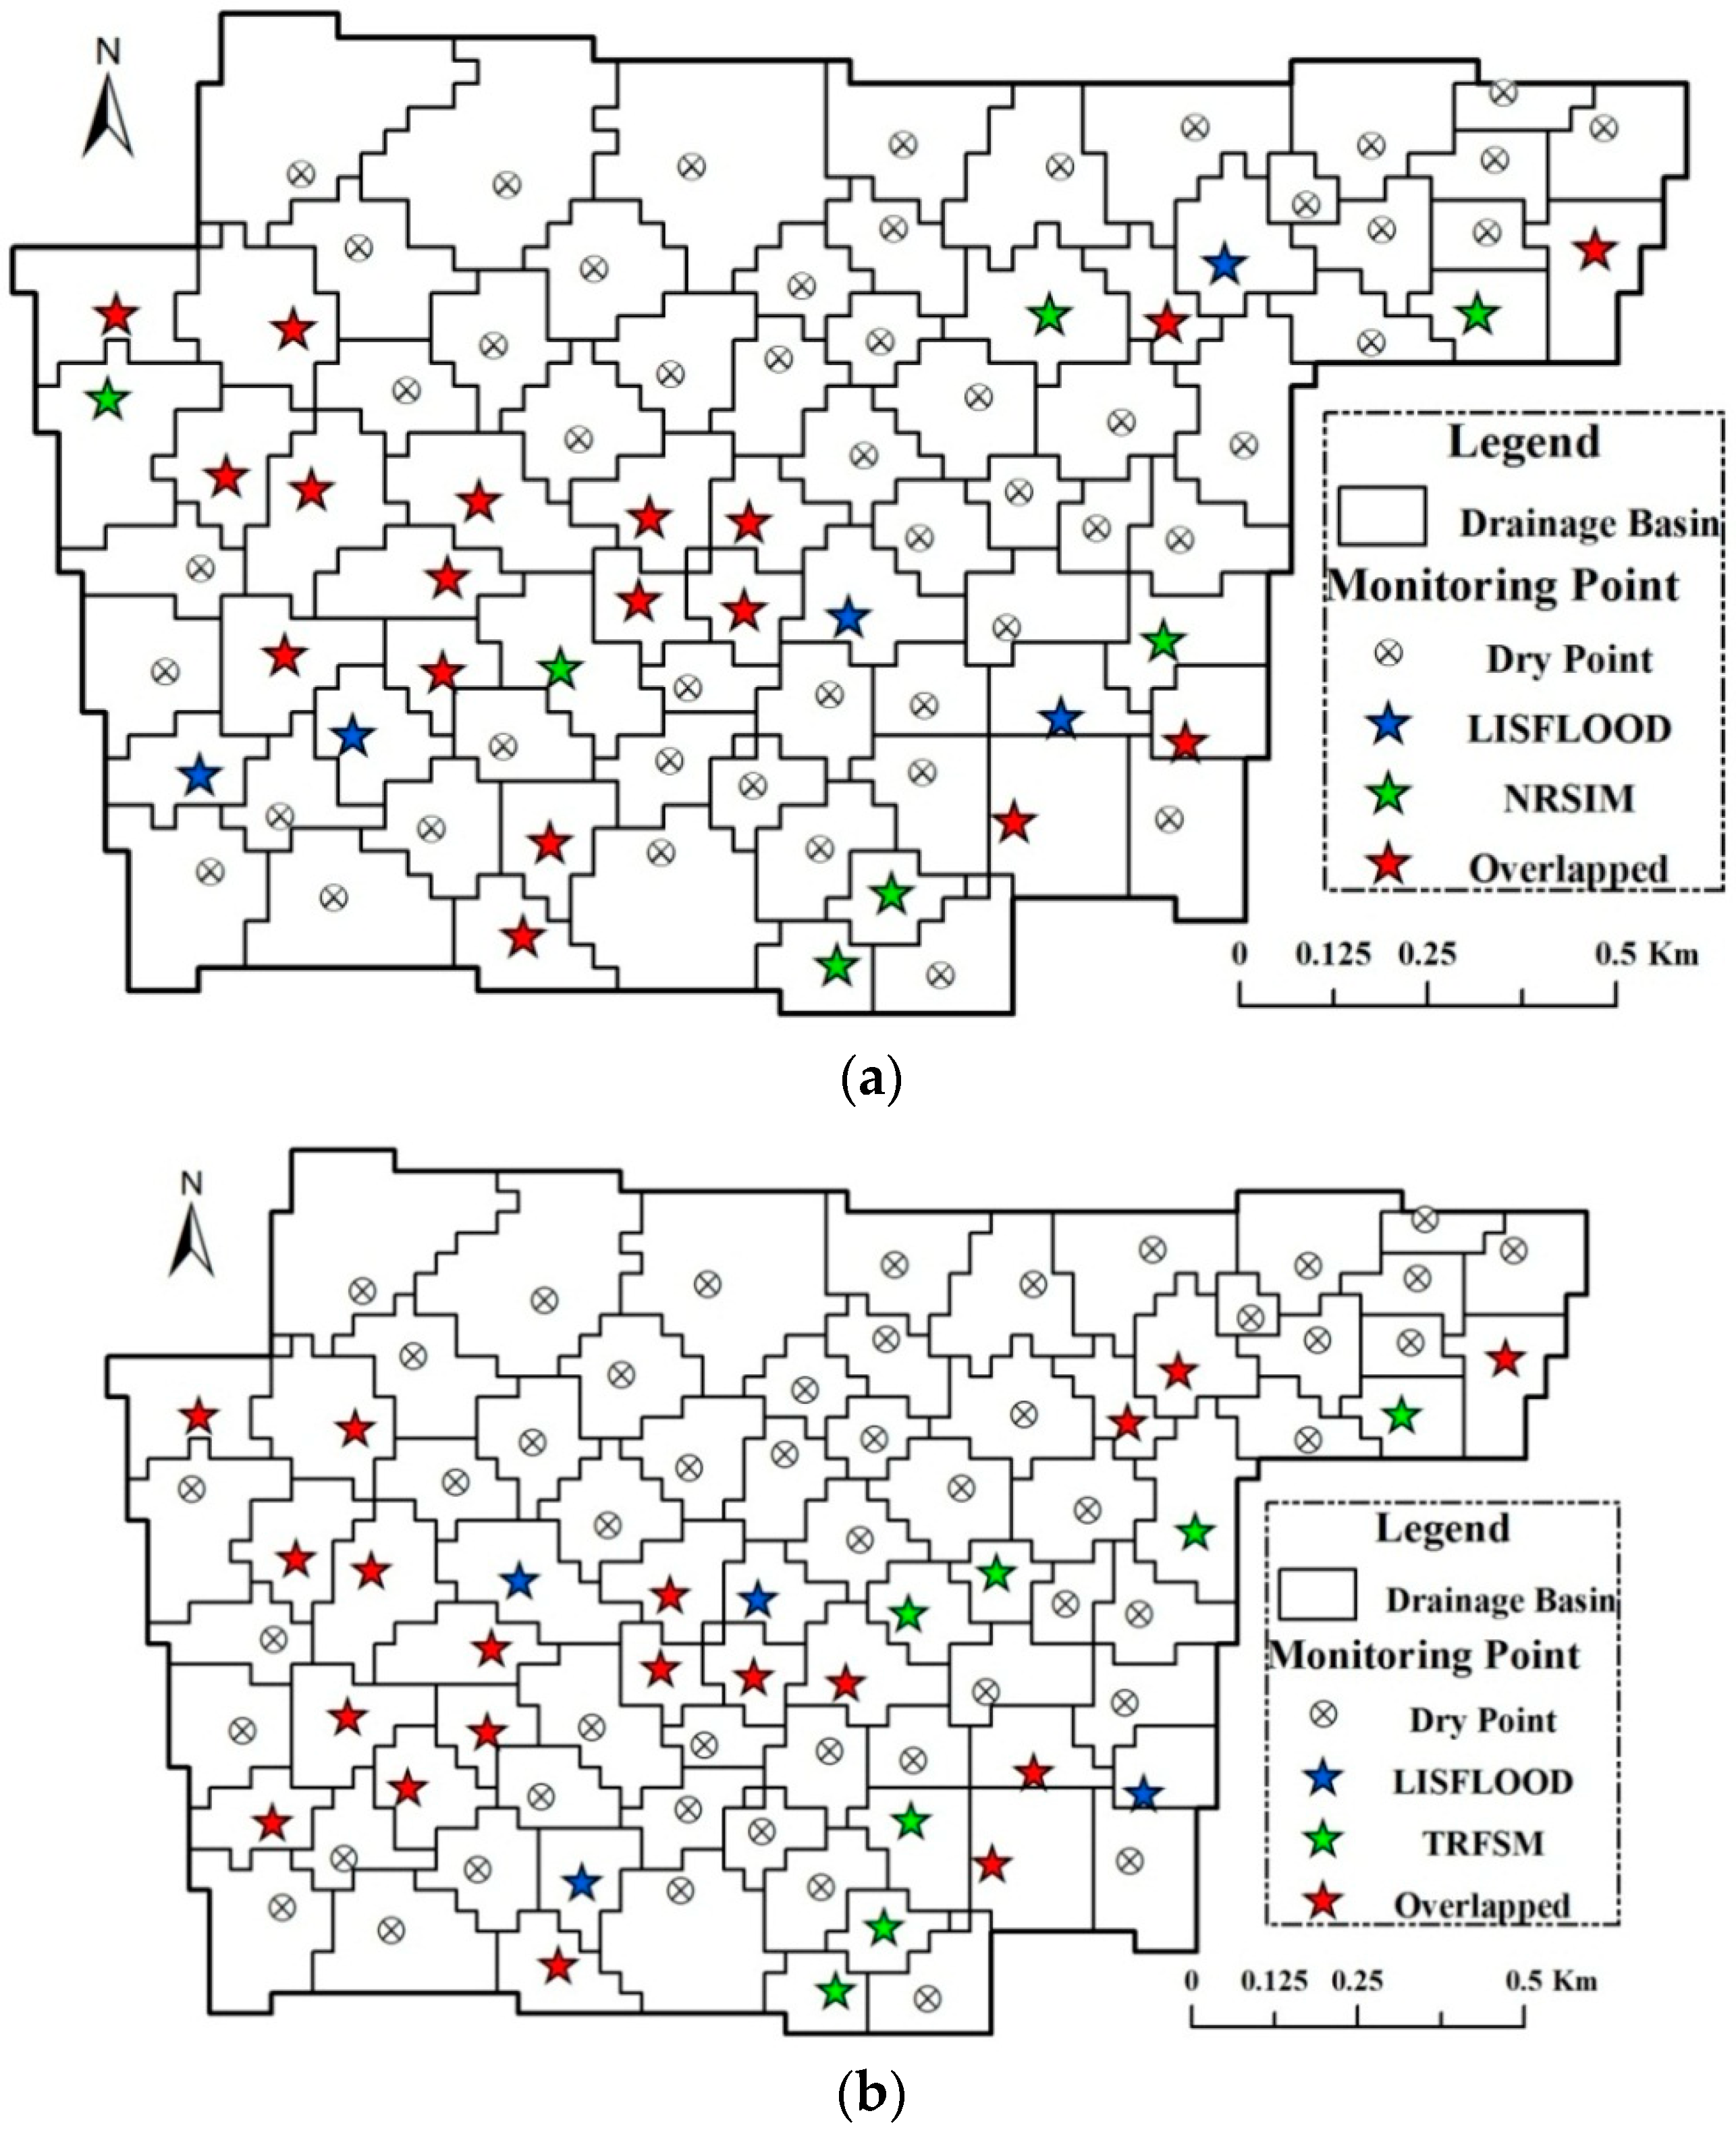
3.2. Model Validation
- (1)
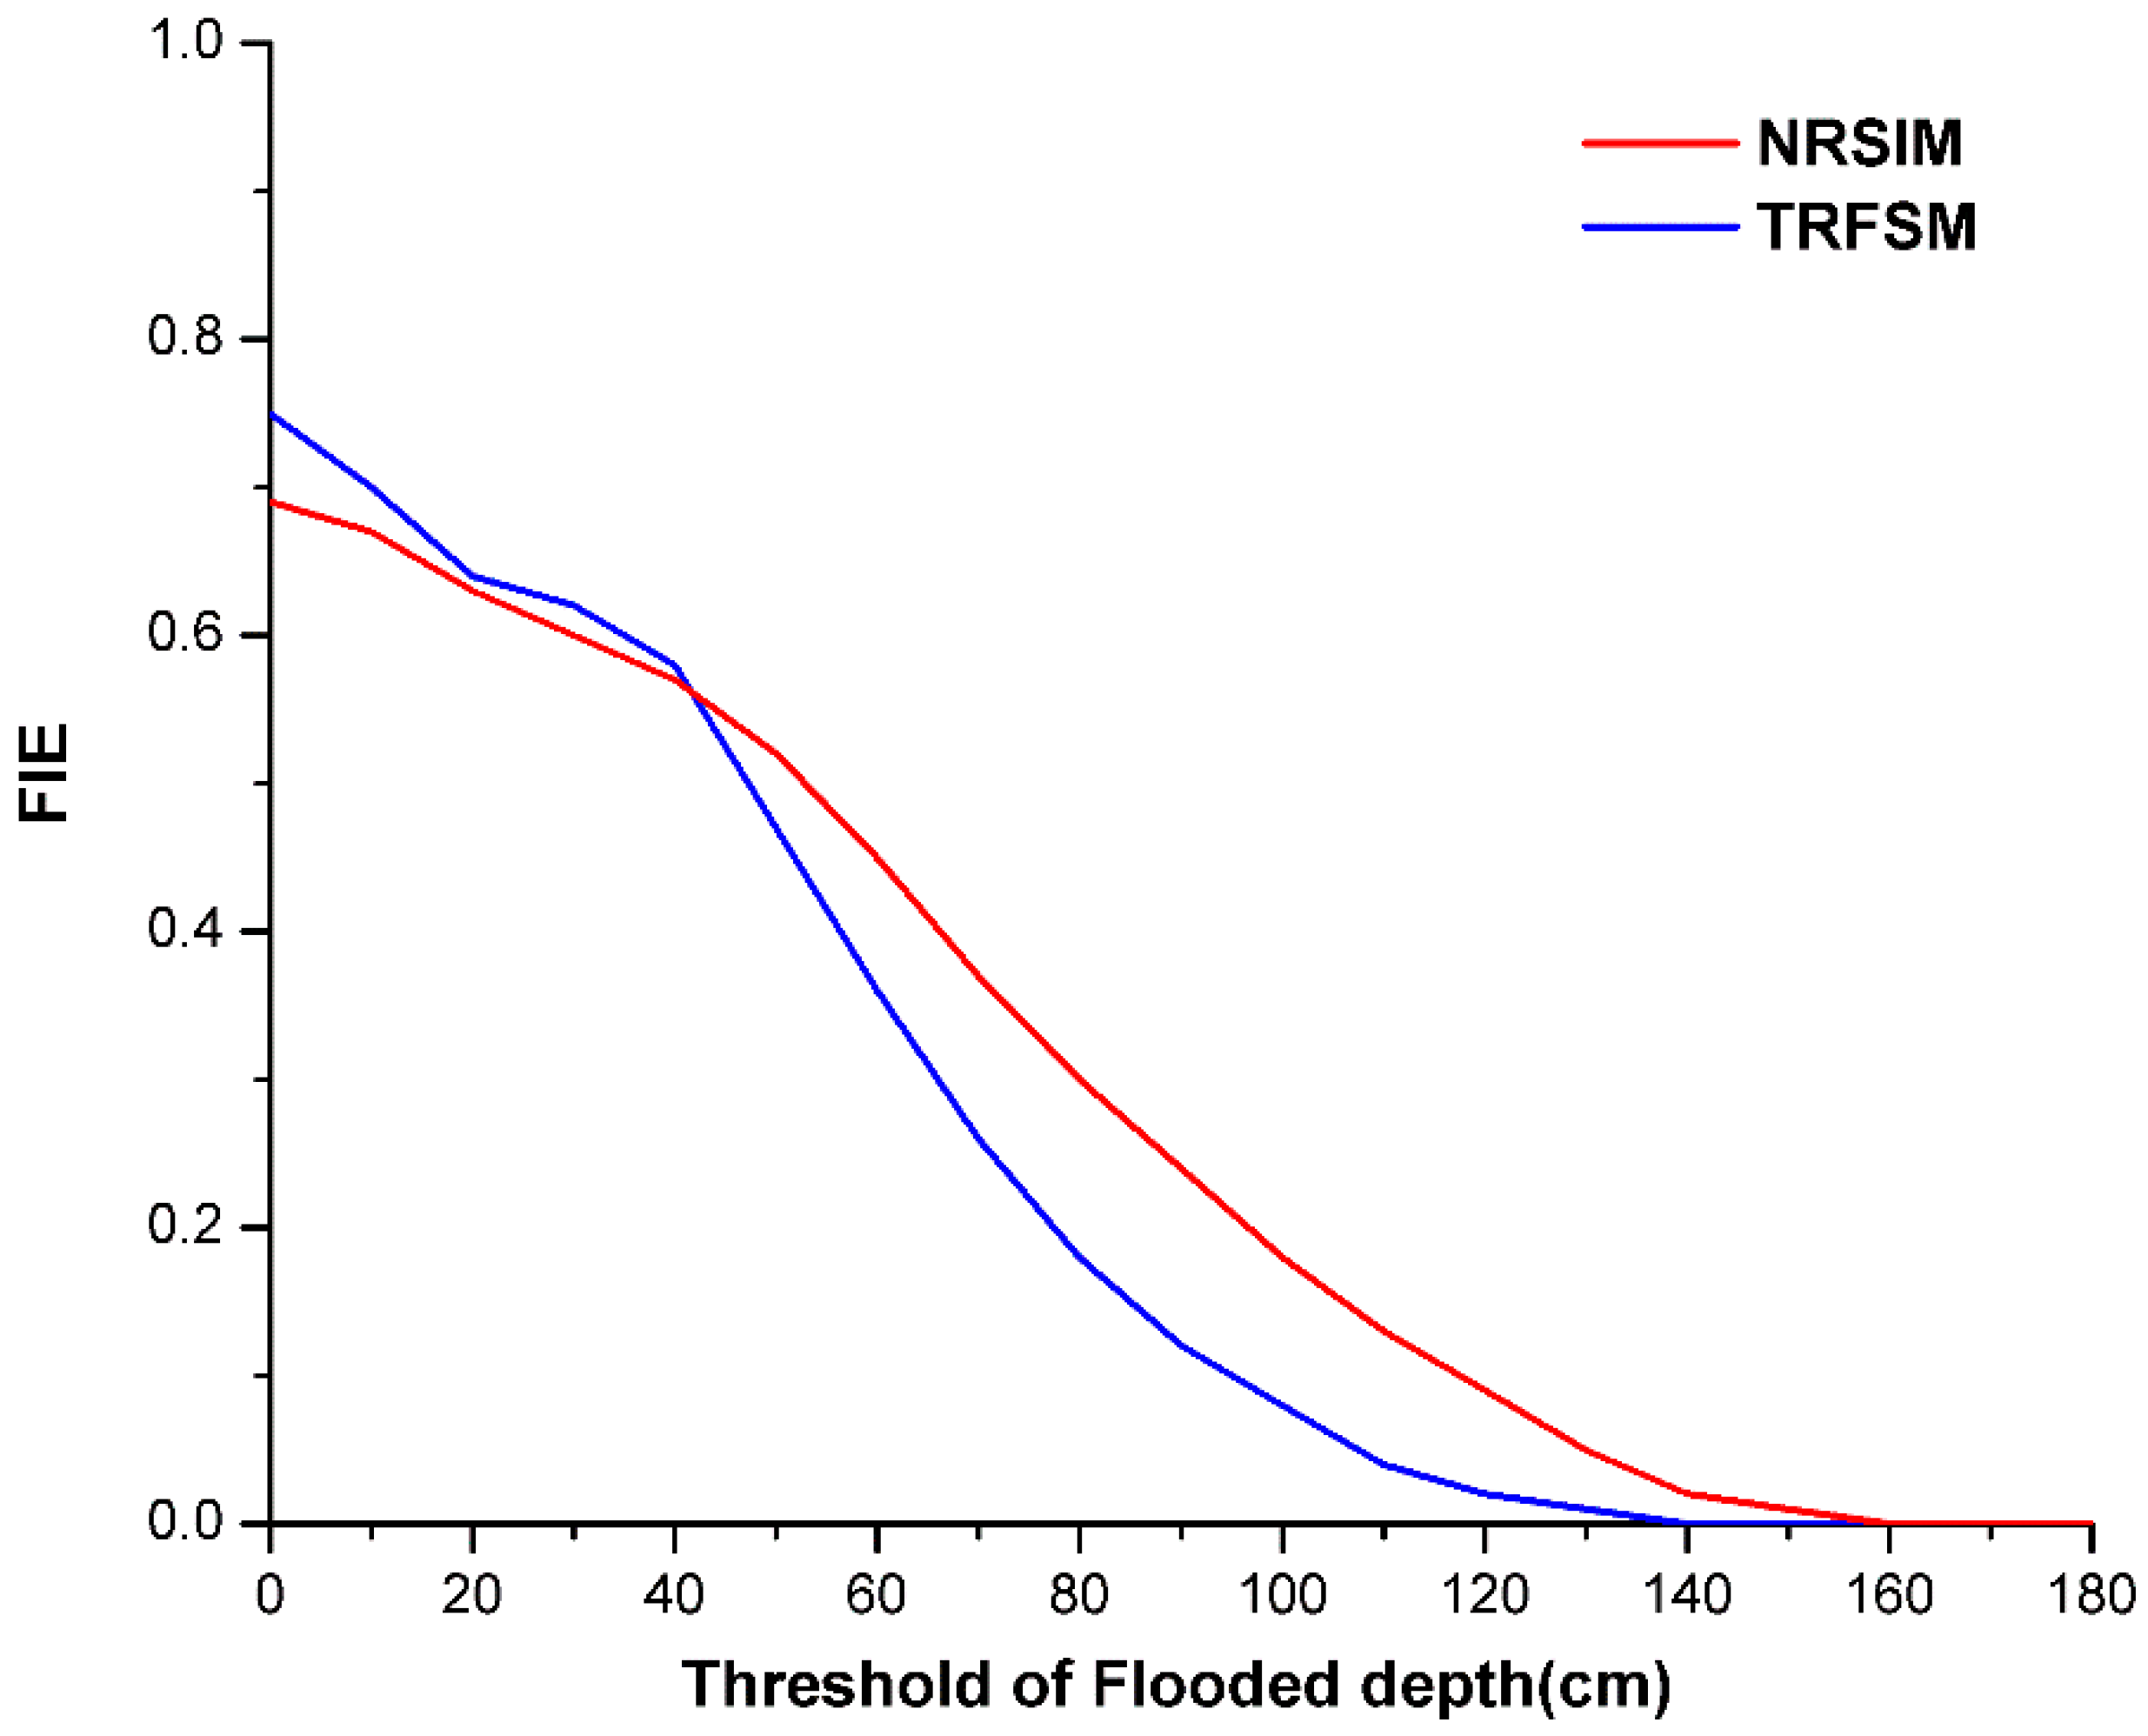
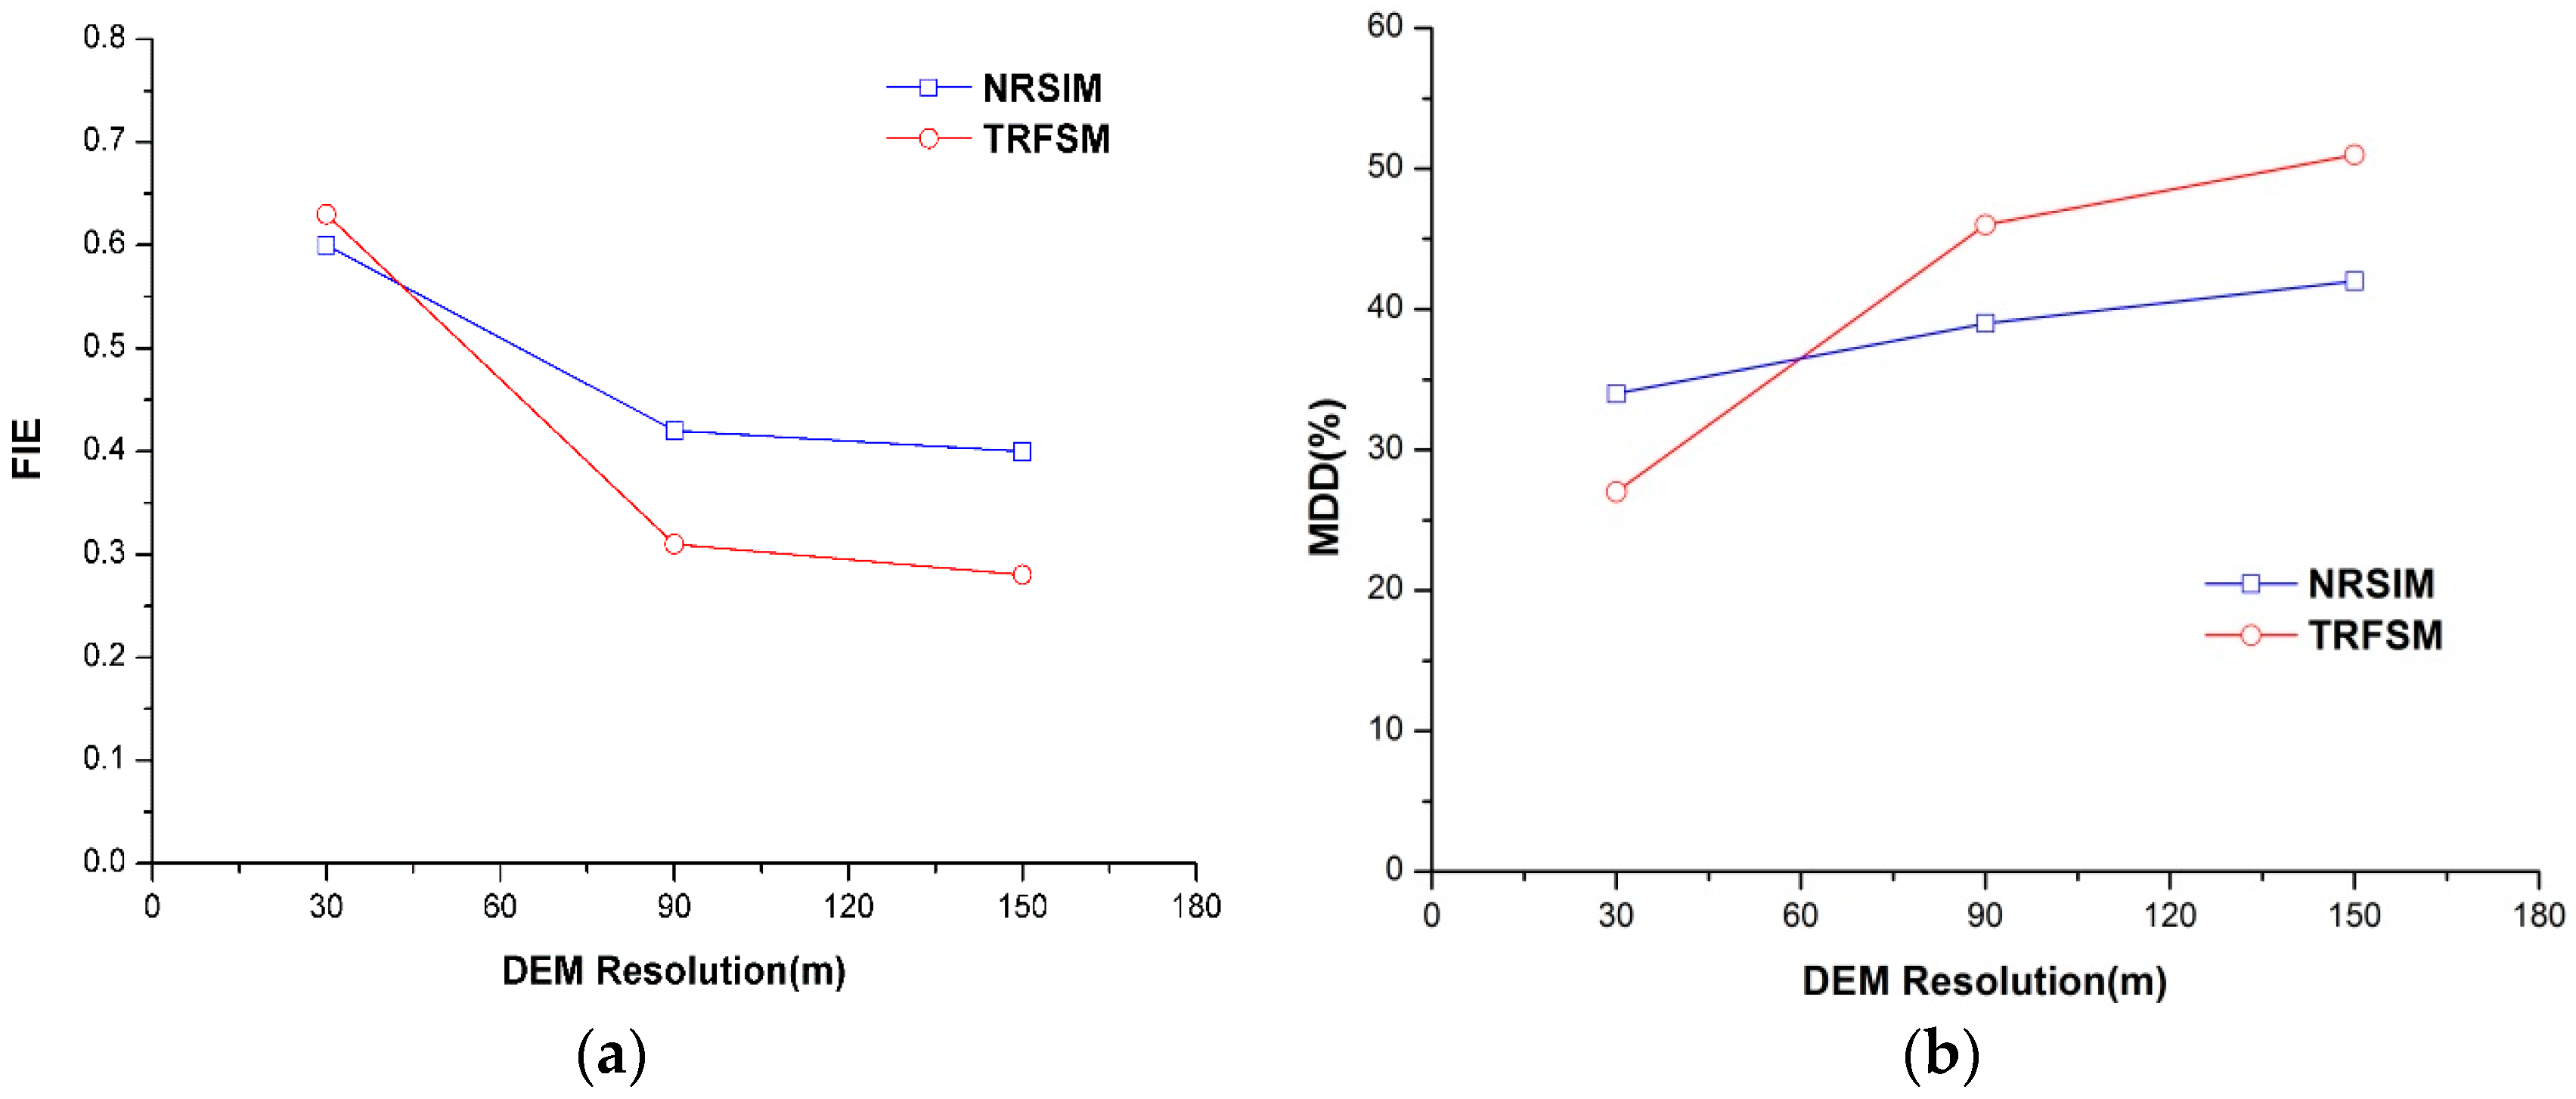
- Fit indicator of inundation extent (FIE).where No is the number of overlapping monitoring points that were simulated as flooded points by both models, Nt is the number of monitoring points flooded in the testing model (NRSIM or TRFSM) but dry in the LISFLOOD model, and Nl is the number of monitoring points that were dry in the testing model but flooded in the LISFLOOD model. Apparently, the value range of FIE is from 0 to 1, and a higher FIE represents a better performance of inundation extent simulation.
- (2)
- Mean depth deviation (MDD) is the mean value of depth deviations (DD) for all overlapping monitoring points. For each point, DD was represented as the relative error between simulated depth and reference depth provided by LISFLOOD:where Dt is the maximum depth value simulated by the testing model (NRSIM or TRFSM) and Dl is the maximum depth value simulated by LISFLOOD. A smaller MDD represents a better performance of the maximum inundation depth simulation.
4. Results and Discussion
4.1. Inundation Simulation for the Campus of HUST
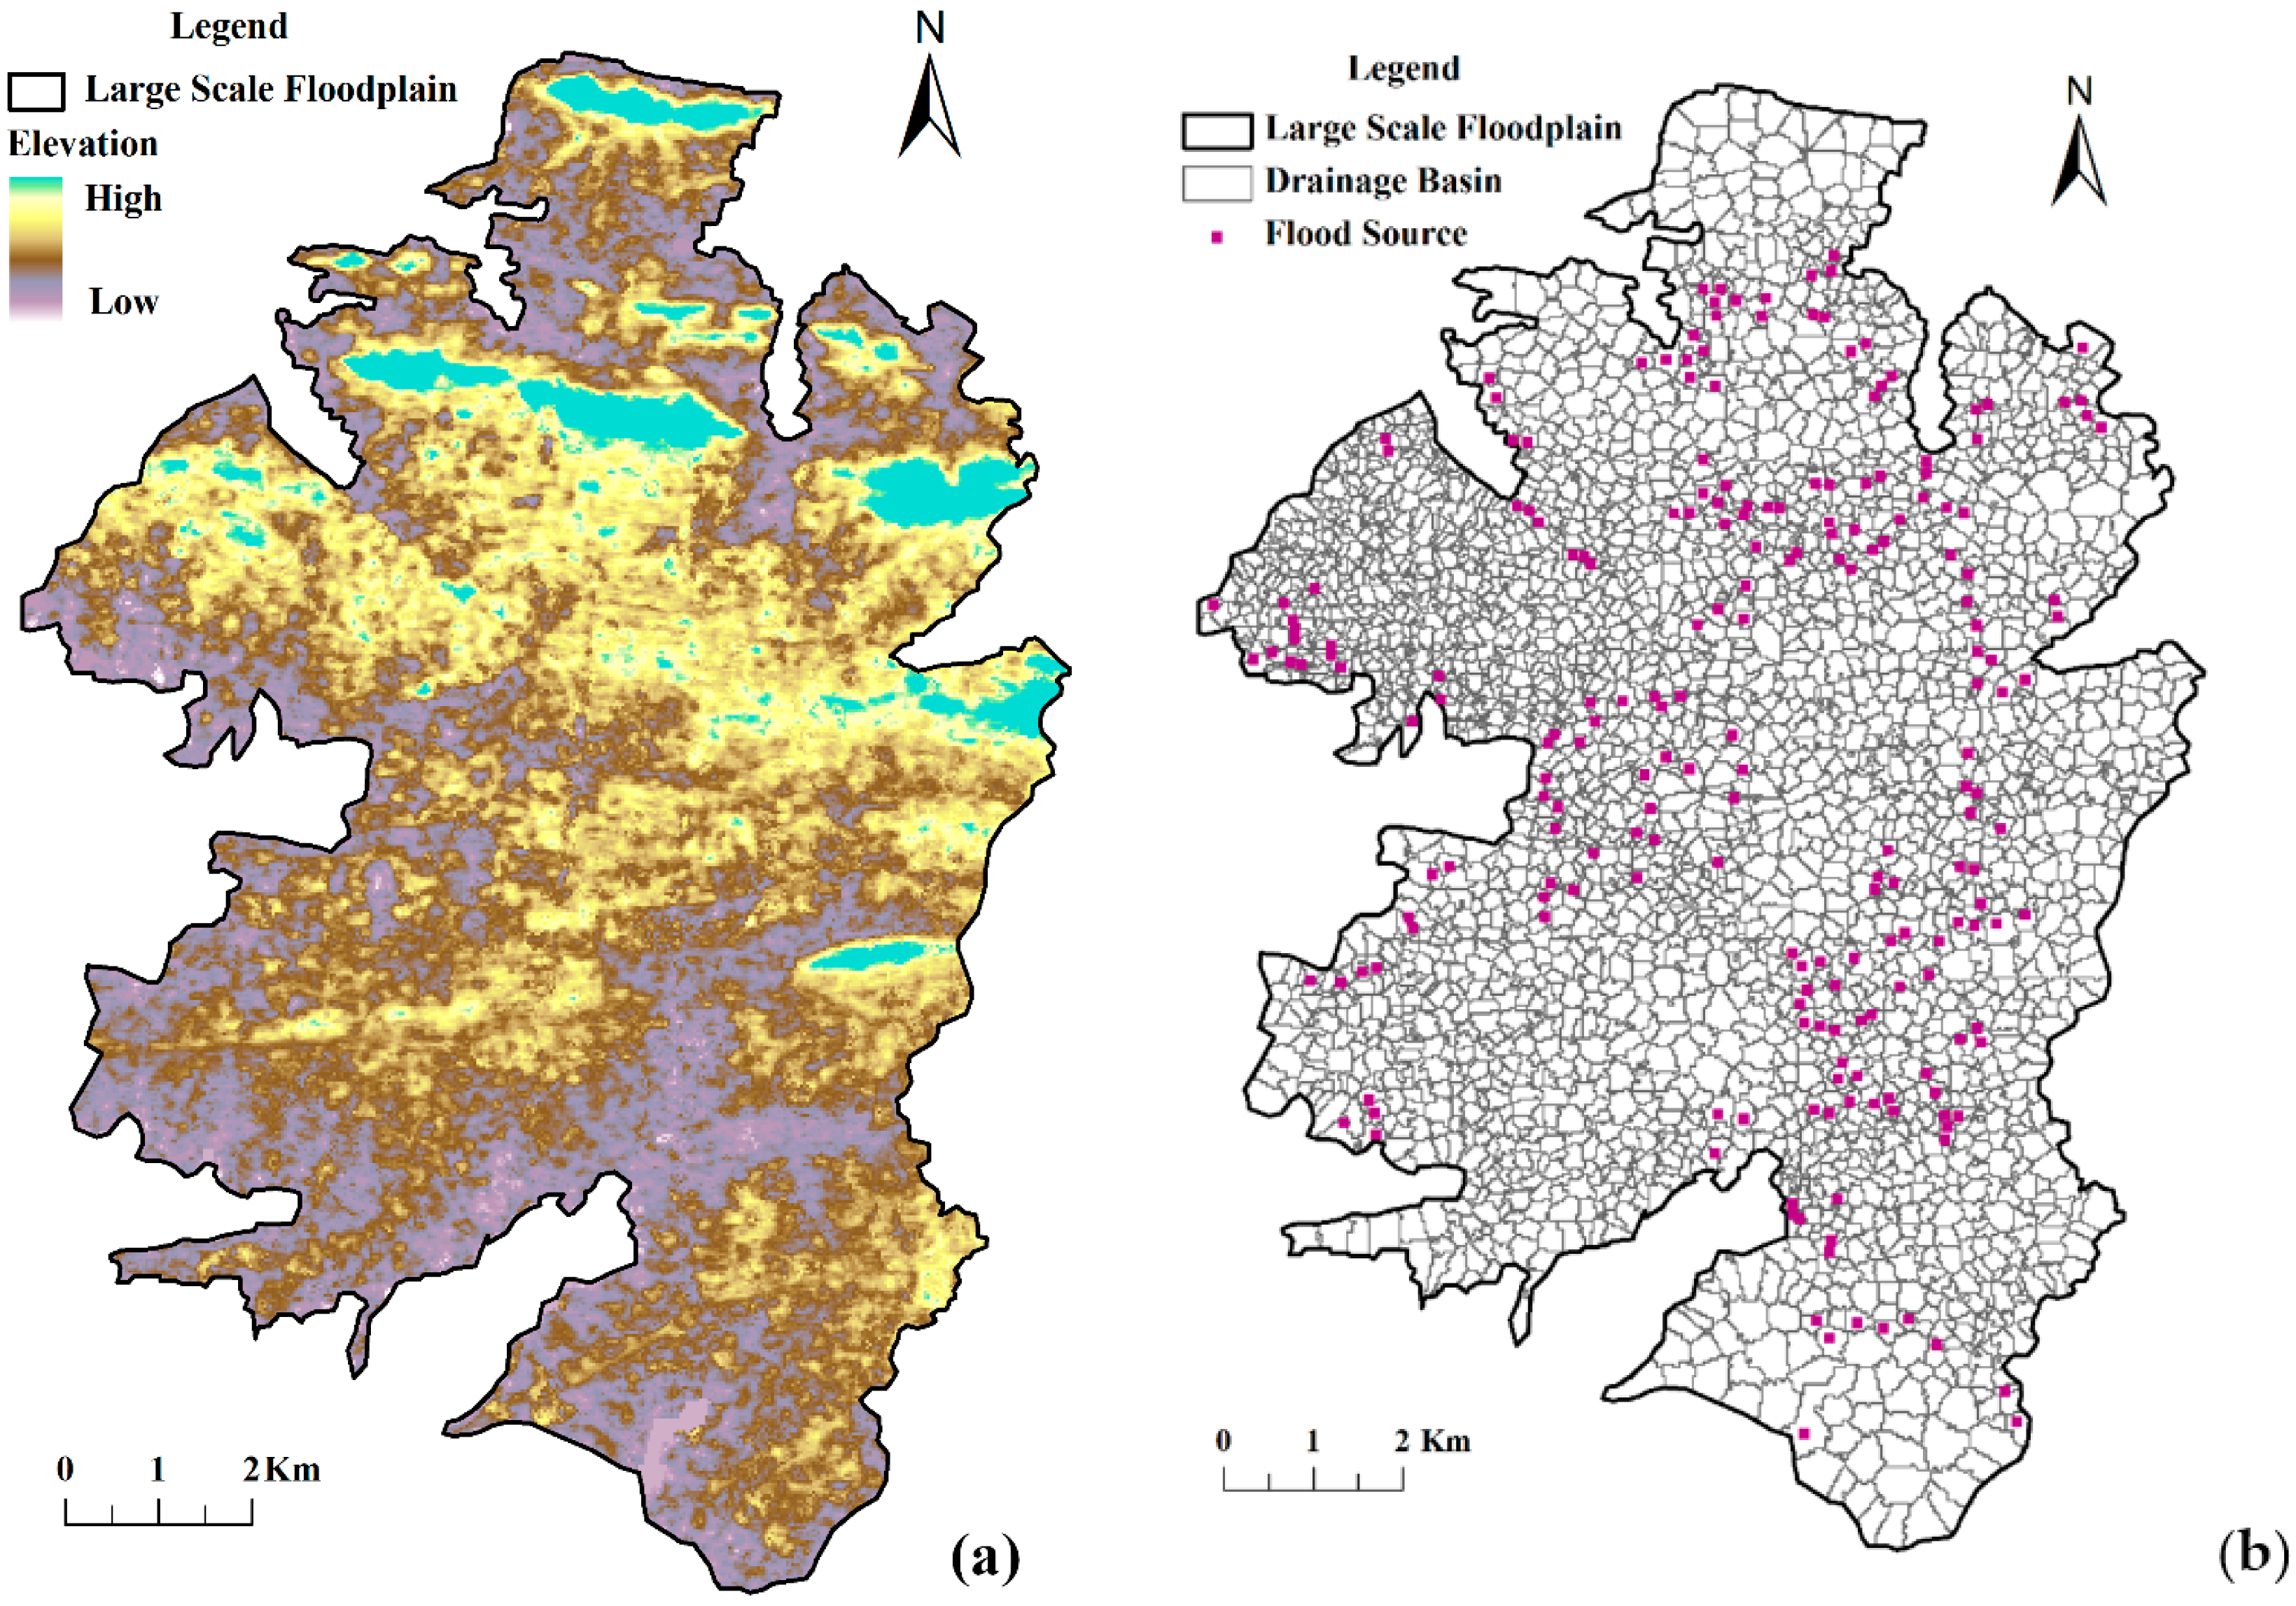
4.2. Inundation Simulation for a Large-Scale Floodplain
4.3. Validation for Time Efficiency
5. Conclusions
Acknowledgments
Author Contributions
Conflicts of Interest
References
- Shuster, W.D.; Bonta, J.; Thurston, H.; Warnemuende, E.; Smith, D.R. Impacts of impervious surface on watershed hydrology: A review. Urban Water J. 2005, 4, 263–275. [Google Scholar] [CrossRef]
- Kubal, C.; Haase, D.; Meyer, V.; Scheuer, S. Integrated urban flood risk assessment—Adapting a multicriteria approach to a city. Nat. Hazards Earth Syst. Sci. 2009, 9, 1881–1895. [Google Scholar] [CrossRef]
- Phillips, B.C.; Yu, S.; Thompson, G.R.; de Silva, N. 1D and 2D Modelling of Urban Drainage Systems using XP-SWMM and TUFLOW. In Proceedings of the 10th International Conference on Urban Drainage, Copenhagen, Denmark, 21–26 August 2005.
- Hunter, N.M.; Horritt, M.S.; Bates, P.D.; Wilson, M.D.; Werner, M.G.F. An adaptive time step solution for raster-based storage cell modelling of floodplain inundation. Adv. Water Resour. 2005, 28, 975–991. [Google Scholar] [CrossRef]
- Shih, D.; Yeh, G. Identified model parameterization, calibration, and validation of the physically distributed hydrological model WASH123D in Taiwan. J. Hydraul. Eng. 2011, 16, 126–136. [Google Scholar] [CrossRef]
- Shih, D.; Chen, C.H.; Yeh, G. Improving our understanding of flood forecasting using earlier hydro-meteorological intelligence. J. Hydrol. 2014, 512, 470–481. [Google Scholar] [CrossRef]
- O’brien, J.S.; Julien, P.Y.; Fullerton, W.T. Two-Dimensional water flood and mudflow simulation. J. Hydraul. Eng. 1993, 119, 244–261. [Google Scholar] [CrossRef]
- Sampson, C.C.; Smith, A.M.; Bates, P.B.; Neal, J.C.; Alfieri, L.; Freer, J.E. A high-resolution global flood hazard model. Water Resour. Res. 2015, 51, 7358–7381. [Google Scholar] [CrossRef] [PubMed]
- Bates, P.D.; De Roo, A.P.J. A simple raster-based model for flood inundation simulation. J. Hydrol. 2000, 236, 54–77. [Google Scholar] [CrossRef]
- Pietro, P. Suitability of the diffusive model for dam break simulation: Application to a CADAM experiment. J. Hydrol. 2008, 361, 172–185. [Google Scholar]
- Bates, P.B.; Horritt, M.S.; Fewtrell, T.J. A simple inertial formulation of the shallow water equations for efficient two-dimensional flood inundation modeling. J. Hydrol. 2010, 387, 33–45. [Google Scholar] [CrossRef]
- Da Paz, A.R.; Collischonn, W.; Tucci, C.E.M.; Padovani, C.R. Large-scale modelling of channel flow and floodplain inundation dynamics and its application to the Pantanal (Brazil). Hydrol. Process. 2011, 25, 1498–1516. [Google Scholar] [CrossRef]
- Neal, J.C.; Schumann, G.; Bates, P.B. A subgrid channel model for simulating river hydraulics and floodplain inundation over large and data sparse areas. Water Resour. Res. 2012, 48, 328. [Google Scholar] [CrossRef]
- Néelz, S.; Pender, G. Benchmarking of 2D Hydraulic Modeling Packages; Environment Agency: Bristol, UK, 2010.
- Neal, J.; Villanueva, I.; Wright, N.; Willis, T.; Fewtrell, T.; Bates, P. How much physical complexity is needed to model flood inundation? Hydrol. Process. 2012, 15, 2264–2282. [Google Scholar] [CrossRef]
- Gouldby, B.; Sayers, P.; Mulet-Marti, J.; Hassan, M.; Benwell, D. A methodology for regional-scale flood risk assessment. Proc. Inst. Civ. Eng. Water Manag. 2008, 161, 169–182. [Google Scholar] [CrossRef]
- Lhomme, J.; Sayers, P.B.; Gouldby, B.P.; Samuels, P.G.; Wills, M.; Mulet-Marti, J. Recent development and application of a rapid flood spreading method. In Proceedings of the Flood Risk 2008 Conference, Oxford, UK, 30 September–2 October 2008; Taylor and Francis Group: London, UK, 2008. [Google Scholar]
- Zerger, A.; Smith, D.I.; Hunter, G.J.; Jones, S.D. Riding the storm: A comparison of uncertainty modeling techniques for storm surge risk management. Appl. Geogr. 2002, 22, 307–330. [Google Scholar] [CrossRef]
- Falter, D.; Vorogushyn, S.; Lhomme, J.; Apel, H.; Gouldby, B.; Merz, B. Hydraulic model evaluation for large-scale flood risk assessments. Hydrol. Process. 2013, 27, 1331–1340. [Google Scholar] [CrossRef]
- Liu, Y.; Pender, G. A new rapid flood inundation model. In Proceedings of the First IAHR European Congress, Edinburgh, UK, 4–6 May 2010.
- Krupka, M.; Wallis, S.; Pender, S.; Neélz, S. Some practical aspects of flood inundation modeling. Publ. Inst. Geophys. Pol. Acad. Sci. 2007, E-7, 129–135. [Google Scholar]
- Krupka, M. A Rapid Inundation Flood Cell Model for Flood Risk Analysis. Ph.D. Thesis, Department of Built Environment, Heriot-Watt University, Edinburgh, UK, 2008. [Google Scholar]
- Yang, T.H.; Chen, Y.C.; Chang, Y.C.; Yang, S.C.; Ho, J.Y. Comparison of Different Grid Cell Ordering Approaches in a Simplified Inundation Model. Water 2015, 7, 438–454. [Google Scholar] [CrossRef]
- Chen, J.; Hill, A.A.; Urbano, L.D. A gis-based model for urban flood inundation. J. Hydrol. 2009, 373, 184–192. [Google Scholar] [CrossRef]
- Turner, A.B.; Colby, J.D.; Csontos, R.M.; Batten, M. Flood Modeling Using a Synthesis of Multi-Platform LiDAR Data. Water 2013, 5, 1533–1560. [Google Scholar] [CrossRef]
- Jung, Y.H.; Kim, D.Y.; Kim, D.W.; Kim, M.M.; Lee, S.O. Simplified Flood Inundation Mapping Based On Flood Elevation-Discharge Rating Curves Using Satellite Images in Gauged Watersheds. Water 2014, 6, 1280–1299. [Google Scholar] [CrossRef]
- Blumensaat, F.; Wolfram, M.; Krebs, P. Sewer model development under minimum data requirements. Environ. Earth Sci. 2012, 65, 1427–1437. [Google Scholar] [CrossRef]
- Chen, A.S.; Evans, B.; Djordjevic, S.; Savic, D.A. Multi-layered coarse grid modelling in 2D urban flood simulations. J. Hydrol. 2012, 470, 1–11. [Google Scholar] [CrossRef] [Green Version]
- Li, Z.F.; Wu, L.X.; Zhu, W.; Hou, M.L.; Yang, Y.Z.; Zheng, J.C. A New Method for Urban Storm Flood Inundation Simulation with Fine CD-TIN Surface. Water 2014, 6, 1151–1171. [Google Scholar] [CrossRef]
- Zhao, D.Q.; Chen, J.N.; Wang, H.Z. GIS-based urban rainfall-runoff modeling using an automatic catchment-discretization approach: A case study in Macau. Environ. Earth Sci. 2009, 56, 465–472. [Google Scholar]
- Lhomme, J.; Bouvier, C.; Perrin, J.L. Applying a GIS-based geomorphological routing model in urban catchments. J. Hydrol. 2004, 299, 203–216. [Google Scholar] [CrossRef]
- Schmitt, T.G.; Thomas, M.; Ettrich, N. Analysis and modeling of flooding in urban drainage systems. J. Hydrol. 2004, 299, 300–311. [Google Scholar] [CrossRef]
- Hsu, M.H.; Chen, S.H.; Chang, T.J. Inundation simulation for urban drainage basin with storm sewer system. J. Hydrol. 2000, 234, 21–37. [Google Scholar] [CrossRef] [Green Version]
- O’Callaghan, J.; Mark, D. The extraction of drainage networks from digital elevation data. Comput. Vis. Graph. Image Process. 1984, 28, 323–344. [Google Scholar] [CrossRef]
- Ishigaki, T.; Kawanaka, R.; Onishi, Y.; Shimada, H.; Toda, K.; Baba, Y. Assessment of safety on evacuating route during underground flooding. In Advances in Water Resources and Hydraulic Engineering; Springer: Berlin/Heidelberg, Germany, 2009; pp. 141–146. [Google Scholar]


| Drainage Basin | Flood Volume (m3) | Drainage Basin | Flood Volume (m3) |
|---|---|---|---|
| 1 | 363 | 38 | 1974 |
| 8 | 851 | 40 | 540 |
| 15 | 2199 | 48 | 515 |
| 16 | 2103 | 61 | 457 |
| 28 | 169 | 62 | 2081 |
| 35 | 761 | 65 | 1168 |
| Models | Study Area | Large-Scale Floodplain | ||
|---|---|---|---|---|
| 30-m DEM | 90-m DEM | 30-m DEM | 90-m DEM | |
| TRFSM | 55.8 s | 12.6 s | 27 min 52 s | 5 min 20 s |
| NRSIM | 2.1 s | <1 s | 53.9 s | 17.5 s |
| LISFLOOD | 4 min 3 s | 51.8 s | 2 h 10 min 25 s | 25 min 16 s |
© 2016 by the authors; licensee MDPI, Basel, Switzerland. This article is an open access article distributed under the terms and conditions of the Creative Commons Attribution (CC-BY) license (http://creativecommons.org/licenses/by/4.0/).
Share and Cite
Shen, J.; Tong, Z.; Zhu, J.; Liu, X.; Yan, F. A New Rapid Simplified Model for Urban Rainstorm Inundation with Low Data Requirements. Water 2016, 8, 512. https://doi.org/10.3390/w8110512
Shen J, Tong Z, Zhu J, Liu X, Yan F. A New Rapid Simplified Model for Urban Rainstorm Inundation with Low Data Requirements. Water. 2016; 8(11):512. https://doi.org/10.3390/w8110512
Chicago/Turabian StyleShen, Ji, Zhong Tong, Jianfeng Zhu, Xiaofei Liu, and Fei Yan. 2016. "A New Rapid Simplified Model for Urban Rainstorm Inundation with Low Data Requirements" Water 8, no. 11: 512. https://doi.org/10.3390/w8110512
APA StyleShen, J., Tong, Z., Zhu, J., Liu, X., & Yan, F. (2016). A New Rapid Simplified Model for Urban Rainstorm Inundation with Low Data Requirements. Water, 8(11), 512. https://doi.org/10.3390/w8110512