
Uncertainty Analysis in the Evaluation of Extreme Rainfall Trends and Its Implications on Urban Drainage System Design


Abstract
:
1. Introduction
2. Materials and Methods
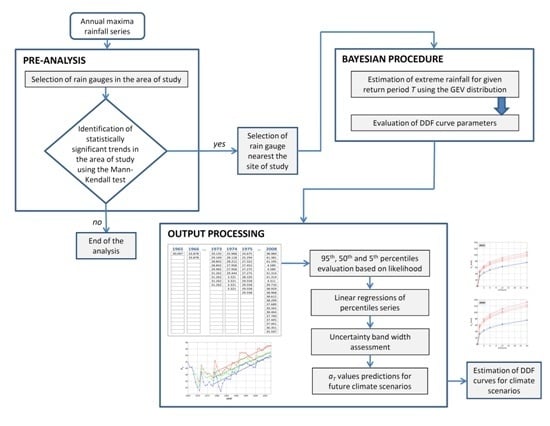
2.1. The Proposed Methodology
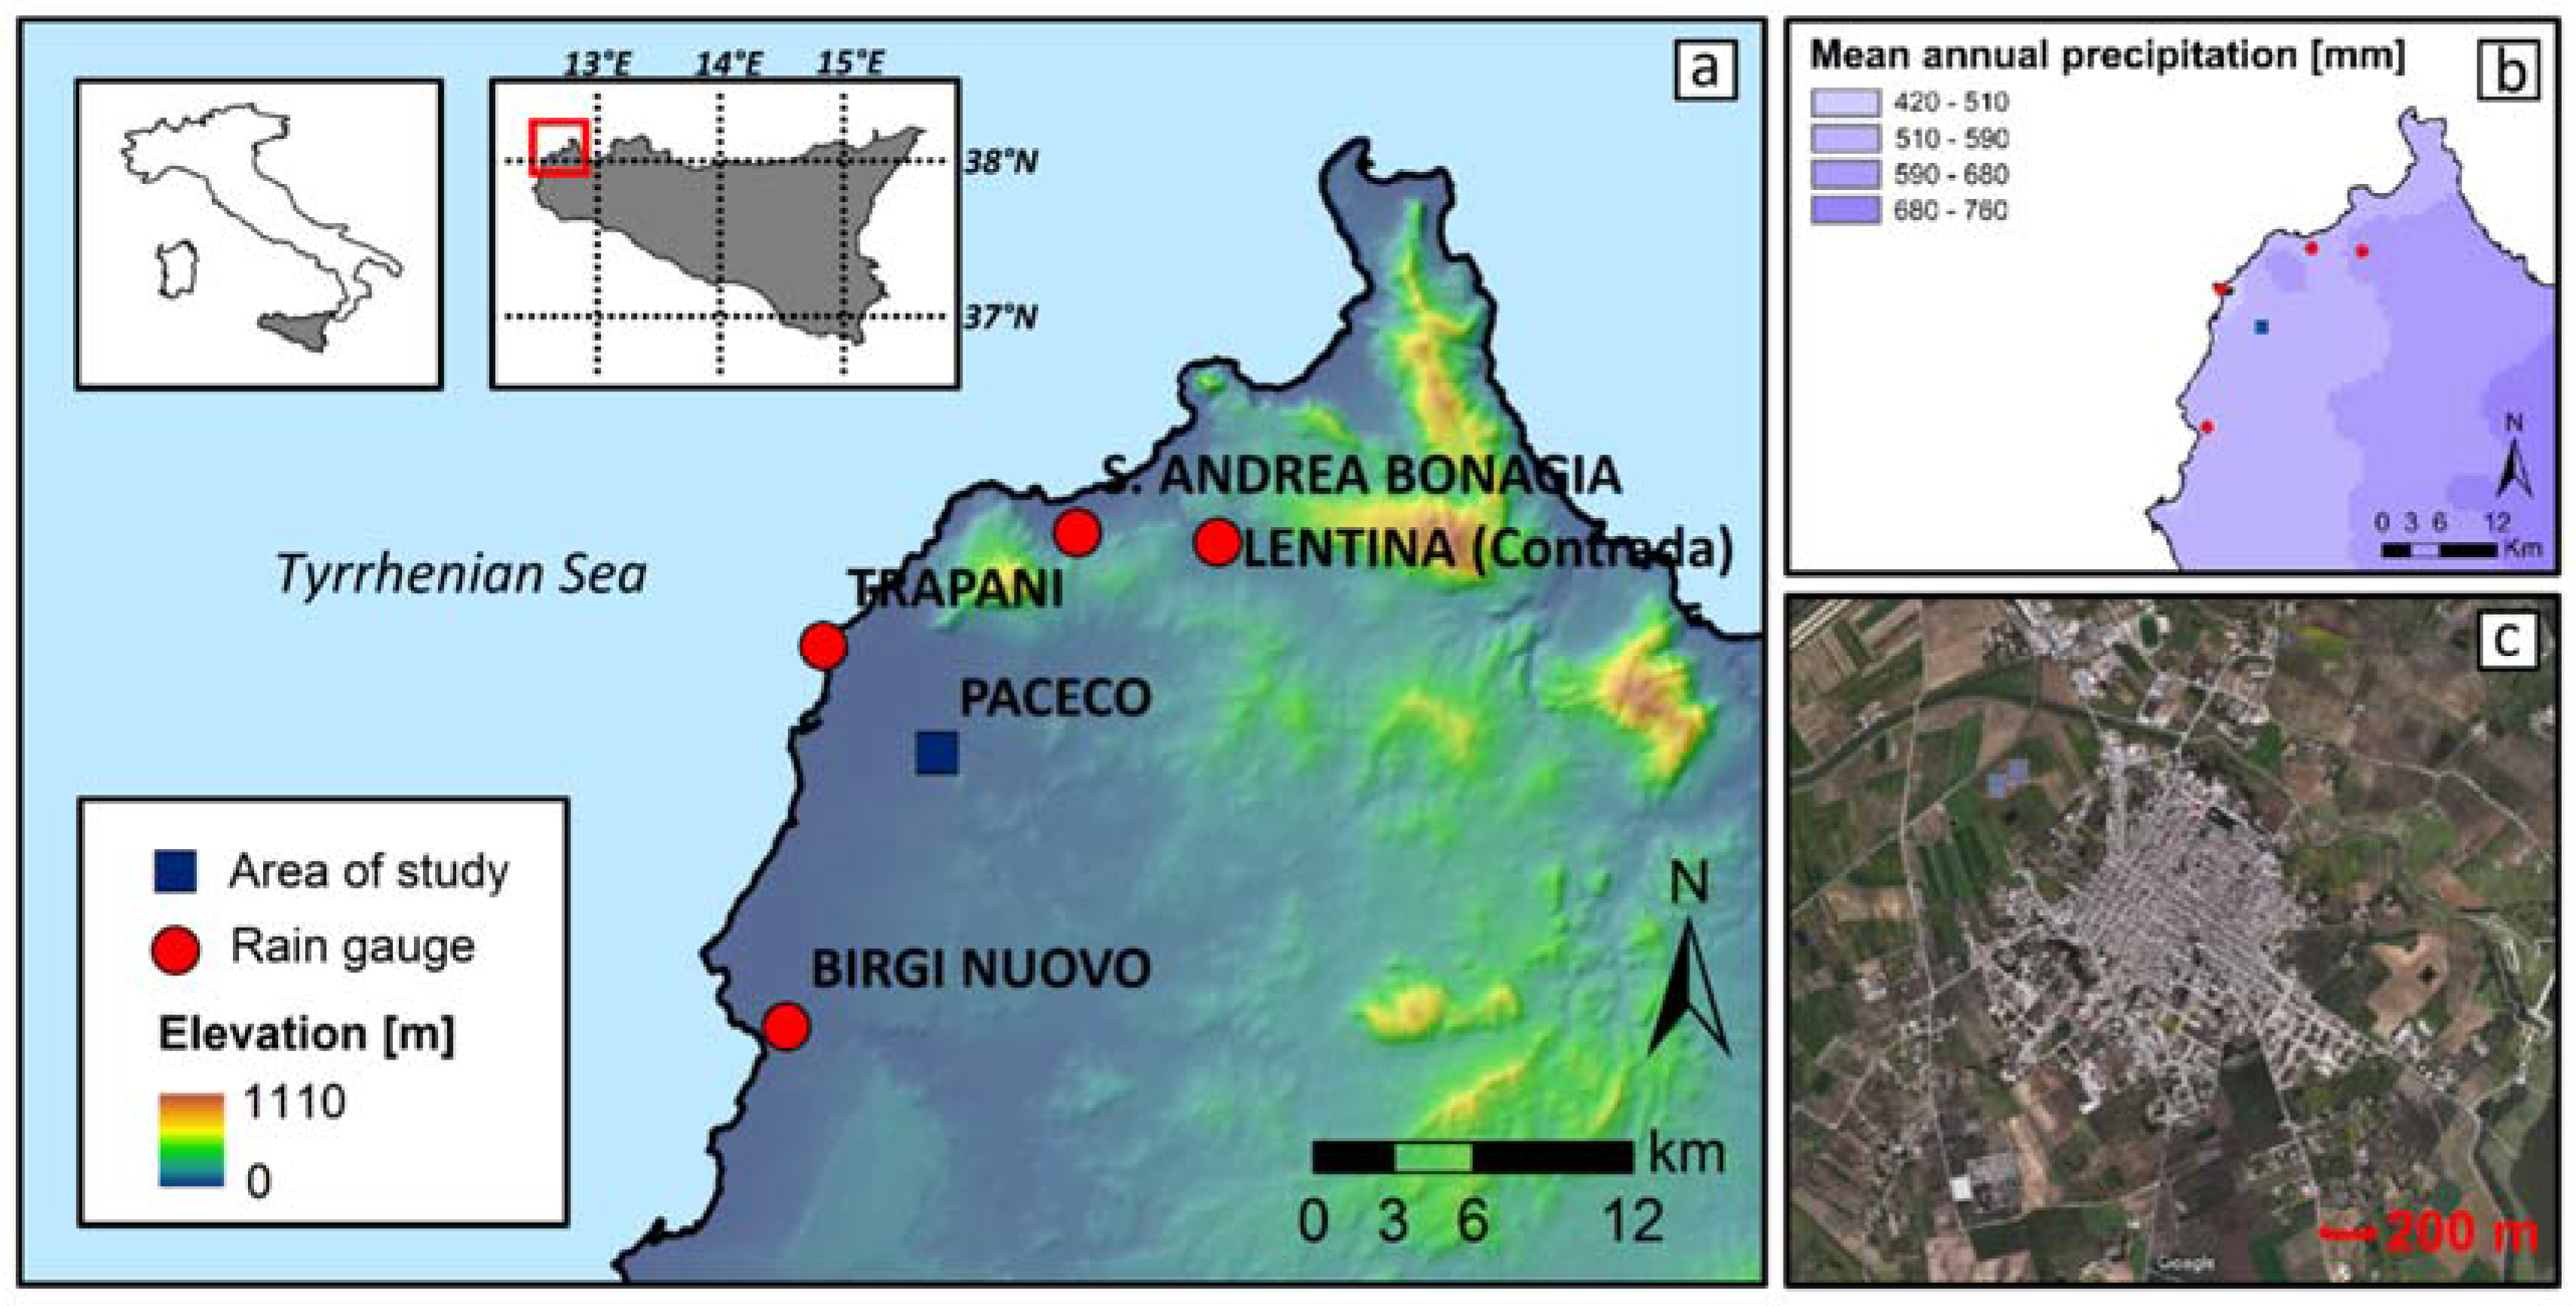
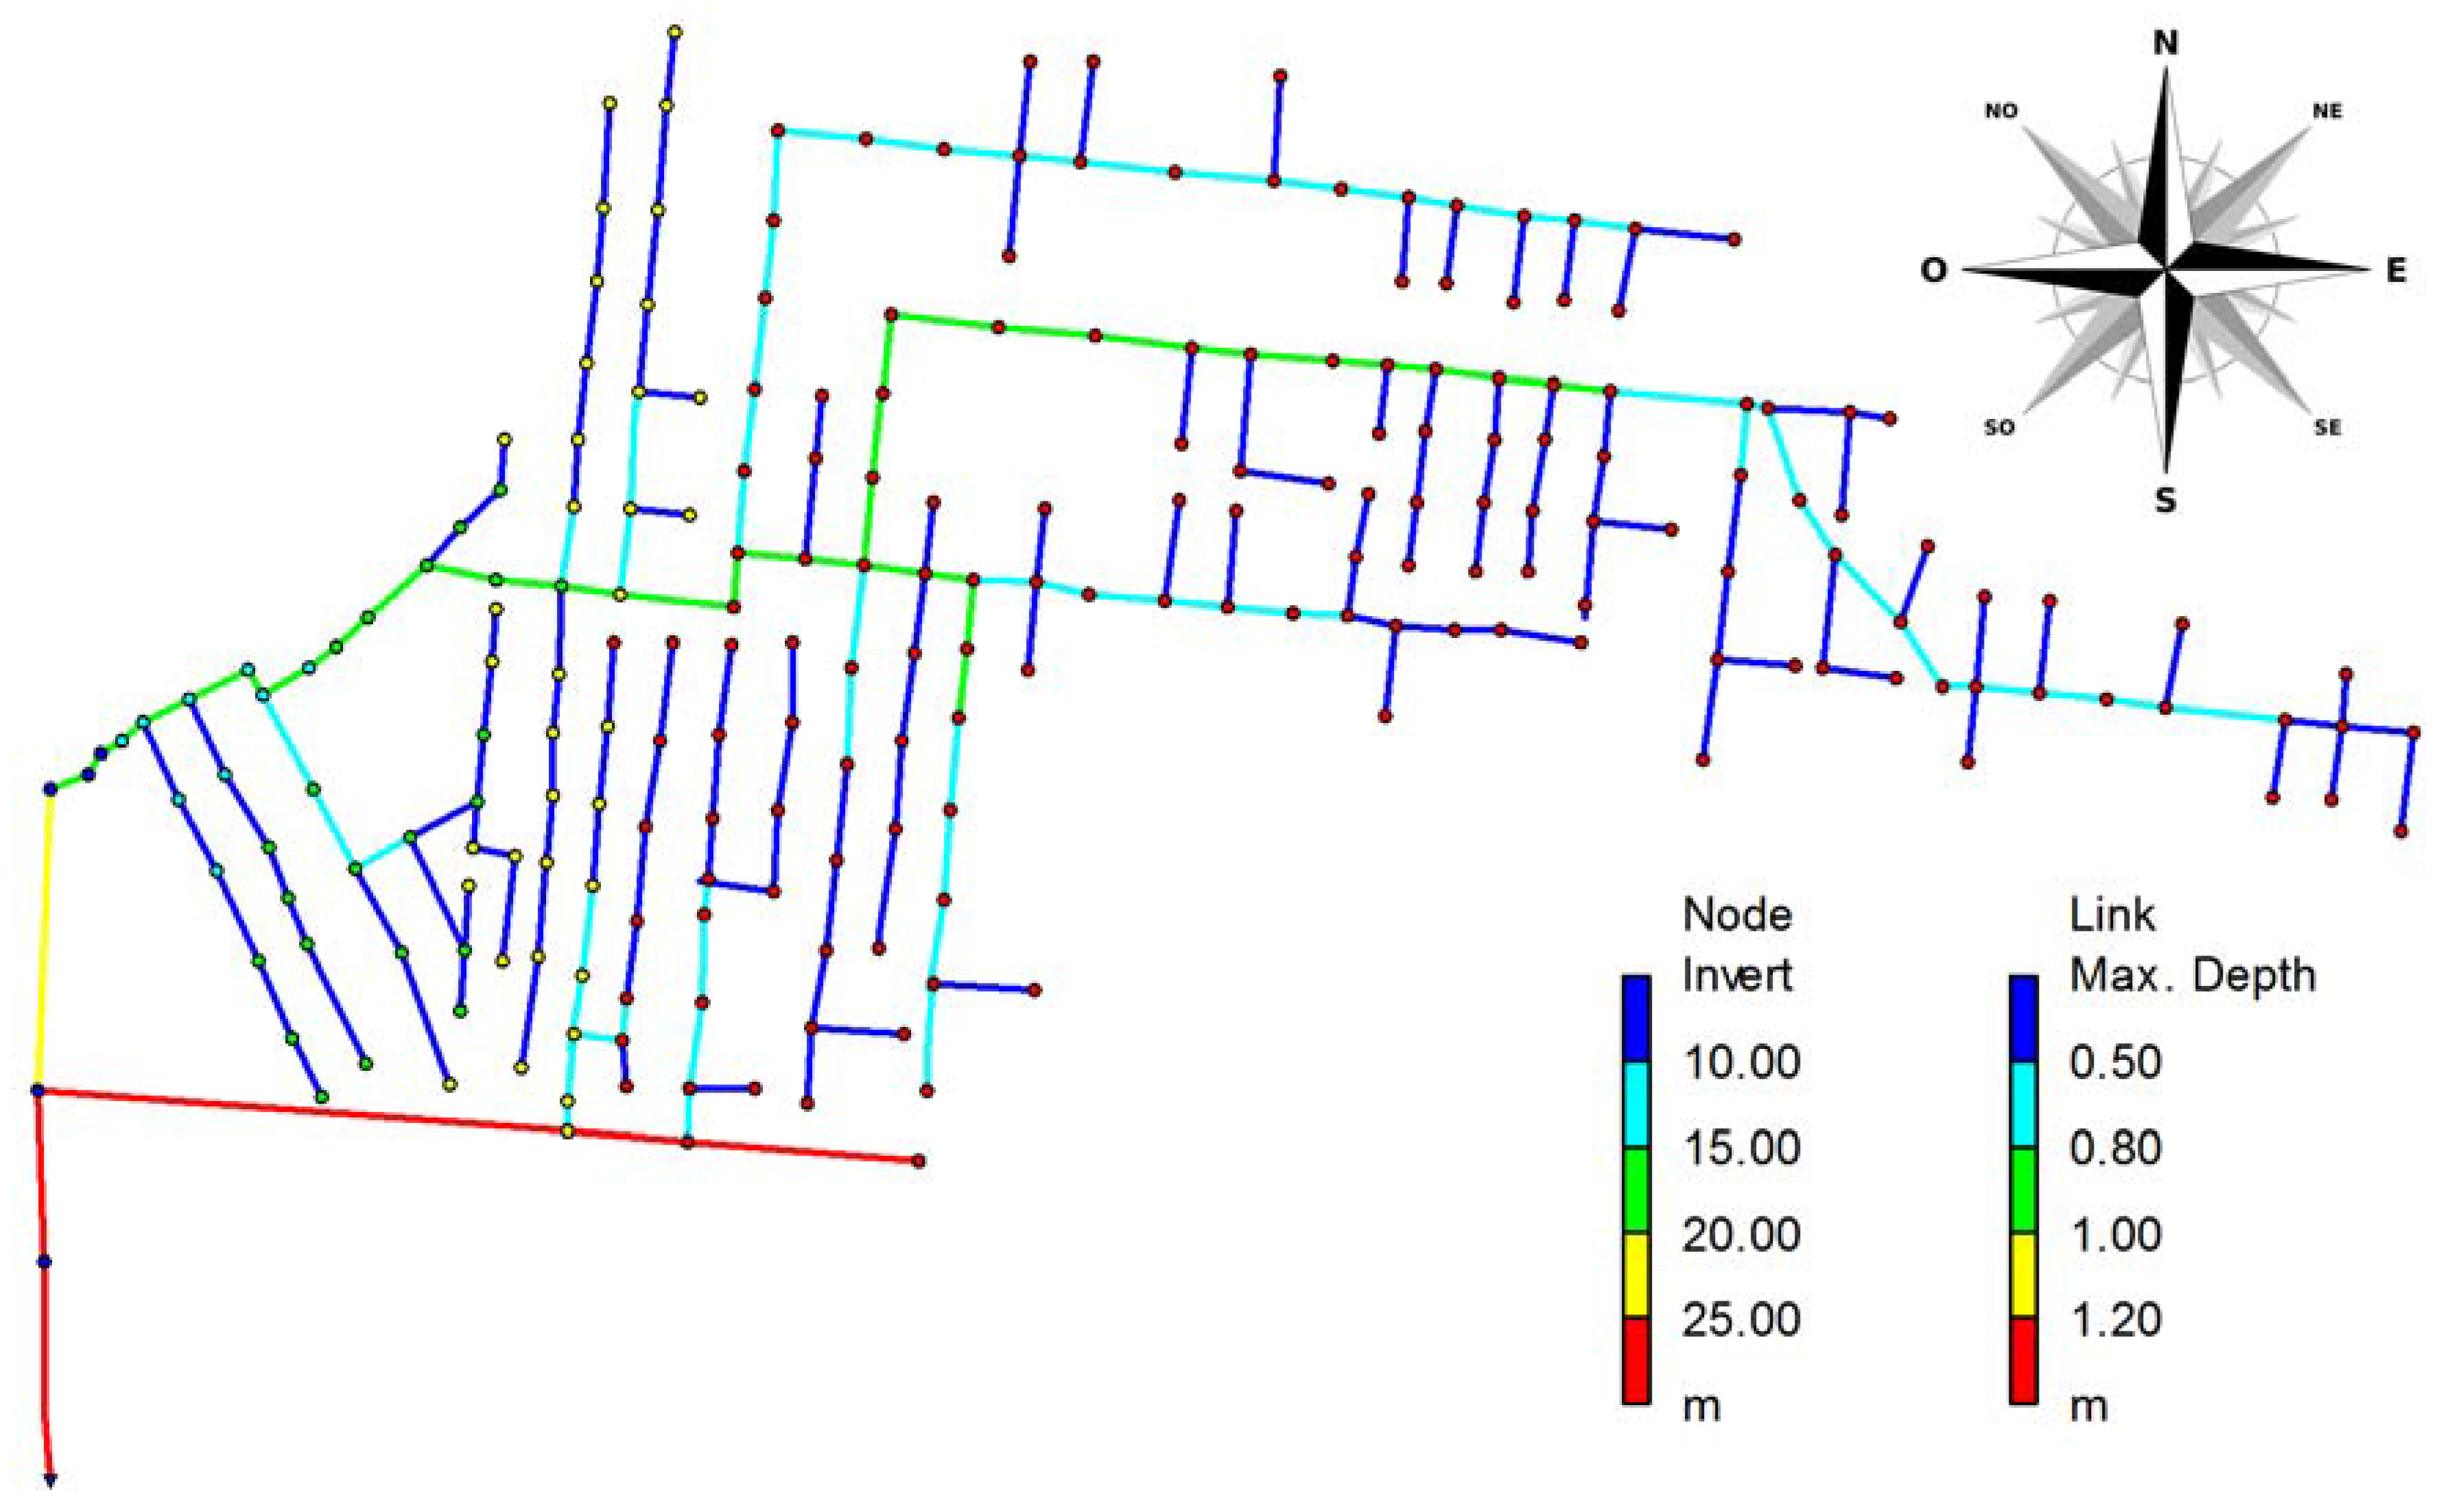
2.2. The Case Study: Dataset

3. Results and Discussion
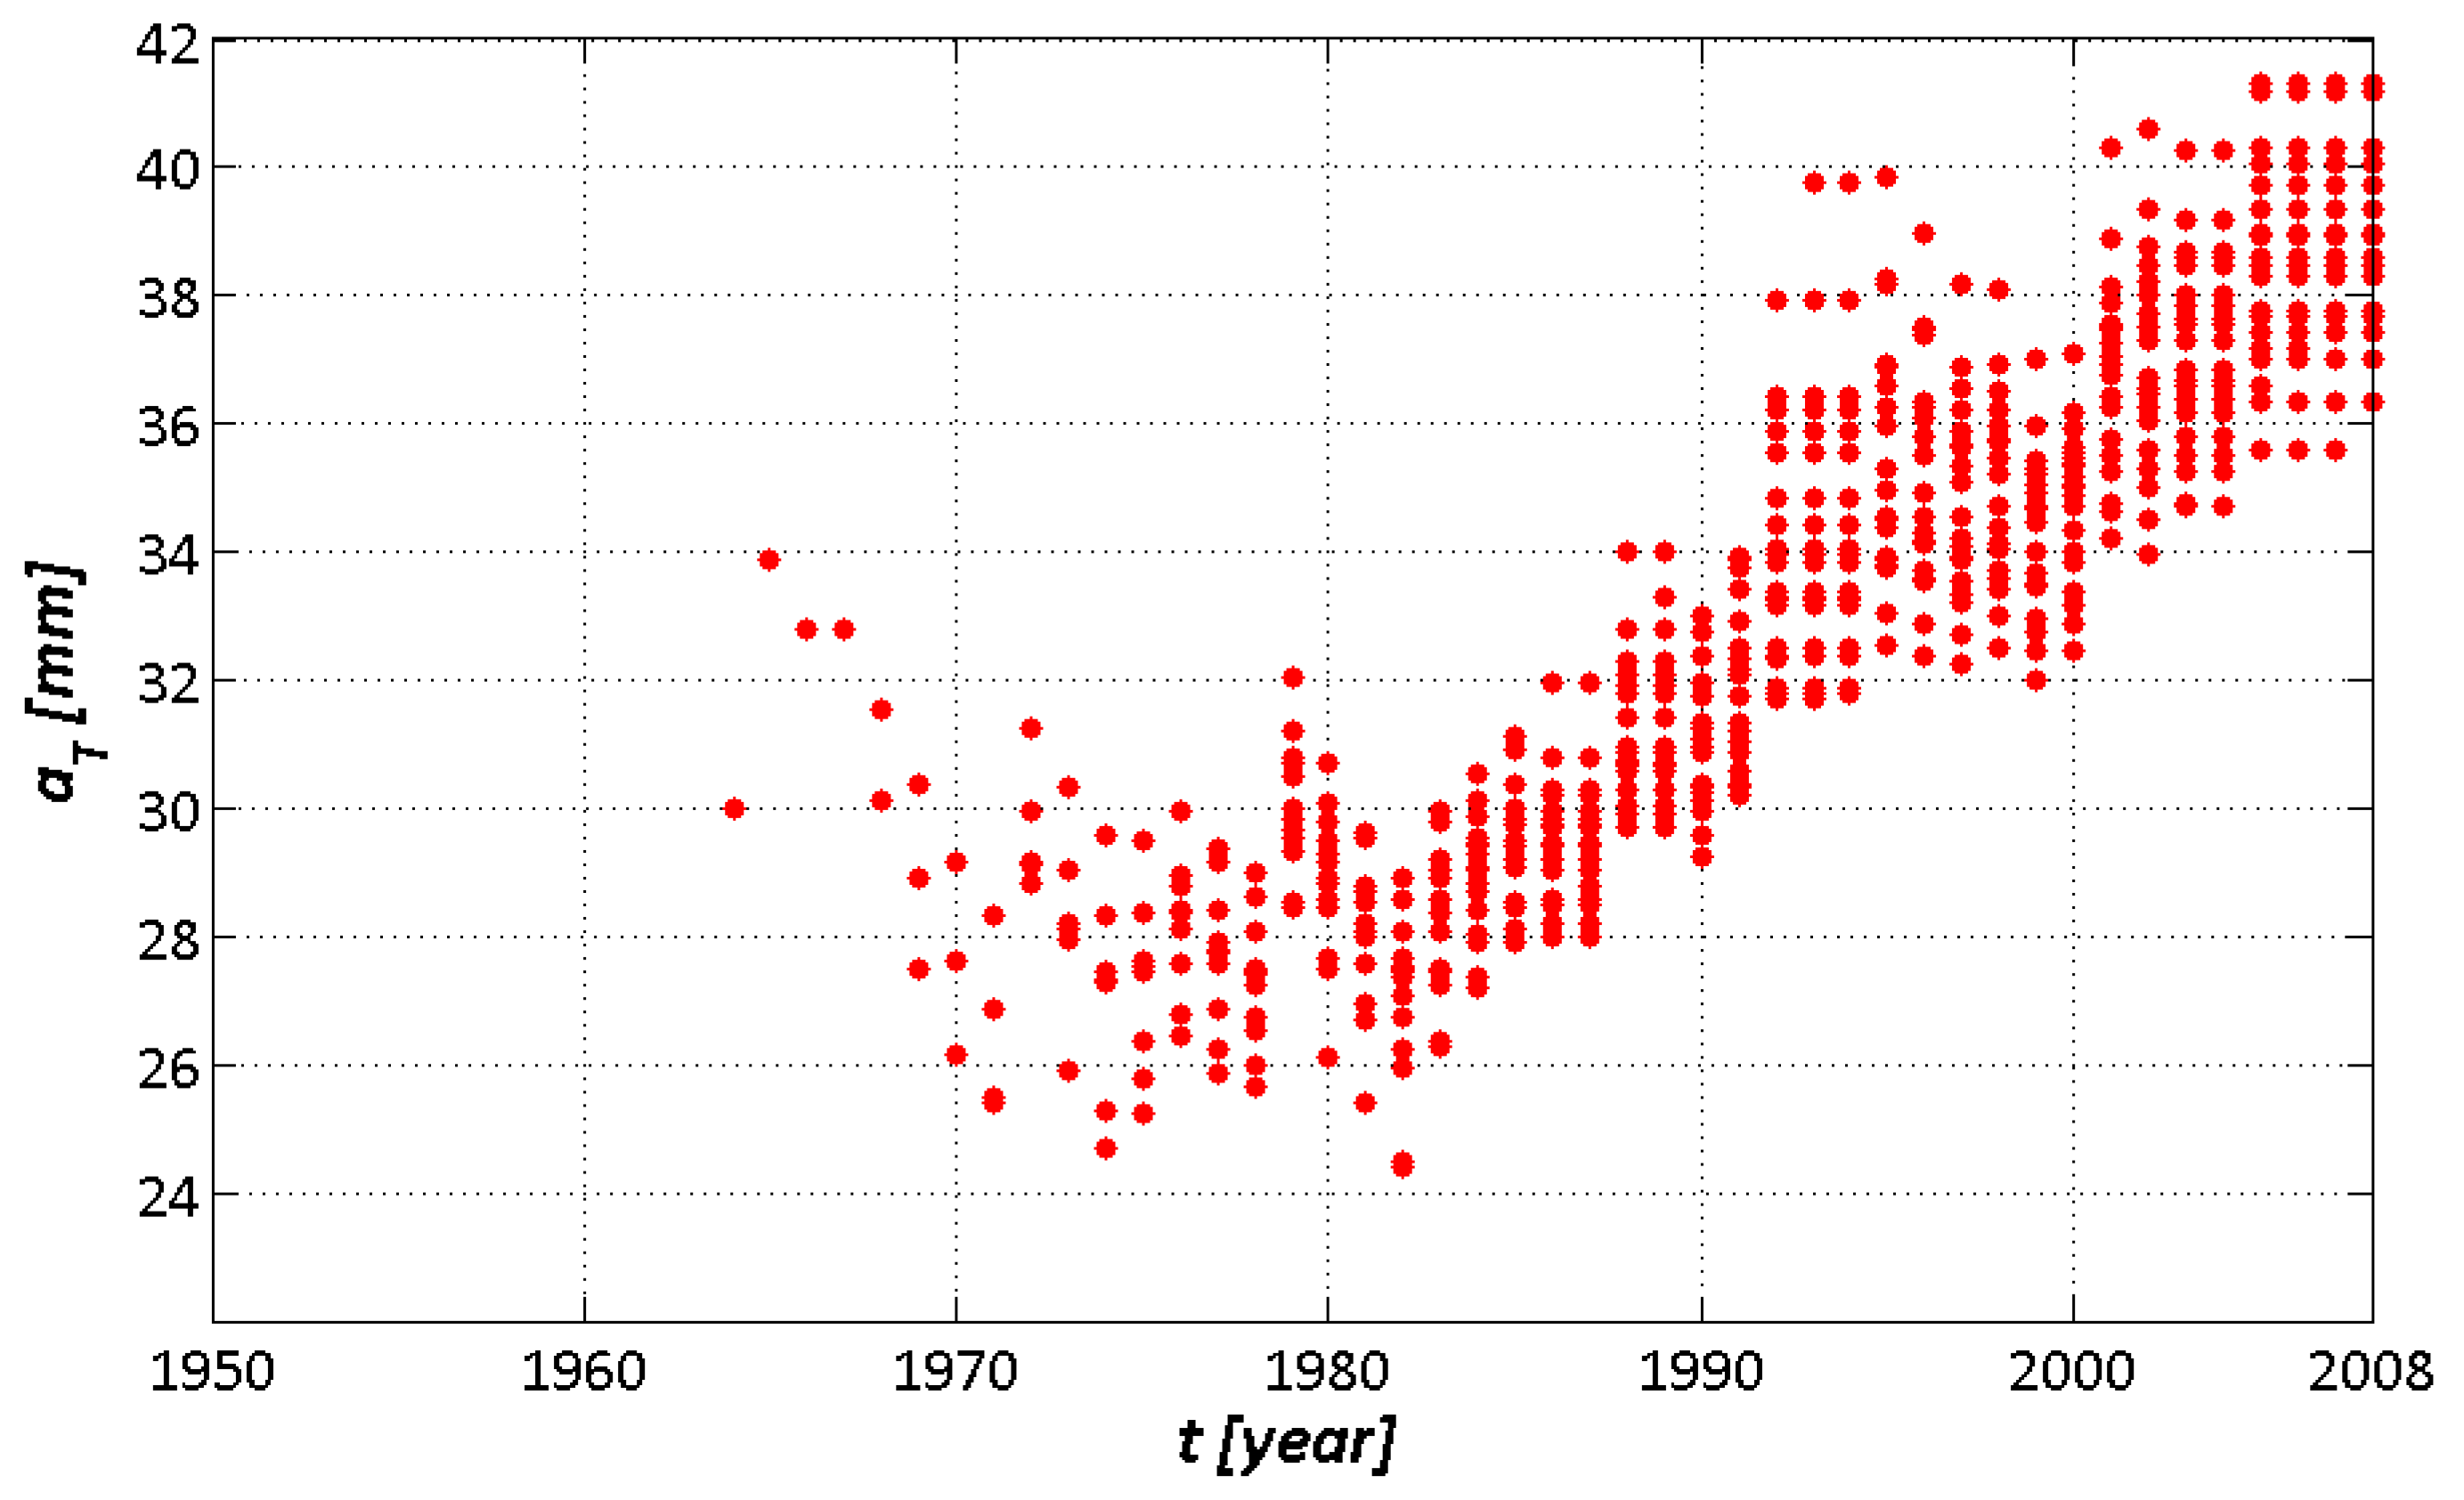
3.1. Pre-Analysis Results
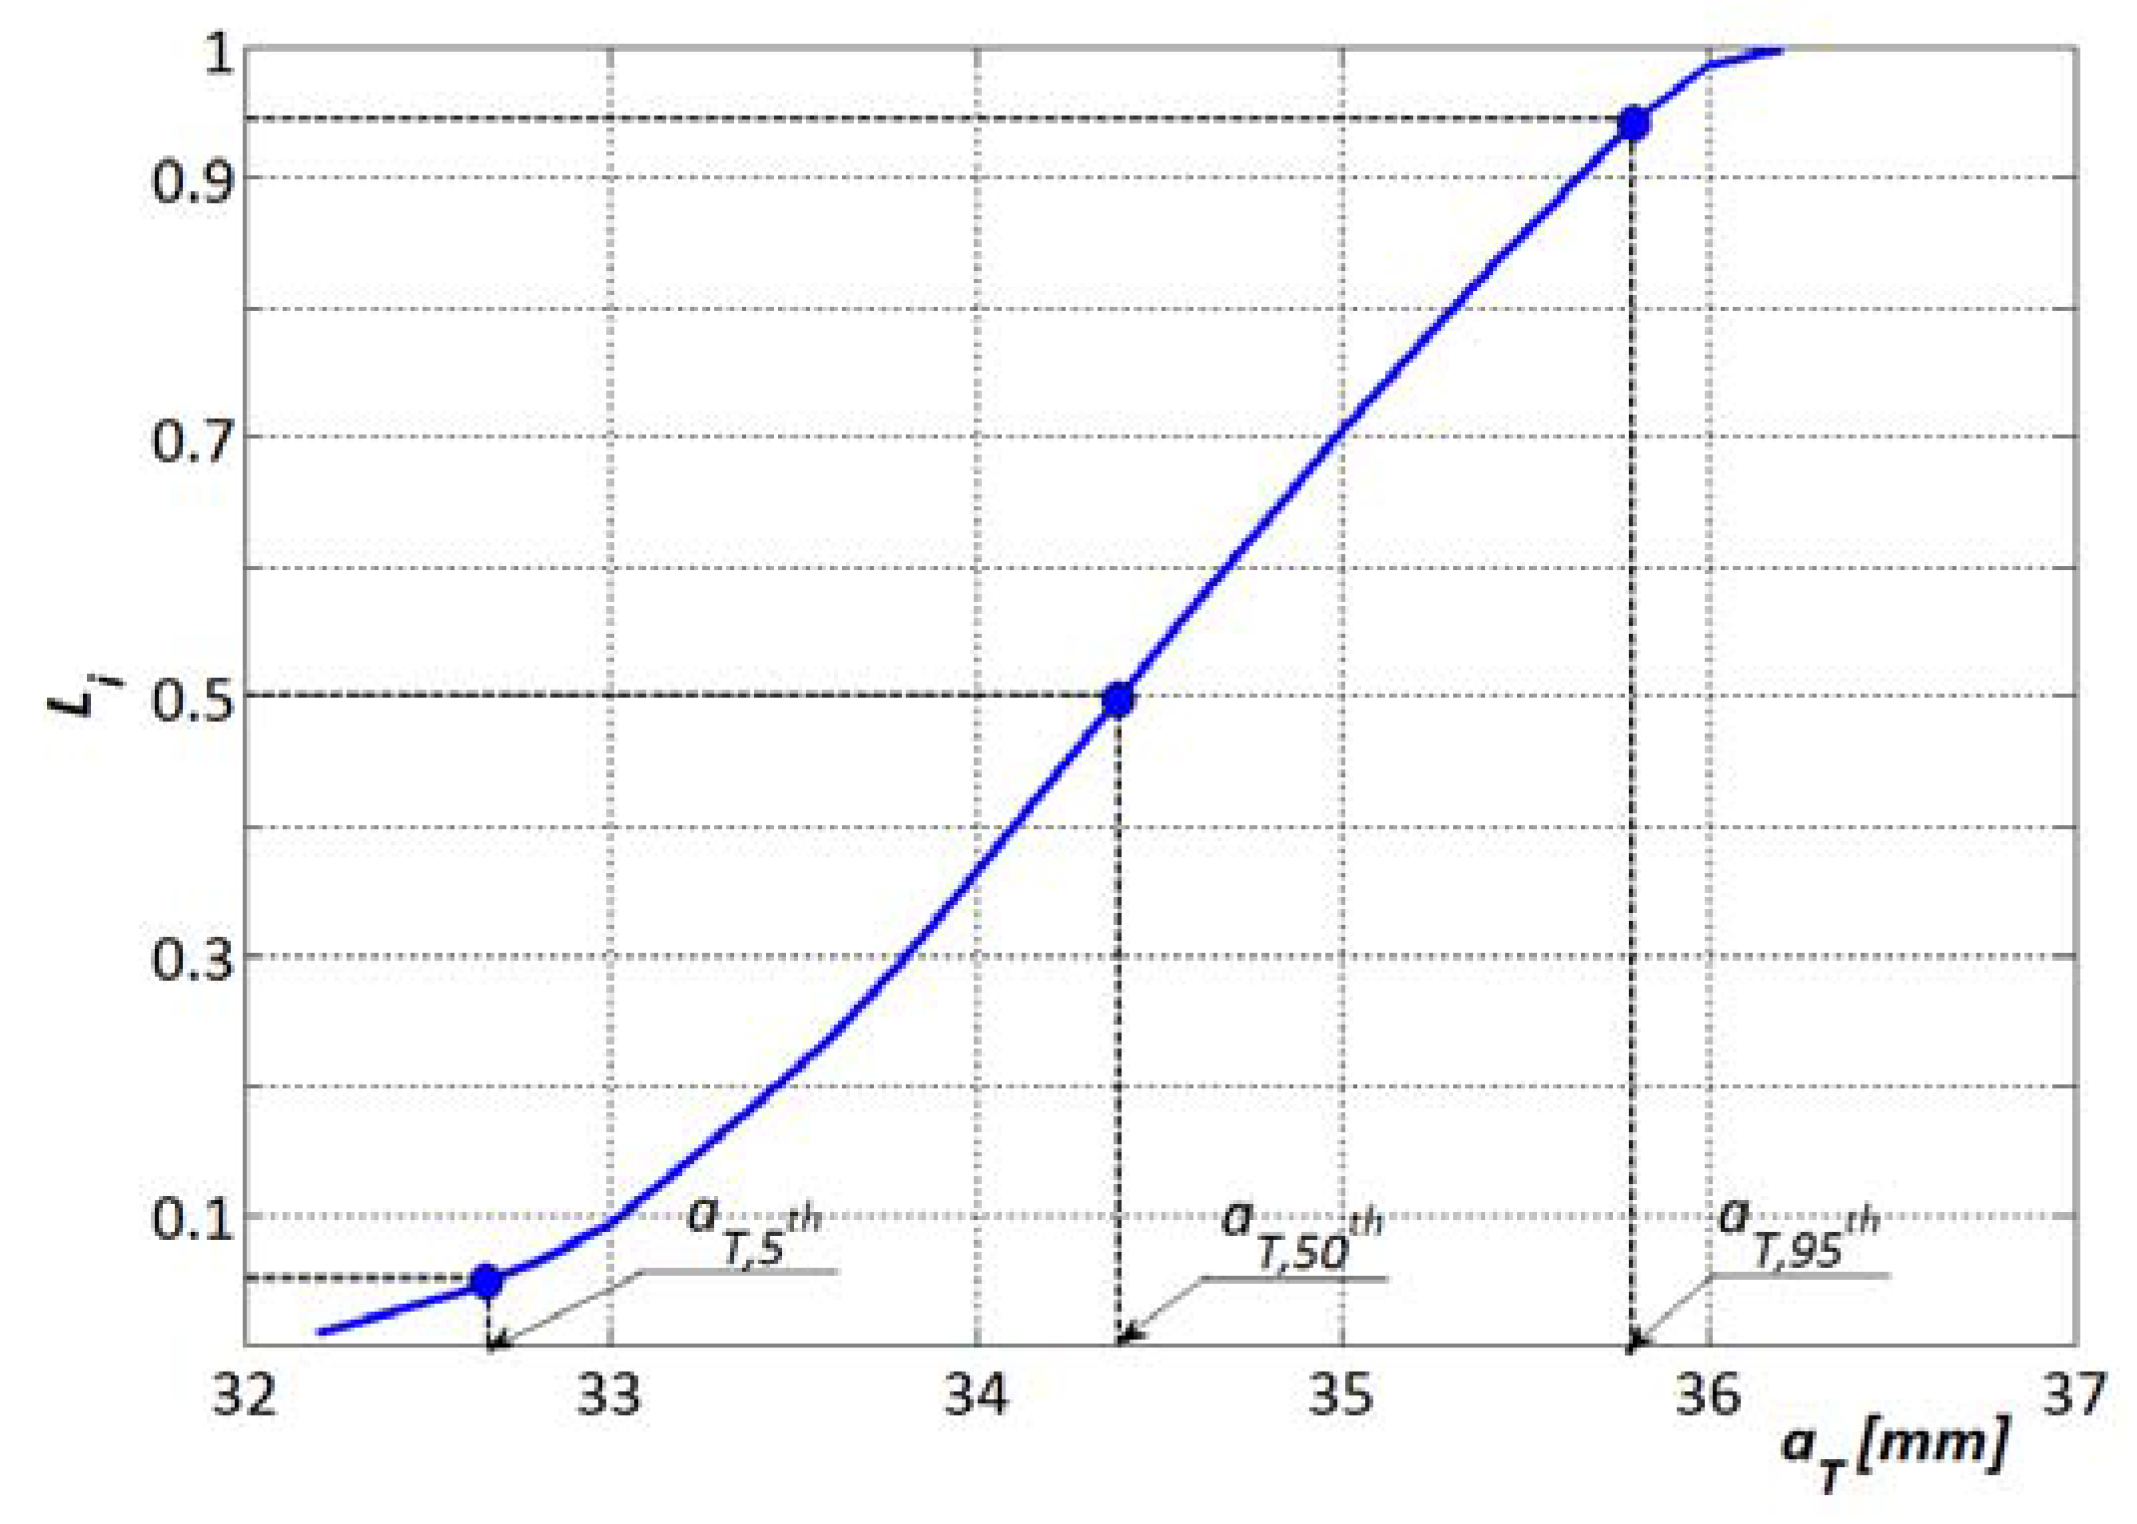
3.2. Bayesian Procedure Results

| Duration | Rain Gauge | ||||
|---|---|---|---|---|---|
| Lentina (Contrada) | S. Andrea Bonagia | Trapani | Birgi Nuovo | ||
| 1 h | trend | +/α = 0.01 | +/α = 0.05 | +/α = 0.01 | no trend (α < 0.1) |
| β (mm/year) | 0.153 | 0.206 | 0.198 | 0.160 | |
| p-value | 0.002 | 0.010 | 0.00002 | 0.571 | |
| 3 h | α | no trend (α < 0.1) | +/α = 0.05 | +/α = 0.05 | no trend (α < 0.1) |
| β (mm/year) | −0.030 | 0.117 | 0.140 | −0.114 | |
| p-value | 0.214 | 0.032 | 0.011 | 0.151 | |
| 6 h | α | no trend | +/α = 0.05 | +/α = 0.05 | no trend (α < 0.1) |
| β (mm/year) | −0.054 | 0.092 | 0.164 | −0.126 | |
| p-value | 0.267 | 0.025 | 0.037 | 0.368 | |
| 12 h | α | no trend (α < 0.1) | +/α = 0.05 | no trend (α < 0.1) | no trend (α < 0.1) |
| β (mm/year) | 0.064 | 0.183 | 0.165 | 0.006 | |
| p-value | 0.155 | 0.019 | 0.166 | 0.690 | |
| 24 h | α | no trend (α < 0.1) | +/α = 0.05 | no trend (α < 0.1) | no trend (α < 0.1) |
| β (mm/year) | 0.177 | 0.308 | 0.209 | 0.184 | |
| p-value | 0.481 | 0.101 | 0.845 | 0.760 | |
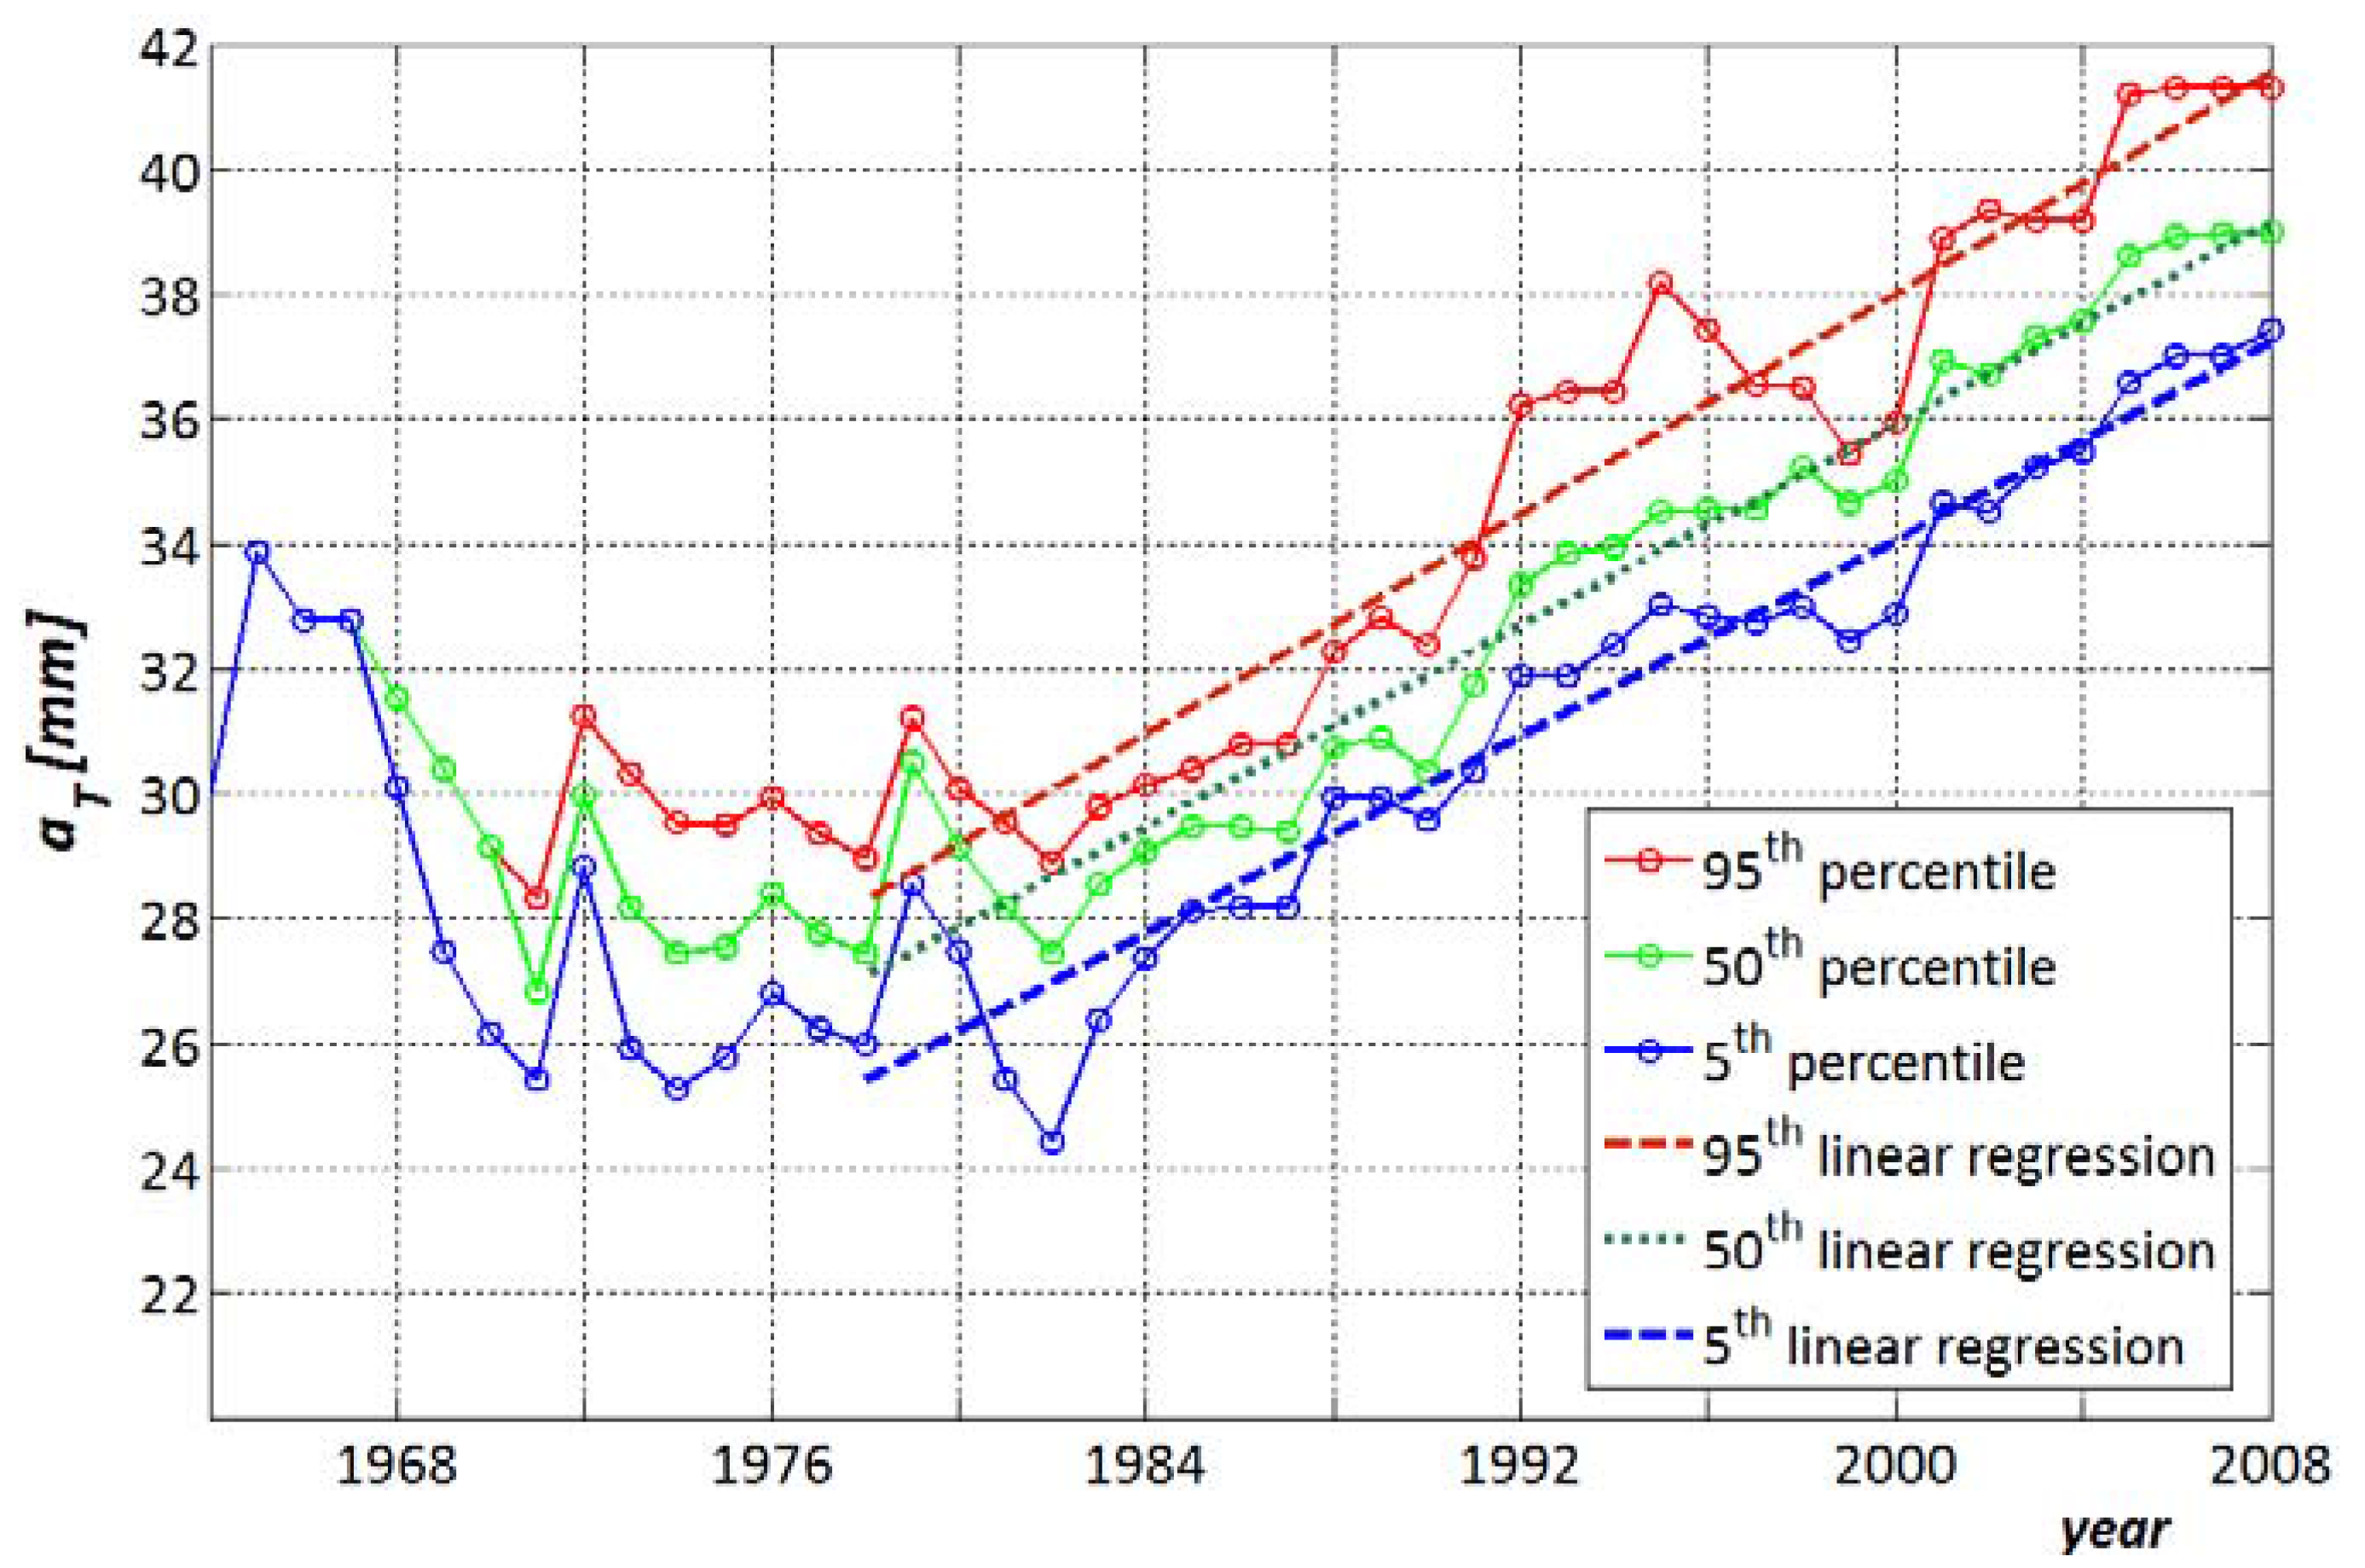
| Percentile | Equation | R2 | SER |
|---|---|---|---|
| 95th | aT = 0.441·t − 844.4 | 0.92 | 0.961 |
| 50th | aT = 0.402·t − 768.4 | 0.95 | 0.899 |
| 5th | aT = 0.393·t − 752.9 | 0.93 | 1.193 |
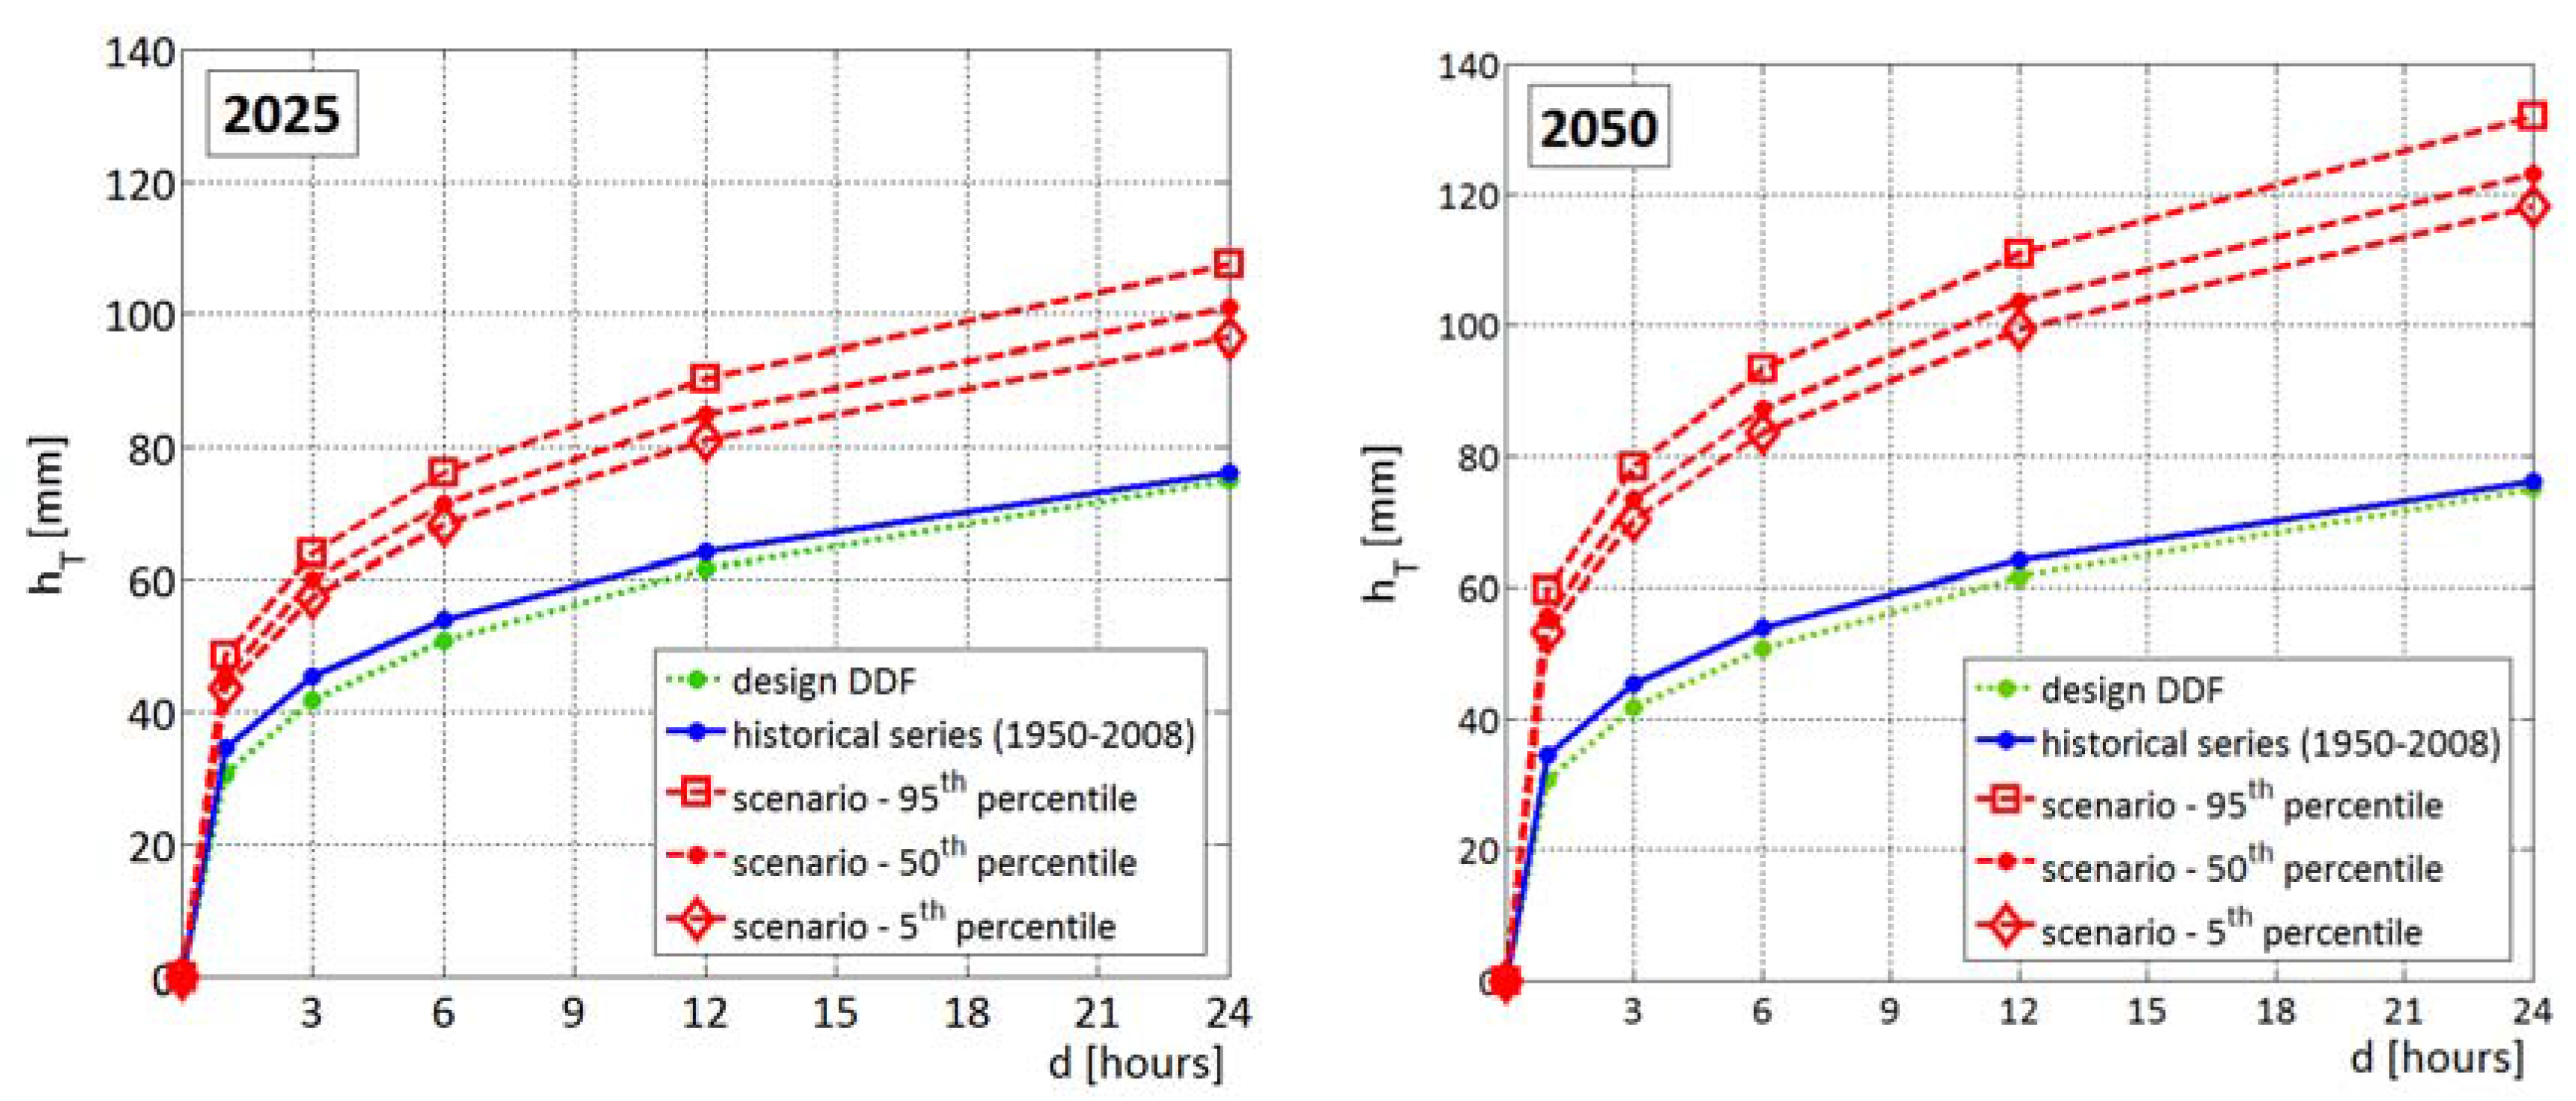
3.3. DDF-Curves of Climate Change Scenarios
| Percentile | aT | ||
|---|---|---|---|
| 2008 * | Scenario 2025 | Scenario 2050 | |
| 95th | 41.54 | 48.60 | 59.62 |
| 50th | 39.13 | 45.64 | 55.69 |
| 5th | 37.22 | 43.54 | 53.38 |

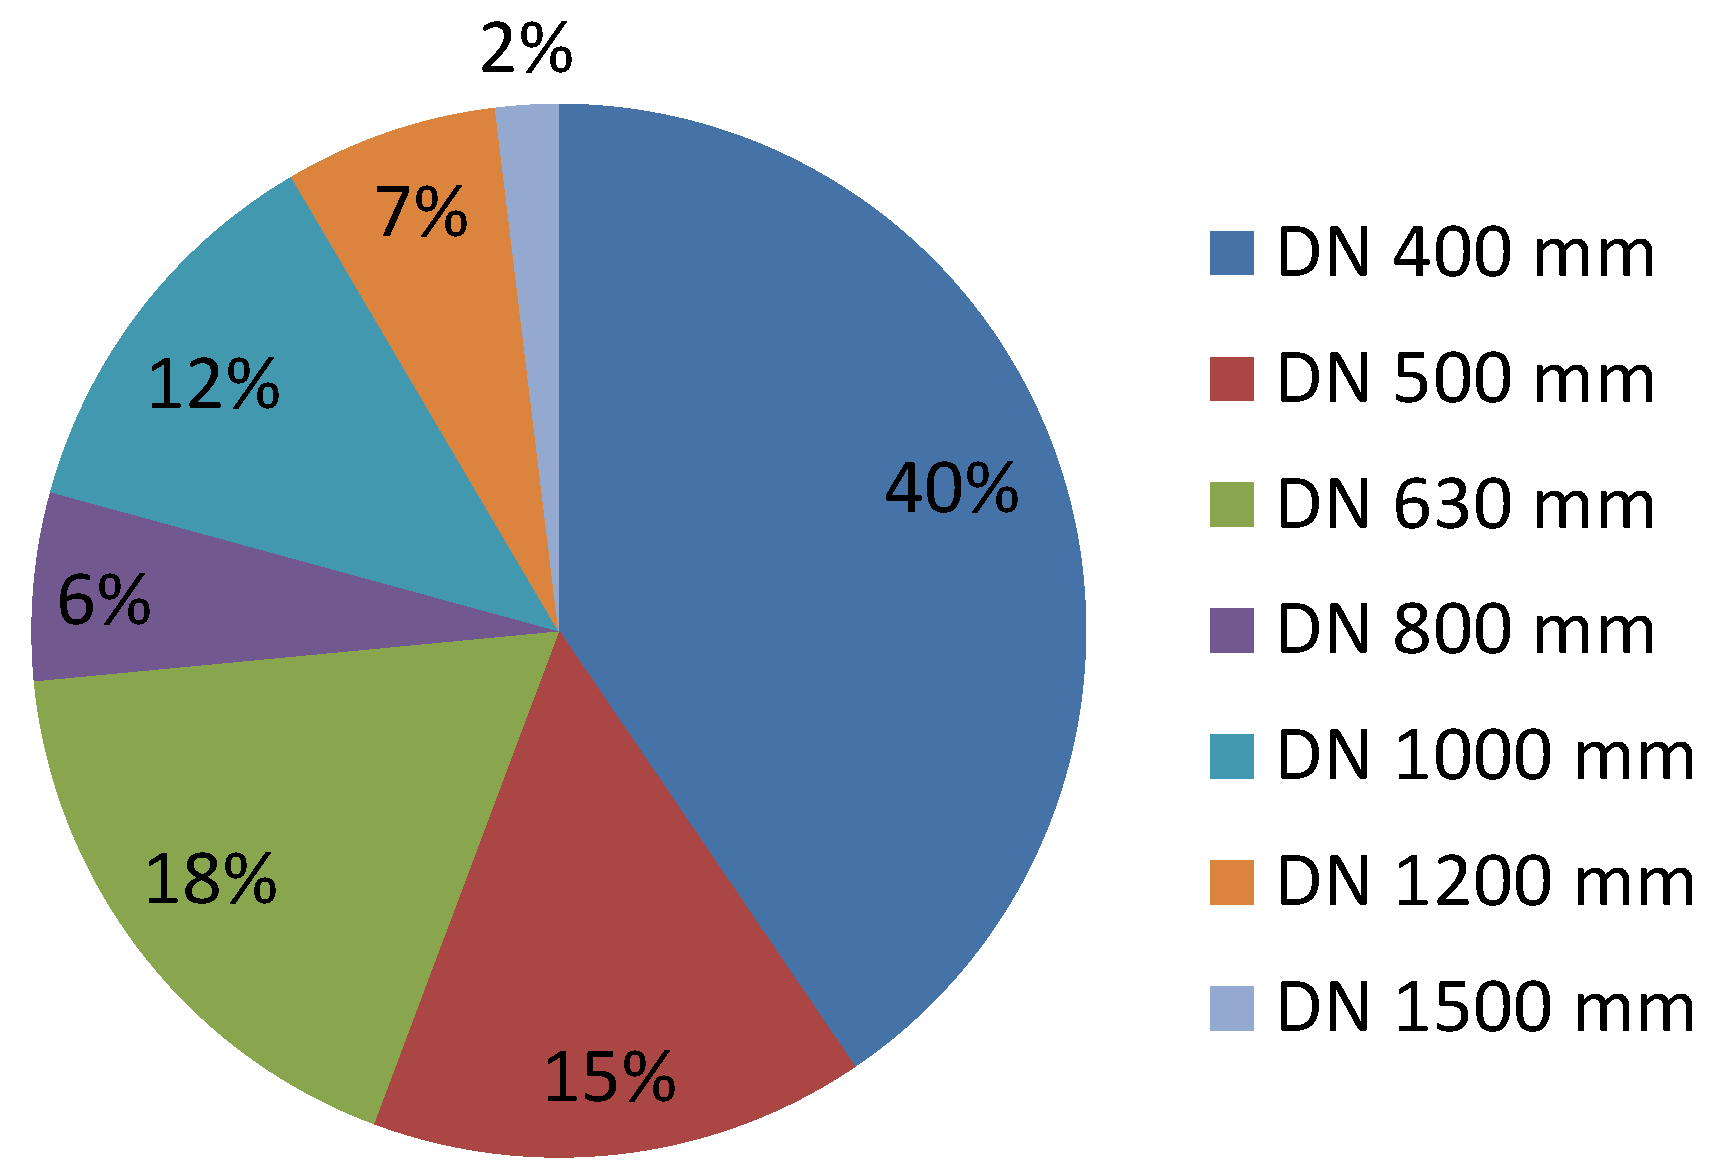
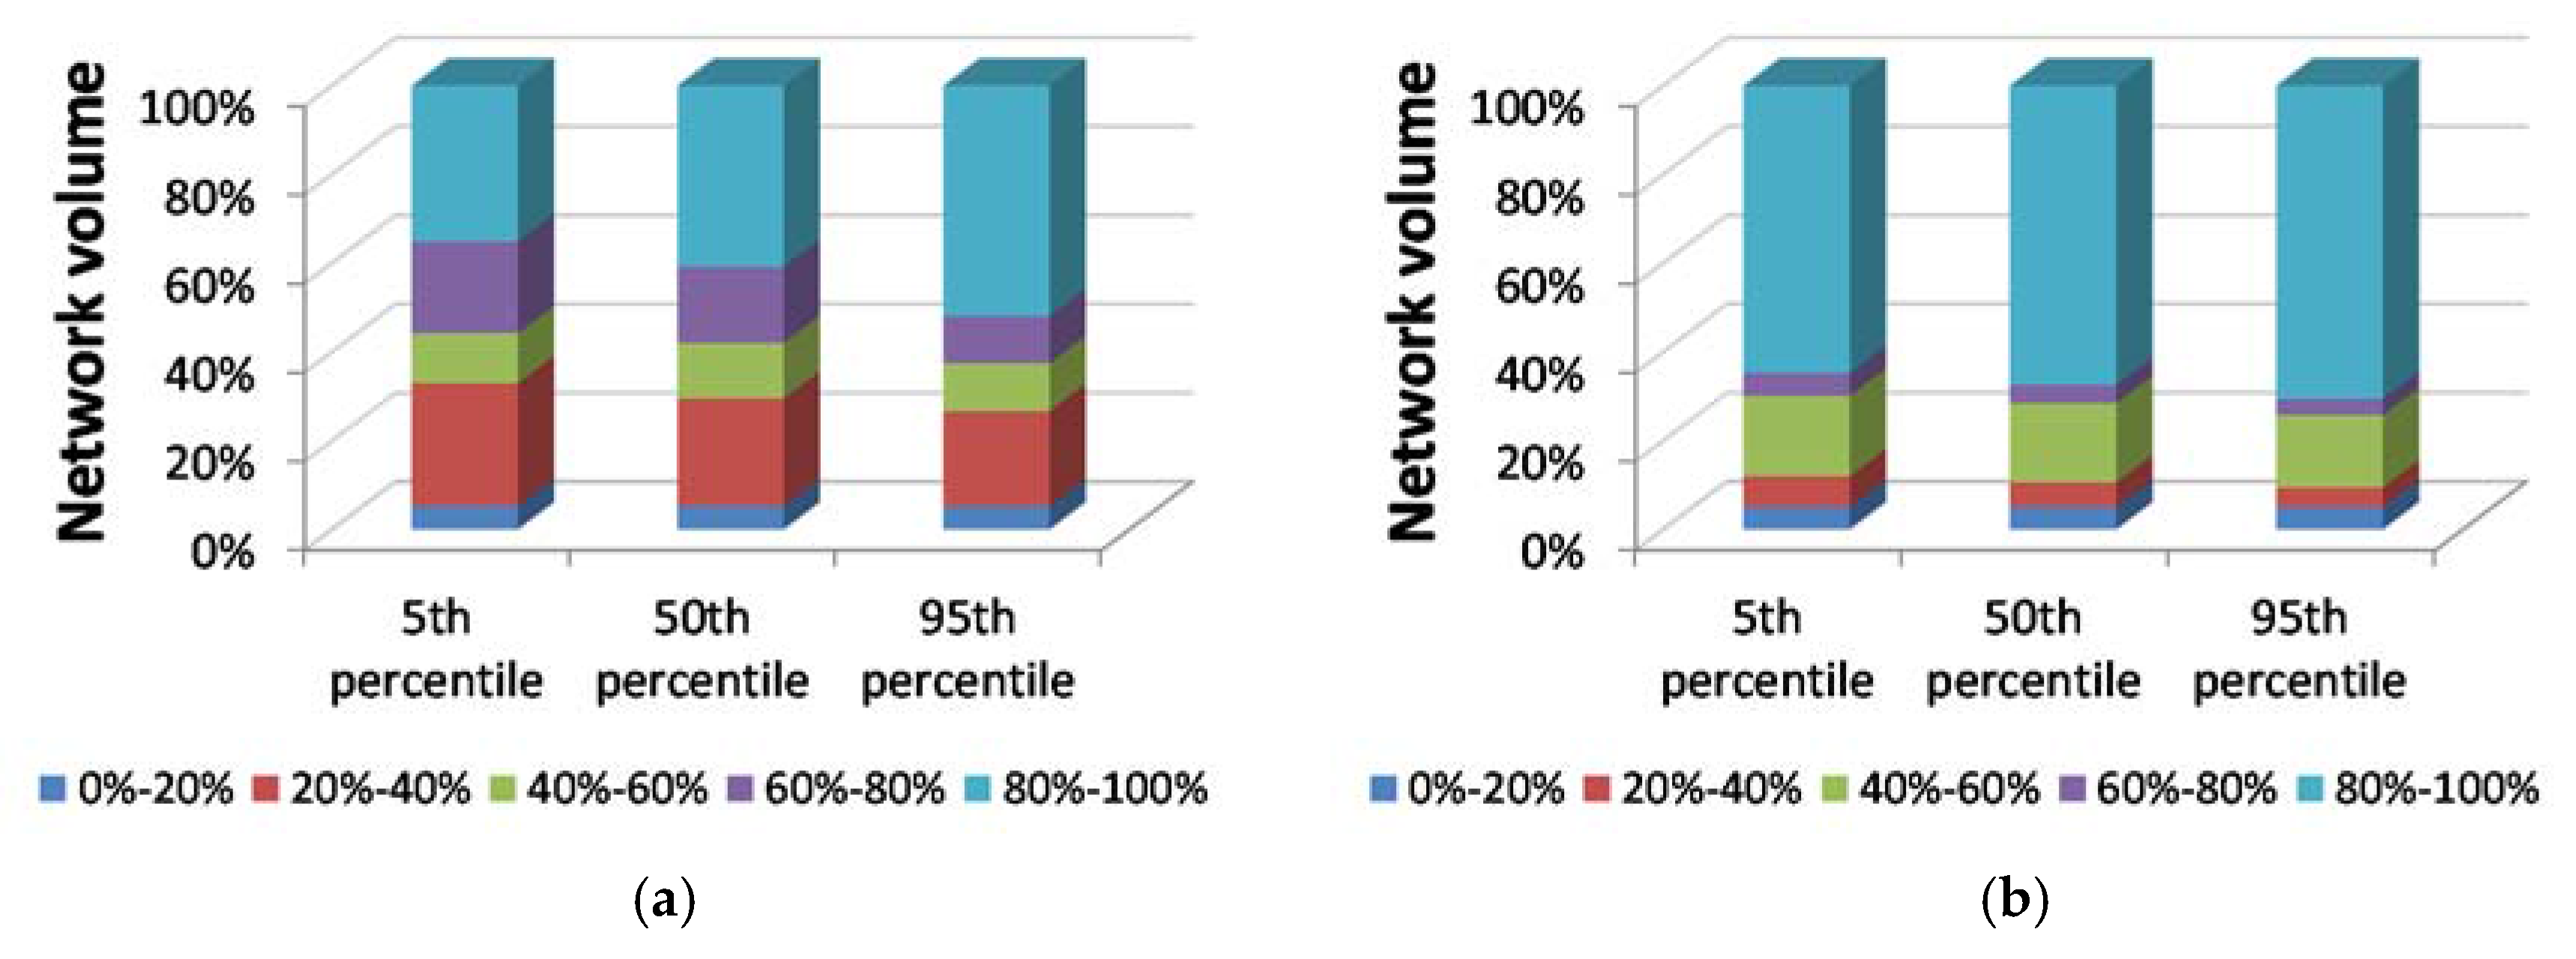
3.4. Analysis of Trend Implications on Urban Drainage System Design

- aT = 30.75 mm and nT = 0.28 (design conditions);
- aT = 34.40 mm and nT = 0.25 (historical dataset up to 2008);
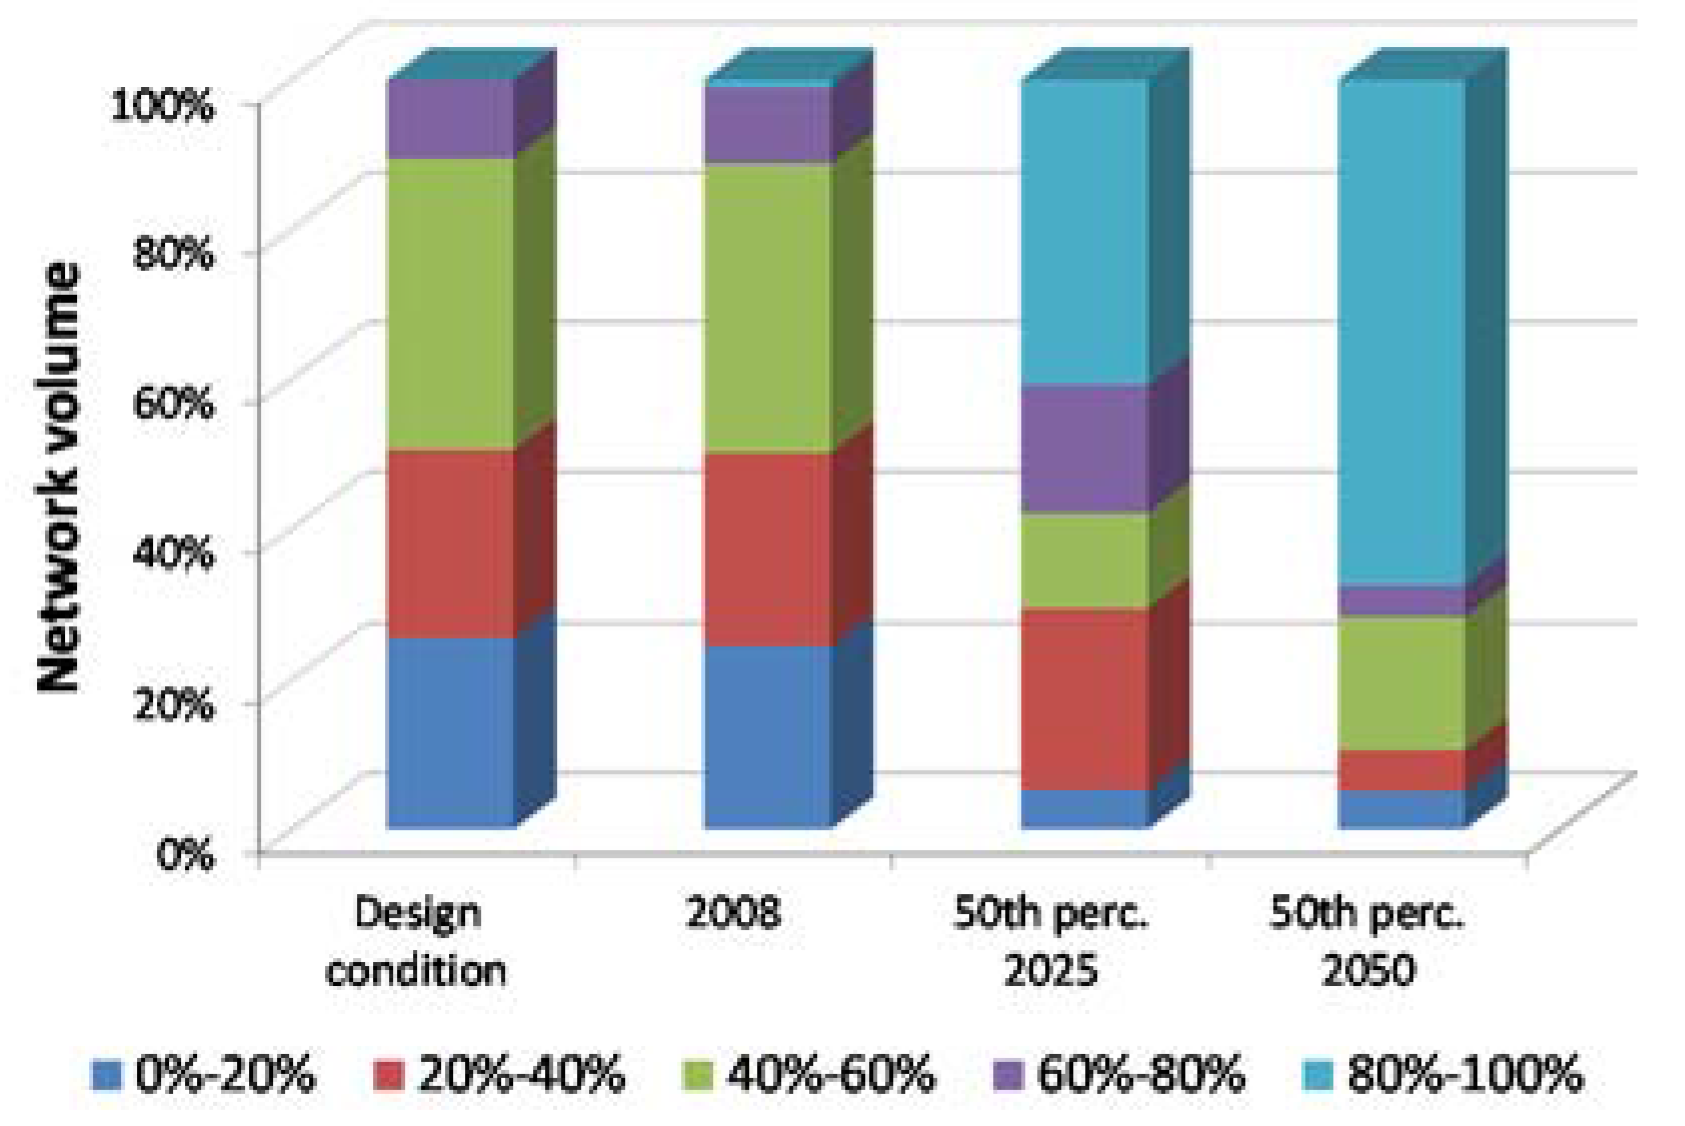
| Max Pipe Capacity | Network Pipe Volume | |||||||
|---|---|---|---|---|---|---|---|---|
| Design Conditions | 2008 * | 2025 | 2050 | |||||
| 5th perc** | 50th perc | 95th perc | 5th perc | 50th perc | 95th perc | |||
| 0%–20% | 25.64% | 24.55% | 5.33% | 5.33% | 5.25% | 5.12% | 5.12% | 5.05% |
| 20%–40% | 24.87% | 25.53% | 27.63% | 24.21% | 21.40% | 6.88% | 5.50% | 4.38% |
| 40%–60% | 38.99% | 38.70% | 11.28% | 12.47% | 10.80% | 18.11% | 17.85% | 16.33% |
| 60%–80% | 10.50% | 10.15% | 20.63% | 17.16% | 10.62% | 5.14% | 4.15% | 3.66% |
| 80%–100% | 0.00% | 1.06% | 35.13% | 40.82% | 51.93% | 64.76% | 67.38% | 70.58% |


4. Conclusions
Acknowledgments
Conflicts of Interest
References
- Trenberth, K.E.; Dai, A.; Rasmussen, R.M.; Parsons, D.B. The changing character of precipitation. Bull. Am. Meteorol. Soc. 2003, 84, 1205–1217. [Google Scholar] [CrossRef]
- Alexander, L.V.; Zhang, X.; Peterson, T.C.; Caesar, J.; Gleason, B.; Klein Tank, A.M.G.; Haylock, M.; Collins, D.; Trewin, R.; Rahimzadeh, F.; et al. Global observed changes in daily climate extremes of temperature and precipitation. J. Geophys. Res. 2006, 111. [Google Scholar] [CrossRef]
- Middelkoop, H.; Daamen, K.; Gellens, D.; Grabs, W.; Kwadijk, J.C.; Lang, H.; Parmet, B.W.; Schädler, B.; Schulla, J.; Wilke, K. Impact of climate change on hydrological regimes and water resources management in the Rhine basin. Clim. Chang. 2001, 49, 105–128. [Google Scholar] [CrossRef]
- Intergovernmental Panel on Climate Change (IPCC). Summary for Policymakers. Climate Change 2013: The Physical Science Basis. Contribution of Working Group I to the Fifth Assessment Rep. of the Intergovernmental Panel on Climate Change; Stocker, TF., Qin, D., Plattner, G.K., Tignor, M., Allen, S.K., Boschung, J., Nauels, A., Xia, Y., Bex, V., Midgley, P.M., Eds.; Cambridge University Press: Cambridge, UK, 2013. [Google Scholar]
- Freni, G.; la Loggia, G.; Notaro, V. Uncertainty in urban flood damage assessment due to urban drainage modelling and depth—Damage curve estimation. Water Sci. Technol. 2010, 61, 2979–2993. [Google Scholar] [CrossRef] [PubMed]
- Fu, G.; Kapelan, Z. Flood analysis of urban drainage systems: Probabilistic dependence structure of rainfall characteristics and fuzzy model parameters. J. Hydroinform. 2013, 15, 687–699. [Google Scholar] [CrossRef]
- Ahn, J.; Cho, W.; Kim, T.; Shin, H.; Heo, J.H. Flood frequency analysis for the annual peak flows simulated by an event-based rainfall-runoff model in an urban drainage basin. Water 2014, 6, 3841–3863. [Google Scholar] [CrossRef]
- Notaro, V.; Fontanazza, C.M.; la Loggia, G.; Freni, G. Identification of the best flood retrofitting scenario in an urban watershed by means of a Bayesian Decision Network. In Urban Water II; Mambretti, S., Brebbia, C.A., Eds.; WIT Press: Ashurst, New Forest, UK, 2014; pp. 341–352. [Google Scholar]
- Butler, D.; McEntee, B.; Onof, C.; Hagger, A. Sewer storage tank performance under climate change. Water Sci. Technol. 2007, 56, 29–35. [Google Scholar] [CrossRef] [PubMed]
- Kleidorfer, M.; Möderl, M.; Sitzenfrei, R.; Urich, C.; Rauch, W. A case independent approach on the impact of climate change effects on combined sewer system performance. Water Sci. Technol. 2009, 60, 1555–1564. [Google Scholar] [CrossRef] [PubMed]
- Papa, F.; Guo, Y.; Thoman, G.W. Urban drainage infrastructure planning and management with a changing climate. In Proceedings of the 57th Canadian Water Resources Association Annual Congress—Water and Climate Change: Knowledge for Better Adaptation, Montréal, QC, Canada, 16–18 June 2004; p. 6.
- Grum, M.; Jørgensen, A.T.; Johansen, R.M.; Linde, J.J. The effect of climate change on urban drainage: An evaluation based on regional climate model simulations. Water Sci. Technol. 2006, 54, 9–15. [Google Scholar] [PubMed]
- Fontanazza, C.M.; Freni, G.; la Loggia, G.; Notaro, V. Uncertainty evaluation of design rainfall for urban flood risk analysis. Water Sci. Technol. 2011, 63, 2641–2650. [Google Scholar] [CrossRef] [PubMed]
- Fontanazza, C.M.; Freni, G.; Notaro, V. Bayesian inference analysis of the uncertainty linked to the evaluation of potential flood damage in urban areas. Water Sci. Technol. 2012, 66, 1669–1677. [Google Scholar] [PubMed]
- Notaro, V.; Fontanazza, C.M.; Freni, G.; Puleo, V. Impact of rainfall resolution in time and space on the urban flooding evaluation. Water Sci. Technol. 2013, 68, 1984–1993. [Google Scholar] [CrossRef] [PubMed]
- Wang, Y.; McBean, E.A. Uncertainty characterization of rainfall inputs used in the design of storm sewer infrastructure. J. Urban Rural Water Syst. Model. 2013, 22. [Google Scholar] [CrossRef]
- Arnbjerg-Nielsen, K. Significant climate change of extreme rainfall in Denmark. Water Sci. Technol. 2006, 54, 1–8. [Google Scholar] [CrossRef] [PubMed]
- Burlando, P.; Rosso, R. Extreme storm rainfall and climatic change. Atmos. Res. 1991, 27, 169–189. [Google Scholar] [CrossRef]
- Mailhot, A.; Duchesne, S. Design Criteria of Urban Drainage Infrastructures under Climate Change. J. Water Resour. Plan. Manag. 2009, 136, 201–208. [Google Scholar] [CrossRef]
- Larsen, A.N.; Gregersen, I.B.; Christensen, O.B.; Linde, J.J.; Mikkelsen, P.S. Potential future increase in extreme one-hour precipitation events over Europe due to climate change. Water Sci. Technol. 2009, 60, 2205–2216. [Google Scholar] [CrossRef] [PubMed]
- Nguyen, V.; Nguyen, T.; Cung, A.A. Statistical Approach to Downscaling of Sub-daily Extreme Rainfall Processes for Climate-Related Impacts Studies in Urban Areas. Water Sci. Technol. Water Suppl. 2007, 7, 183–192. [Google Scholar] [CrossRef]
- Olsson, J.; Berggren, K.; Olofsson, M.; Viklander, M. Applying climate model precipitation scenarios for urban hydrological assessment: A case study in Kalmar City, Sweden. Atmos. Res. 2009, 92, 364–375. [Google Scholar] [CrossRef]
- Willems, P.; Vrac, M. Statistical precipitation downscaling for small-scale hydrological impact investigations of climate change. J. Hydrol. 2011, 402, 193–205. [Google Scholar] [CrossRef]
- Mirhosseini, G.; Srivastava, P.; Stefanova, L. The impact of climate change on rainfall Intensity-Duration-Frequency (IDF) curves in Alabama. Reg. Environ. Chang. 2013, 13, 25–33. [Google Scholar] [CrossRef]
- Palutikof, J.P. Some possible impacts of greenhouse gas induced climatic change on water resources in England and Wales. In The Influence of Climate Change and Climate Variability on the Hydrologic Regime and Water Resources; IAHS: Vancouver, Canada, 1987; pp. 585–596. [Google Scholar]
- Krasovskaia, I.; Gottschalk, L. Stability of river flow regimes. Nord. Hydrol. 1992, 23, 137–154. [Google Scholar]
- Liuzzo, L.; Freni, G. Analysis of Extreme Rainfall Trends in Sicily for the Evaluation of Depth-Duration-Frequency Curves in Climate Change Scenarios. J. Hydrol. Eng. 2015, 20. [Google Scholar] [CrossRef]
- Mann, H.B. Nonparametric tests against trend. Econ. J. Econ. Soc. 1945, 13, 245–259. [Google Scholar] [CrossRef]
- Kendall, M.G. Rank Correlation Methods, 3rd ed.; Hafner Publishing Company: New York, NY, USA, 1962. [Google Scholar]
- Helsel, D.R.; Hirsch, R.M. Statistical Methods in Water Resources; Elsevier: Reston, VA, USA, 1992; Volume 49. [Google Scholar]
- Hirsch, R.M.; Slack, J.R.; Smith, R.A. Techniques of trend analysis for monthly water quality data. Water Resour. Res. 1982, 18, 107–121. [Google Scholar] [CrossRef]
- Burlando, P.; Rosso, R. Scaling and multiscaling models of depth-duration-frequency curves for storm precipitation. J. Hydrol. 1996, 187, 45–64. [Google Scholar] [CrossRef]
- Ranzi, R.; Mariani, M.; Rossini, E.; Armanelli, B.; Bacchi, B. Analisi e Sintesi Delle Piogge Intense del Territorio Bresciano; Technical Report N. 12; University of Brescia: Brescia, Italy, 1999; p. 94. [Google Scholar]
- Gupta, V.K.; Waymire, E. Multiscaling properties of spatial rainfall and river flow distributions. J. Geophys. Res. Atmos 1990, 95, 1999–2009. [Google Scholar] [CrossRef]
- Rossi, F.; Fiorentino, M.; Versace, P. Two-component extreme value distribution for flood-frequency analysis. Wat. Resour. Res. 1984, 20, 847–856. [Google Scholar] [CrossRef]
- Klein Tank, A.M.G.; Wijngaard, J.B.; Konnen, G.P.; Bohm, R.; Demaree, G.; Gocheva, A.; Mileta, M.; Pashiardis, S.; Hejkrlik, L.; Kern-Hansen, C.; et al. Daily surface air temperature and precipitation dataset 1901–1999 for European Climate Assessment (ECA). Int. J. Climatol. 2002, 22, 1441–1453. [Google Scholar] [CrossRef]
- Jones, P.D.; Moberg, A. Hemispheric and large-scale surface air temperature variations: An extensive revision and an update to 2001. J. Clim. 2003, 16, 206–223. [Google Scholar] [CrossRef]
- Vose, R.S.; Easterling, D.R.; Gleason, B. Maximum and minimum temperature trends for the globe: An update through 2004. Geophysical. Res. Lett. 2005, 32. [Google Scholar] [CrossRef]
- Toreti, A.; Desiato, F. Temperature trend over Italy from 1961 to 2004. Theor. Appl. Climatol. 2008, 91, 51–58. [Google Scholar] [CrossRef]
- Liuzzo, L.; Bono, E.; Sammartano, V.; Freni, G. Analysis of spatial and temporal rainfall trends in Sicily during the 1921–2012 period. Theor. Appl. Climatol. 2015. [Google Scholar] [CrossRef]
- Coles, S.; Bawa, J.; Trenner, L.; Dorazio, P. An Introduction to Statistical Modeling of Extreme Values; Springer: London, UK, 2001; Volume 208. [Google Scholar]
- Bordi, I.; Fraedrich, K.; Petitta, M.; Sutera, A. Extreme value analysis of wet and dry periods in Sicily. Theor. Appl. Climatol. 2007, 87, 61–71. [Google Scholar] [CrossRef]
- Noto, L.V.; La Loggia, G. Use of L-moments approach for regional flood frequency analysis in Sicily, Italy. Water Res. Manag. 2009, 23, 2207–2229. [Google Scholar] [CrossRef]
- Hosking, J.R.M.; Wallis, J.R. Some statistics useful in regional frequency analysis. Water Resour. Res. 1993, 29, 271–281. [Google Scholar] [CrossRef]
- Rossman, L.A. Storm Water Management Model: User’s Manual 5.1; U.S. Environmental Protection Agency: Cincinnati, Ohio, USA, 2009.
- OFWAT. Preparing for the Future—Ofwat’s Climate Change Policy Statement; OFWAT: UK, 2008. Available online: https://www.ofwat.gov.uk (accessed on 22 September 2015).
© 2015 by the authors; licensee MDPI, Basel, Switzerland. This article is an open access article distributed under the terms and conditions of the Creative Commons by Attribution (CC-BY) license (http://creativecommons.org/licenses/by/4.0/).
Share and Cite
Notaro, V.; Liuzzo, L.; Freni, G.; La Loggia, G. Uncertainty Analysis in the Evaluation of Extreme Rainfall Trends and Its Implications on Urban Drainage System Design. Water 2015, 7, 6931-6945. https://doi.org/10.3390/w7126667
Notaro V, Liuzzo L, Freni G, La Loggia G. Uncertainty Analysis in the Evaluation of Extreme Rainfall Trends and Its Implications on Urban Drainage System Design. Water. 2015; 7(12):6931-6945. https://doi.org/10.3390/w7126667
Chicago/Turabian StyleNotaro, Vincenza, Lorena Liuzzo, Gabriele Freni, and Goffredo La Loggia. 2015. "Uncertainty Analysis in the Evaluation of Extreme Rainfall Trends and Its Implications on Urban Drainage System Design" Water 7, no. 12: 6931-6945. https://doi.org/10.3390/w7126667
APA StyleNotaro, V., Liuzzo, L., Freni, G., & La Loggia, G. (2015). Uncertainty Analysis in the Evaluation of Extreme Rainfall Trends and Its Implications on Urban Drainage System Design. Water, 7(12), 6931-6945. https://doi.org/10.3390/w7126667