Article

Uncertainty Analysis in the Evaluation of Extreme Rainfall Trends and Its Implications on Urban Drainage System Design

by
Vincenza Notaro
1,*,
Lorena Liuzzo
2,†,
Gabriele Freni
2,† and
Goffredo La Loggia
1,†
1
Dipartimento di Ingegneria Civile Ambientale Aerospaziale e dei Materiali, Università degli Studi di Palermo, 90128 Palermo, Italy
2
Facoltà di Ingegneria ed Architettura, Università degli Studi di Enna Kore, 94100 Enna, Italy
*
Author to whom correspondence should be addressed.
These authors contributed equally to this work.
Water 2015, 7(12), 6931-6945; https://doi.org/10.3390/w7126667
Submission received: 5 October 2015 / Accepted: 1 December 2015 / Published: 5 December 2015
(This article belongs to the Special Issue Uncertainty Analysis and Modeling in Hydrological Forecasting)

Abstract

:
Future projections provided by climate models suggest that the occurrence of extreme rainfall events will increase and this is evidence that the climate is changing. Because the design of urban drainage systems is based on the statistical analysis of past events, variations in the intensity and frequency of extreme rainfall represent a critical issue for the estimation of rainfall. For this reason, the design criteria of drainage systems should take into account the trends in the past and the future climate changes projections. To this end, a Bayesian procedure was proposed to update the parameters of depth–duration–frequency (DDF) curves to assess the uncertainty related to the estimation of these values, once the evidence of annual maximum rainfall trends was verified. Namely, in the present study, the historical extreme rainfall series with durations of 1, 3, 6, 12 and 24 h for the period of 1950–2008, recorded by the rain gauges located near the Paceco urban area (southern Italy), were analyzed to detect statistically significant trends using the non-parametric Mann-Kendall test. Based on the rainfall trends, the parameters of the DDF curves for a five-year return period were updated to define some climate scenarios. Finally, the implications of the uncertainty related to the DDF parameters estimation on the design of a real urban drainage system was assessed to provide an evaluation of its performance under the assumption of climate change. Results showed that the future increase of annual maximum precipitation in the area of study would affect the analyzed drainage system, which could face more frequent episodes of surcharge.

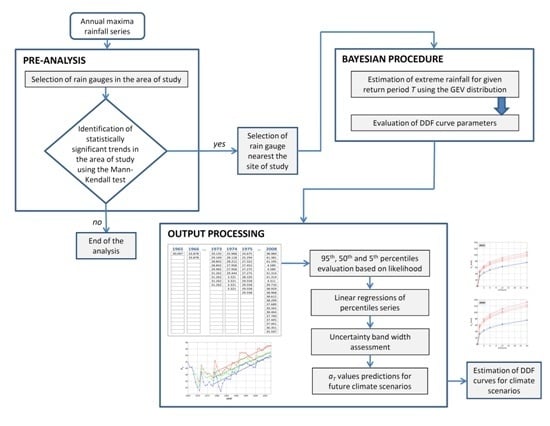
Graphical Abstract

1. Introduction

Changes in the hydrologic cycle due to the increase in atmospheric greenhouse gas concentrations cause variations in intensity, duration, and frequency of precipitation events [1,2]. The potential effects of climate change on rainfall extremes widely affect the design of storm water management structures. This issue is critical because variations in extreme rainfall may be larger than those of average estimates [3]. According to the latest report of the Intergovernmental Panel on Climate Change (IPCC) [4], annual heavy precipitation events have disproportionately increased compared to mean changes between 1951 and 2003 over many mid-latitude regions, even where reductions in annual total precipitation occurred.
In the context of climate change occurring, rainfall intensities could be increased, which would lead to an additional impact on drainage systems, due to the alteration of magnitude and frequency of peak flows over the service life of the infrastructure. Considering the potential effects of climate change on extreme rainfall can improve the results of the several methodologies aimed at evaluating potential flood risk and related damages in urban areas [5,6,7] or at supporting decision making for flood risk management [8].
Several studies have focused on the impact of changes in extreme rainfall intensities on urban drainage systems. Butler et al. [9] evaluated the potential effects of climate change on the design and performance of sewer storage tanks for a case study in London. More recently, Kleidorfer et al. [10] simulated the impact of higher rainfall intensities on combined sewer overflow discharges and flood risk using 250 virtual case studies. Therefore, the design criteria for drainage infrastructure require revision to take into account the expected changes in the intensity and frequency of heavy rainfall events [11,12]. Depth–Duration–Frequency (DDF) and Intensity–Duration–Frequency (IDF) relationships are widely used in the design of urban drainage systems to obtain probability related to extreme rainfall events for a specified return period and duration. Some studies emphasized the importance of improving the methodologies for the evaluation of storm estimations to obtain more reliable predictions [13,14,15,16]. Due to variations of extreme rainfall characteristics, for the design of future urban drainage systems, the current DDF and IDF curves will no longer be valid, requiring an adjustment for climate change [17]. Neglecting the effects of climate change in the hydraulic design of urban infrastructure could lead to underestimation or overestimation of design storms. Therefore, the use of accurate and reliable techniques for projections of IDF and DDF relationships under climate change is necessary to develop urban drainage systems suited to changes in intensity and frequency of extreme rainfall.
The international literature provides some studies in which procedures to integrate climate change effects on DDF and IDF relationships have been developed and applied [18,19]. For Europe, Larsen et al. [20] analyzed the impact of climate change on the IDF curves for extreme precipitation. Although the results are clearly affected by uncertainty, they highlight that the variations of extreme rainfall depend on location, rainfall duration and return period.
The downscaling of results from global circulation models or regional climate models to urban catchment scales is a frequent approach aimed to evaluate rainfall intensities in future climate scenarios [21,22,23]. Recently, Mirhosseini et al. [24] developed IDF curves under the future climate scenarios for Alabama using six dynamically downscaled projections; nevertheless, it is clear that such extrapolation could be highly uncertain due to the spatial variability of precipitation changes and the choice of the model. For this reason, the authors developed an ensemble model, incorporating all six climate models, as a proper solution to reduce this uncertainty.
Another consolidated and frequently used methodology to define climate scenarios is the temporal analogues approach [25,26]. According to this method, future climate projections are based on the linear variation of rainfall over past years, detected by a trend analysis, i.e., assuming that climate scenarios will be characterized by the same variation. Following the above-mentioned approach, Liuzzo and Freni [27] analyzed the annual maxima precipitation series recorded in Sicily (southern Italy) and integrated the results of a trend analysis in the evaluation of the DDF curves under two climate scenarios.
The main purpose of the present study is to provide a methodology to incorporate the effects of extreme rainfall variations on DDF curve evaluation and to assess the uncertainty related to the estimation of these curves. Moreover, the results of the proposed procedure were applied to estimate the effect of climate change on the hydraulic performance of a real drainage system located in the north-western part of Sicily; specifically, the updated DDF curves related to two different climate scenarios were adopted as the input rainfall to simulate the hydraulic behavior of the real urban drainage system of the town of Paceco.
To this end, a trend analysis was previously conducted by the application of the Mann-Kendall test to the historical series recorded in the rain gauges in the study area. Due to the evidence of a rainfall trend, a Bayesian procedure was applied to consider extreme rainfall variations as defined by the DDF curves for future climate scenarios and evaluate the uncertainty related to such projections. The procedure, based on proven and frequently used methodologies, can be easily applied to other case studies to account for variations of extreme rainfall intensity in the design criteria of urban drainage systems.
This paper is organized as follows: in Section 2 the Materials and Methods are presented. In Section 2.1, the proposed methodology is described. In Section 2.2, an illustration of the case study is provided. The results and implications of the trend magnitude on the criteria adopted for the urban drainage system design are presented and discussed in Section 3. In the Conclusion (Section 4), methodologies and results are briefly summarized.

2. Materials and Methods

2.1. The Proposed Methodology
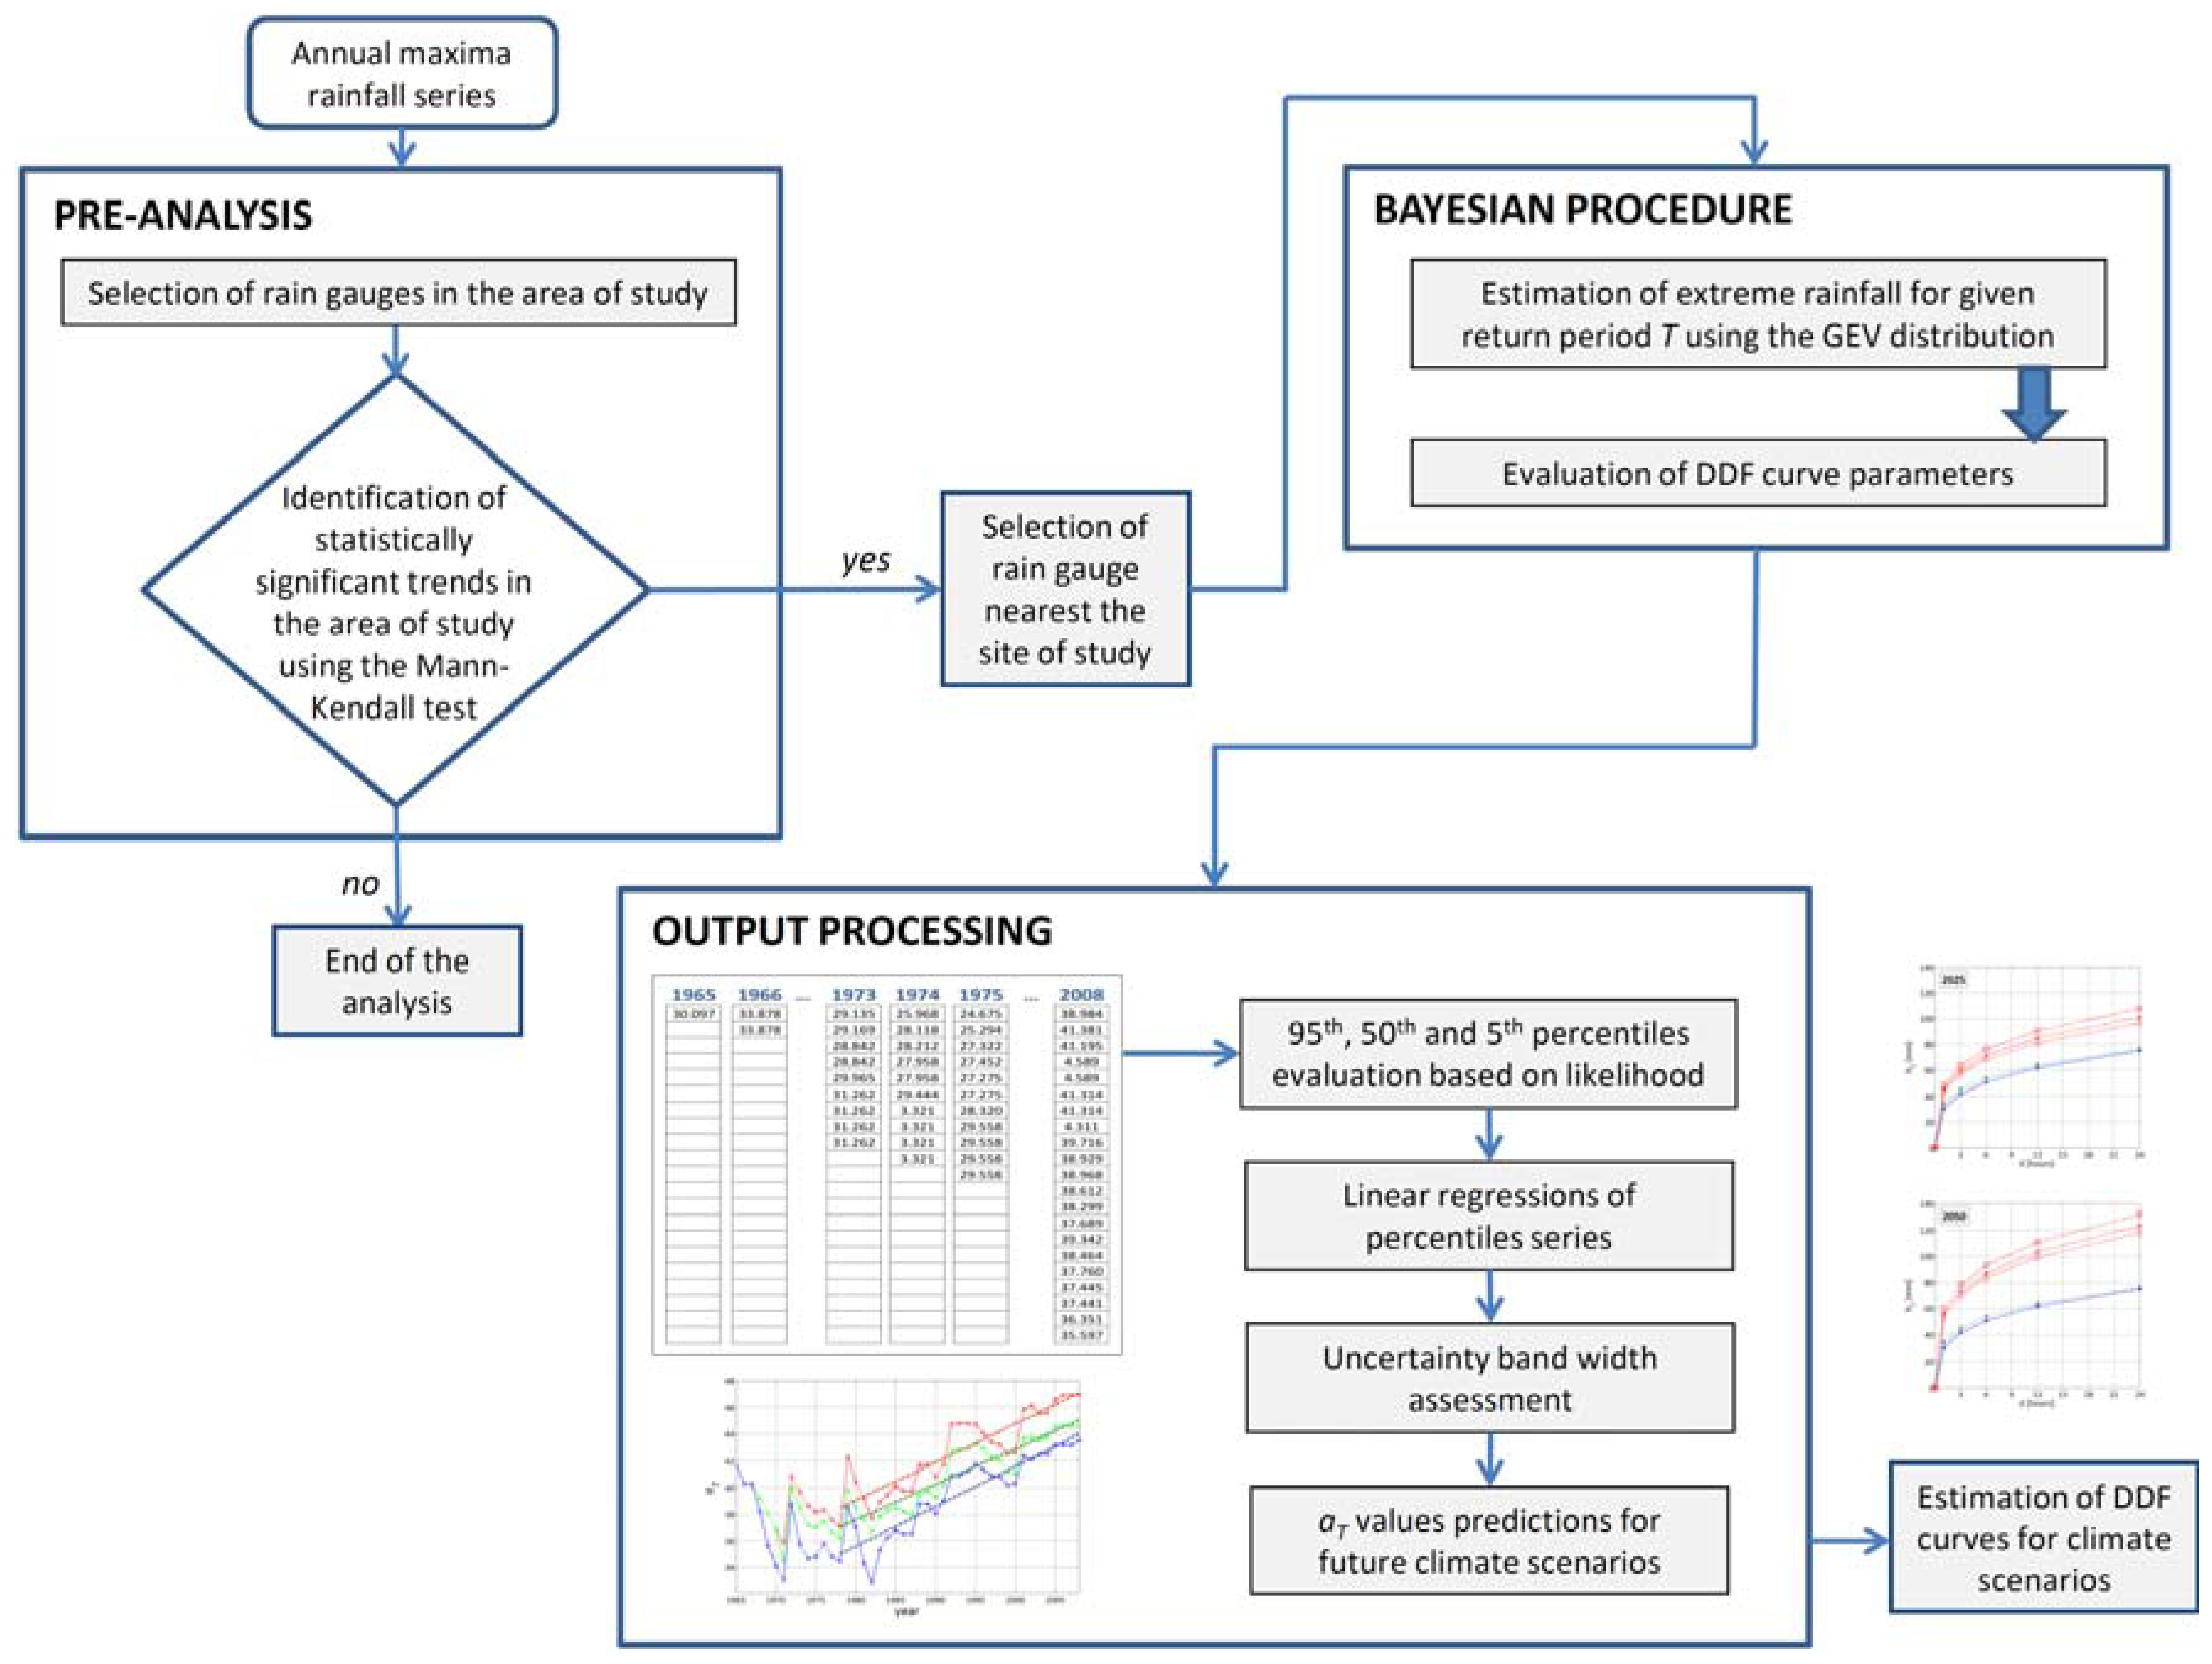
The procedure developed in the present work is illustrated by the flow chart in Figure 1. First, a pre-analysis was conducted to verify the presence of a trend in annual maxima rainfall series over the area of study. The identification of statistically significant trends in the area makes the updating of the DDF curves necessary to obtain more reliable estimates of extreme rainfall for design purposes. On the contrary, in the absence of trends, updating of the DDF curves is not required.
Figure 1. Flow chart of the proposed procedure.
Water 07 06667 g001
Several statistical procedures can be used for rainfall trend detection, particularly, parametric and non-parametric tests. A non-parametric technique, such as the Mann-Kendall test, could be used for trend detection [28,29]. This test identifies the presence of a trend without making an assumption about the distribution properties, although there must be no serial correlation for the resulting p-values for the trend to be correct [30]. Moreover, non-parametric methods are less influenced by the presence of outliers. In a trend test, the null hypothesis H0 is that there is no trend in the population from which the data are drawn and hypothesis H1 is that there is a trend in the records (for test description, see [30]).
The magnitude of trends can be evaluated using a non-parametric robust estimate determined by Hirsch et al. [31], as follows:
β = M e d i a n ( x j x l j l ) l < j
where xl is the l-th observation.
Once the pre-analysis detected a statistically significant rainfall trend in the analyzed area, a Bayesian procedure can be performed to account for the above-mentioned trend in the DDF curve assessment. The DDF curves describe rainfall depth as a function of duration for given return periods and represent an important tool for hydraulic structure design. Their definition requires the univariate statistical analysis of annual maxima rainfall depths for given durations (1, 3, 6, 12 and 24 h). The DDF relationship for the return period T often takes the form of a power law relationship, commonly used in Italy [32,33]:
h ( d ) T = a T d n T
where h(d)T is the rainfall depth at the specified return period T and duration d and where aT and nT are parameters.
The storm rainfall h(d)T is characterized by the property of scale invariance [34]. Denoting a scale factor by λ > 0, the property of scale invariance is valid if the random variable Zd) and λn·Z(d) have the same probability distribution for tinttout and tin ≤ λttout, where tin and tout represent the physical bounds for which the scale invariance property is valid. This property also implies that the quantiles and raw moments of any order are scale-invariant, i.e.,
h λ d , T = λ n h d , T
E [ h λ d r ] = λ n E [ h d r ]
where r denotes the order of the moment.
By adopting the properties of scale invariance, h(d)T can be expressed as
h ( d ) T = E [ H 60 1 ] w T d n T
where E[ H 60 1 ] is the mean annual maximum depth for the reference duration (1 h) and wT is the Tth quantile of the annual maximum storm depth normalized by its mean for any duration in the range of the existence of a scaling behavior (also referred as the growth factor). The product E[ H 60 1 ]·wT represents parameter aT in Equation (2).
The estimation of h(d)T quantiles can be obtained by means of different probability distribution laws, such as Gumbel, Generalized Extreme Value (GEV), Two Component Extreme Value (TCEV) [35], and others.
Although the above-mentioned procedure for the DDF definition is consolidated and widely applied, the DDF parameter estimation could be affected by a degree of uncertainty related to the dataset length when a rainfall trend has been identified. In fact, datasets that are too large could include non-homogenous data, whereas datasets that are too small could be inadequate to account for the trend effect. Therefore, in the present study, a Bayesian procedure has been proposed to estimate the uncertainty linked to the aT parameter of the DDF curve in the presence of a rainfall trend. To this end, the proposed procedure estimates the aT parameter linked to several continuous sub-datasets with different ending years and lengths. Starting from a minimum of 15 years, the length of each sub-dataset is increased by one, up to a maximum of 35 years. This assumption is supported by the evidence of an intensification of the hydrological cycle in the last 30–35 years, probably due to the upward trend of temperature occurring in Europe [36,37,38]. In Italy, the change point of the annual average temperature has been identified at the beginning of the 1980s [39]. The evidence of a statistically significant increase in mean annual rainfall over the last 30 years in Sicily [40] further supports this assumption. Finally, the purpose of this study is the assessment of implications of climate change on urban drainage system design; thus, referring to long-term trends (more than 35–40 years) seems to be inadequate because the design return periods of drainage systems typically range between 5 and 10 years.
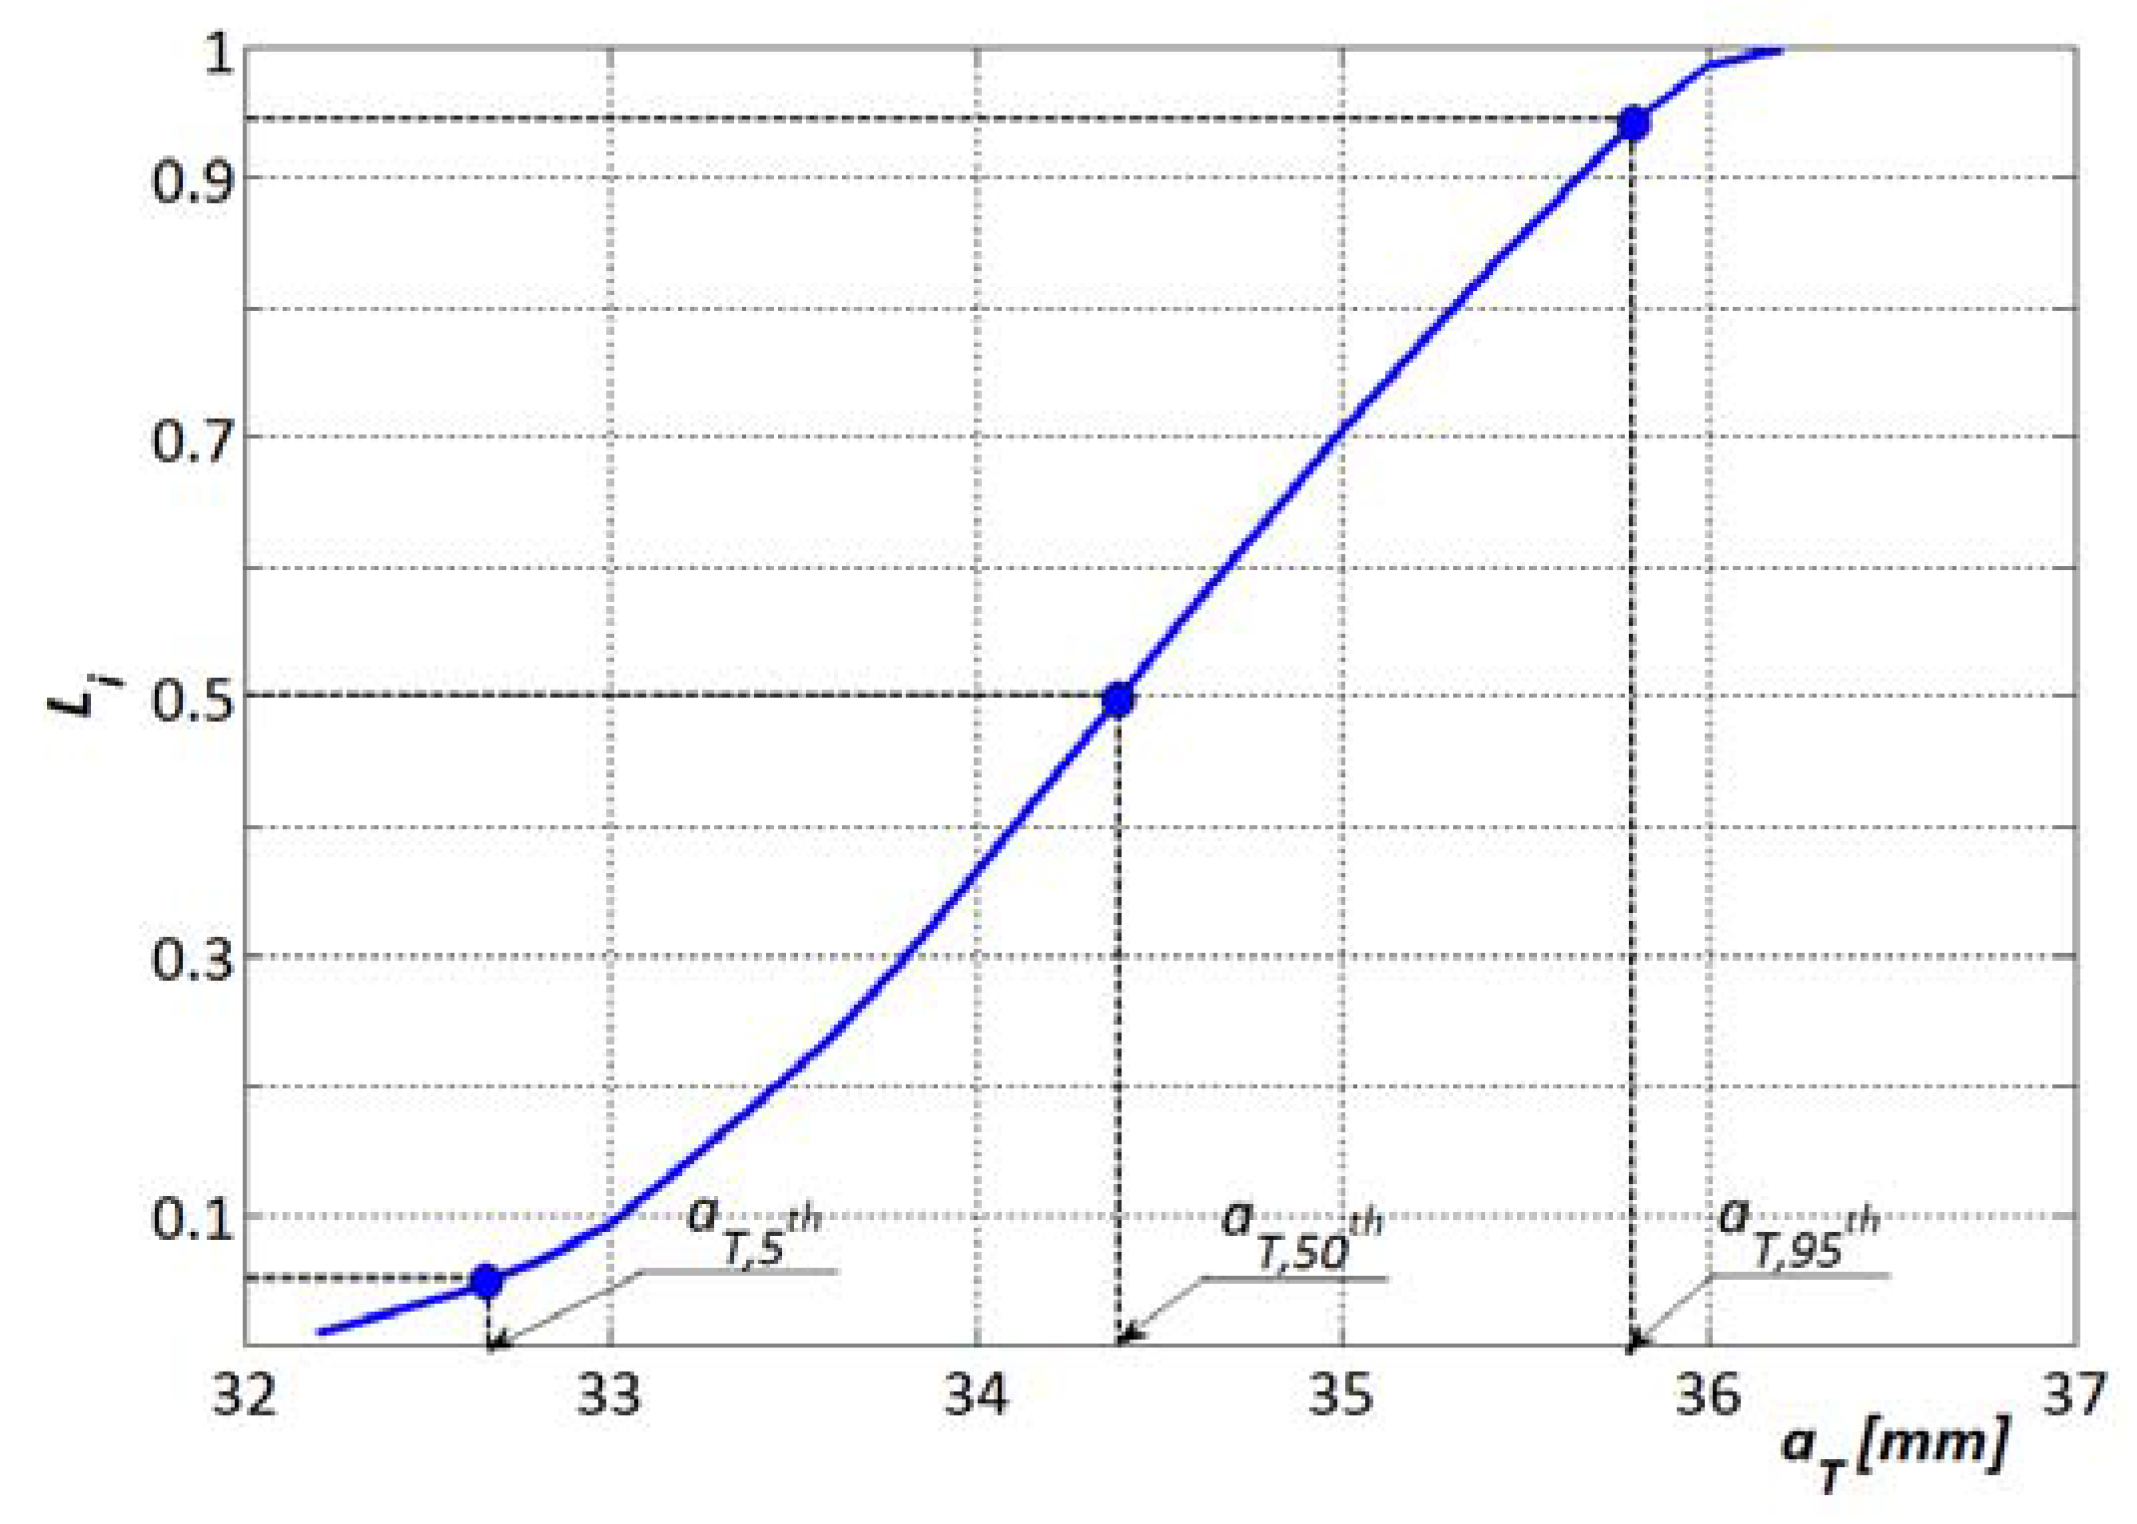
As the output of the Bayesian procedure, several series of the aT parameter are obtained, one for each ending year of the processed sub-datasets. To evaluate the 95th, 50th, and 5th percentiles of each aT series, the likelihood function value Li is assessed for each ith element (ending year of the sub-dataset), according to the following equation:
L i = 1 2 π σ e 2 e ( a T i a ¯ T ) 2 2 σ e 2
where σ e 2 is the variance of the error, a T i is the i-th element and a ¯ T is the median of the aT series. Then, the 95th, 50th, and 5th percentiles of each aT series are obtained from the cumulative distribution function (CDF) of Li, as shown in Figure 2.
Figure 2. Example of CDF of Li linked to an aT series and of the related 95th, 50th, and 5th percentiles.
Water 07 06667 g002
To define a mathematical law of the variability of aT in time, the linear regressions of its percentiles series are performed. These regressions are analyzed considering the last 30 years of the dataset because of the return periods commonly considered in drainage system design (5–10 years); therefore, referring to short-term trends is more appropriate.
The 95th and 5th percentile regression laws represent the upper and lower uncertainty bands linked to the appraisal of the aT parameter in time. Therefore, the width of these bands provides a quantification of the uncertainty inherent to the aT appraisal.
Finally, according to the temporal analogues approach, assuming the hypothesis of a linear trend, different climate scenarios can be generated supposing that the rainfall changes detected by the trend analysis will proceed in the future with the same pattern. Thus, the previously defined regression laws are used to extrapolate the aT parameter values for future projections. This procedure can be used to generate short-term projections that can be helpful in the design of urban drainage networks (up to the next 30–40 years). The availability of uncertainty bands, connected with the trend projection, makes the design process robust giving to the designer a measure of trend estimation reliability. Indeed, long-term projections require the availability of more recent data.

2.2. The Case Study: Dataset

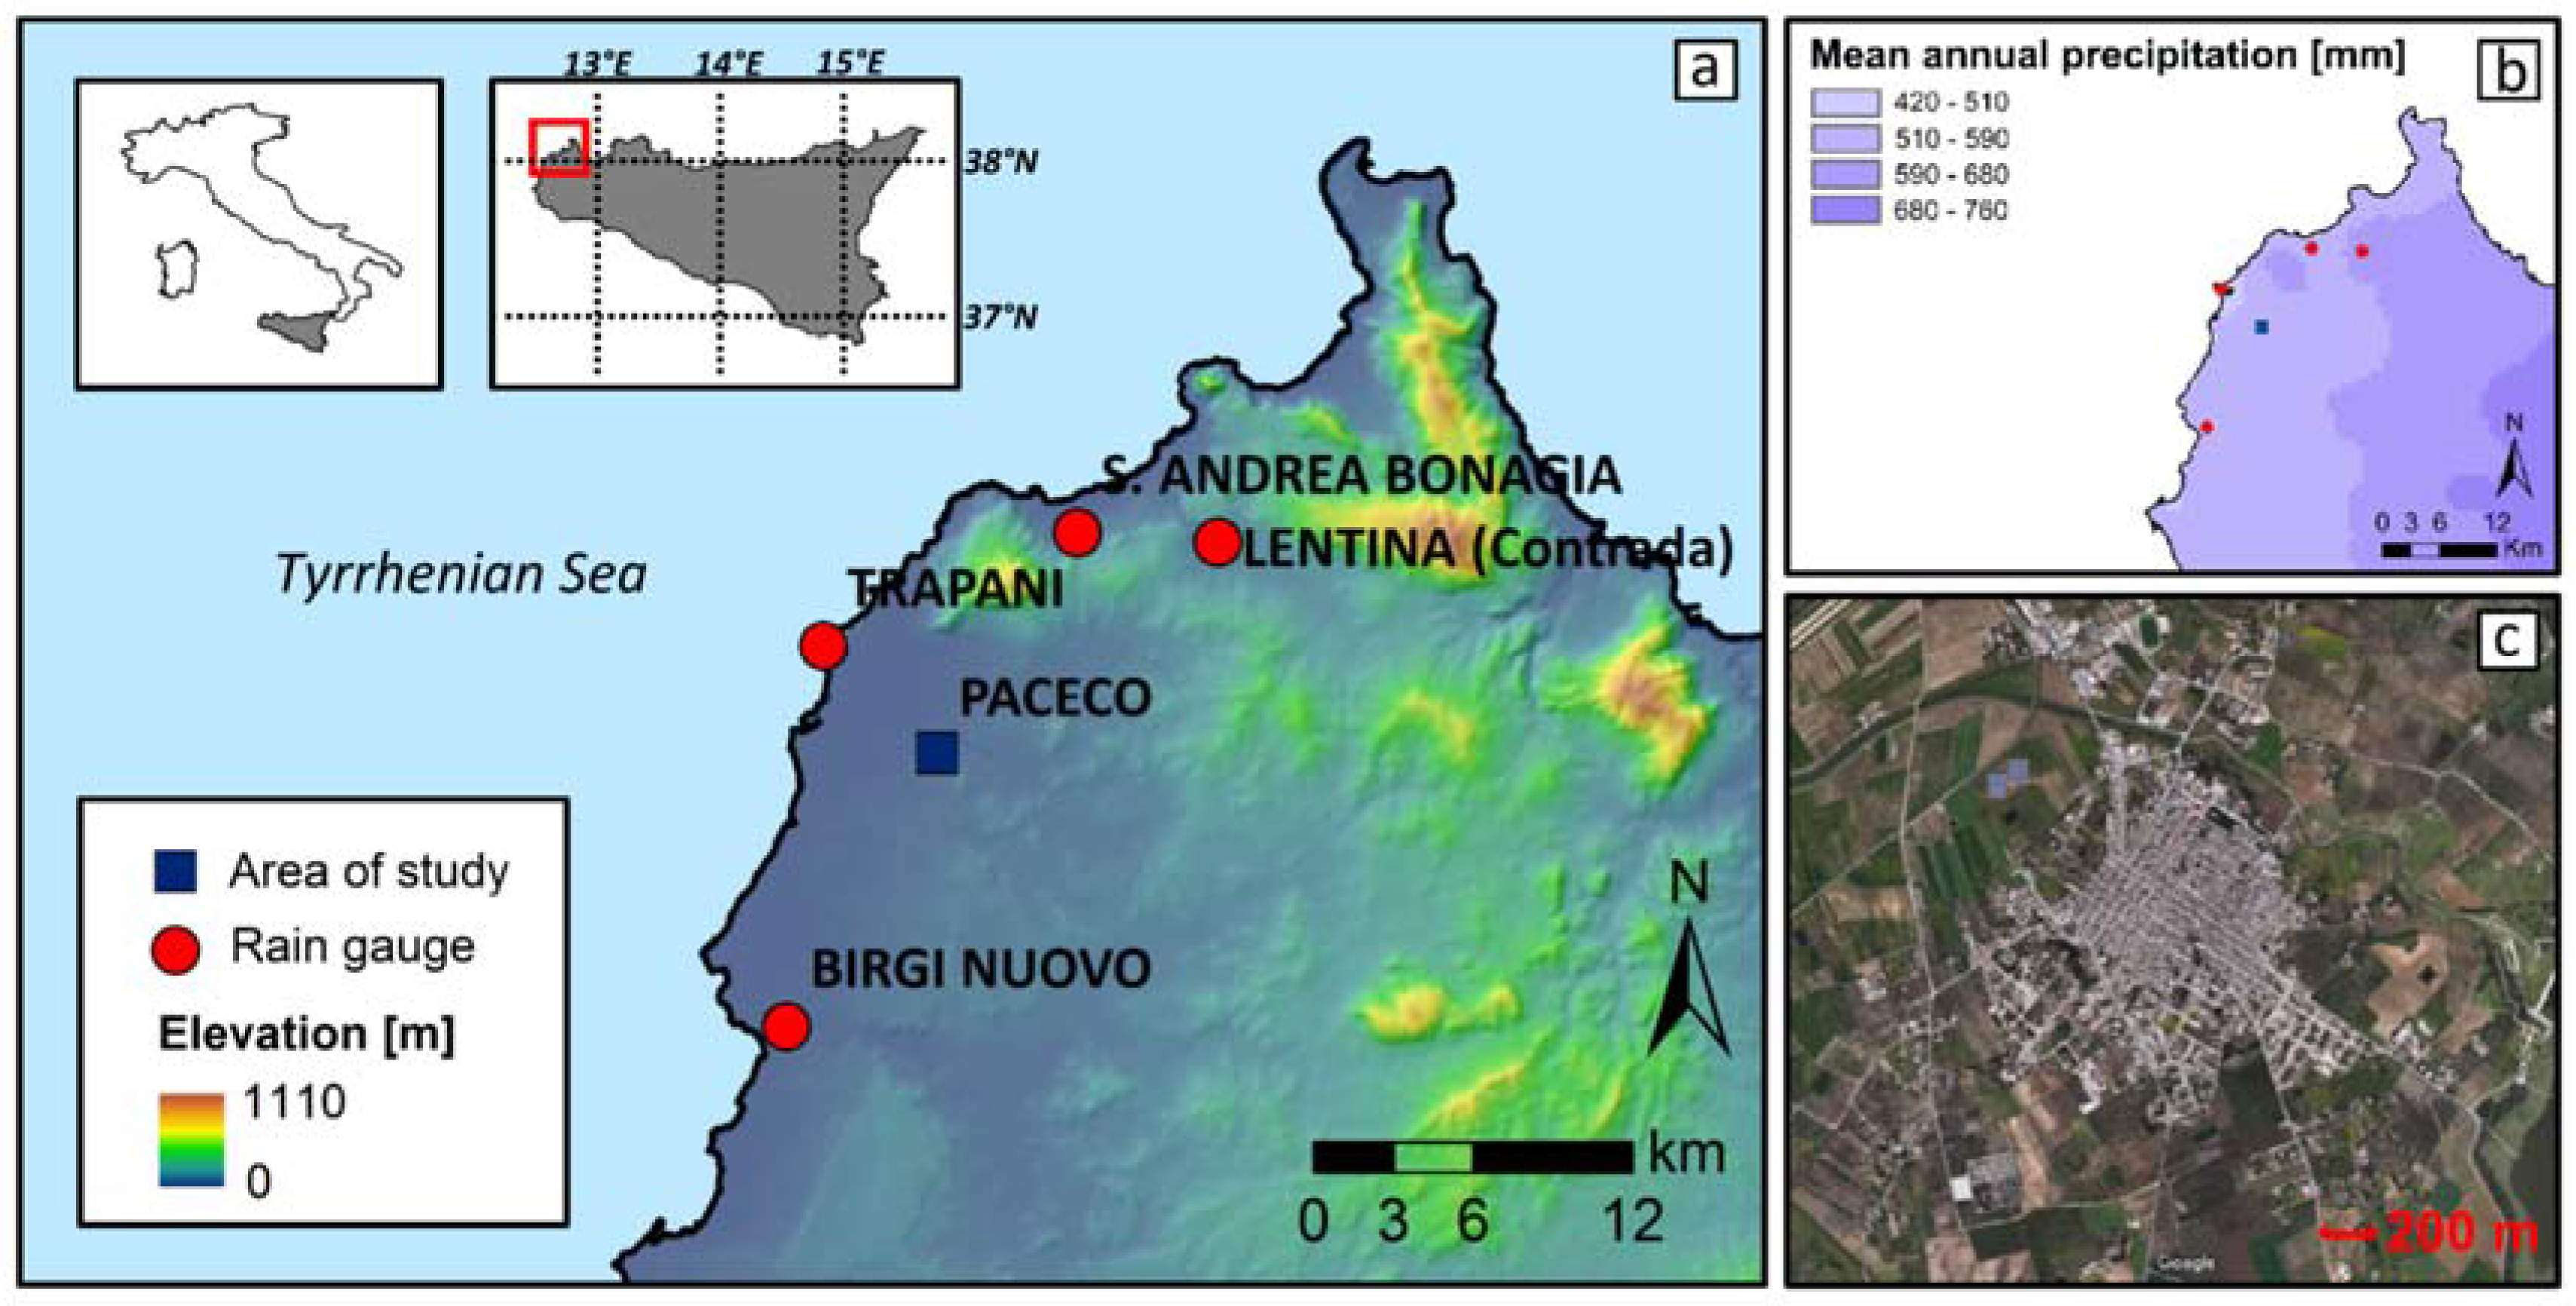
The study area is located in the north-western part of Sicily, an island of approximately 25,700 km2 in Southern Italy, characterized by a Mediterranean climate with mild winters and hot and generally dry summers, mainly influenced by hot winds blowing from the North African coast (Sirocco). Figure 3a shows the rain gauges in the analyzed area together with the Paceco location, a small town with a population of approximately 12,000 inhabitants, for which the urban drainage system has been selected as the case study. The mean annual precipitation over this area ranges between 500 and 600 mm (Figure 3b). Annual maxima rainfall series were not available for this site. Therefore, four rain gauges were selected in the surrounding area to detect statistically significant trends: Lentina (Contrada), S. Andrea Bonagia, Trapani and Birgi Nuovo. For these rain gauges, the available historical annual maxima rainfall series of durations 1, 3, 6, 12 and 24 h for the period from 1950 to 2008 were elaborated and provided by Osservatorio delle Acque-Regione Siciliana (OA-RS).
Figure 3. (a) Location of Paceco and the surrounding rain gauges; (b) mean annual precipitation in north-western Sicily; and (c) orthophotograph of Paceco.
Water 07 06667 g003

3. Results and Discussion

3.1. Pre-Analysis Results

For each of the rain gauges located in the analyzed area, a pre-analysis of the related annual maxima rainfall series was conducted using the Mann-Kendall non-parametric test, and the magnitude of significant trends was estimated using Equation (1). Trends have been considered statistically significant for significance level α at least equal to 0.1. The results obtained from the analysis of the extreme rainfall data are summarized in Table 1, where the level of significance of trend α, the magnitudes β (mm/year) and the p-values have been reported for each duration and rain gauge. With regards to a duration d of 1 h, series recorded by the Lentina (Contrada), S. Andrea Bonagia and Trapani rain gauges showed significant positive trends, with magnitudes ranging between 0.153 mm/year and 0.206 mm/year. An increase in the same entity was found at Birgi Nuovo, but its significance level is lower than 0.1. Considering the other durations, the maxima rainfall series of the S. Andrea Bonagia rain gauge showed a significant upward trend in every case. Positive trends were found in Trapani for 3 and 6 h durations.
Focusing on trend analysis results for d = 1 hour, it can be observed that in the area of study, an increase in the annual maximum rainfall occurred over the 1950–2008 period. Due to the low concentration time of urban watersheds, the design of urban drainage systems typically requires the knowledge of extreme rainfall relative to durations of 1 hour and lower (minutes) for a given return period. These results suggest that the area of study will probably face an increase in the urban drainage surcharge frequency due to the increase in rainfall intensities for the design return period.

3.2. Bayesian Procedure Results

Once the pre-analysis detected a statistically significant trend in the analyzed area, a Bayesian procedure was performed to account for the above-mentioned trend in the rainfall DDF curve assessment. Namely, the procedure was applied to the series recorded at the Trapani rain gauge, which is nearest to the urban watershed of Paceco, chosen as the case study.
Table 1. Level of significance, magnitude and p-value of trends for each duration and rain gauge. The symbol “+” indicates a positive trend.
DurationRain Gauge
Lentina (Contrada)S. Andrea BonagiaTrapaniBirgi Nuovo
1 htrend +/α = 0.01+/α = 0.05+/α = 0.01no trend (α < 0.1)
β (mm/year)0.1530.2060.1980.160
p-value0.0020.0100.000020.571
3 hαno trend (α < 0.1)+/α = 0.05+/α = 0.05no trend (α < 0.1)
β (mm/year)−0.0300.1170.140−0.114
p-value0.2140.0320.0110.151
6 hαno trend+/α = 0.05+/α = 0.05no trend (α < 0.1)
β (mm/year)−0.0540.0920.164−0.126
p-value0.2670.0250.0370.368
12 hαno trend (α < 0.1)+/α = 0.05no trend (α < 0.1)no trend (α < 0.1)
β (mm/year)0.0640.1830.1650.006
p-value0.1550.0190.1660.690
24 hαno trend (α < 0.1)+/α = 0.05no trend (α < 0.1)no trend (α < 0.1)
β (mm/year)0.1770.3080.2090.184
p-value0.4810.1010.8450.760
For the DDF curve definition, the Generalized Extreme Value (GEV) distribution was adopted to estimate h(d)T (Equation (2)). The GEV is a continuous probability distribution that combines the Gumbel, Frechet, and Weibull distributions. It is based on extreme value theory [41] and is frequently used to model extreme rainfall, providing a good fitting of the measured data in the Sicilian basin [42,43]. In this study, GEV parameters were estimated using the l-moments [44].
According to the proposed procedure, several continuous sub-datasets with different ending years and lengths were sampled, and the aT parameter of the related DDF curve was estimated. Starting from a minimum of 15 years, the length of each sub-dataset was increased by one, up to a maximum of 35 years.
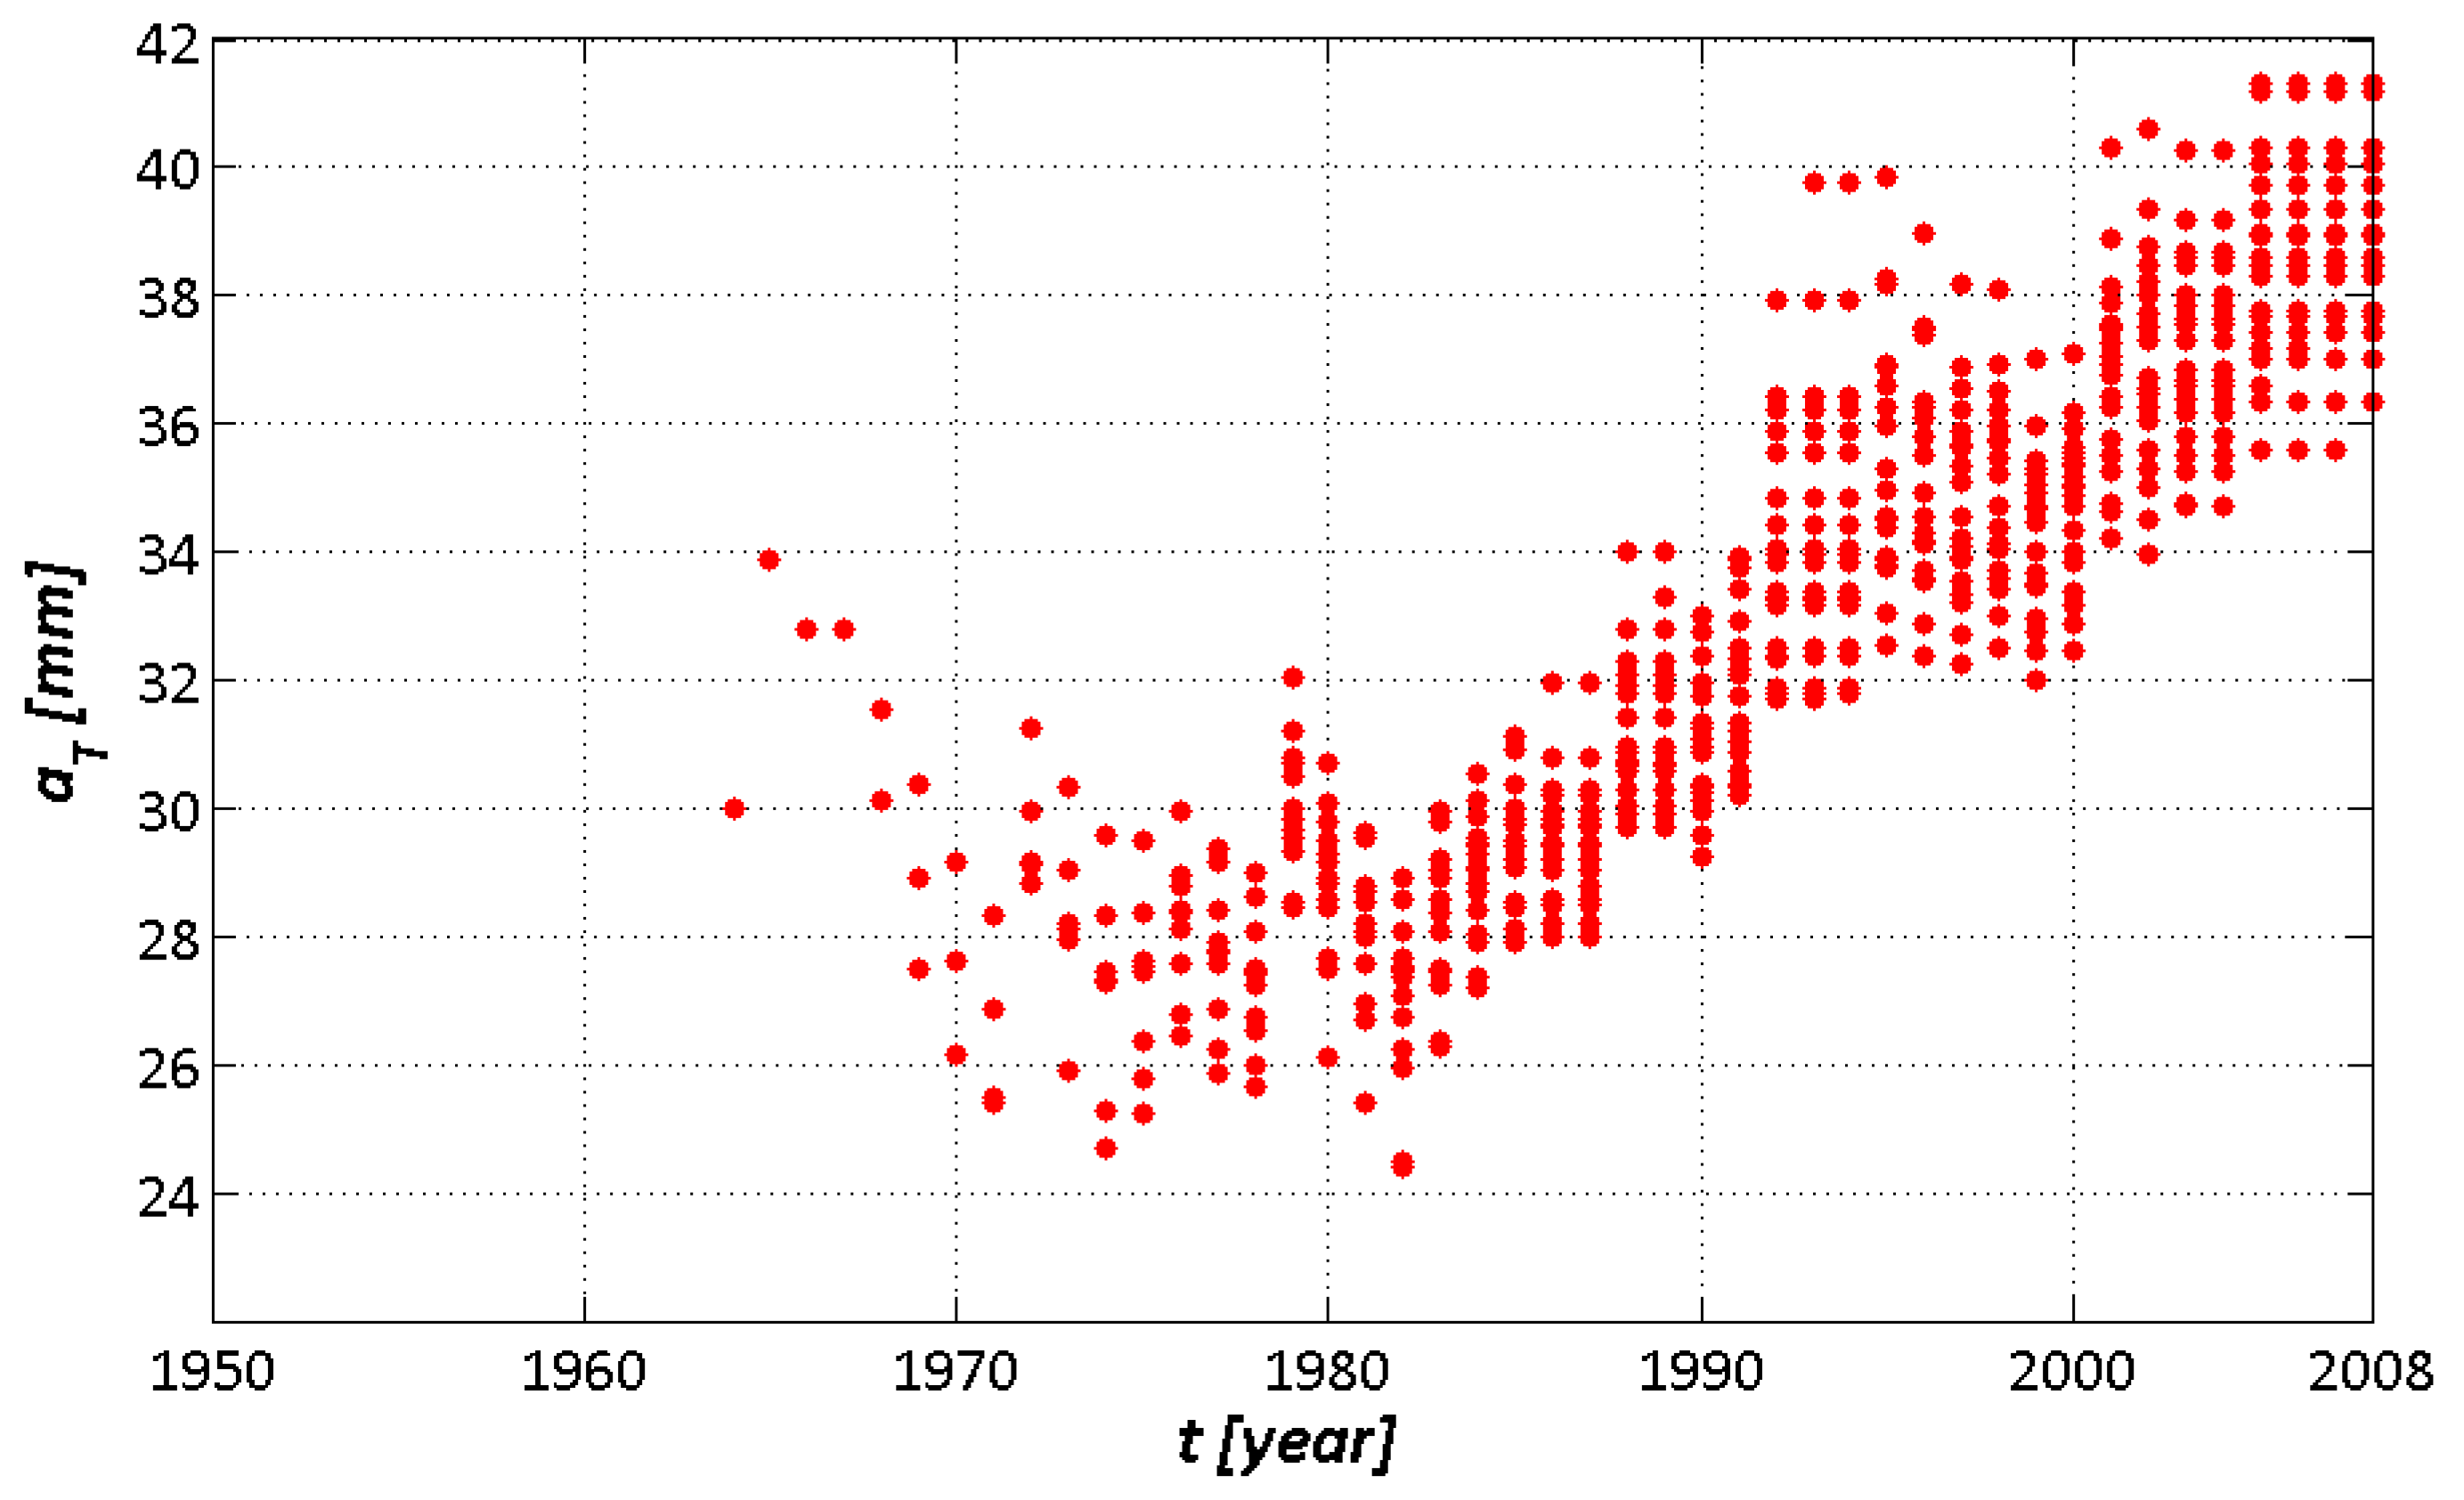
As the output of the Bayesian procedure, several series of the aT parameter were obtained, one for each ending year of the processed sub-datasets (ranging from 1964 to 2008). The aT series showed an increasing length: for the first four series (with an ending year ranging from 1964 to 1967), the aT parameter assumed the same value, due to the low number and the related reduced data variability of the sub-datasets linked to these series (Figure 4).
Figure 4. Bayesian procedure output: aT values for the Trapani rain gauge.
Water 07 06667 g004
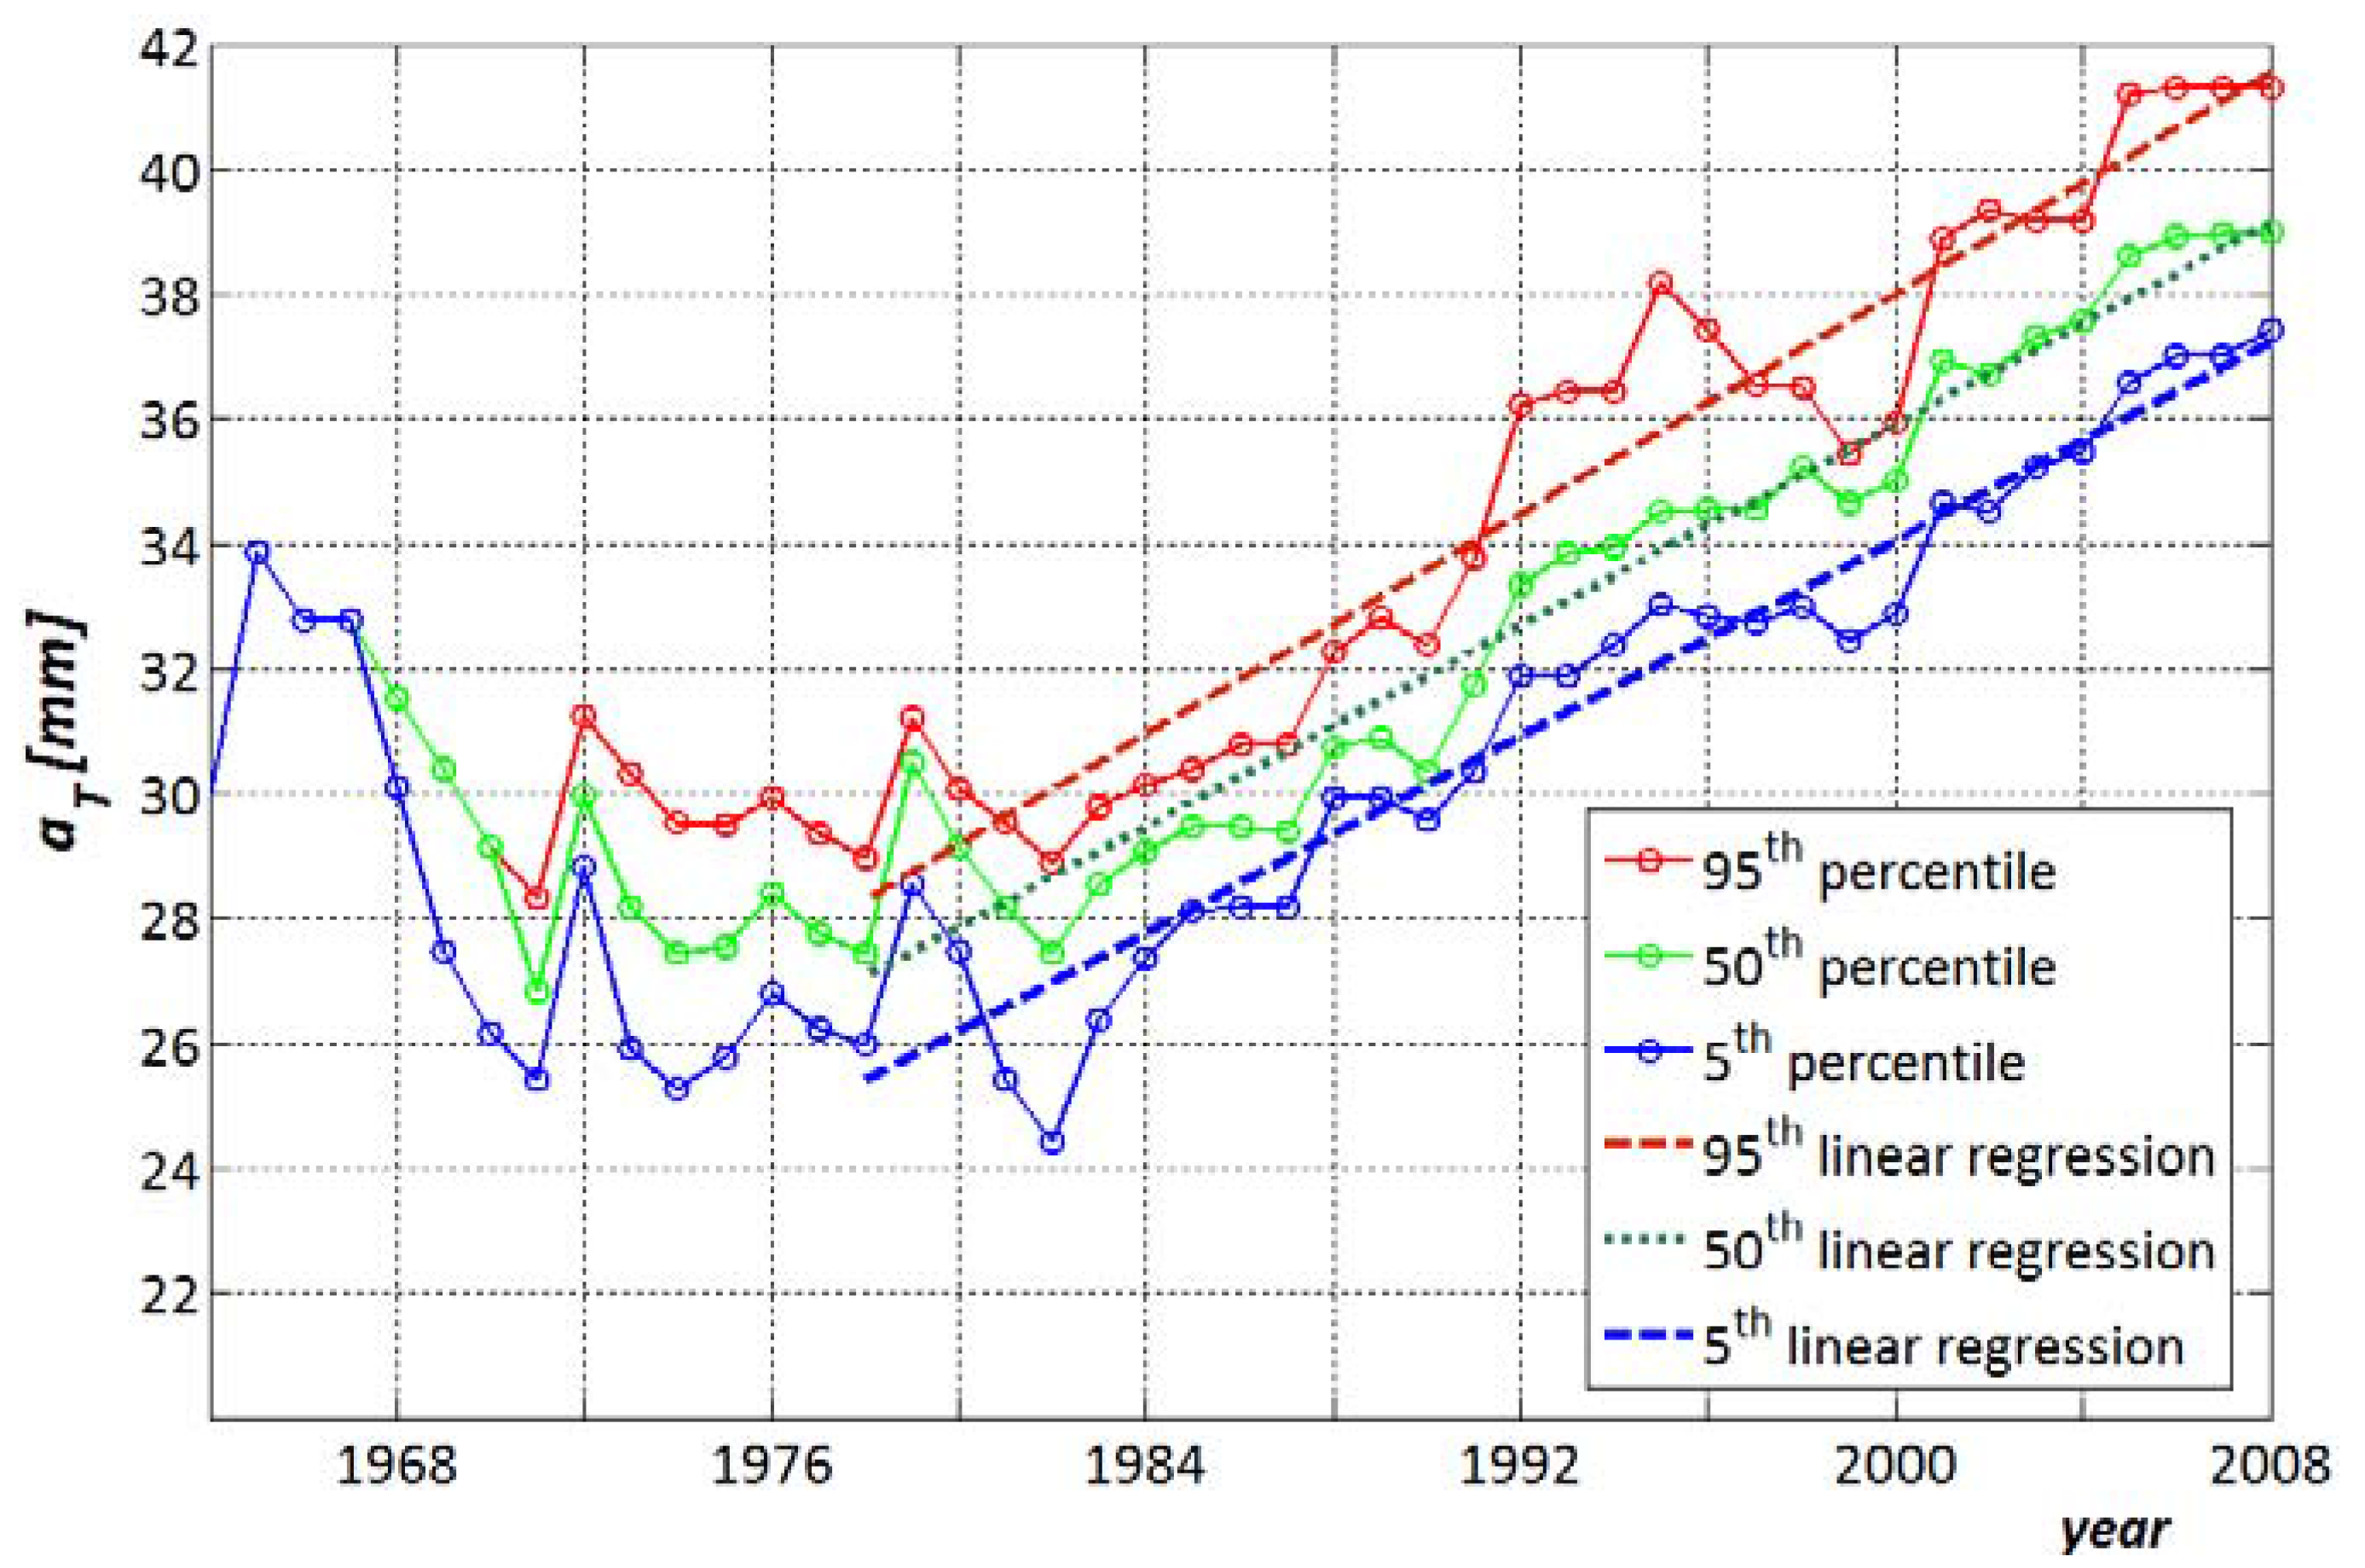
Then, according to Equation (6), the likelihood function value Li was assessed for each ith element of each aT series, and the related 95th, 50th, and 5th percentiles were obtained from the cumulative distribution function of Li. Three aT values were obtained as the 95th, 50th and 5th percentiles of the aT series for each year, from 1964 to 2008. Figure 5 shows the 95th, 50th and 5th percentiles of the aT parameter and the related linear regressions (obtained considering the last 30 years).
Figure 5. The 95th, 50th and 5th percentiles of the aT parameter and linear regressions (obtained considering the last 30 years).
Water 07 06667 g005
The linear regression equations (Table 2) provide a mathematical law of the variability of aT in time. The coefficient of determination (R2) and the standard error of regression (SER) values show strong agreement between the regression laws and percentile values. All the percentile series are clearly affected by a positive trend, similar to that observed for the annual maximum rainfall for d = 1 h. In regards to the 50th percentile, the aT value showed a 44.5% increase, increasing from 27.1 mm (1964) to 39.1 mm (2008).
Table 2. Linear regression equations, and coefficient of determination (R2) and standard error of regression (SER) values for the 95th, 50th and 5th of aT percentiles.
PercentileEquationR2SER
95thaT = 0.441·t − 844.40.920.961
50thaT = 0.402·t − 768.40.950.899
5thaT = 0.393·t − 752.90.931.193
Note: t is the time expressed in years.
It can be observed that the aT value related to 2008 is higher (13.4%) than the corresponding value obtained using the whole historical dataset for the definition of the DDF curve (aT = 34.4 mm). This result highlights the need to verify the hydraulic performance of the urban drainage system under future climate scenarios.
As mentioned above, the 95th and 5th percentiles linear regressions identify the upper and lower limits of the uncertainty band linked to the aT assessment, respectively. The width of the uncertainty bands provides information about the reliability of the future projection. The results show that the 50th and 5th percentile linear regressions tend to get closer in time, whereas the 95th percentile linear regression tends to diverge from that of the 50th percentile, probably due to the presence of some outliers of the annual maximum series in recent years. This result indicates that the width of the upper uncertainty band will increase for future aT projections. However, due to the gradual overlapping of the 50th and 5th lines, the width of the lower uncertainty band will decrease.

3.3. DDF-Curves of Climate Change Scenarios

According to the Bayesian procedure output, the area surrounding Paceco experienced an increase in annual maximum rainfall over the last 30 years of the study period, which resulted in an aT parameter increase of 44.5%. Therefore, the DDF parameters need to be updated for future climate scenarios.
The aT parameters of the DDF curves were estimated for the Trapani rain gauge for two climate change scenarios, 2025 and 2050. Following the temporal analogues approach, climate scenarios were generated by supposing that the changes in precipitation detected by the trend analysis will proceed in the future with the same pattern, assuming a linear trend.
To evaluate the aT parameter values for the 2025 and 2050 projections, the linear regression equations previously described (Table 2) have been used. Table 3 reported the aT values for each scenario. It has to be underlined that this procedure can be used to define short-term projections. Indeed, whenever the percentile linear regressions tend to converge, at a certain time, they will intersect. For this reason, the linear regressions require updating by including the recent data. Using the available dataset, the procedure applied here is able to provide projections up to 2050, but projections more distant in time are less reliable.
Table 3. aT values for 2008 and future climate scenarios obtained by the Bayesian procedure.
PercentileaT
2008 *Scenario 2025Scenario 2050
95th41.5448.6059.62
50th39.1345.6455.69
5th37.2243.5453.38
Note: * 2008 is the last year of the historical series.
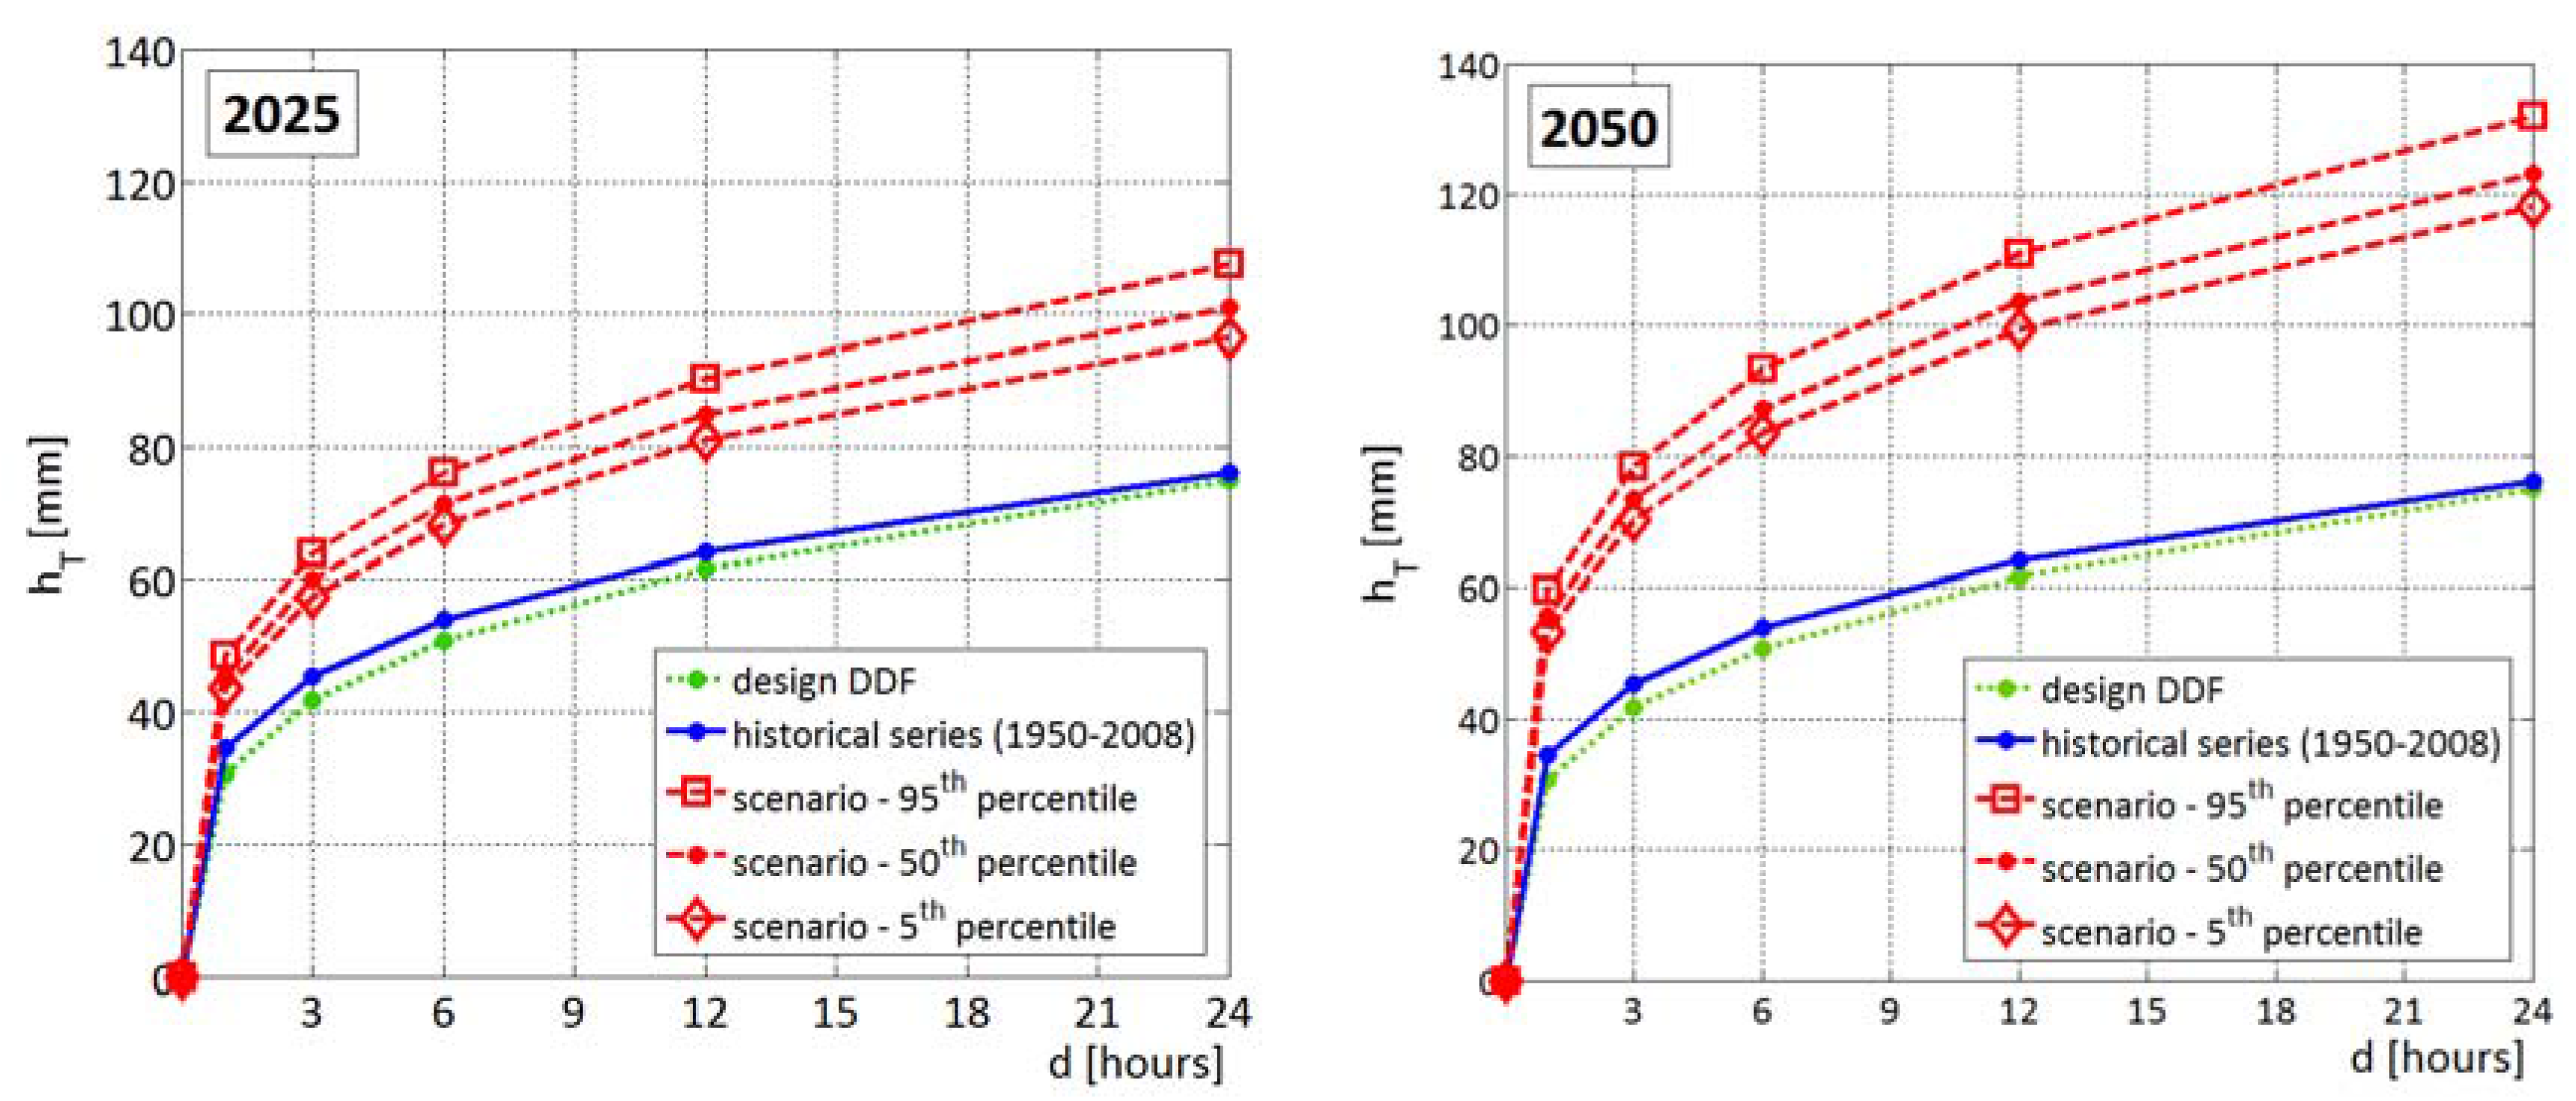
Using the aT values of Table 3 for each scenario (2025 and 2050), three different DDF curves have been defined, one per percentile (95th, 50th and 5th). In every scenario, nT has been set equal to 0.25 (the value obtained from the statistical analysis of the whole historical dataset up to 2008). Figure 6 shows the DDF curve used for the design conditions of the Paceco drainage system, the DDF curve evaluated starting from the series recorded over the 1950–2008 period, and the DDF curves for the 2025 and 2050 scenarios.
Figure 6. DDF curves for the design conditions for the historical series (1950–2008) and for the 2025 and 2050 scenarios.
Water 07 06667 g006
It can be observed that the design DDF (green dot line) and the DDF obtained from processing the whole historical dataset (blue solid line) almost coincide, even if the design rainfall depths appear slightly overestimated. This fact is probably due to the length of the historical series used for design, which includes data up to 1991. In regards to the 2025 scenario, the DDF curves (red lines) obtained for the 95th, 50th and 5th percentiles of aT indicate a rainfall depth increase of 41%, 33% and 27%, respectively, if compared with the DDF curve obtained for the 1950–2008 series (blue solid line). In the 2050 scenario, the increases in rainfall depths are 55%, 62% and 73%, respectively, for the curves obtained from the 95th, 50th and 5th percentiles of aT. For both future scenarios, for a given rainfall duration d, the error with respect to the 50th percentile related to the evaluation of h(d)T (ratio of the distance between the 95th and 5th percentiles divided the 50th percentile value) is equal to ~11%.
For the DDF curves of the climate change scenarios, the effect of the nT parameter variations in time was neglected because the analysis was focused on the intensification of rainfall events for d = 1 h, which is usually adopted for the purpose of design and verification of urban drainage systems, due to the low concentration time of urban watersheds. To obtain more reliable predictions for rainfall events of durations greater than 1 h, further developments of this study should involve the evaluation of nT variations due to climate change.

3.4. Analysis of Trend Implications on Urban Drainage System Design
In the last step of the analysis, the implications of the rainfall trend magnitude of the criteria adopted for the urban drainage system design were investigated to provide an evaluation of the drainage system performance under the assumption of climate change. Moreover, the effect of the uncertainty linked to future climate change scenarios were examined. To this aim, the real drainage system of the “City Center” watershed of Paceco was adopted as a case study.
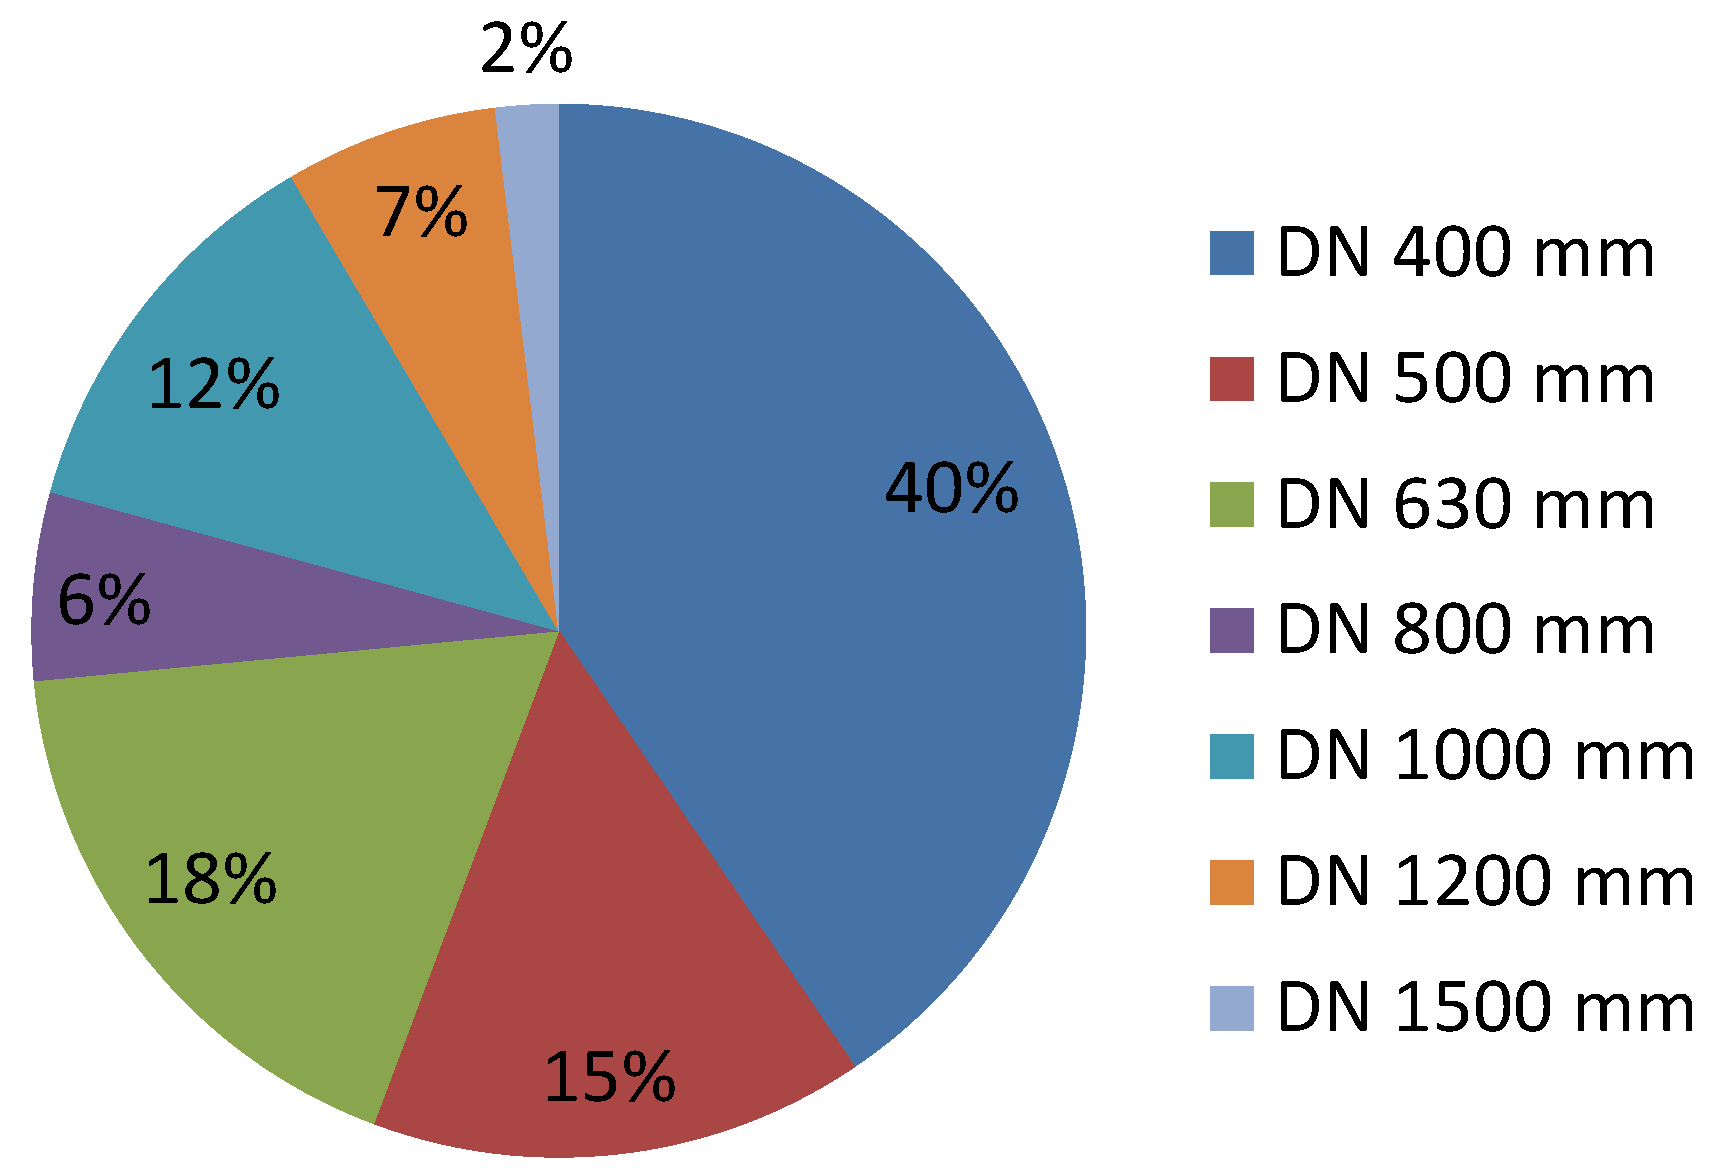
The analyzed watershed is highly urbanized (Figure 3c), with an area equal to 18 ha, consisting of approximately 75% impervious areas (mainly buildings, roads and squares) and a few pervious areas. The entire catchment is drained by a new combined sewer system (designed in 2004), which has a total pipe length of approximately 10 km. The analyzed network also receives storm drainage from upstream watersheds, having a total area equal to approximately 30 ha. The concentration time of the whole urban watershed is less than 1 h. The network is made with Polyethylene high density (PEHD) pipes, with DN (nominal diameter) ranging between 400 and 1500 mm. Figure 7 shows the network pipe volume percentage related to each adopted DN. The network was designed considering a return period equal to five years and a DDF curve with aT = 30.75 mm and nT = 0.28, respectively. Those parameter values were obtained by means of univariate statistical analysis of the annual maxima series recorded at the Trapani rain gauge during 1953–1991. The design maximum capacity for pipes was set equal to 60%.
Figure 7. Network pipe volume percentage related to each adopted DN.
Water 07 06667 g007
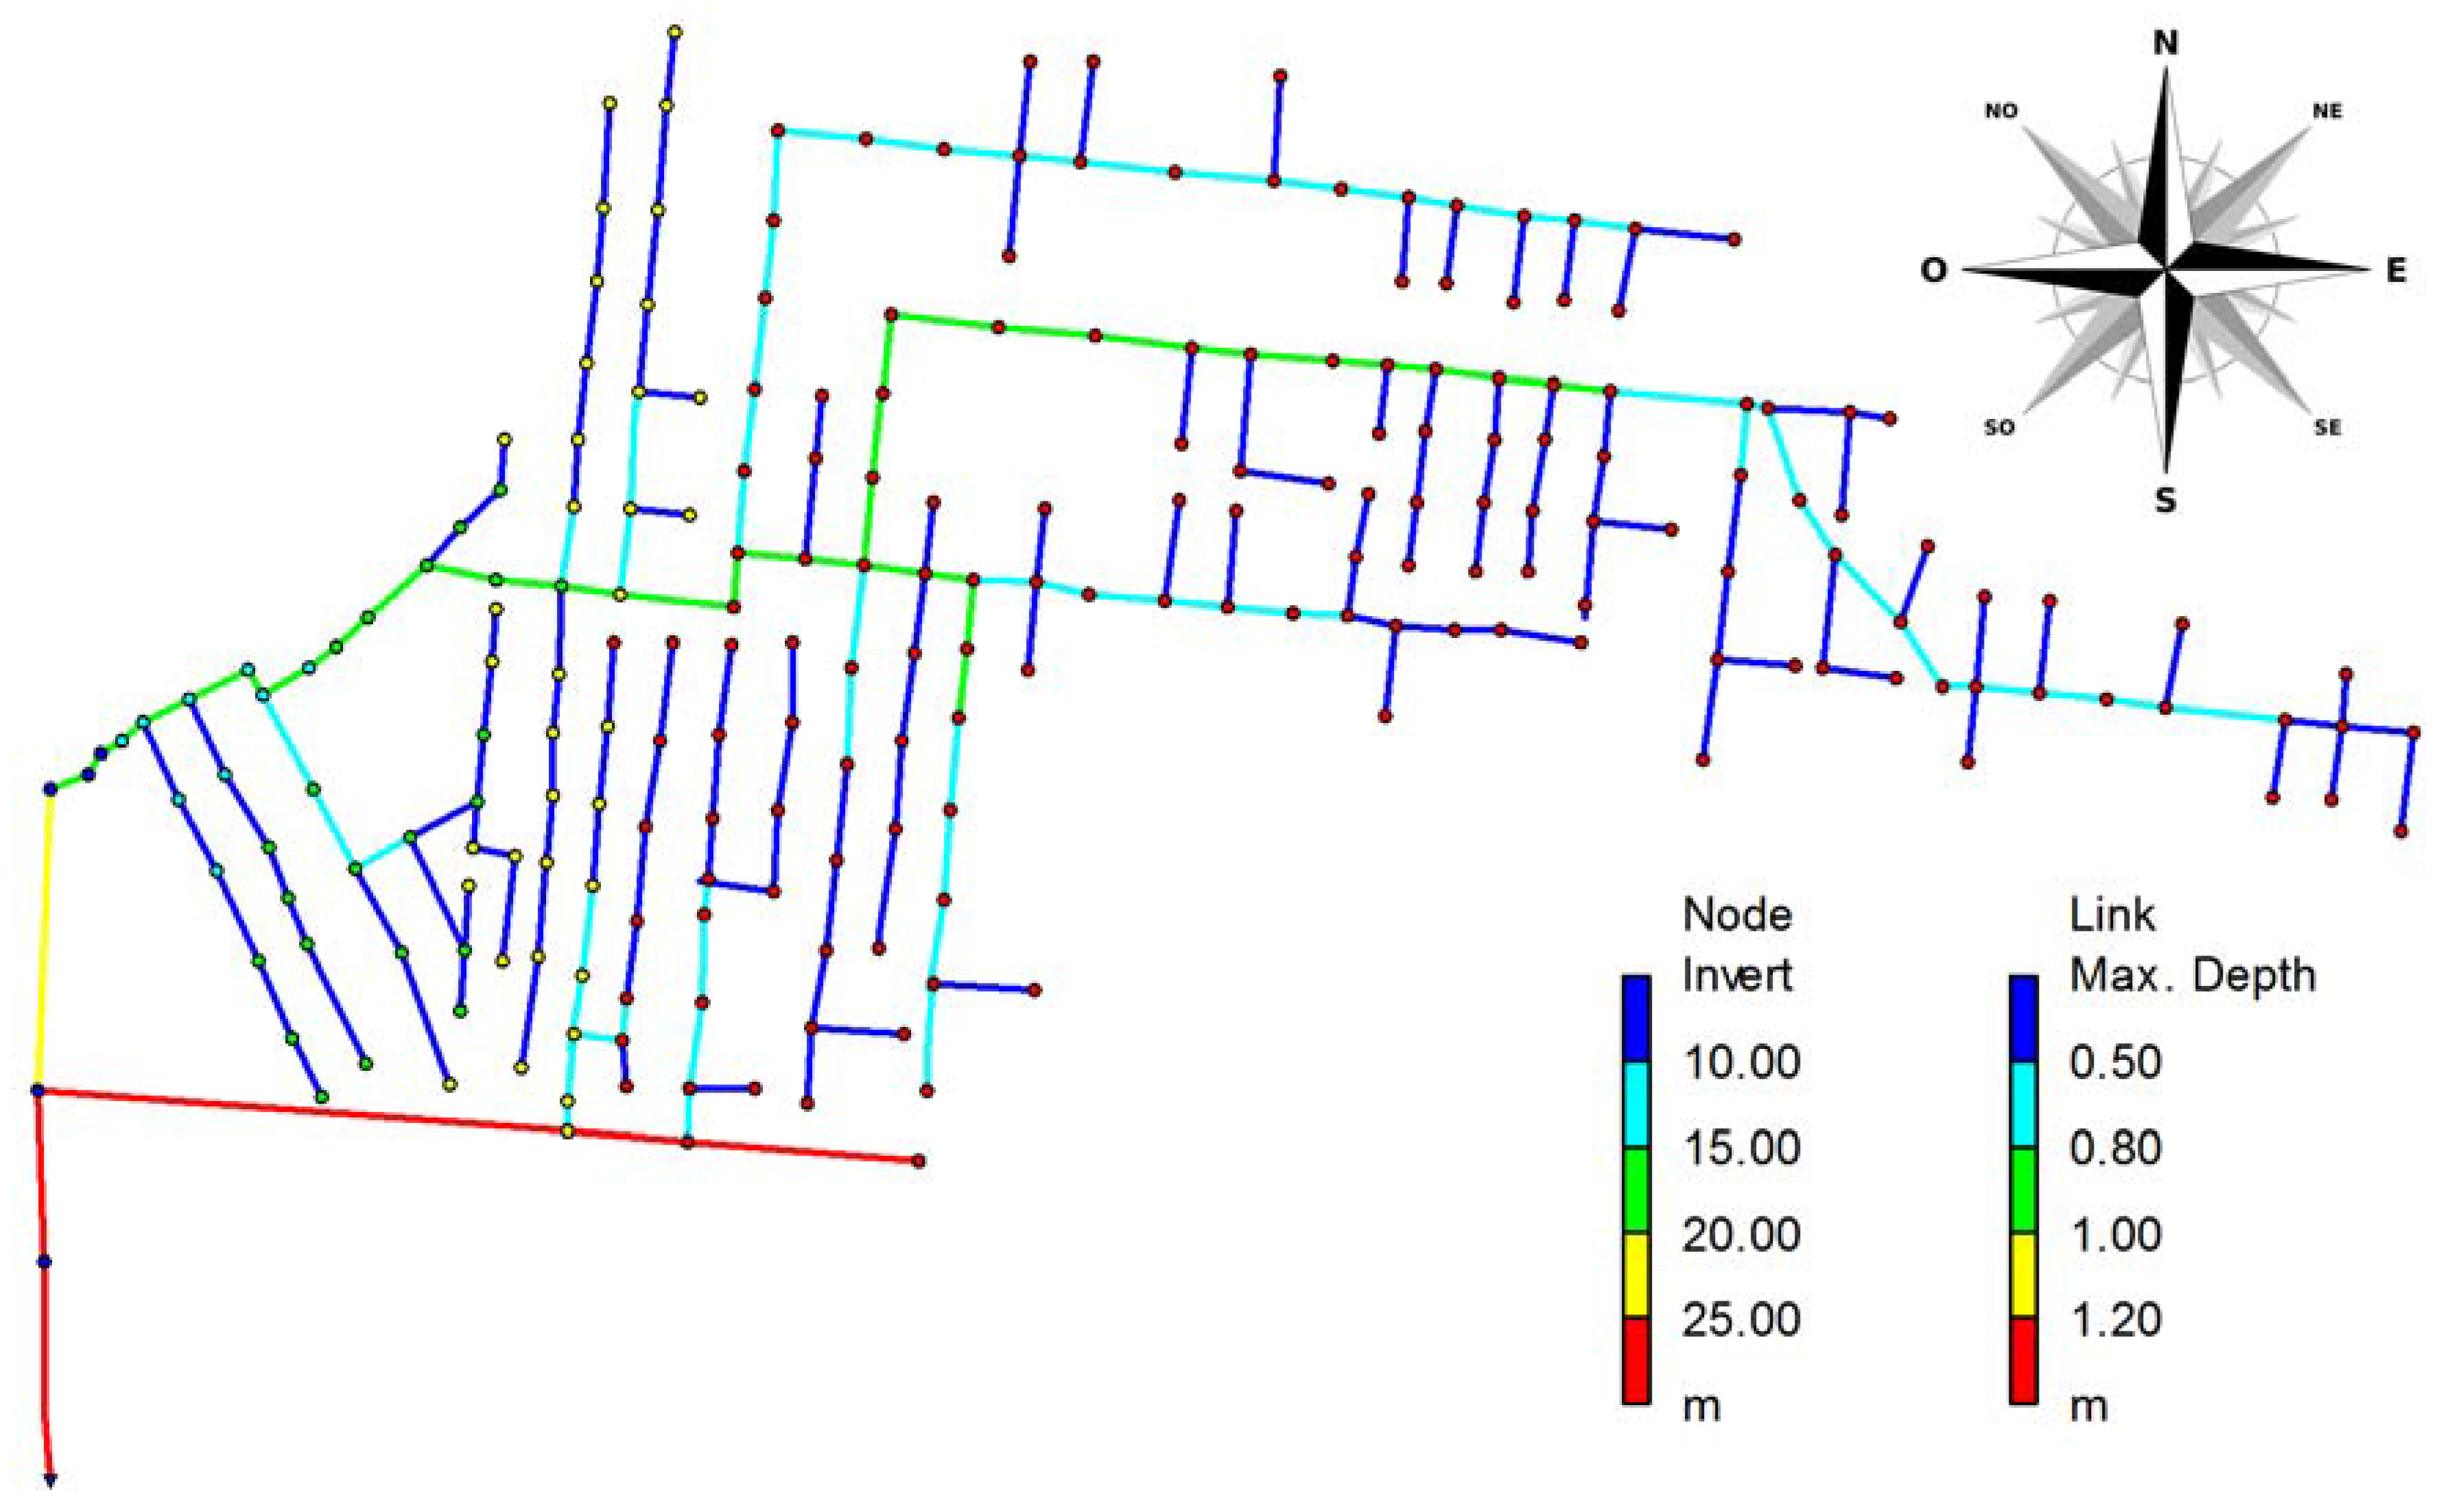
To simulate the hydraulic behavior of the analyzed system, both for the design and the climate change scenario, the Storm Water Management Model SWMM 5.1 model [45] was used. Figure 8 shows the network schematic employed in the SWMM model to simulate the hydraulic behavior of the drainage system.
Figure 8. Network schematic employed by means of the Storm Water Management Model SWMM 5.1 model.
Water 07 06667 g008
Eight simulations were conducted, adopting a Chicago hyetograph with a duration of 120 min as the rainfall input, with a time-to-peak of 50 min. Rainfall values were sampled from different five-year return period DDF curves, which were built with different parameter values (aT and nT):
  • aT = 30.75 mm and nT = 0.28 (design conditions);
  • aT = 34.40 mm and nT = 0.25 (historical dataset up to 2008);
  • 95th, 50th and 5th percentiles of aT for 2025 scenario (Table 3) and nT = 0.25; and
  • 95th, 50th and 5th percentiles of aT for 2050 scenario (Table 3) and nT = 0.25.
The hydraulic performance of the drainage system for the different considered rainfall inputs was compared in terms of the network pipe volume percentage related to several maximum pipe capacity ranges (Table 4).
Table 4. Network pipe volume percentage related to several maximum pipe capacity ranges.
Max Pipe CapacityNetwork Pipe Volume
Design Conditions2008 *20252050
5th perc**50th perc95th perc5th perc50th perc95th perc
0%–20%25.64%24.55%5.33%5.33%5.25%5.12%5.12%5.05%
20%–40%24.87%25.53%27.63%24.21%21.40%6.88%5.50%4.38%
40%–60%38.99%38.70%11.28%12.47%10.80%18.11%17.85%16.33%
60%–80%10.50%10.15%20.63%17.16%10.62%5.14%4.15%3.66%
80%–100%0.00%1.06%35.13%40.82%51.93%64.76%67.38%70.58%
Note: * 2008 is the last year of the historical series; ** perc is the abbreviation of percentile.
As shown in Table 4, for the design conditions, the maximum pipe capacity reached 89% of the network pipe volume, which is lower than the design threshold (60%). Only 10.50% of the network pipe volume shows a maximum pipe capacity higher than 60%, but no pipes are surcharged. Approximately 25% of the network pipe volume is overdesigned, reaching a maximum capacity lower than 20%.
Simulation results related to the DDF curve obtained by the historical dataset up to 2008 are comparable to those of the design conditions, except for a 1.06% change in the network pipe volume, which is surcharged. Those results are justified by the slightly overestimation of h(d)T obtained by adopting the DDF curve related to the whole historical dataset instead of the design DDF curve (in Figure 6, the blue solid line and green dot line, respectively).
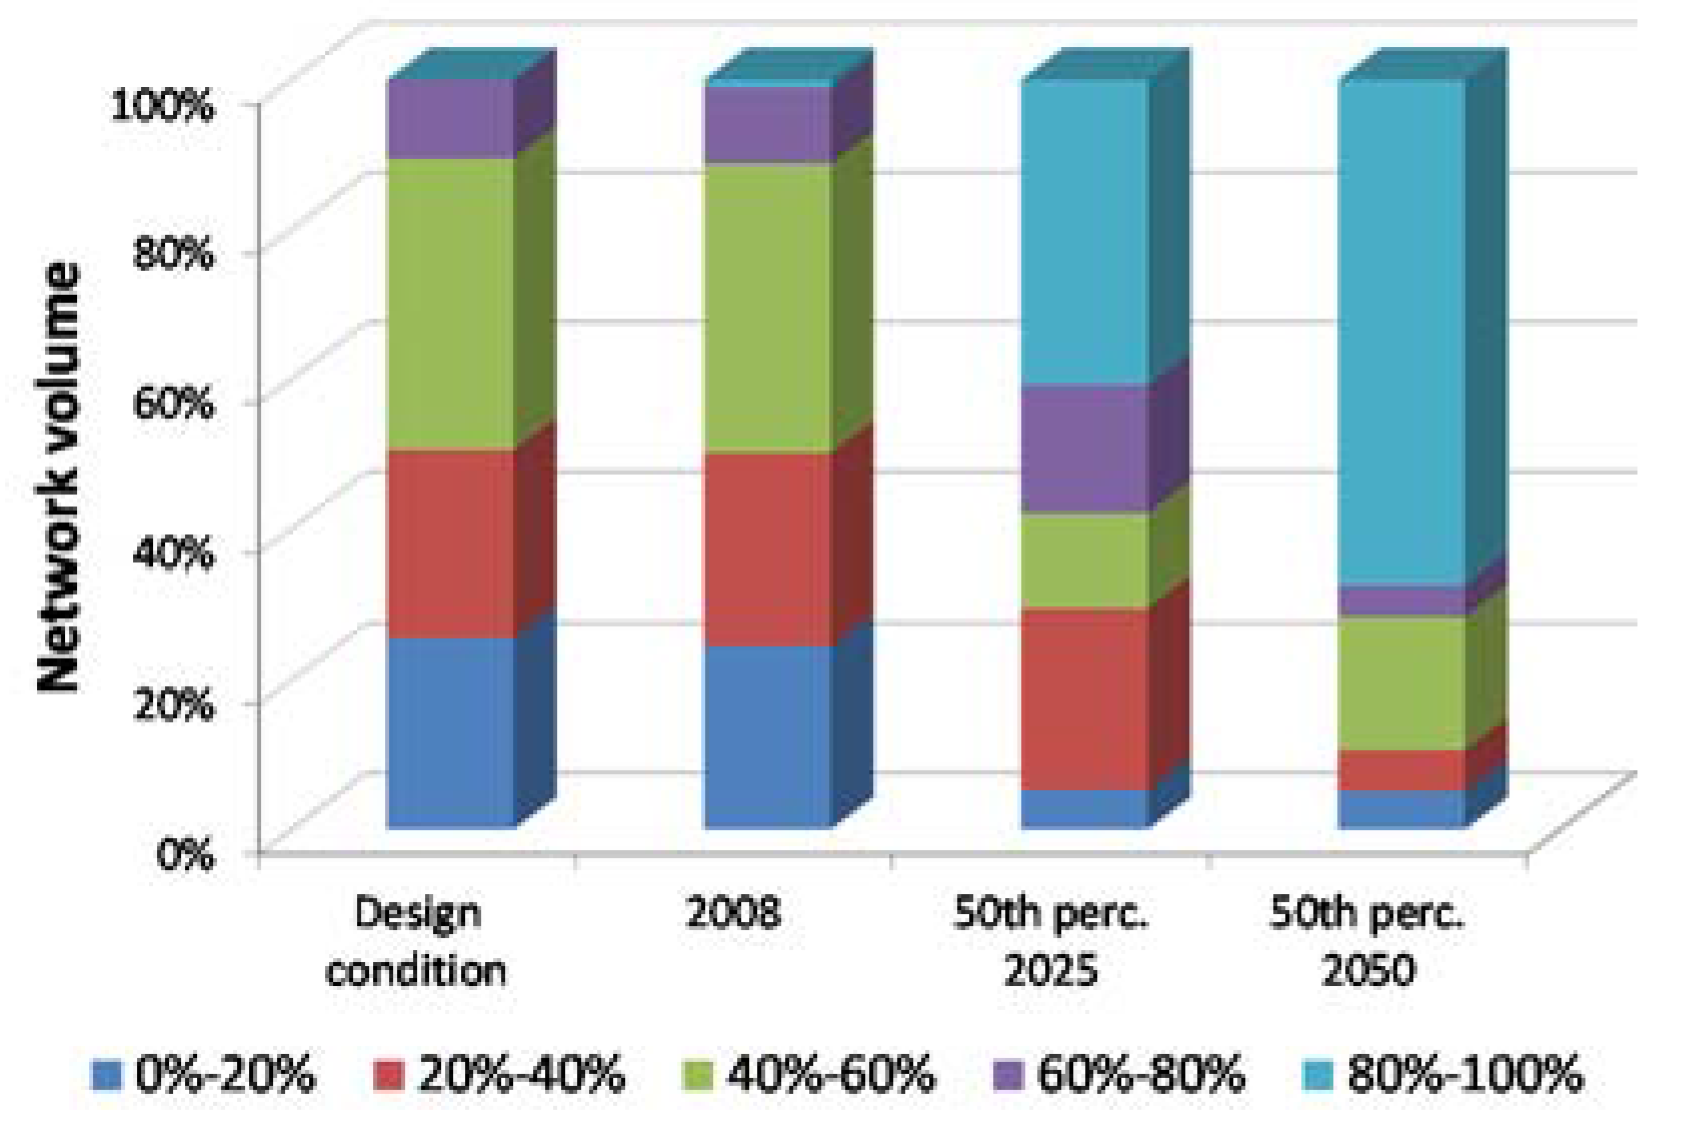
With regard to the 50th percentile of the 2025 scenario, it can be observed that the potential future increase of rainfall produces a hydraulic surcharge of 40.82% of the network pipe volume. The system performance worsens when the 2050 scenario is simulated (the surcharged network pipe volume is equal to 67.38% for the 50th percentile). This behavior is illustrated in Figure 9, where a comparison in terms of the network volume percentage related to maximum pipe capacity ranges are shown for all the simulated conditions.
In the simulated future scenarios (2025 and 2050), the higher runoff volumes drained by the system due to the increased rainfall results in a reduction of the percentage of oversized pipes. In fact, the network pipe volume percentage with maximum capacity ranging from 0 to 20% is approximately 5%.
Figure 9. Scenario comparison in terms of network volume percentage related to maximum pipe capacity ranges.
Water 07 06667 g009
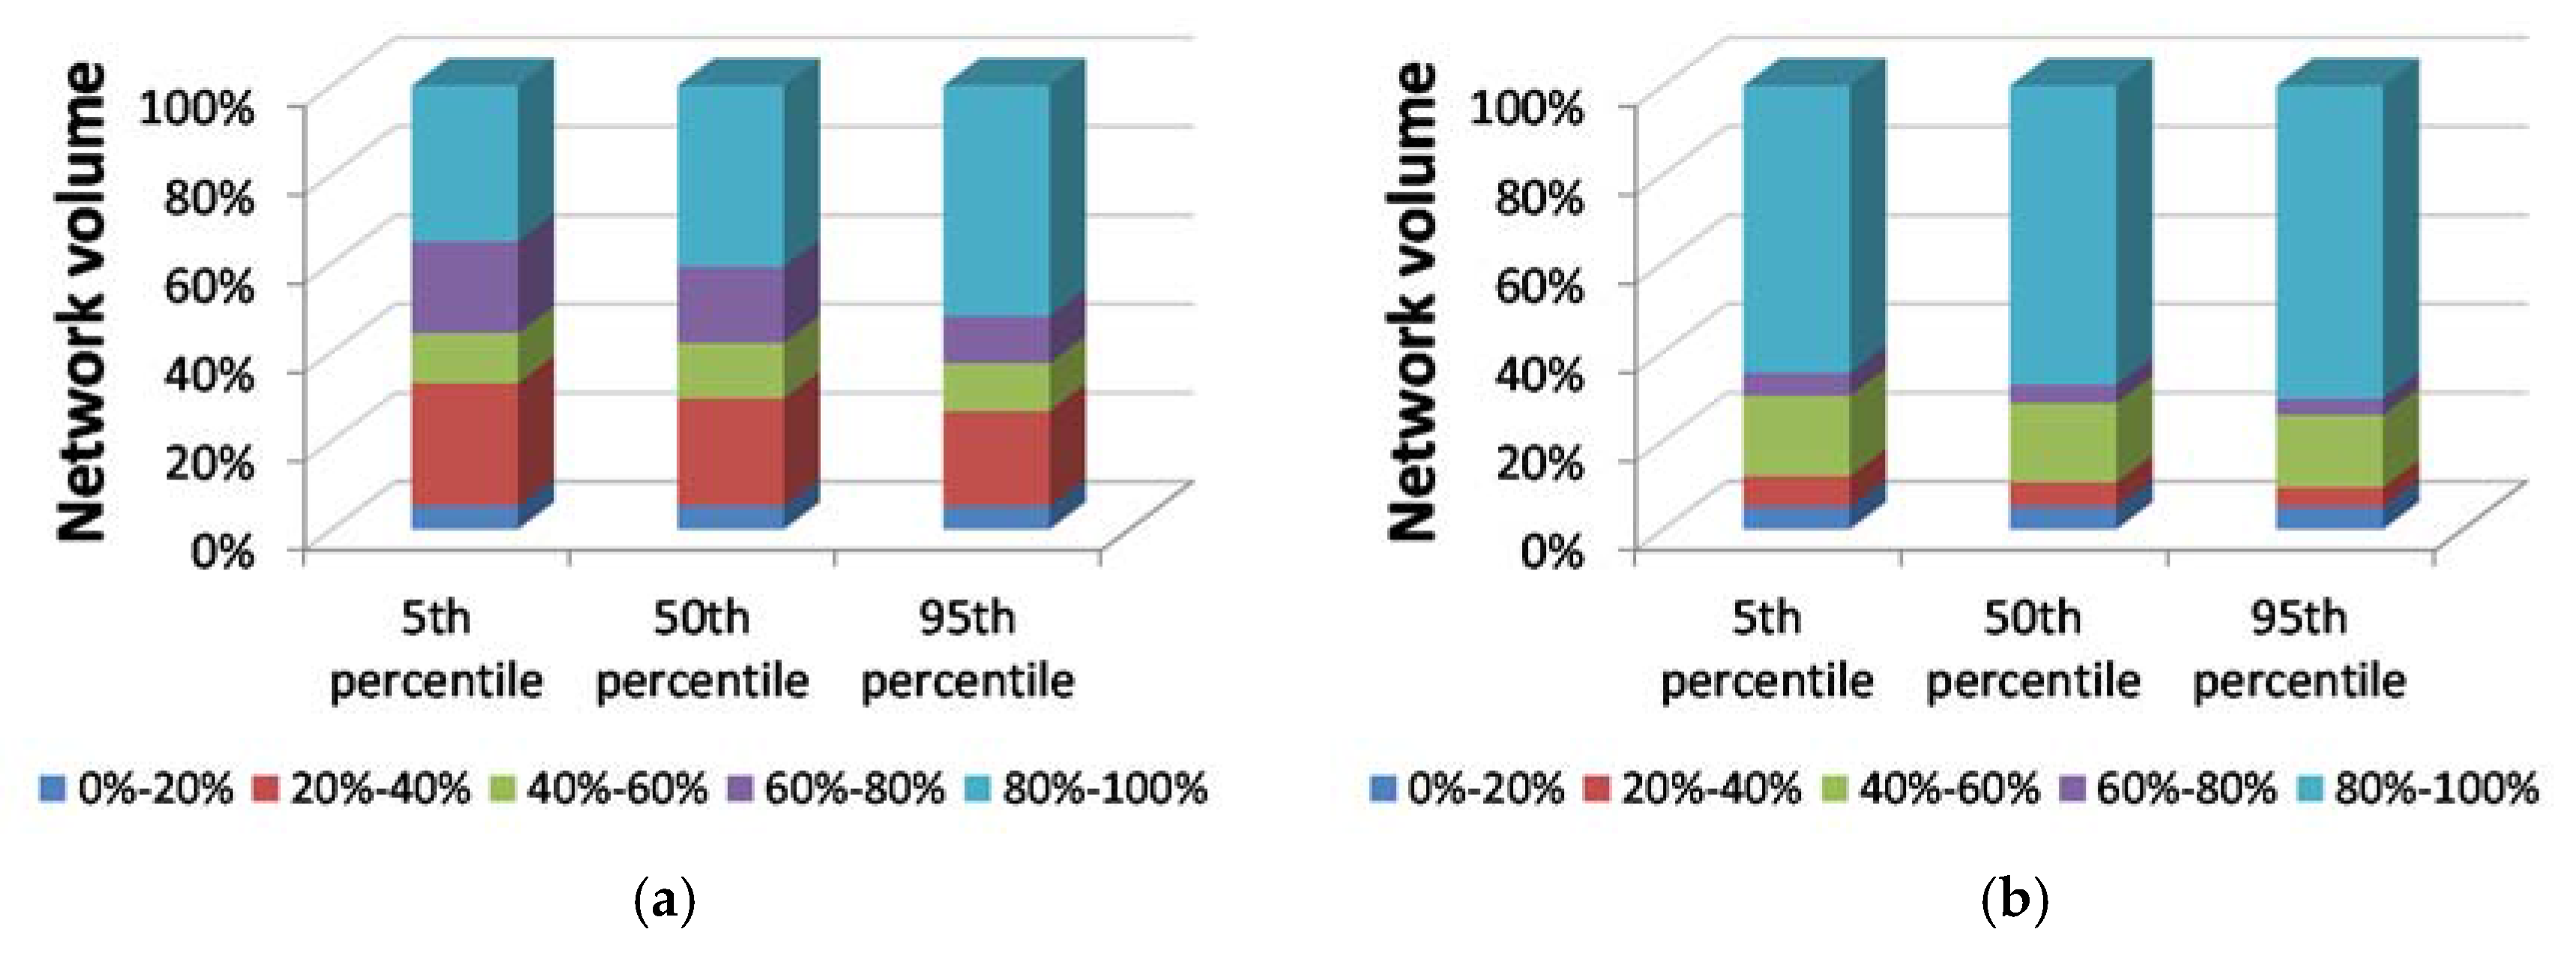
Finally, Figure 10 shows the comparison of the results from the simulations performed for the 95th, 50th and 5th percentiles of aT for the 2025 and 2050 scenarios, providing information about the effect of the uncertainty linked to the evaluation of the aT on the system hydraulic performance. In regards to the 2025 scenario, the effect of uncertainty in the estimation of the aT parameter is moderate: for the 5th percentiles, results of the simulations (Figure 10a) show that 35.13% of the network pipe volume is surcharged (Table 4), and this percentage increases for simulations conducted for the 50th and 95th percentile conditions (40.82% and 51.93%, respectively). For the 2050 scenario (Figure 10b), the network volume percentage for the different maximum pipe capacity ranges are quite similar for all simulated conditions: most of the pipes are already surcharged (64.76% - 70.58% for the simulation performed using the 5th and 95th percentiles of aT, respectively. Therefore for the 2050 scenario, the uncertainty related to the aT evaluation does not transfer to the hydraulic behavior of the system.
Figure 10. Network volume percentage related to the maximum pipe capacity ranges: (a) 2025 climate scenario and (b) 2050 climate scenario.
Water 07 06667 g010

4. Conclusions

The effects of variations in extreme rainfall characteristics due to climate change are expected to alter the magnitude and frequency of peak flows over the service life of urban drainage systems. Some Water Authorities in the world have proposed operative statements to consider climate change in the design and maintenance of drainage systems [46]. In this context, the methodologies typically used in the design of drainage infrastructures require revision and updating.
This study provides a procedure to estimate the aT parameter of the DDF curves of future climate scenarios and the uncertainty related to its estimation. The proposed procedure was applied to estimate the DDF curves for a case study in the northwestern part of Sicily, in the town of Paceco. First, a preliminary trend analysis performed to determine whether the study area was affected by an increase or decrease in annual maxima rainfall. This analysis highlighted the presence of a statistically significant trend in extreme rainfall with a duration of one hour. Subsequently, a Bayesian procedure was performed to account for the above-mentioned trend of the DDF curve assessment in future climate scenarios. These curves were used as input to investigate the implications of climate change on the hydraulic behavior of the Paceco drainage system.
According to the proposed procedure, the area surrounding Paceco experienced an increase in annual maximum rainfall over the last 30 years of the 1950–2008 period, which produced an aT parameter increase of 44.5%. Due to this variation, the DDF parameters have been updated to define climate scenarios at 2025 and 2050. In the 2025 scenario, the DDF curves obtained for the 95th, 50th and 5th percentiles of aT indicate a rainfall depth increase of 41%, 33% and 27%, respectively, if compared with the DDF curve obtained for the historical series (1950–2008). In the 2050 scenario, these increases are 55%, 62% and 73%, The implications of these trends on the performance of the drainage system of Paceco (recently designed and built) have been investigated, comparing the network pipe volume percentage related to several maximum pipe capacity ranges in each scenario. With regard to the 50th percentile of the 2025 scenario, the potential future increase of rainfall would produce a hydraulic surcharge of 40.82% of the network pipe volume. This percentage is equal to 67.38% in the 2050 scenario. In summary, for future projections at 2025 and 2050, the analyzed drainage system will likely face an increased frequency of drainage system surcharge episodes, due to the positive trend of extreme rainfall intensities in the study area.
The comparison of the performance of the analyzed network under the design conditions and future climate scenarios highlighted that the effects of climate change on rainfall variability cannot be neglected in the design procedures based on extreme rainfall estimation. Specifically, for the tested network, the surcharge probability is expected to increase in the future due to the climate change; consequently, current design standards should be increased in order to allow the network to maintain the surcharge return period target till the end of its expected life. The presented considerations should take the increase of funds allocation for the design and construction of the drainage network in the analyzed case study because generally climate change will require bigger pipes in this area in the near future. Opposite considerations may be drawn in areas where a negative trend was obtained and larger efforts should be concentrated on monitoring in areas where a clear trend cannot be detected.

Acknowledgments

The authors wish to thank the anonymous reviewers from Water for their insightful comments.

Conflicts of Interest

The authors declare no conflict of interest.

References

  1. Trenberth, K.E.; Dai, A.; Rasmussen, R.M.; Parsons, D.B. The changing character of precipitation. Bull. Am. Meteorol. Soc. 2003, 84, 1205–1217. [Google Scholar] [CrossRef]
  2. Alexander, L.V.; Zhang, X.; Peterson, T.C.; Caesar, J.; Gleason, B.; Klein Tank, A.M.G.; Haylock, M.; Collins, D.; Trewin, R.; Rahimzadeh, F.; et al. Global observed changes in daily climate extremes of temperature and precipitation. J. Geophys. Res. 2006, 111. [Google Scholar] [CrossRef]
  3. Middelkoop, H.; Daamen, K.; Gellens, D.; Grabs, W.; Kwadijk, J.C.; Lang, H.; Parmet, B.W.; Schädler, B.; Schulla, J.; Wilke, K. Impact of climate change on hydrological regimes and water resources management in the Rhine basin. Clim. Chang. 2001, 49, 105–128. [Google Scholar] [CrossRef]
  4. Intergovernmental Panel on Climate Change (IPCC). Summary for Policymakers. Climate Change 2013: The Physical Science Basis. Contribution of Working Group I to the Fifth Assessment Rep. of the Intergovernmental Panel on Climate Change; Stocker, TF., Qin, D., Plattner, G.K., Tignor, M., Allen, S.K., Boschung, J., Nauels, A., Xia, Y., Bex, V., Midgley, P.M., Eds.; Cambridge University Press: Cambridge, UK, 2013. [Google Scholar]
  5. Freni, G.; la Loggia, G.; Notaro, V. Uncertainty in urban flood damage assessment due to urban drainage modelling and depth—Damage curve estimation. Water Sci. Technol. 2010, 61, 2979–2993. [Google Scholar] [CrossRef] [PubMed]
  6. Fu, G.; Kapelan, Z. Flood analysis of urban drainage systems: Probabilistic dependence structure of rainfall characteristics and fuzzy model parameters. J. Hydroinform. 2013, 15, 687–699. [Google Scholar] [CrossRef]
  7. Ahn, J.; Cho, W.; Kim, T.; Shin, H.; Heo, J.H. Flood frequency analysis for the annual peak flows simulated by an event-based rainfall-runoff model in an urban drainage basin. Water 2014, 6, 3841–3863. [Google Scholar] [CrossRef]
  8. Notaro, V.; Fontanazza, C.M.; la Loggia, G.; Freni, G. Identification of the best flood retrofitting scenario in an urban watershed by means of a Bayesian Decision Network. In Urban Water II; Mambretti, S., Brebbia, C.A., Eds.; WIT Press: Ashurst, New Forest, UK, 2014; pp. 341–352. [Google Scholar]
  9. Butler, D.; McEntee, B.; Onof, C.; Hagger, A. Sewer storage tank performance under climate change. Water Sci. Technol. 2007, 56, 29–35. [Google Scholar] [CrossRef] [PubMed]
  10. Kleidorfer, M.; Möderl, M.; Sitzenfrei, R.; Urich, C.; Rauch, W. A case independent approach on the impact of climate change effects on combined sewer system performance. Water Sci. Technol. 2009, 60, 1555–1564. [Google Scholar] [CrossRef] [PubMed]
  11. Papa, F.; Guo, Y.; Thoman, G.W. Urban drainage infrastructure planning and management with a changing climate. In Proceedings of the 57th Canadian Water Resources Association Annual Congress—Water and Climate Change: Knowledge for Better Adaptation, Montréal, QC, Canada, 16–18 June 2004; p. 6.
  12. Grum, M.; Jørgensen, A.T.; Johansen, R.M.; Linde, J.J. The effect of climate change on urban drainage: An evaluation based on regional climate model simulations. Water Sci. Technol. 2006, 54, 9–15. [Google Scholar] [PubMed]
  13. Fontanazza, C.M.; Freni, G.; la Loggia, G.; Notaro, V. Uncertainty evaluation of design rainfall for urban flood risk analysis. Water Sci. Technol. 2011, 63, 2641–2650. [Google Scholar] [CrossRef] [PubMed]
  14. Fontanazza, C.M.; Freni, G.; Notaro, V. Bayesian inference analysis of the uncertainty linked to the evaluation of potential flood damage in urban areas. Water Sci. Technol. 2012, 66, 1669–1677. [Google Scholar] [PubMed]
  15. Notaro, V.; Fontanazza, C.M.; Freni, G.; Puleo, V. Impact of rainfall resolution in time and space on the urban flooding evaluation. Water Sci. Technol. 2013, 68, 1984–1993. [Google Scholar] [CrossRef] [PubMed]
  16. Wang, Y.; McBean, E.A. Uncertainty characterization of rainfall inputs used in the design of storm sewer infrastructure. J. Urban Rural Water Syst. Model. 2013, 22. [Google Scholar] [CrossRef]
  17. Arnbjerg-Nielsen, K. Significant climate change of extreme rainfall in Denmark. Water Sci. Technol. 2006, 54, 1–8. [Google Scholar] [CrossRef] [PubMed]
  18. Burlando, P.; Rosso, R. Extreme storm rainfall and climatic change. Atmos. Res. 1991, 27, 169–189. [Google Scholar] [CrossRef]
  19. Mailhot, A.; Duchesne, S. Design Criteria of Urban Drainage Infrastructures under Climate Change. J. Water Resour. Plan. Manag. 2009, 136, 201–208. [Google Scholar] [CrossRef]
  20. Larsen, A.N.; Gregersen, I.B.; Christensen, O.B.; Linde, J.J.; Mikkelsen, P.S. Potential future increase in extreme one-hour precipitation events over Europe due to climate change. Water Sci. Technol. 2009, 60, 2205–2216. [Google Scholar] [CrossRef] [PubMed]
  21. Nguyen, V.; Nguyen, T.; Cung, A.A. Statistical Approach to Downscaling of Sub-daily Extreme Rainfall Processes for Climate-Related Impacts Studies in Urban Areas. Water Sci. Technol. Water Suppl. 2007, 7, 183–192. [Google Scholar] [CrossRef]
  22. Olsson, J.; Berggren, K.; Olofsson, M.; Viklander, M. Applying climate model precipitation scenarios for urban hydrological assessment: A case study in Kalmar City, Sweden. Atmos. Res. 2009, 92, 364–375. [Google Scholar] [CrossRef]
  23. Willems, P.; Vrac, M. Statistical precipitation downscaling for small-scale hydrological impact investigations of climate change. J. Hydrol. 2011, 402, 193–205. [Google Scholar] [CrossRef]
  24. Mirhosseini, G.; Srivastava, P.; Stefanova, L. The impact of climate change on rainfall Intensity-Duration-Frequency (IDF) curves in Alabama. Reg. Environ. Chang. 2013, 13, 25–33. [Google Scholar] [CrossRef]
  25. Palutikof, J.P. Some possible impacts of greenhouse gas induced climatic change on water resources in England and Wales. In The Influence of Climate Change and Climate Variability on the Hydrologic Regime and Water Resources; IAHS: Vancouver, Canada, 1987; pp. 585–596. [Google Scholar]
  26. Krasovskaia, I.; Gottschalk, L. Stability of river flow regimes. Nord. Hydrol. 1992, 23, 137–154. [Google Scholar]
  27. Liuzzo, L.; Freni, G. Analysis of Extreme Rainfall Trends in Sicily for the Evaluation of Depth-Duration-Frequency Curves in Climate Change Scenarios. J. Hydrol. Eng. 2015, 20. [Google Scholar] [CrossRef]
  28. Mann, H.B. Nonparametric tests against trend. Econ. J. Econ. Soc. 1945, 13, 245–259. [Google Scholar] [CrossRef]
  29. Kendall, M.G. Rank Correlation Methods, 3rd ed.; Hafner Publishing Company: New York, NY, USA, 1962. [Google Scholar]
  30. Helsel, D.R.; Hirsch, R.M. Statistical Methods in Water Resources; Elsevier: Reston, VA, USA, 1992; Volume 49. [Google Scholar]
  31. Hirsch, R.M.; Slack, J.R.; Smith, R.A. Techniques of trend analysis for monthly water quality data. Water Resour. Res. 1982, 18, 107–121. [Google Scholar] [CrossRef]
  32. Burlando, P.; Rosso, R. Scaling and multiscaling models of depth-duration-frequency curves for storm precipitation. J. Hydrol. 1996, 187, 45–64. [Google Scholar] [CrossRef]
  33. Ranzi, R.; Mariani, M.; Rossini, E.; Armanelli, B.; Bacchi, B. Analisi e Sintesi Delle Piogge Intense del Territorio Bresciano; Technical Report N. 12; University of Brescia: Brescia, Italy, 1999; p. 94. [Google Scholar]
  34. Gupta, V.K.; Waymire, E. Multiscaling properties of spatial rainfall and river flow distributions. J. Geophys. Res. Atmos 1990, 95, 1999–2009. [Google Scholar] [CrossRef]
  35. Rossi, F.; Fiorentino, M.; Versace, P. Two-component extreme value distribution for flood-frequency analysis. Wat. Resour. Res. 1984, 20, 847–856. [Google Scholar] [CrossRef]
  36. Klein Tank, A.M.G.; Wijngaard, J.B.; Konnen, G.P.; Bohm, R.; Demaree, G.; Gocheva, A.; Mileta, M.; Pashiardis, S.; Hejkrlik, L.; Kern-Hansen, C.; et al. Daily surface air temperature and precipitation dataset 1901–1999 for European Climate Assessment (ECA). Int. J. Climatol. 2002, 22, 1441–1453. [Google Scholar] [CrossRef]
  37. Jones, P.D.; Moberg, A. Hemispheric and large-scale surface air temperature variations: An extensive revision and an update to 2001. J. Clim. 2003, 16, 206–223. [Google Scholar] [CrossRef]
  38. Vose, R.S.; Easterling, D.R.; Gleason, B. Maximum and minimum temperature trends for the globe: An update through 2004. Geophysical. Res. Lett. 2005, 32. [Google Scholar] [CrossRef]
  39. Toreti, A.; Desiato, F. Temperature trend over Italy from 1961 to 2004. Theor. Appl. Climatol. 2008, 91, 51–58. [Google Scholar] [CrossRef]
  40. Liuzzo, L.; Bono, E.; Sammartano, V.; Freni, G. Analysis of spatial and temporal rainfall trends in Sicily during the 1921–2012 period. Theor. Appl. Climatol. 2015. [Google Scholar] [CrossRef]
  41. Coles, S.; Bawa, J.; Trenner, L.; Dorazio, P. An Introduction to Statistical Modeling of Extreme Values; Springer: London, UK, 2001; Volume 208. [Google Scholar]
  42. Bordi, I.; Fraedrich, K.; Petitta, M.; Sutera, A. Extreme value analysis of wet and dry periods in Sicily. Theor. Appl. Climatol. 2007, 87, 61–71. [Google Scholar] [CrossRef]
  43. Noto, L.V.; La Loggia, G. Use of L-moments approach for regional flood frequency analysis in Sicily, Italy. Water Res. Manag. 2009, 23, 2207–2229. [Google Scholar] [CrossRef]
  44. Hosking, J.R.M.; Wallis, J.R. Some statistics useful in regional frequency analysis. Water Resour. Res. 1993, 29, 271–281. [Google Scholar] [CrossRef]
  45. Rossman, L.A. Storm Water Management Model: User’s Manual 5.1; U.S. Environmental Protection Agency: Cincinnati, Ohio, USA, 2009.
  46. OFWAT. Preparing for the Future—Ofwat’s Climate Change Policy Statement; OFWAT: UK, 2008. Available online: https://www.ofwat.gov.uk (accessed on 22 September 2015).