3. Results
3.1. Dynamics Mode
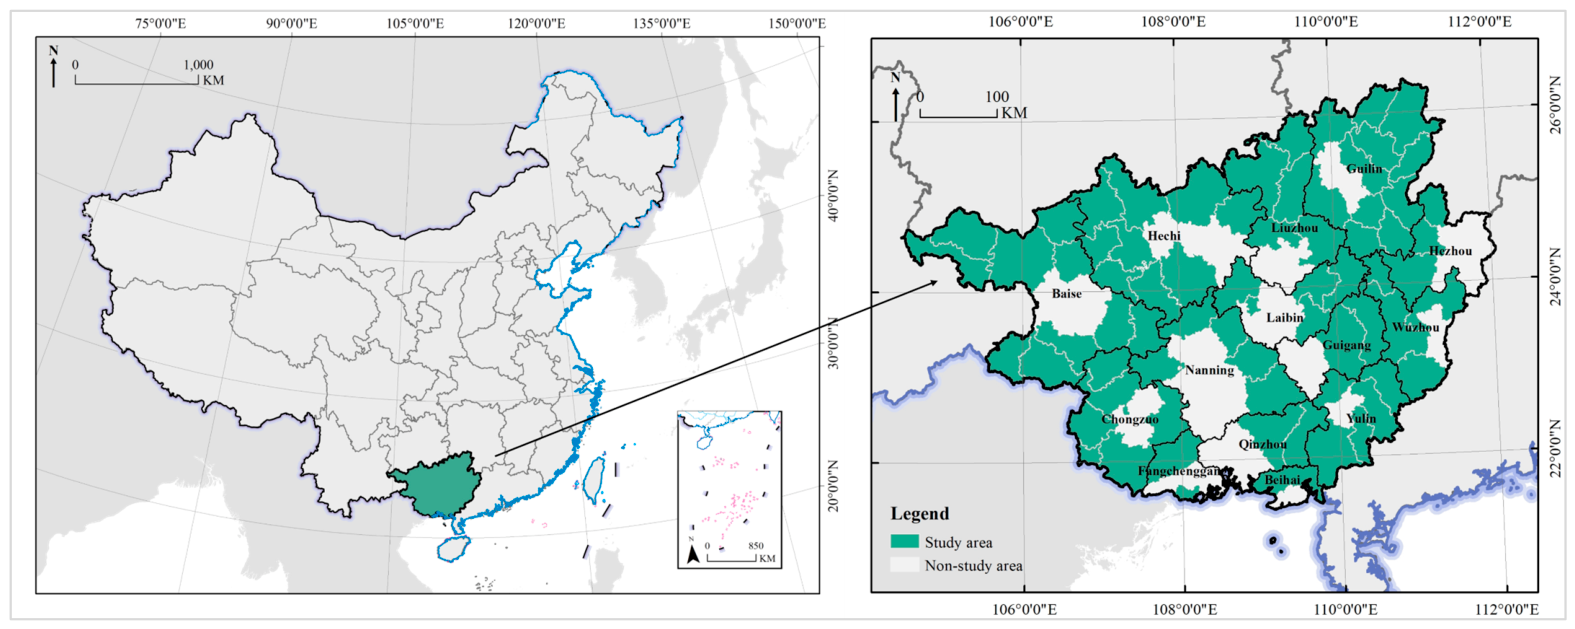
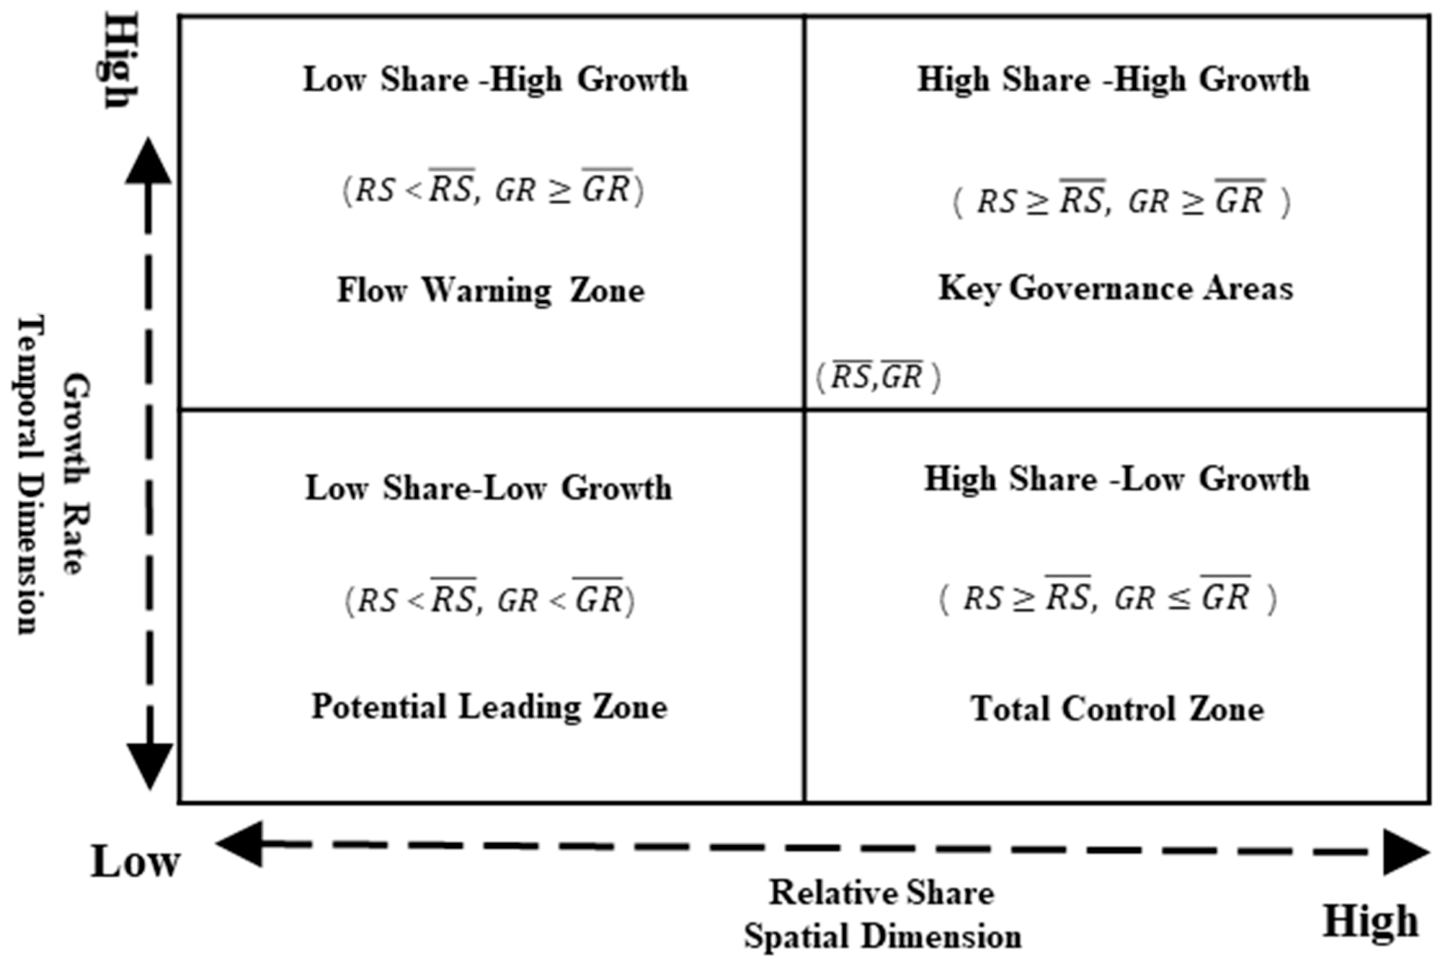
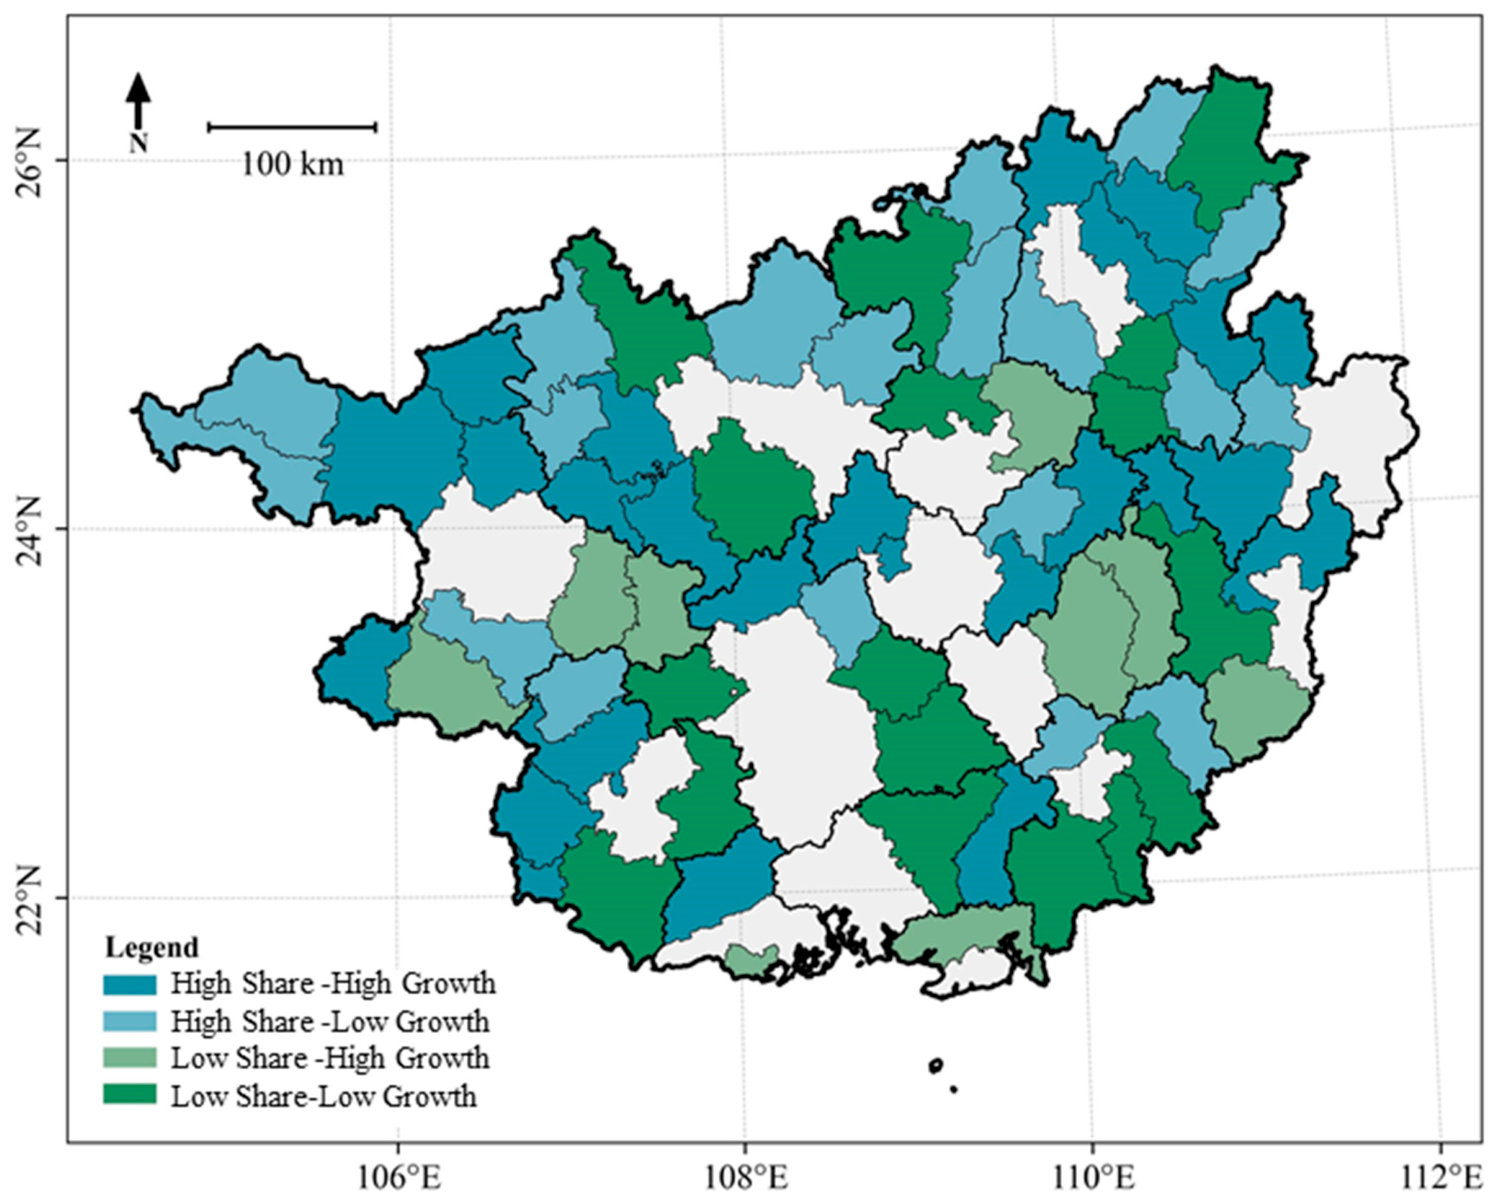
The average values of relative share and annual growth rate are 27.01% and 3.72%, respectively. Using these values as thresholds and applying the spatiotemporal dynamic matrix, the dynamic patterns of water resource consumption in the 70 counties are classified into four categories. The counties with low share–low growth have the highest proportion, reaching 35.71%. They are geographically dispersed, with only a relatively concentrated presence in the Beibu Gulf urban cluster. The counties with high share–low growth have the lowest proportion, only 12.86%. Most of them are located in northern Guangxi, a few in the central region, and very few in the south. High share–high growth and low share–high growth counties account for similar proportions, both around 25%. The former are mostly clustered in belts across eastern, northeastern, and northwestern Guangxi, while the latter are geographically dispersed without forming significant large-scale clusters or belts (
Figure 6).
Seventeen counties feature high share–high growth, namely Long’an, Binyang, Hengzhou, Liucheng, Rongshui, Yangshuo, Quanzhou, Lipu, Tengxian, Lingshan, Luchuan, Bobai, Beiliu, Nandan, Du’an, Fusui, and Ningming. They account for a high proportion and rapid growth in water resource consumption, making them key areas for comprehensive water use planning and management in Guangxi. The pressing water resource consumption pressures necessitate that these regions implement the strictest water management policies in conjunction with decoupling measures in the future. For example, they should establish a new mechanism that integrates dual controls on both water reserves and flow rates, accelerate improvements in water use efficiency, and strictly control the implementation of water-intensive projects.
Nine counties fall under the category of high share–low growth, namely Luzhai, Cenxi, Hepu, Dongxing, Pingnan, Guiping, Tiandong, Jingxi, and Pingguo. These areas exhibit high water resource consumption shares but low growth rates, making them key zones for total volume regulation in Guangxi’s water resource planning and management. They need to focus on strengthening the control of existing water use based on their decoupling status in the future. For example, measures may include optimizing water use patterns, establishing water recycling facilities, consolidating water conservation achievements, and guarding against the risk of backsliding.
Nineteen counties are in the low share–high growth category, namely Shanglin, Rong’an, Sanjiang, Yongfu, Guanyang, Ziyuan, Pingle, Rongxian, Xingye, Debao, Xilin, Longlin, Zhongshan, Tian’e, Fengshan, Luocheng, Huanjiang, Xiangzhou, and Tiandeng. These areas exhibit low water resource consumption shares but high growth rates, making them flow warning zones for water resource planning and management in Guangxi. Guided by water saving policies, they need to prioritize strengthening water flow management based on decoupling status in the future. For example, a early warning mechanism for water use growth can be established to guide the development of low-water-consumption industries, plan water source security facilities in advance, and deploy water saving infrastructure.
Twenty-five counties are in the low share–low growth group, namely Mashan, Lingchuan, Xing’an, Longsheng, Gongcheng, Cangwu, Mengshan, Shangsi, Pubei, Napo, Lingyun, Leye, Tianlin, Zhaoping, Fuchuan, Donglan, Bama, Dahua, Xincheng, Wuxuan, Jinxiu, Heshan, Longzhou, Daxin, and Pingxiang. They exhibit low water use shares and growth rates, making them potential benchmark areas for water resource planning and management in Guangxi. The future will require identifying genuine benchmarks for water use and management across all categories based on decoupling conditions. Follow-up actions include summarizing the water use and conservation experience of benchmark county towns, establishing publicity and promotion mechanisms, further strengthening water ecological protection, and maintaining the advantages of low water use and relative sustainability.
3.2. Decoupling Effect
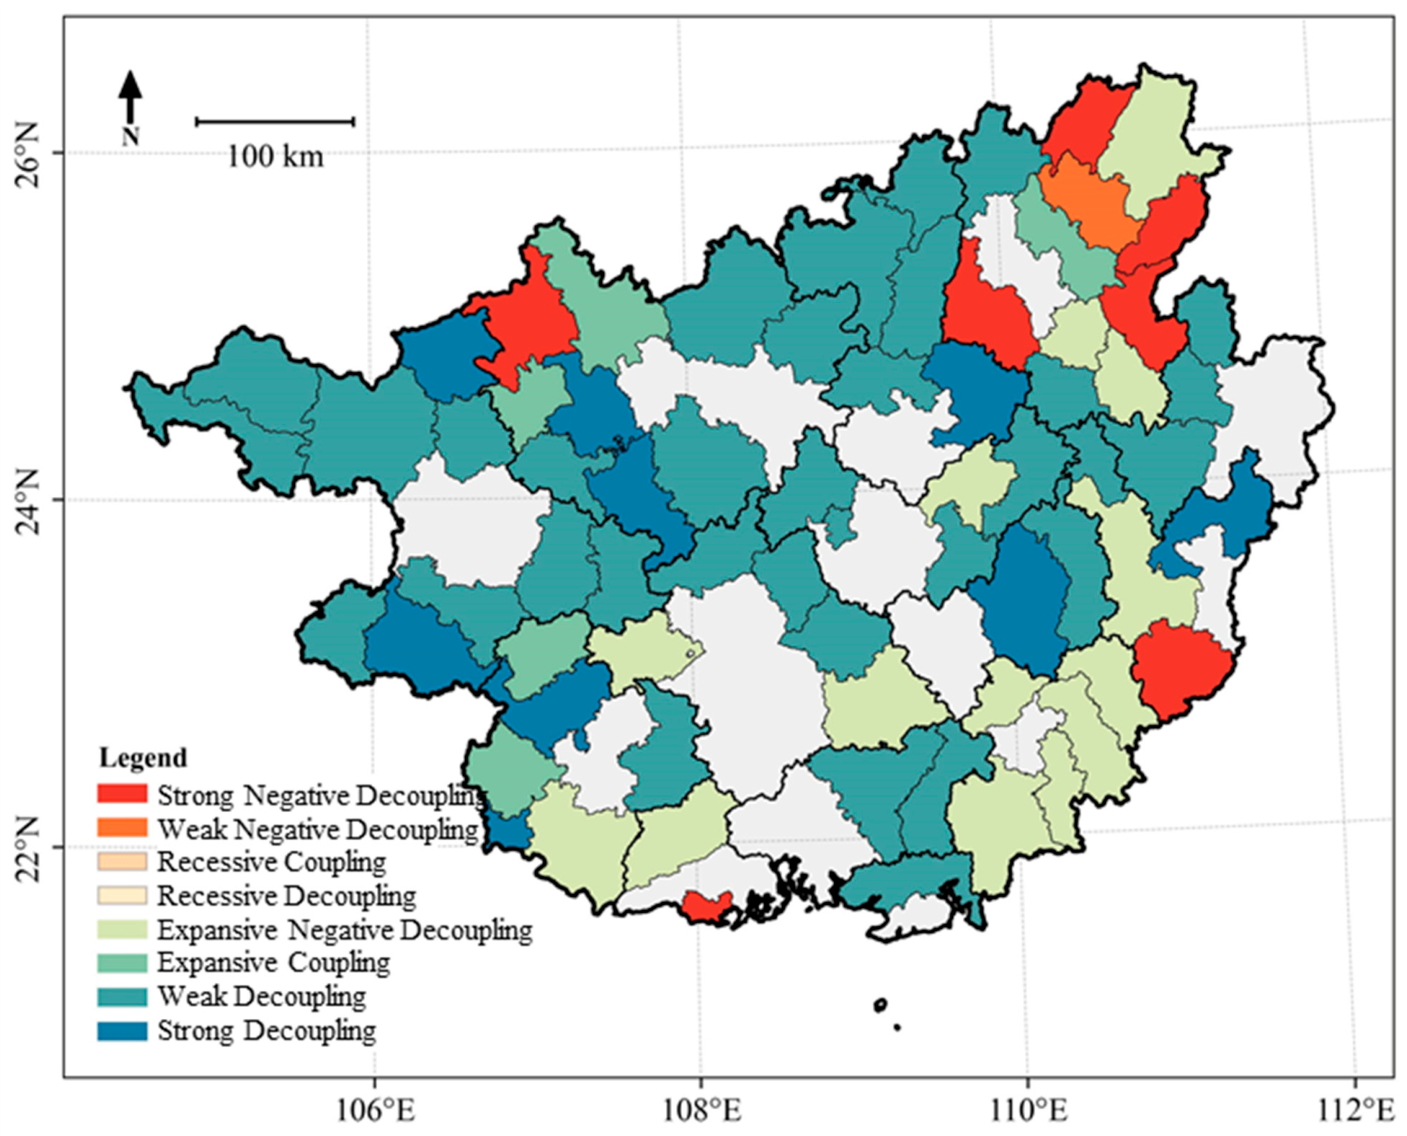
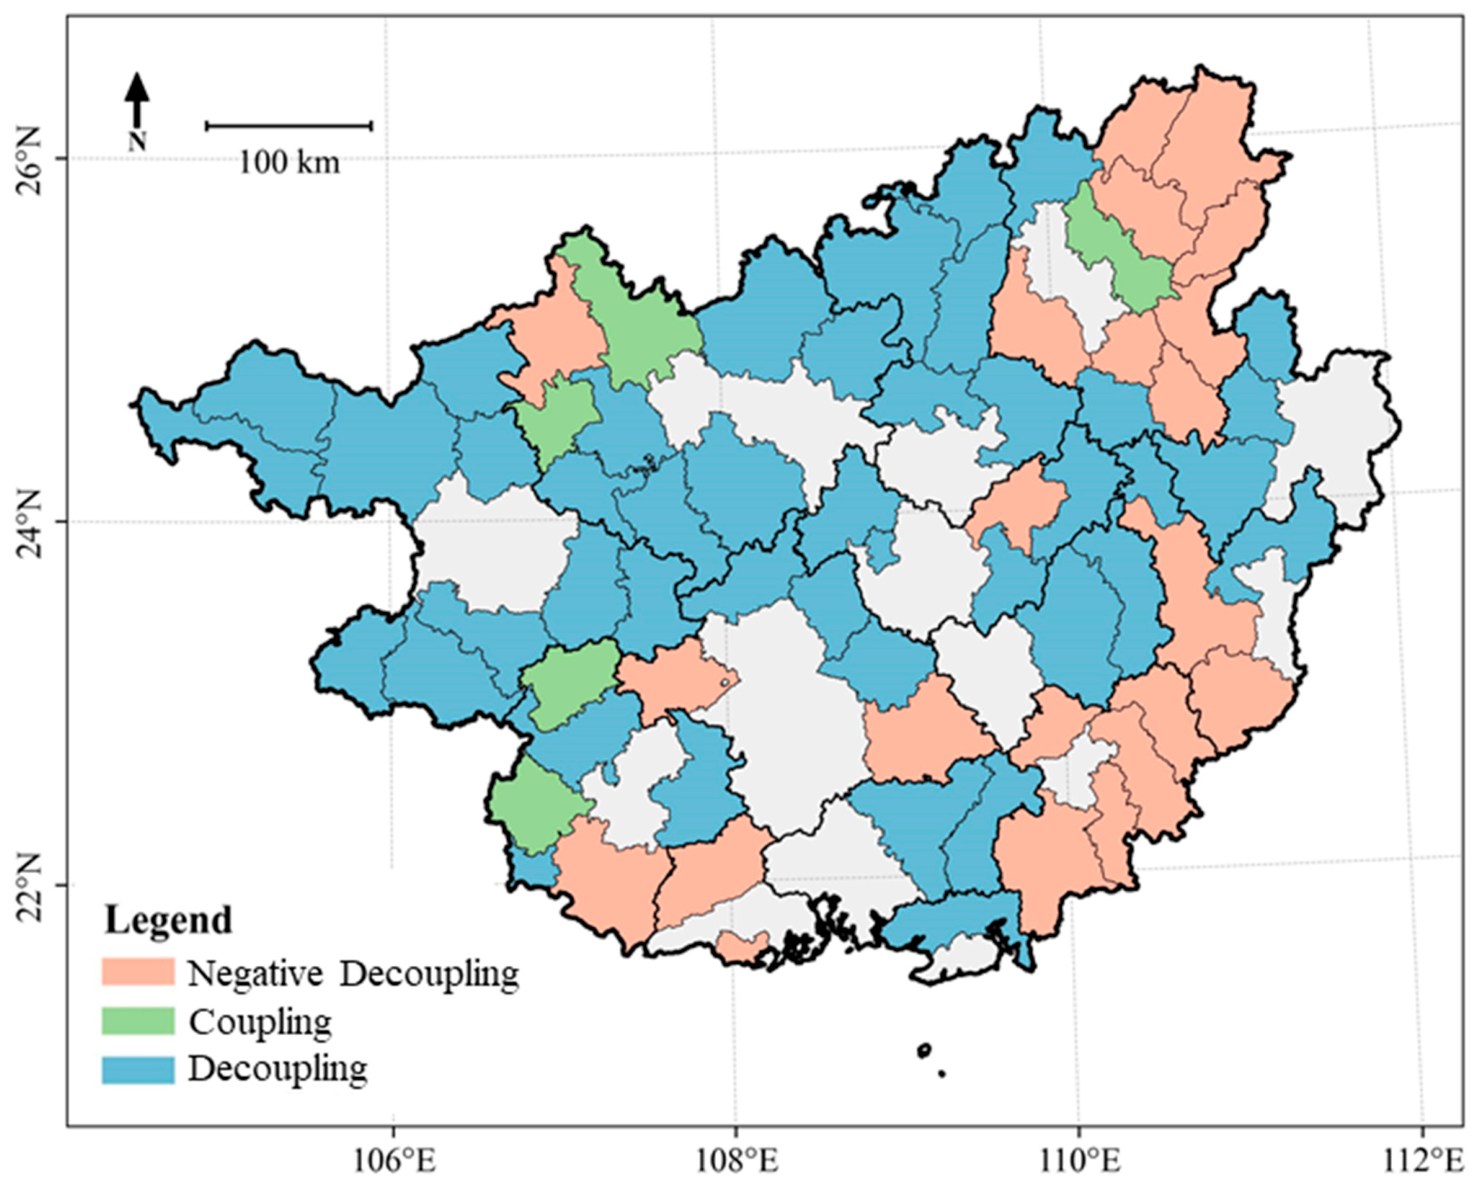
The decoupling analysis results are shown in
Figure 7 and
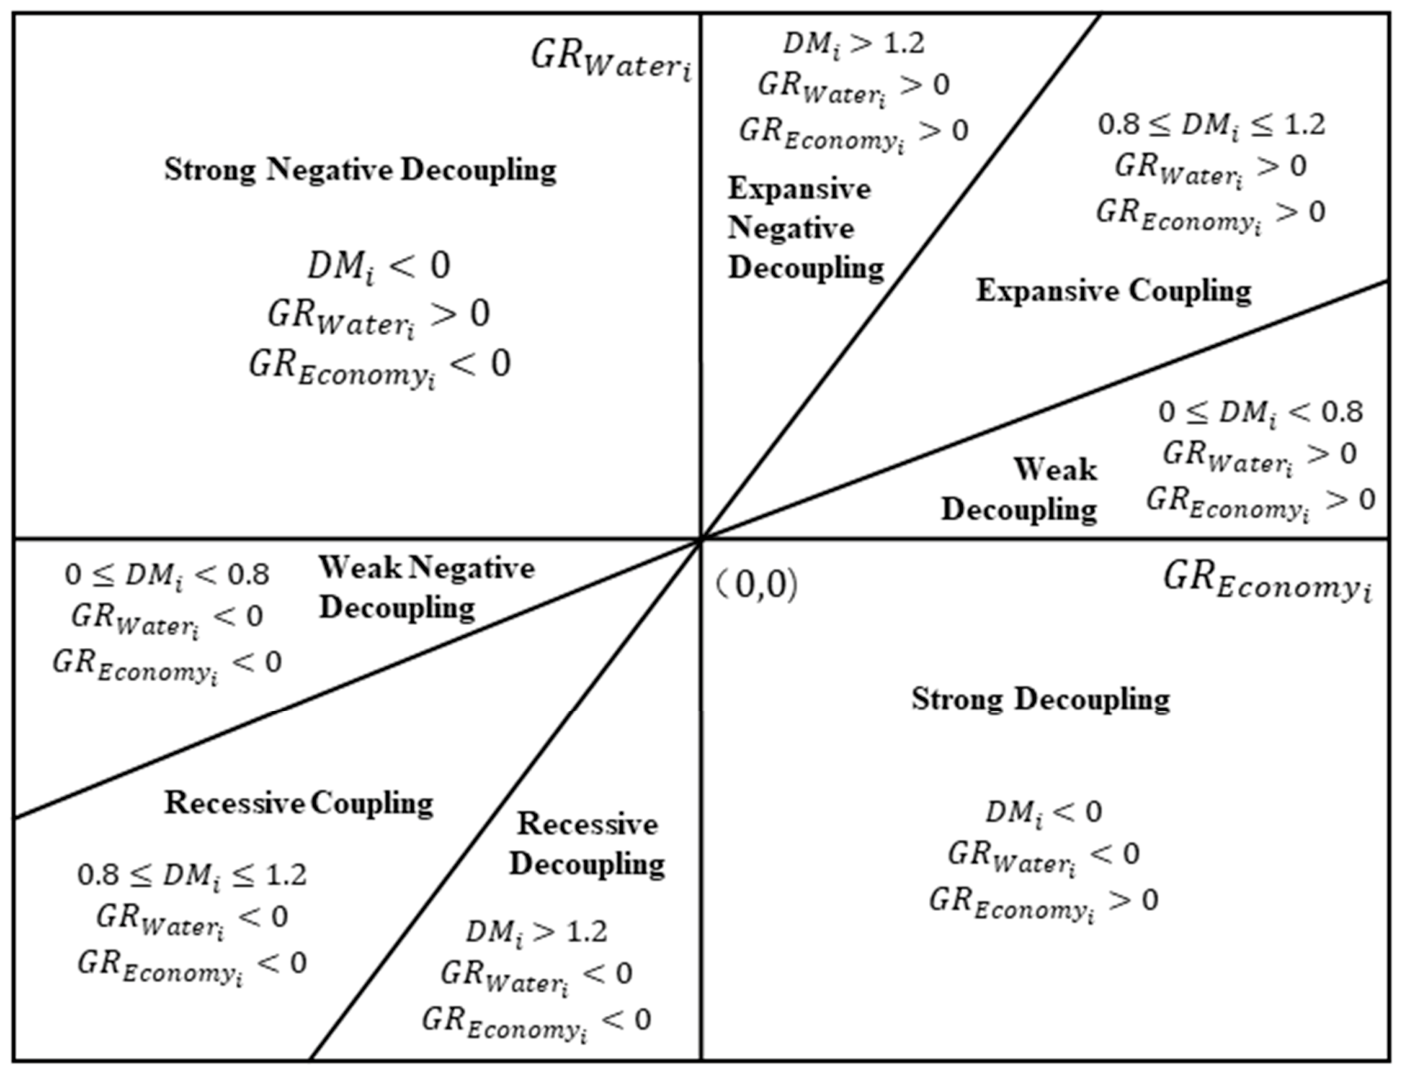
Figure 8. Across the eight decoupling states, weak decoupling accounts for the highest proportion, while expansive negative decoupling also holds a significant share. Recessive decoupling, recessive coupling, and weak negative decoupling are absent, with the remaining states being relatively fewer in number. From a broad category perspective, over 60% of counties are in a decoupling state, primarily clustered in northeastern Guangxi, northern Guangxi, and the border regions of Hezhou, Guigang, Laibin, and Liuzhou. Over 30% of counties are in an unhealthy negative decoupling state, predominantly distributed in southeastern and northeastern Guangxi. Five counties are in a coupling state, namely Lingchuan, Nandan, Fengshan, Longzhou, and Tiandeng, with their future transition direction still to be observed.
In terms of favorable decoupling, nine counties exhibit strong decoupling, namely Luzhai, Cangwu, Guiping, Leye, Jingxi, Donglan, Dahua, Daxin, and Pingxiang. These counties have achieved reduced water use while maintaining rapid economic growth, indicating that high-quality economic development has broken free from dependence on water use, representing the most ideal state. Thirty-four counties are in a weak decoupling state, including Mashan, Shanglin, Binyang, Liucheng, Rong’an, Rongshui, Sanjiang, Longsheng, Lipu, Mengshan, Hepu, Lingshan, Pubei, Pingnan, Tiandong, Debao, Napo, Lingyun, and Tianlin. Most counties exhibit clustered agglomeration, primarily distributed in cities such as Baise, Hechi, Liuzhou, Laibin, and Wuzhou. Their economic growth rates significantly outpace water use rates. Although not in an ideal state, water use is relatively intensive and efficient.
From the perspective of unfavorable decoupling, seven counties are in the least desirable strong negative decoupling state, namely Yongfu, Guanyang, Ziyuan, Gongcheng, Cenxi, Dongxing, and Tian’e. During economic downturns, their water use increased rather than decreased, indicating potential severe water resource wastage. Fourteen counties are in the expansive negative decoupling state, namely Long’an, Hengzhou, Yangshuo, Quanzhou, Pingle, Tengxian, Shangsi, Rongxian, Luchuan, Bobai, Xingye, Beiliu, Xiangzhou, and Ningming, mostly concentrated in the urban agglomeration in the southeast of Guangxi. They are characterized by water use rates far exceeding economic growth, potentially indicating significant water resource mismanagement. Xing’an is in a state of weak negative decoupling, experiencing simultaneous reductions in both economic output and water resource consumption, with the former declining at a faster rate than the latter, indicating room for improvement in water use efficiency. Five counties are experiencing expansive coupling: Lingchuan, Nandan, Fengshan, Longzhou, and Tiandeng. They show that economic growth and water use have increased in tandem, with economic development remaining heavily reliant on water resources.
3.3. Influencing Factors
The dependent variable is the decoupling relationship, as the decoupling index does not fully indicate the association between water use and industrial value-added growth. Additionally, selecting the decoupling relationship rather than the decoupling type as the dependent variable mitigates the impact of outliers on the analysis results. In the preceding analysis, the eight decoupling states exhibited uneven development in Guangxi, making them unsuitable for direct machine learning modeling. Moreover, for policymakers, decoupling is the ideal state, while negative decoupling and coupling are undesirable states. Thus, decision-makers are more concerned with the driving mechanisms of decoupling. Therefore, in the processing of dependent variable data, decoupling was assigned a value of 1, while negative decoupling and coupling were assigned a value of −1. For the dependent variable, 64.29% of the counties had a value of 1, while 35.71% had a value of −1. The dependent variable data were relatively balanced, with positive values holding a comparative advantage, which is more conducive to machine learning modeling. Since the dependent variable is categorical data, an econometric model based on classification rather than regression is used for interpretable machine learning modeling. Controlling the number of independent variables and aggregating the values of the dependent variables helps prevent overfitting in machine learning models. To ensure model robustness, we selected five algorithms for comparative analysis in this paper. After a comparative analysis of training accuracy, test accuracy, test precision, test recall, and test F1-score, RandomForest was finally chosen in this study. Meanwhile, although the parameters of other algorithms differed from those of RandomForest, the gap was not significant, demonstrating high robustness in model construction. The training set accounted for 90% of the data, while the test set comprised 10%. The training set achieved high accuracy, and the test set accuracy exceeded 0.7, which is quite good for a small dataset (
Table 3).
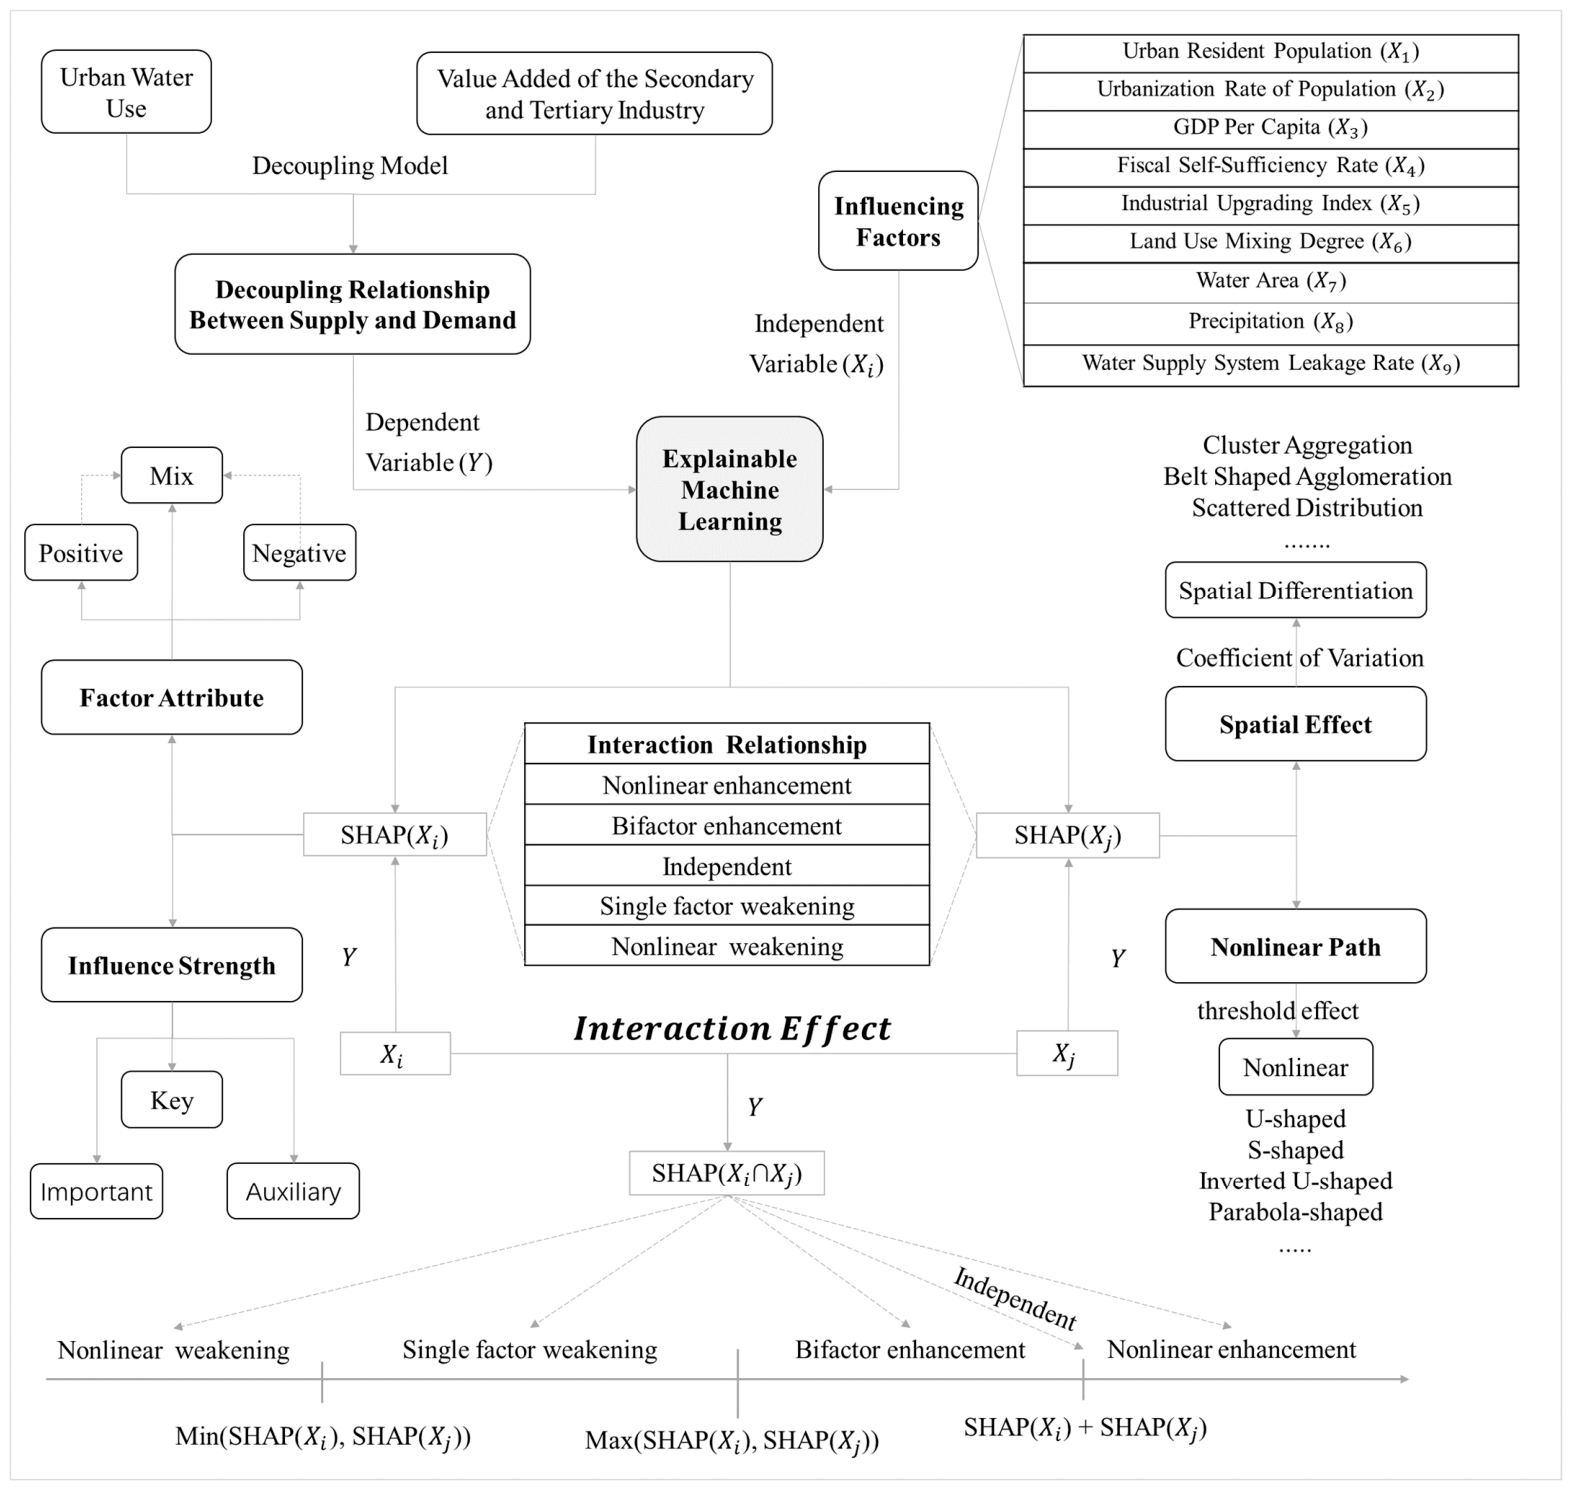
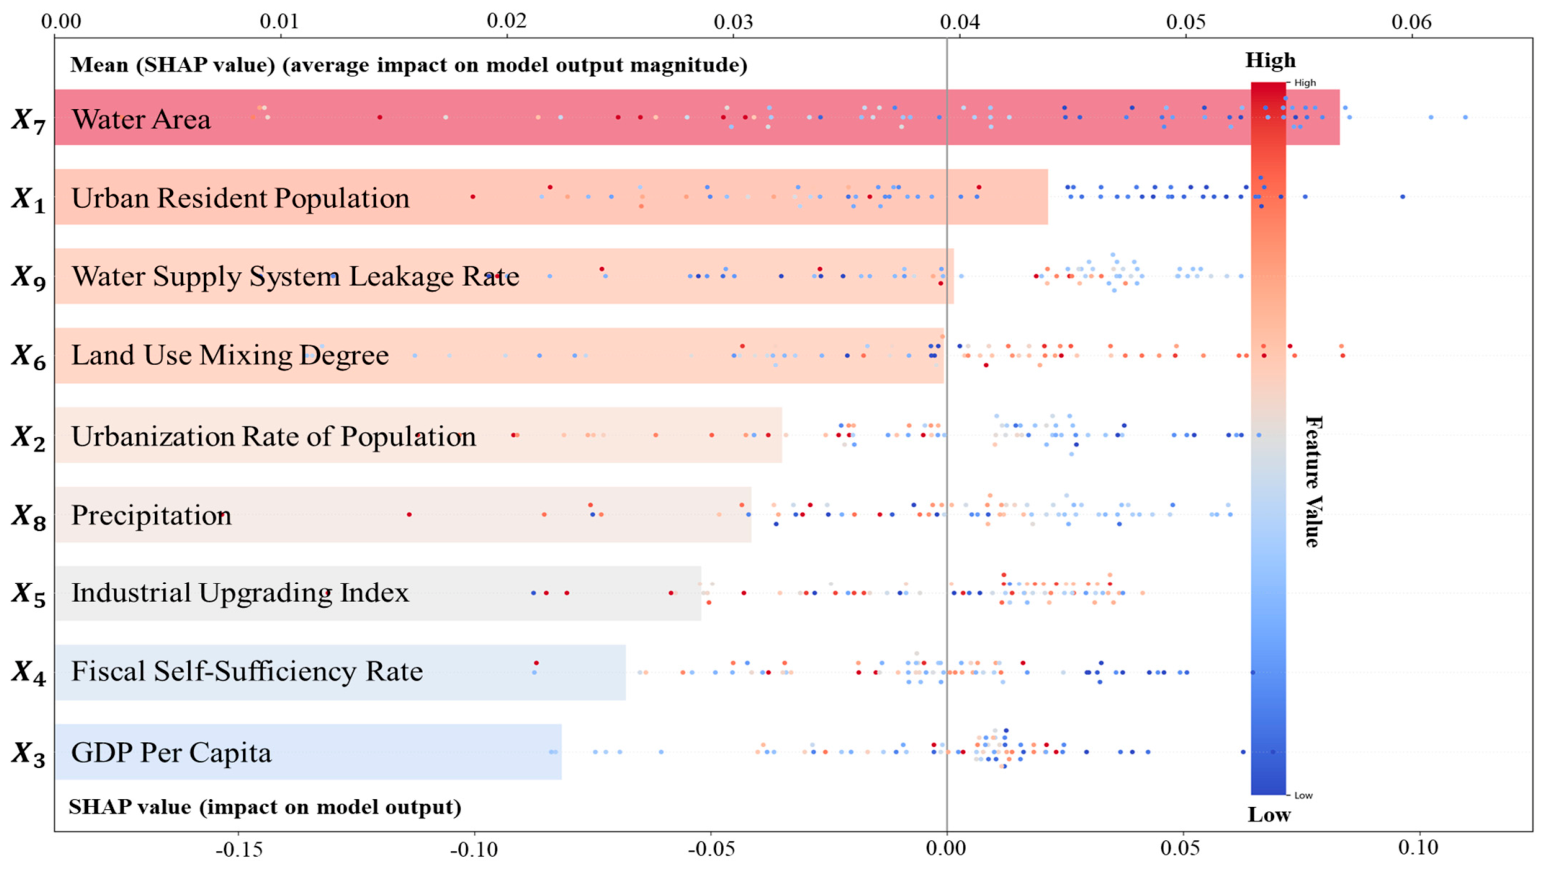
Figure 9 presents a summary of the interpretable machine learning analysis results. All influencing factors exhibit mixed positive and negative effects on the decoupling index, with significant variations in their impact strengths.
(water area) demonstrates the most substantial influence, followed by
(urban resident population), and they are classified as key factors. The influences of
(water supply system leakage rate),
(land use mixing degree),
(urbanization rate of population), and
(precipitation) are also noteworthy, so they are categorized as important factors. The influences of
(industrial upgrading index),
(fiscal self-sufficiency rate), and
(GDP per capita) are minimal, so they are classified as auxiliary factors.
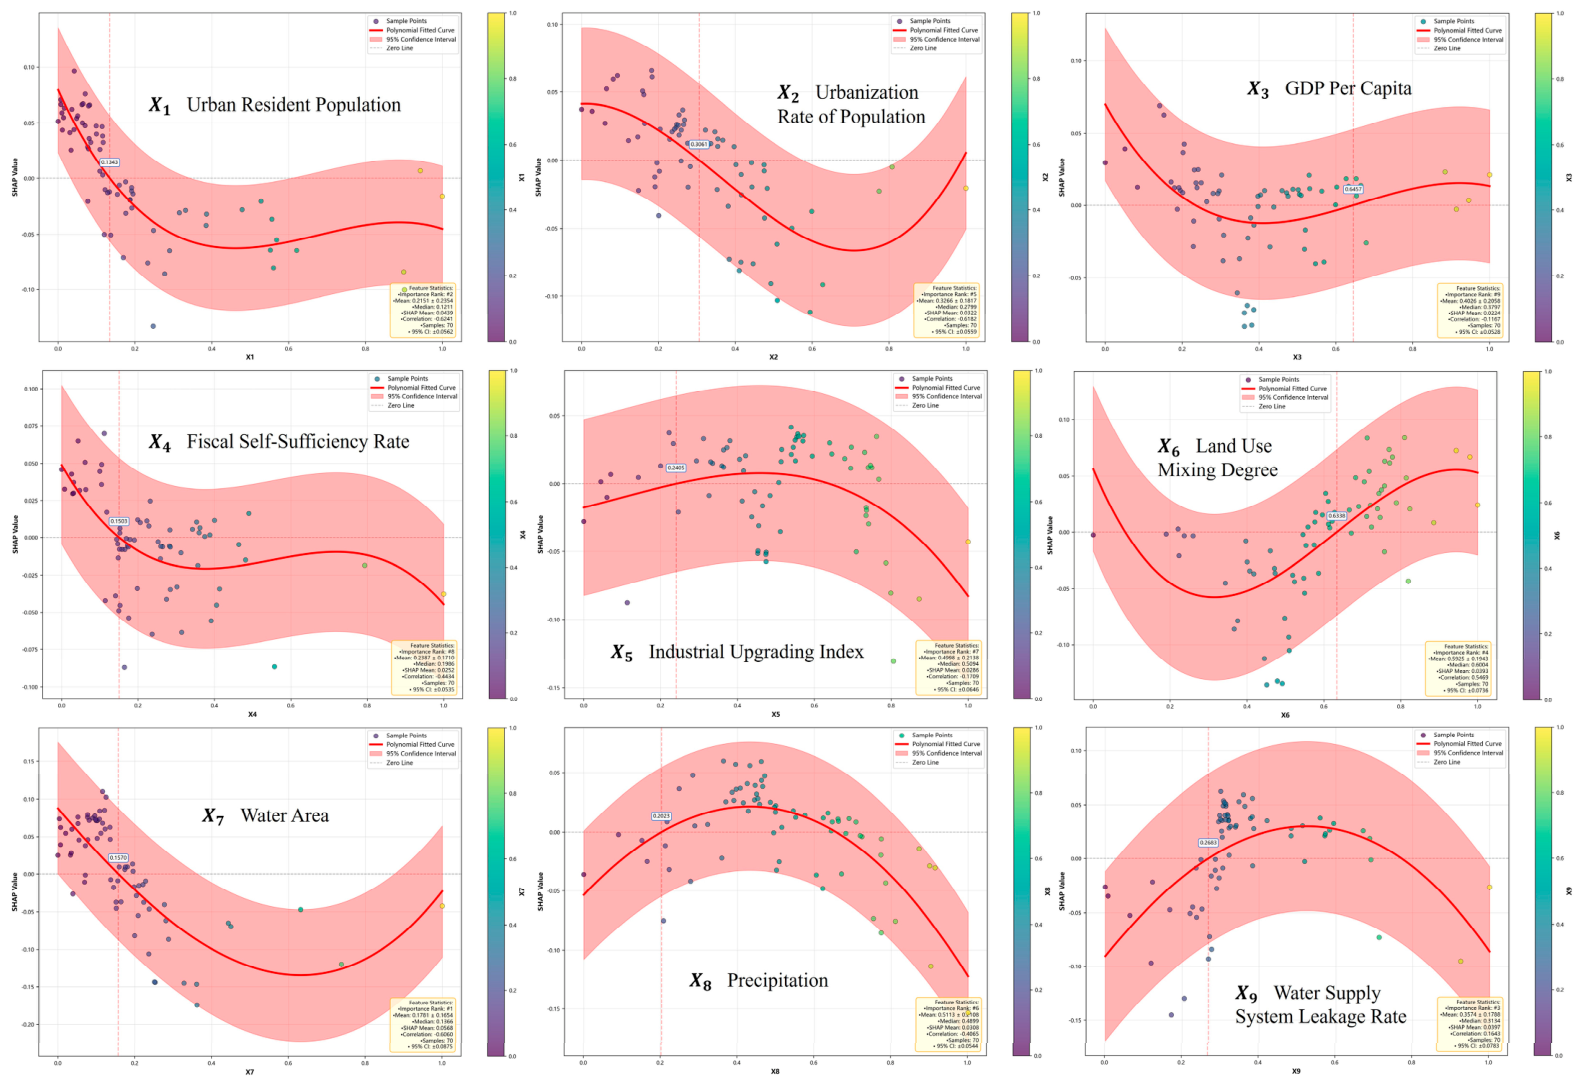
Figure 10 illustrates the nonlinear interaction pathways of factors. The action paths of urban resident population (
) and GDP per capita (
) are similar, exhibiting an L-shaped pattern. Both urbanization rate of population (
) and land use mixing degree (
) follow a distorted U-shaped path, but show opposite trends at their left and right ends. The effect path of fiscal self-sufficiency rate (
) is manifested as an N-shape. The effect path of industrial upgrading index (
) displays a parabolic pattern. The action path of water area (
) is U-shaped, whereas precipitation (
) and water supply system leakage rate (
) exhibit the opposite pattern, namely an inverted U-shape. Most factors exhibit significant threshold effects, with varying threshold values. Notably, although the threshold values are not identical across different algorithms, they do not disappear.
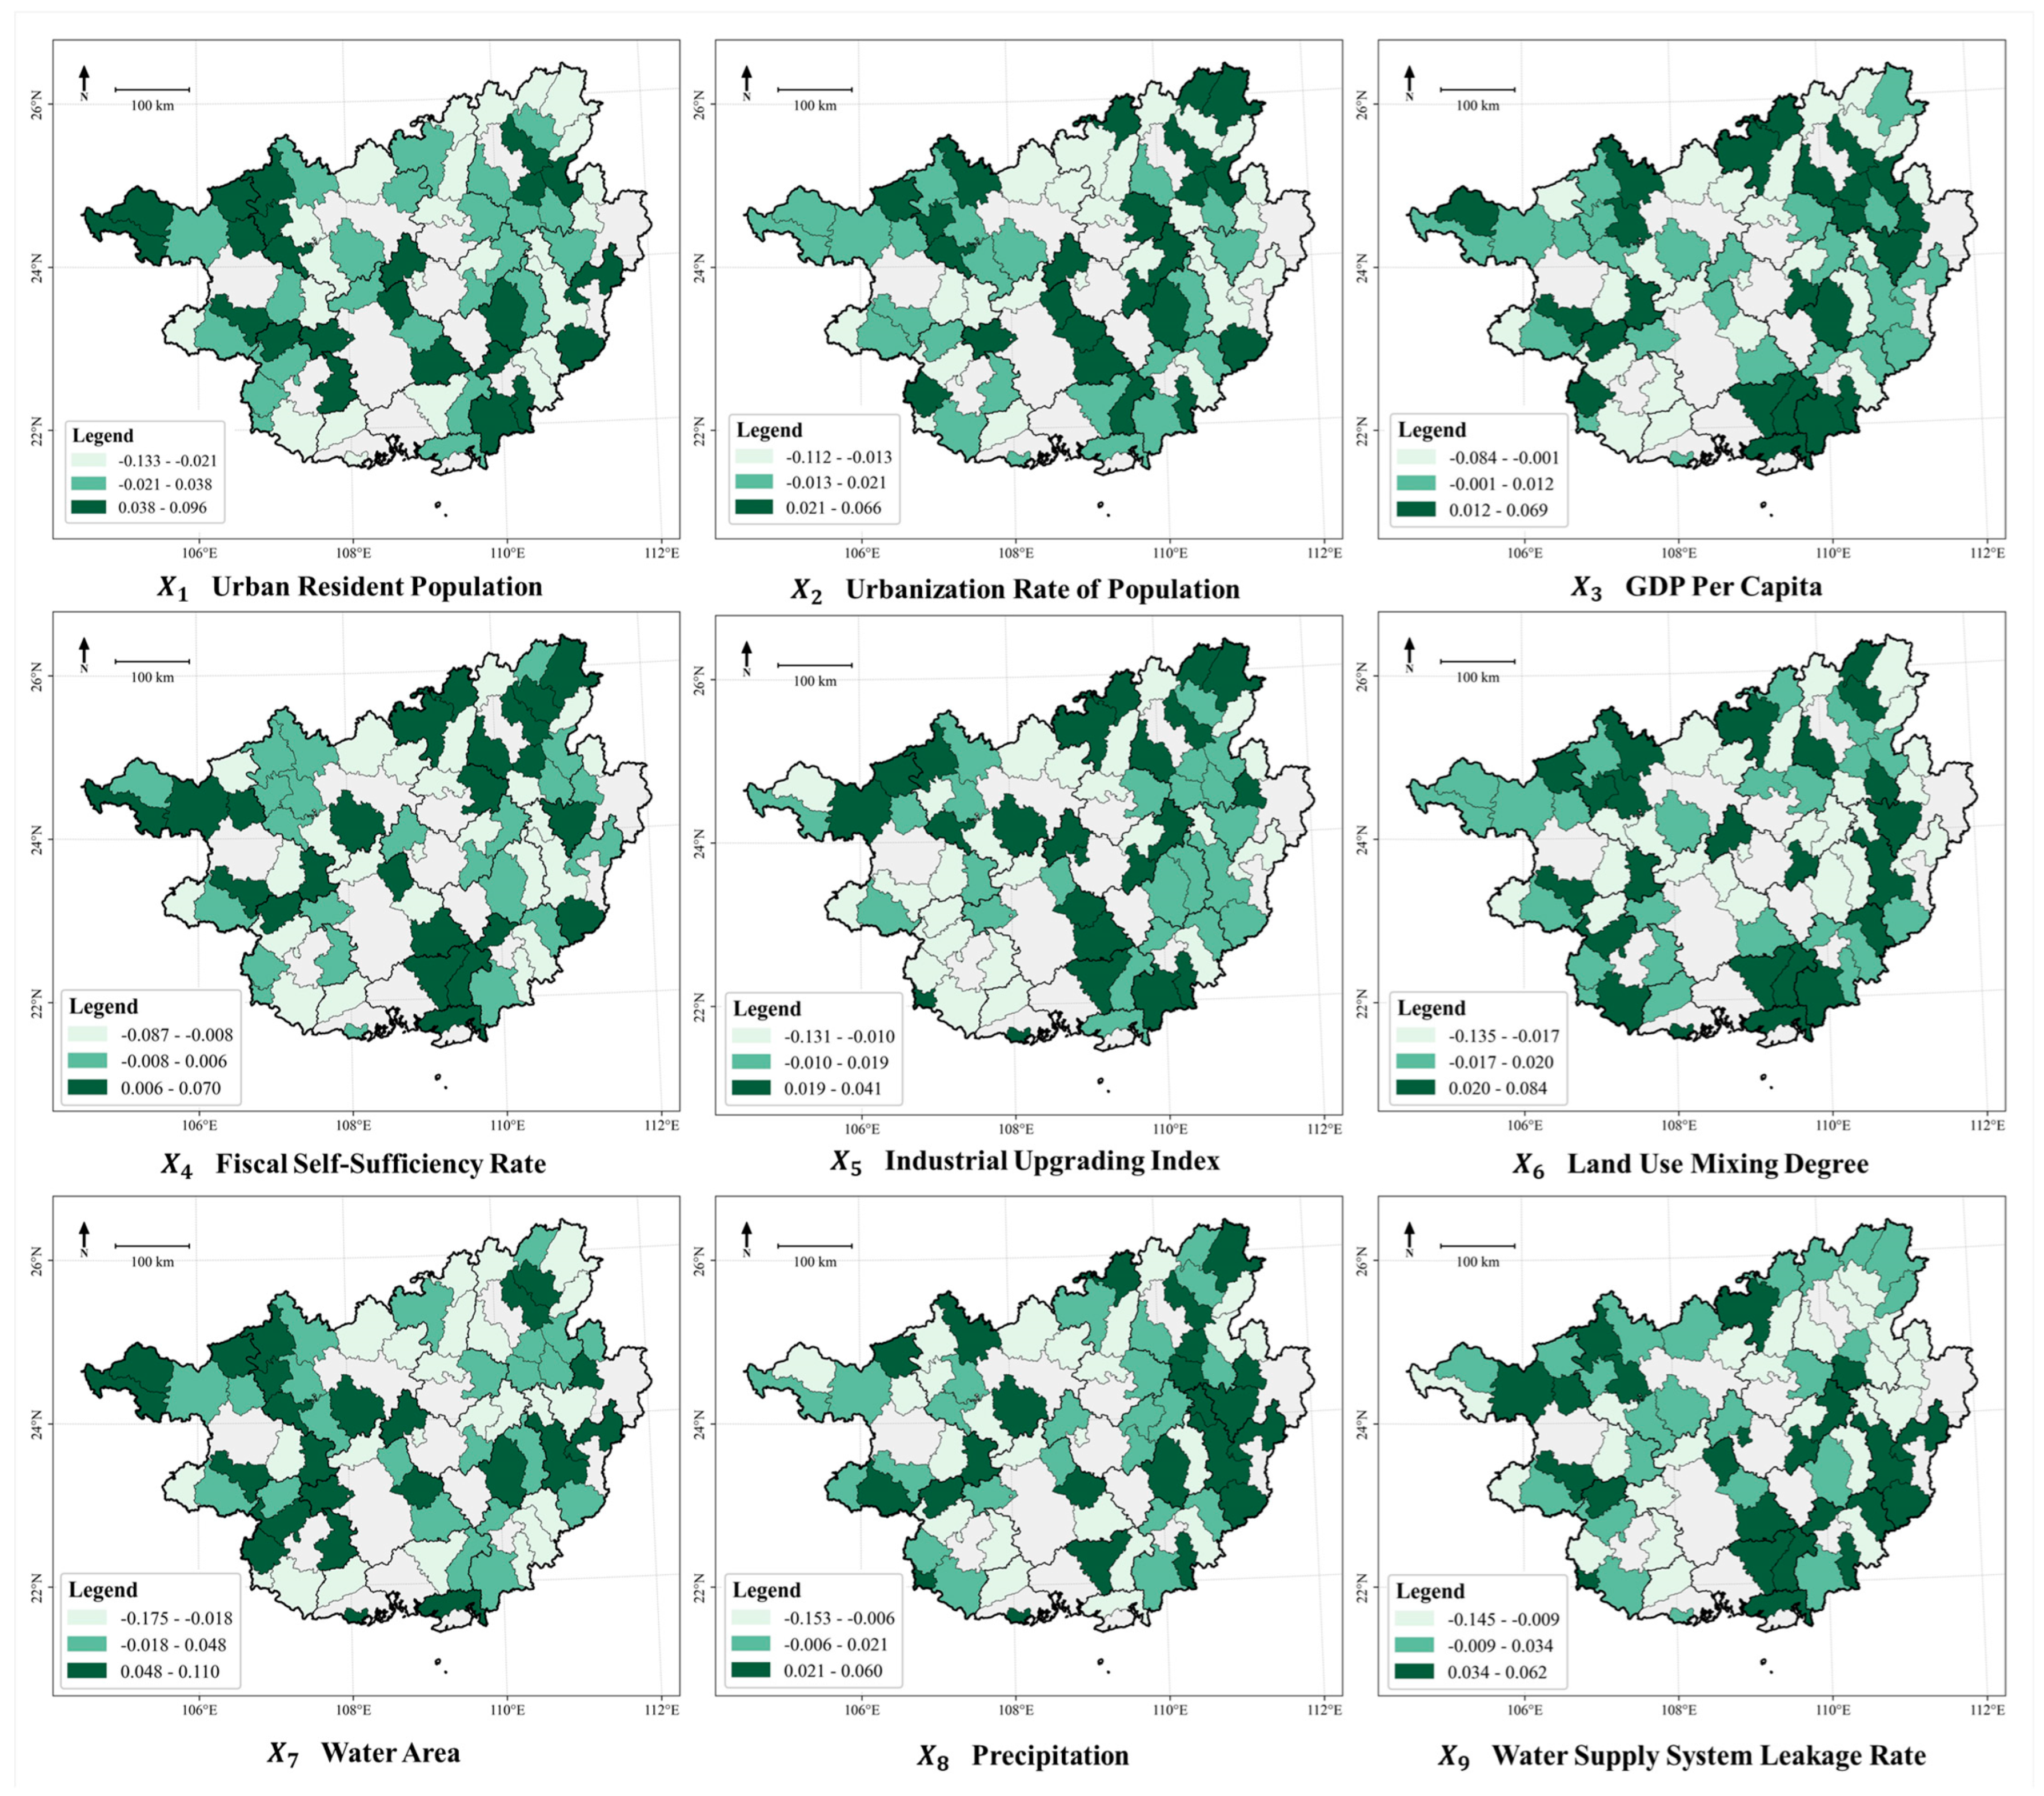
Table 4 and
Figure 11 reveal that the coefficient of variation for factor influence is remarkably high, and their spatial distribution also demonstrates significant heterogeneity.
Urban resident population () has a positive effect on the decoupling relationship at low values; however, as the value increases, the effect gradually shifts from positive to negative and tends to stabilize. It has two threshold values, with 0.13 marking the inflection point where the effect reverses, and 0.40 marking the critical point where the effect intensity tends to stabilize. Population is one of the terminal entities in urban water resource consumption. For Guangxi, maintaining the permanent resident population of counties within 91 thousand people facilitates decoupling. Conversely, an insufficient population hinders economies of scale, while an excessive population may lead to diseconomies of scale, both suppressing the decoupling index. Spatially, counties exerting positive effects are predominantly located on the periphery of central cities. High positive values are mostly concentrated in the Zuojiang–Youjiang revolutionary base area and the southeastern Guangxi urban agglomeration, while high negative values are predominantly clustered in northeastern Guangxi.
The nonlinear effect path of the urbanization rate of population () is characterized by a left-skewed U-shaped curve. It has a positive impact on the decoupling relationship at low values. As the value increases, it turns to negative inhibition, and the intensity of the influence undergoes a process of first increasing and then decreasing. It also has two threshold values, 0.31 and 0.7, which serve as inflection points for changes in the nature and intensity of the factor’s influence. This suggests that when the urbanization rate is below 22.91%, it promotes the decoupling relationship. Once this threshold is exceeded, a suppressing effect will take hold, and this effect will intensify as the urbanization rate rises. However, this strengthening is constrained, and when the urbanization rate surpasses 52.39%, the inhibitory effect begins to diminish. High positive values form multiple agglomeration belts in central and northeastern Guangxi, while high negative values cluster in the Zuojiang–Youjiang revolutionary base area.
GDP per capita () exerts a positive influence at both extremely low and high levels but shows a negative inhibitory effect in the intermediate stage. It has three threshold values, namely 0.22, 0.40, and 0.65. This suggests that when GDP per capita is below 17,558 yuan or above 50,546 yuan, it significantly promotes the formation of a decoupling relationship. The range between these levels will limit any potential breakout, with the maximum inhibitory effect at 31,312 yuan. High positive values exhibit clustered distribution in the Beibu Gulf Economic Zone and linear aggregation in northeastern and northwestern Guangxi. Negative high values concentrate in central Guangxi and the southern part of the Zuojiang–Youjiang revolutionary base area.
The fiscal self-sufficiency rate () has three thresholds: 0.15, 0.28, and 0.8. The fiscal self-sufficiency rate below 7.64% promotes the formation of a decoupling relationship, and the two are inversely proportional. Exceeding this threshold, further increases in the fiscal self-sufficiency rate gradually strengthen its constraining effect on decoupling, stabilizing regionally at 14.42%. When the fiscal self-sufficiency rate exceeds 40.69%, stability is disrupted, and the inhibitory effect intensifies once more. High positive values cluster in the Beibu Gulf Economic Zone, forming multiple agglomeration belts or clusters around the central cities of northeastern and northwestern Guangxi. Negative high values aggregate in central, eastern, and southwestern Guangxi.
The industrial upgrading index () exerts an inhibitory effect at both low and high values. It has two distinct inflection points at 0.24 and 0.64, both serving as thresholds for qualitative changes. When the industrial upgrading index falls below 0.60, its inhibitory effect on decoupling gradually diminishes. When it exceeds 1.60, the inhibitory effect on the decoupling relationship increases rapidly. When it falls in the middle range between the two, it exerts a promoting effect on the decoupling relationship, but the influence is very weak. High positive values are mostly concentrated in the northern edge of Guangxi and the Beibu Gulf Economic Zone, while high negative values are clustered in the Zuojiang–Youjiang revolutionary base area, with medium values concentrated in eastern Guangxi.
The land use mixing degree () and the urbanization rate of population () exhibit opposite pathways of influence, exhibiting a right-skewed U-shaped pattern. The value 0.63 is the threshold point for the transition between positive and negative effects, corresponding to an information entropy of 1.24. Below this value, the inhibitory effect rapidly decreases, while above it, the promoting effect rapidly increases. High positive values are clustered in the Beibu Gulf Economic Zone, the northern part of the Zuojiang–Youjiang Revolutionary Old Area, and the northeastern corner of Guangxi, while high negative values are mostly concentrated in central Guangxi. High positive values exhibit clustered patterns in the Beibu Gulf Economic Zone and linear distributions in eastern and western Guangxi. Most of the high negative values are concentrated in contiguous areas in central Guangxi, while a small portion are clustered in strips along the eastern edge Guangxi.
The water area () has two distinct threshold inflection points at 0.16 and 0.60, governing qualitative and intensity changes, respectively. When the water area is below 5753 hectares, its positive promoting effect on the decoupling relationship rapidly diminishes. When the water area exceeds 21,985 hectares, its negative inhibitory effect on the decoupling relationship rapidly decreases. High positive values are grouped in finger-like cluster in the Zuojiang and Youjiang revolutionary base area, while high negative values are clustered in groups in southern and northeastern Guangxi.
The precipitation () and the water supply system leakage rate () have highly similar influence pathways, both featuring three thresholds. The thresholds of the former are 0.20, 0.44 and 0.64, and those of the latter are 0.27, 0.52 and 0.78, respectively. This indicates that when precipitation is below 494 mm and leakage rate is at 7.25, it has a negative inhibitory effect on the decoupling relationship. When precipitation is below 1071 mm and the leakage rate is less than 13.98, its promoting effect on the decoupling relationship increases gradually. It then begins to decline, turning into a negative inhibitory effect at 1555 mm and 21:11. For precipitation, high positive values exhibit a belt-shaped aggregation in eastern Guangxi, while high negative values are concentrated central Guangxi, the Zuojiang–Youjiang region, and the Beibu Gulf Economic Zone. For the water supply system leakage rate, the high positive values are predominantly concentrated at the adjacent areas between the Beibu Gulf Economic Zone and the southeastern Guangxi urban agglomeration, whereas the high negative values are concentrated in the neighboring zones of the Beibu Gulf and Zuojiang–Youjiang region, and in northeastern Guangxi.
3.4. Planning Strategy
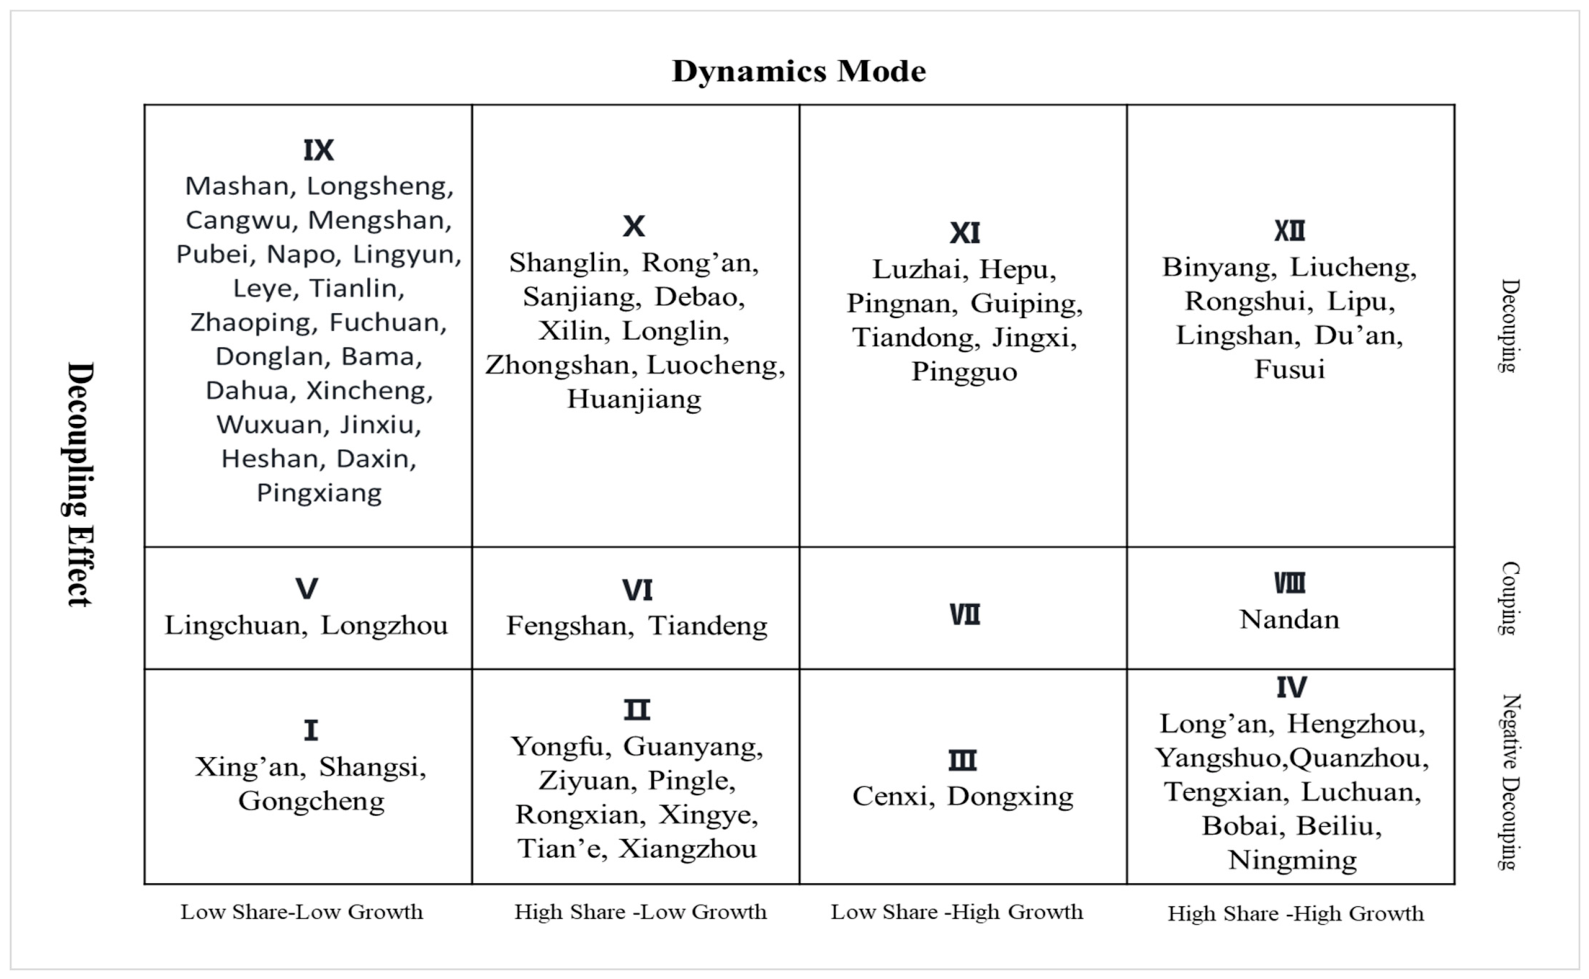
To enhance the accuracy of spatial water resource planning and policy design, this study constructs a 4 × 3 dual-dimensional policy zoning system using the coordinate system method. This method integrates the analysis results of the dynamics mode and decoupling effect, and divides 70 counties into 12 policy zonings (
Figure 12). The horizontal coordinate represents the dynamic modes of water resource consumption, including high share–high growth, high share–low growth, low share–high growth, and low share–low growth, which are used to assess the current state of water resource supply. The vertical coordinate represents the decoupling relationship between water resource consumption and economic growth, including decoupling, coupling, and negative decoupling, which measures water use efficiency. The new framework elevates water resource management decision-making from “single diagnosis” to “integrated governance”, enabling more precise spatial planning and providing a systematic basis for differentiated policy design.
Xing’an, Shangsi, and Gongcheng are located in zoning I. Counties in this zoning exhibit small water use scales and slow growth rates, possessing leading provincial infrastructure conditions and the potential to become regional benchmarks. However, they are extensive in water use and still in a negative decoupling state, which temporarily prevents them from becoming true benchmarks in Guangxi. Industrial structure is the key factor influencing their decoupling index. Therefore, the core of future policy design lies in improving water resource efficiency. It is recommended to integrate industrial restructuring, promote enterprise water quota management, and adopt water saving technologies and processes to gradually address the mismatch between urban water use efficiency and economic growth rates.
Yongfu, Guanyang, Ziyuan, Pingle, Rongxian, Xingye, Tian’e, and Xiangzhou are in zoning II. This zoning is characterized by a low growth of water resource consumption in the county, but with a large scale and extensive water use (in a negative decoupling state). Industrial structure, urbanization, industrialization, and water resource endowment are key factors influencing their decoupling indices. Thus, the focus of future policy design for them should be optimizing the utilization efficiency of existing water resources. Implementing a comprehensive special campaign is advisable to address water resource consumption, with low-efficiency and high-water-consuming enterprises shut down, and illegal water extraction completely eradicated. In addition, more technological investment should be made to promote low-cost water saving technologies and processes, improve the efficiency of industrial and domestic water use, and reduce water waste. Additionally, a regulatory mechanism should be established as soon as possible, and regular water use efficiency assessments should be conducted to ensure that the rectification measures are effectively implemented and gradually reverse the negative decoupling situation.
Cenxi and Dongxing lie in zoning III. The counties in this zoning exhibit small-scale but rapidly growing water resource consumption, coupled with inefficient water use and lagging economic development. Industrialization, urbanization, nighttime light index, water supply pipeline density, and leakage rate are their key factors. The core of future policy design lies in controlling water resource flow and improving water use efficiency, and a monitoring and warning mechanism for water resource consumption should be established as soon as possible. First, it is necessary to strictly control the flow of water use, implement rigorous water efficiency assessments for new projects, and prevent the approval of inefficient, high-water-consumption projects. Second, a dedicated campaign to enhance water use efficiency should be launched, promoting low-cost, easy-to-implement water saving technologies, with a focus on addressing the inefficient use of water in industrial production and household consumption. Thirdly, a warning mechanism should be established to monitor in real time the changes in the water use growth rate and economic growth rate, and control measures should be adjusted promptly to prevent the intensification of negative decoupling.
Long’an, Hengzhou, Yangshuo, Quanzhou, Tengxian, Luchuan, Bobai, Beiliu, and Ningming are located in zoning IV. This zoning is characterized by large-scale and rapid growth in county-level water resource consumption, coupled with severe issues such as extensive or wasteful water use and slow or declining economic development, making it a key area for targeted remediation. The key factors influencing their decoupling indices are urbanization and nighttime light index, while industrial structure, virtual water, water resources and precipitation, water supply pipeline density, and leakage rate also play significant roles. Therefore, future policy design must be systematic, coordinating synergistic governance across the three dimensions of stock, flow, and efficiency. First of all, the counties involved should strictly control the total water use, carry out special rectification on the existing enterprises with extensive water use, and set a time limit for rectification or elimination of backward production capacity. Secondly, they should enhance water flow management, suspend the approval of new high-water-consuming projects, and promote industrial reclaimed water reuse technologies. Third, it is necessary to integrate industrial structure optimization with water use efficiency improvements, linking water saving outcomes to local government performance evaluations to incentivize investment and business recruitment in green, water-efficient industries.
Lingchuan and Longzhou are in zoning V. Although the water use scale of the county in this zoning is small and the growth rate is slow, the synchronous changes in economy and water use have not yet reached an ideal state, making it a pseudo benchmark. Water area, precipitation, water supply pipeline density and leakage rate, and satellite nighttime light index are key factors influencing their decoupling index. Therefore, the core of future policy design lies in improving water use efficiency and strengthening water resource protection. On the one hand, these counties should promote water saving production and living models in response to the needs of urbanization and industrialization. Water use and conservation indicators should be included in the performance evaluation of enterprises, governments, and households, and used to optimize tiered water prices. On the other hand, they should encourage water system improvement and blue-line planning to promote water ecological restoration and protection. In addition, they should strengthen the construction of water resource reserve capacity, improve water storage and diversion facilities based on the karst topography and water system development characteristics of Guangxi, and prepare in advance to cope with the water supply pressure during the dry season.
Fengshan and Tiandeng are in zoning VI. Counties in this zoning exhibit high water resource consumption but low growth rates, with economic activity and water use changing in tandem. The key factors influencing their decoupling indices are industrial structure, years of education, fiscal self-sufficiency rate, and water area. Therefore, the core of future policy design should focus on optimizing existing resources, closely integrating water use efficiency improvements with economic development and population education. Urban water audits are necessary to identify inefficiencies in industrial, service sector, and residential water use, and develop targeted water saving retrofit plans. Priority should be given to renovating high-water-consuming and inefficient production and living facilities, establishing water efficiency benchmark enterprises and household incentive mechanisms, and providing production factor or financial incentives to water saving leading units. Additionally, efforts should be made to strengthen water saving publicity and education and enhance the water saving awareness of enterprises and residents. Additionally, governments should accelerate urban blue-line planning and improve water system management and aquatic conservation.
The members of zoning VII exhibit small-scale but rapid water use growth, with synchronized economic and water use trends. No county in Guangxi is located in zoning VII. To provide references for similar regions, this study suggests, based on logical reasoning, that policy design should prioritize flow control and efficiency enhancement. A refined water flow management mechanism can be established, setting differentiated water quotas based on industry type. Priority should be given to ensuring water supply for low-water-consumption, high-value-added industries, while comprehensively optimizing water resource allocation. Additionally, periodic assessments of the decoupling potential and status of water resource consumption are required to formulate targeted optimization measures and maximize water use efficiency.
Nandan is located in zoning VIII. Nandan exhibits large-scale and rapidly growing water resource consumption, with synchronized economic and water use changes, indicating significant room for improvement in water resource management. It is a typical resource-based city, and its industrial structure plays a crucial role in constraining the decoupling index. Given that Nandan is still in a phase of rapid development, future policy design should prioritize decoupling issues over restricting water supply quantities. It is recommended to prioritize quality and efficiency enhancement, driving the transformation of water use from coupling to decoupling. For instance, targeted optimization of resource-intensive industrial structures should be implemented, gradually reducing the proportion of high-water-consuming industries while fostering low-water-consuming, high-value-added industries and promoting water-efficient technologies and processes.
Mashan, Longsheng, Cangwu, Mengshan, Pubei, Napo, Lingyun, Leye, Tianlin, Zhaoping, Fuchuan, Donglan, Bama, Dahua, Xincheng, Wuxuan, Jinxiu, Heshan, Daxin, Pingxiang are located in zoning IX. Counties in this zoning, with a small scale of water resource consumption and slow growth rates, are already in a decoupling state, making them true benchmarks in Guangxi. The core of their future policy design lies in establishing regional demonstration models and disseminating proven best practices. It is recommended that the provincial government organize them to summarize water saving and water use experiences and replicate and promote these practices in other counties. To ensure long-term leading advantages and improve the water resource management system, they should establish a long-term water saving mechanism, and consolidate the decoupling achievements. In addition, it is recommended to develop blue-line planning, rationally allocate ecological water reserves based on ecological protection needs, accelerate the conservation of water areas and shorelines, and achieve synergistic benefits in water use, economic development, and ecological protection.
Shanglin, Rong’an, Sanjiang, Debao, Xilin, Longlin, Zhongshan, Luocheng, and Huanjiang are in zoning X. The counties in this zoning exhibit low growth rates in water resource consumption. Although they are in a state of decoupling, the scale of water use is still large. Urbanization, industrial structure, water area, and precipitation are key factors influencing their decoupling indices. The core of future policy design for them lies in stock optimization. It is recommended to optimize the structure of existing water use while maintaining low growth rates and high efficiency. The measures include establishing a total water use constraint mechanism, accurately linking water use indicators with economic growth rate, and forcing enterprises to improve water use efficiency. Precision management of industrial and urban domestic water use is essential, with further water saving potential to be tapped through the promotion of water saving fixtures and efficient water use technologies. Additionally, it is necessary to plan the rational reuse of water resources, improve the utilization rate of reclaimed water and recycled water, and reduce dependence on the exploitation and utilization of natural water resources.
Luzhai, Hepu, Pingnan, Guiping, Tiandong, Jingxi, and Pingguo are located in zoning XI. Counties in this zoning have the advantage of low water use levels and having already achieved decoupling, while its disadvantage is rapid growth. Urbanization, nighttime light index, water area, precipitation, virtual water, and fiscal self-sufficiency rate are key factors influencing their decoupling indices. The core of their future policy design focuses on flow management, strictly implementing the “Three Simultaneities” water saving system, and ensuring new projects are equipped with water saving facilities. Moreover, effective flow management alone will position them as new benchmarks for Guangxi, necessitating the early formulation of plans to establish water saving demonstration counties. In the near term, developing a series of water saving demonstration projects, high-standard planning, and deploying smart water management systems may drive regional competitive advantages through targeted initiatives.
Binyang, Liucheng, Rongshui, Lipu, Lingshan, Du’an, and Fusui are in zoning XII. Counties in this zoning are already in a state of decoupling, yet their water use remains substantial and continues to increase at a rapid pace. Industrial structure, industrialization, urbanization, nighttime light index, years of education, fiscal self-sufficiency rate, land area, water supply pipeline density, and leakage rate are key factors influencing their decoupling index. Future policy design should focus on establishing a new mechanism that integrates the management of water stock and flow to consolidate decoupling achievements. On the stock side, to address issues of low water supply pipeline density and high leakage rates, efforts should focus on advancing pipeline renewal and renovation to reduce conveyance losses. Additionally, increased fiscal support should be provided for water saving technologies and process upgrades to incentivize and compel high-water-consumption industries to transform and upgrade. On the flow side, the nighttime light index should be linked with the process of urbanization and industrialization. The water use efficiency access for new (expanded) construction projects should be strictly controlled, and differentiated water quota management should be implemented to lock the decoupling status.
4. Discussion
Different from the common practice of previous literatures based on linear methods, this study introduces multidisciplinary econometric models such as the spatiotemporal dynamic matrix, decoupling model, and explainable machine learning, establishing a nonlinear and interdisciplinary technical framework. Nonlinear methods in existing studies involve spatial econometric models and system dynamics. This study further extends them to the field of interpretable machine learning [
44]. Based on the case analysis in Guangxi, this paper corroborates some findings from prior research while yielding novel insights into the dynamic characteristics of water use, decoupling effects, and their underlying mechanisms.
Traditional water resource management often focuses solely on a single dimension, either stock (e.g., water use or reserves) or flow (e.g., changes in water use or growth rates) [
45,
46]. This study integrates both dimensions to construct a spatiotemporal dynamic matrix of water use. This method emphasizes a dynamic balance between stocks and flows in water resource management, enabling a more comprehensive and systematic grasp of the historical evolution path of water use, accurately identifying problem spaces, and providing decision-makers with water resource consumption trend information that better aligns with the objective laws of sustainable development. Water resource management based solely on stock or flow dimensions follows a linear thinking paradigm, where researchers primarily focus on the quantity and changes in water volume. This study achieves dual synergistic control through the deep integration of flows and stocks, driving the transformation of management concepts from linear changes to nonlinear combinations.
Notably, the results of the spatiotemporal dynamic matrix analysis will vary depending on the threshold selected. The mean and median are the most commonly used thresholds. Due to its excellent mathematical properties, using the mean as the threshold allows for the full utilization of all data. However, when used as a threshold, the mean is highly susceptible to the influence of outliers and is not suitable for the analysis of skewed distribution and multimodal distribution data. The median is not affected by outliers and is not sensitive to the overall shape of the data. However, using the median as a threshold may lead to insufficient utilization of all data information and sensitivity to sample size. In this study, the mean was selected as the threshold because it better utilizes all data and facilitates statistical modeling. To ensure the robustness of the study, the median threshold was tested and comparatively analyzed. More than 87% of the counties, regardless of whether the mean or the median was chosen as the threshold, had exactly the same analysis results. The difference lies in the fact that when using the mean as the threshold, the analysis results for Rong’an, Pubei, Rongxian, Xingye, Debao, and Zhongshan indicated low scale–high speed, whereas when the median is used as the threshold, they indicate high scale–high speed. Additionally, Xing’an, Wuxuan, and Longzhou were identified as low scale–low speed under the mean threshold, but shifted to high scale–low speed when the threshold changed to the median. Overall, the median as a threshold yields more robust, balanced, and moderate analysis results, while the mean allows for a more comprehensive use of data and helps identify imbalances more clearly. When choosing different cases for empirical research, the choice of threshold should align with the research objectives, sample size, data quality, and regional characteristics that conform to the study design.
Previous literature has revealed spatial heterogeneity in decoupling states across regions, yet research at macro scales such as provinces and large cities indicates that water resource consumption predominantly exhibits strong decoupling or negative decoupling states [
47]. For instance, Du [
48] and Zhang [
49] applied the Tapio-LMDI model to conduct empirical analyses of China from 2000 to 2020 and Jiangsu Province from 2004 to 2020, finding that economic development and production water use underwent a transition from “weak decoupling to strong decoupling”. Wang [
50] conducted an empirical analysis on panel data from 12 prefecture-level cities in Inner Mongolia from 2004 to 2023, revealing that the relationship between water use and economic growth generally shifted from weak decoupling to strong decoupling. Montoya found that the decoupling relationship between water use and economic development in Brazil primarily manifested as a negative decoupling state [
51]. Although water resource consumption in small-sized cities also reflects the heterogeneity and diversity of decoupling relationships, their statistical distribution of decoupling states differs from that observed in the aforementioned studies. In this study, most counties in Guangxi are in a state of weak decoupling, a discrepancy likely attributable to variations in research scope, spatial scale, and time span. Water resource consumption and its decoupling relationship with economic growth exhibit dynamic, cyclical, and regional characteristics, making differences in analytical results across varying research boundaries, scales, and periods inevitable. For instance, Li conducted an empirical analysis based on panel data from China’s prefecture-level cities between 2010 and 2019. The results indicate that most cities’ economic growth remains heavily reliant on water resources, with neither strong nor weak decoupling observed in a significant proportion of cities [
52]. Overall, the decoupling relationship between water resource consumption and economic growth manifests significant disparities between large cities (macro scale) and small-sized cities (micro scale). Research on both scales and regions should not be overlooked or neglected.
Based on the SHAP model of interpretable machine learning, this study found that factors such as water resource endowment, population size, urbanization, water supply infrastructure, and land use complexity exert stronger influences on the decoupling relationship. The finding validates the perspectives of some scholars; for example, Rasifaghihi [
53] believes that precipitation determines the scale of water use and Gong [
54] confirmed the significant impact of population on the decoupling index. The primary contribution of this study lies in revealing the nonlinear mechanisms of factor effects, by analyzing their threshold and spatial effects. These nonlinear analytical results markedly differ from existing literature, highlighting the significant value of the new model in uncovering complex mechanisms. For instance, Chu [
55] identified industrial structure effects as a key determinant of decoupling, but this study based on nonlinear model analysis found that its influence is not as strong. Zhang [
56] found that the economic effect was the most critical constraining factor according to the logarithmic mean Divisia index. Wu [
57] conducted a study on Xinjiang and found that the industrial structure promoted the decoupling process, but income and population size played an obstructive role. However, the analytical results of this study indicate that all factors exhibit dual positive and negative effects, with significant spatial and threshold effects in their impacts. Jia [
58] identified scale effects primarily exerting strong inhibitory influences, while the role of population factors remained relatively minor. In contrast, the findings of this study demonstrate that technological influence is relatively weak, often playing a supplementary role through interaction effects. Furthermore, the influence of population is generally strong and undergoes qualitative reversals at the two population size thresholds of 90,000 and 270,000. In summary, the impact of various factors on the decoupling index exhibits significant nonlinear characteristics, with typical threshold effects and spatial effects. The technical approach of this study significantly improves the analytical results of linear models.
Notably, Guangxi also has a considerable proportion of counties in unhealthy negative decoupling and coupling states, indicating prominent issues of extensive and wasteful water use in these areas. There is an urgent need to enhance spatial planning and policy design for improvement. Therefore, this study integrates the analytical results of the dynamics mode and decoupling effect to establish a systematic 4 × 3 decision-making toolbox. This technical toolbox directly links the flow and stock control targets of water resource consumption with the decoupling index, promoting a shift in water resource management mechanisms from quantity to efficiency, thereby offering a new pathway for smart water use [
59]. For instance, for high-water-consuming counties in negative decoupling and coupling states, future policies could set constraints—allocating limited incremental water use quotas only upon improvement in decoupling status. Based on the dynamic characteristics, decoupling relationships, and core influencing factors of water resource consumption across 12 policy zones, this study further proposes differentiated management recommendations. Additionally, policy design is not limited to water use. Aligning with new trends and requirements in territorial spatial planning, it is recommended that counties in multiple zones advance blue-line planning, comprehensive water area remediation, and ecological restoration to establish a new system integrating water resource development and aquatic ecological protection [
60].
Finally, this study has some limitations: regulations (e.g., policies, ordinances, standards) and water quality (e.g., pollution, wastewater, reclaimed water) significantly impact water use, economic development, and their decoupling relationship. However, due to challenges in obtaining county-level data, they were not incorporated into the empirical model. Regulations guide and constrain the behavior of various water users by setting standards and norms for water resource development, utilization, and protection, directly affecting water use efficiency and patterns. Differences in the enforcement intensity, regulatory efficiency, and incentive mechanisms of local water resource management regulations further influence water conservation outcomes and decoupling relationships [
61,
62]. Water quality, as a critical indicator of water resource quality, affects the availability and functionality of water resources and also constrains the long-term healthy development of aquatic ecosystems and the water environment. It exerts a non-negligible influence on the decoupling relationship between water use and economic development [
63]. Future research could more comprehensively reveal the institutional and quality constraints of the complex relationship between water resources and economic development by incorporating regulations and water quality into econometric models or analytical frameworks through surveys, textual analysis, or the construction of proxy indicators, thereby providing more comprehensive decision-making support.