Article

Hydrogeochemistry and Accelerating Salinization of Groundwater in the Saoura Valley Oases (Southwest, Algeria)

by
Abderrahmane Mekkaoui
1,
Sarra Ameri
2,
Abdeldjalil Belkendil
3,
Touhami Merzougui
4,
Boudjemaa Larabi
1,
Zineb Mansouri
5,
Eida S. Al-Farraj
6,*,
Mashael A. Alghamdi
6,
Yasmeen G. Abou El-Reash
6 and
Lotfi Mouni
7,*
1
Research Laboratory Reliability of Materials and Structures in Saharan Regions FIMAS, Department of Civil Engineering &Hydraulics, University Tahri Mohamed, Bechar 08000, Algeria
2
Department of Civil Engineering & Hydraulics, Faculty of Technology, Nour Bachir University Centre of El Bayadh (CUNB), El Bayadh 32000, Algeria
3
Centre de Recherche en Aménagement du Territoire (CRAT), Campus Zouaghi Slimane, Route de Ain el Bey, Constantine 25000, Algeria
4
Chemistry and Environmental Sciences Laboratory, University of Tahri Mohamed, Bechar 08000, Algeria
5
Laboratory of Mobilization and Resources Management, Department of Geology and Earth Sciences Universe Institute, University of Batna 2, Batna 05000, Algeria
6
Department of Chemistry, College of Science, Imam Mohammad Ibn Saud Islamic University (IMSIU), Riyadh 11623, Saudi Arabia
7
Laboratory for the Management and Development of Natural Resources and Quality Assurance, Faculty of Nature and Life Sciences and Earth Sciences SNVST, University of Bouira, Bouira 10000, Algeria
*
Authors to whom correspondence should be addressed.
Water 2026, 18(7), 831; https://doi.org/10.3390/w18070831
Submission received: 9 December 2025 / Revised: 14 March 2026 / Accepted: 23 March 2026 / Published: 31 March 2026
(This article belongs to the Special Issue Advance in Groundwater in Arid Areas)

Abstract

The Saoura Valley (southwestern Algeria) hosts14 oases that primarily depend on groundwater in an endorheic basin. The hydrogeological system is bisected by the Saoura Wadi into two distinct compartments: an active, interconnected eastern compartment (Mio–Plio–Quaternary alluvial aquifer and terraces of the Great Western Erg) and a passive, fossil western compartment (Guir Hamada and Cambro–Ordovician aquifers). In September 2024, 51 groundwater samples were collected from nine oases. Temperature ranged from 16.2 to 31.4 °C and pH ranged from 7.1 to 7.85. Total dissolved solids (TDS) varied widely (179–4480 mg/L; median of 454 mg/L), with electrical conductivity between 280 and 7000 µS/cm. Three main hydrochemical facies were identified: Ca–Mg–SO4–Cl (30%), Na–Cl–SO4 (55%), and hypersaline types in the terminal inferoflux zone. Nitrate concentrations exceeded the WHO guideline (50 mg/L) in 22% of samples, attributed to localized agricultural and domestic inputs. Geochemical evolution is controlled by evaporite dissolution (gypsum, halite), cation exchange, and evaporative concentration, with a downstream salinity gradient from freshwaters near the Great Western Erg toward hypersaline inferoflux. Comparison with historical data (1941, 1963, and earlier studies) indicates a trend of increasing salinization since the 1990s, associated with intensive borehole pumping and irrigation return flow. These findings suggest risks to the long-term sustainability of the Saoura oases.

1. Introduction

Oases constitute anthropogenic ecosystems in hyper-arid environments, where groundwater availability sustains cultivated areas amidst arid regions [1,2]. In the Algerian Sahara, date palm oases have historically supported human settlement and agriculture due to substantial groundwater reserves, estimated at 31–60 × 1012 m3 in the northern Sahara aquifers alone [3,4]. These systems play a significant socio-economic role by supporting food security, generating income, and limiting rural exodus in arid desert environments [5,6,7,8]. Traditional water harvesting techniques, such as foggaras and shallow wells, combined with established social rules for water sharing, have sustained these oases for centuries [9,10,11].
Since the second half of the 20th century, however, rapid demographic growth and agricultural intensification have initiated a major hydraulic transition. Traditional low-impact structures have been progressively replaced by thousands of deep boreholes and motorized pumps, significantly increasing abstraction rates [12,13]. This shift has led to a regional lowering of water tables, the drying-up of foggaras and traditional wells, and a quantifiable deterioration of groundwater quality, particularly through increasing salinization and nitrate contamination [14,15,16]. In many Saharan oases, overexploitation induces upward migration of saline deep water (up-coning) and the mobilization of ancient evaporitic salts dissolved along flow paths, transforming formerly fresh groundwater lenses into brackish or saline resources within a few decades [17,18,19].
The Saoura Valley (southwest Algeria) illustrates this hydrogeological crisis. Despite early hydrogeological investigations [20,21,22] and more recent studies [15,23,24], the valley has experienced continuous expansion of irrigated perimeters and drilling since the 1990s, with limited updated monitoring of groundwater chemistry over the last decade. The combination of an endorheic setting, evaporite-rich geology, and intense pumping makes the Saoura oases particularly vulnerable to potentially irreversible salinization.
The present study, based on a field campaign conducted in September 2024 (51 sampling points distributed across nine oases), aims to:
Characterize the current hydrochemical status of groundwater in the Saoura Valley and identify dominant geochemical processes;
Establish spatial hydrochemical zonation and facies evolution along flow paths;
Quantify long-term trends (1941–2024) by comparing present results with historical data;
Assess the respective roles of natural (evaporite dissolution, cation exchange, evaporation) and anthropogenic factors (over-pumping, irrigation return flow, fertilizer use) in the observed degradation;
Evaluate the vulnerability of the Saoura oases to salinization and discuss implications for their future sustainability.
By providing an updated and comprehensive hydrochemical dataset for the valley, this work seeks to contribute to the design of necessary groundwater management strategies in a significant oasis system of the Algerian Sahara.

2. Study Area

The Saoura Wadi forms the Saoura Valley, located in southwestern Algeria and constitutinga narrow strip extending from the Abadla depression in the north to the Touat region in the south. This area is bordered by the Great Western Erg dune system and the Ougarta Mountains (Figure 1 and Figure 2). The study area is located approximately between 00°50′ and 02°30′ west longitude and 29°00′ and 30°50′ north latitude.
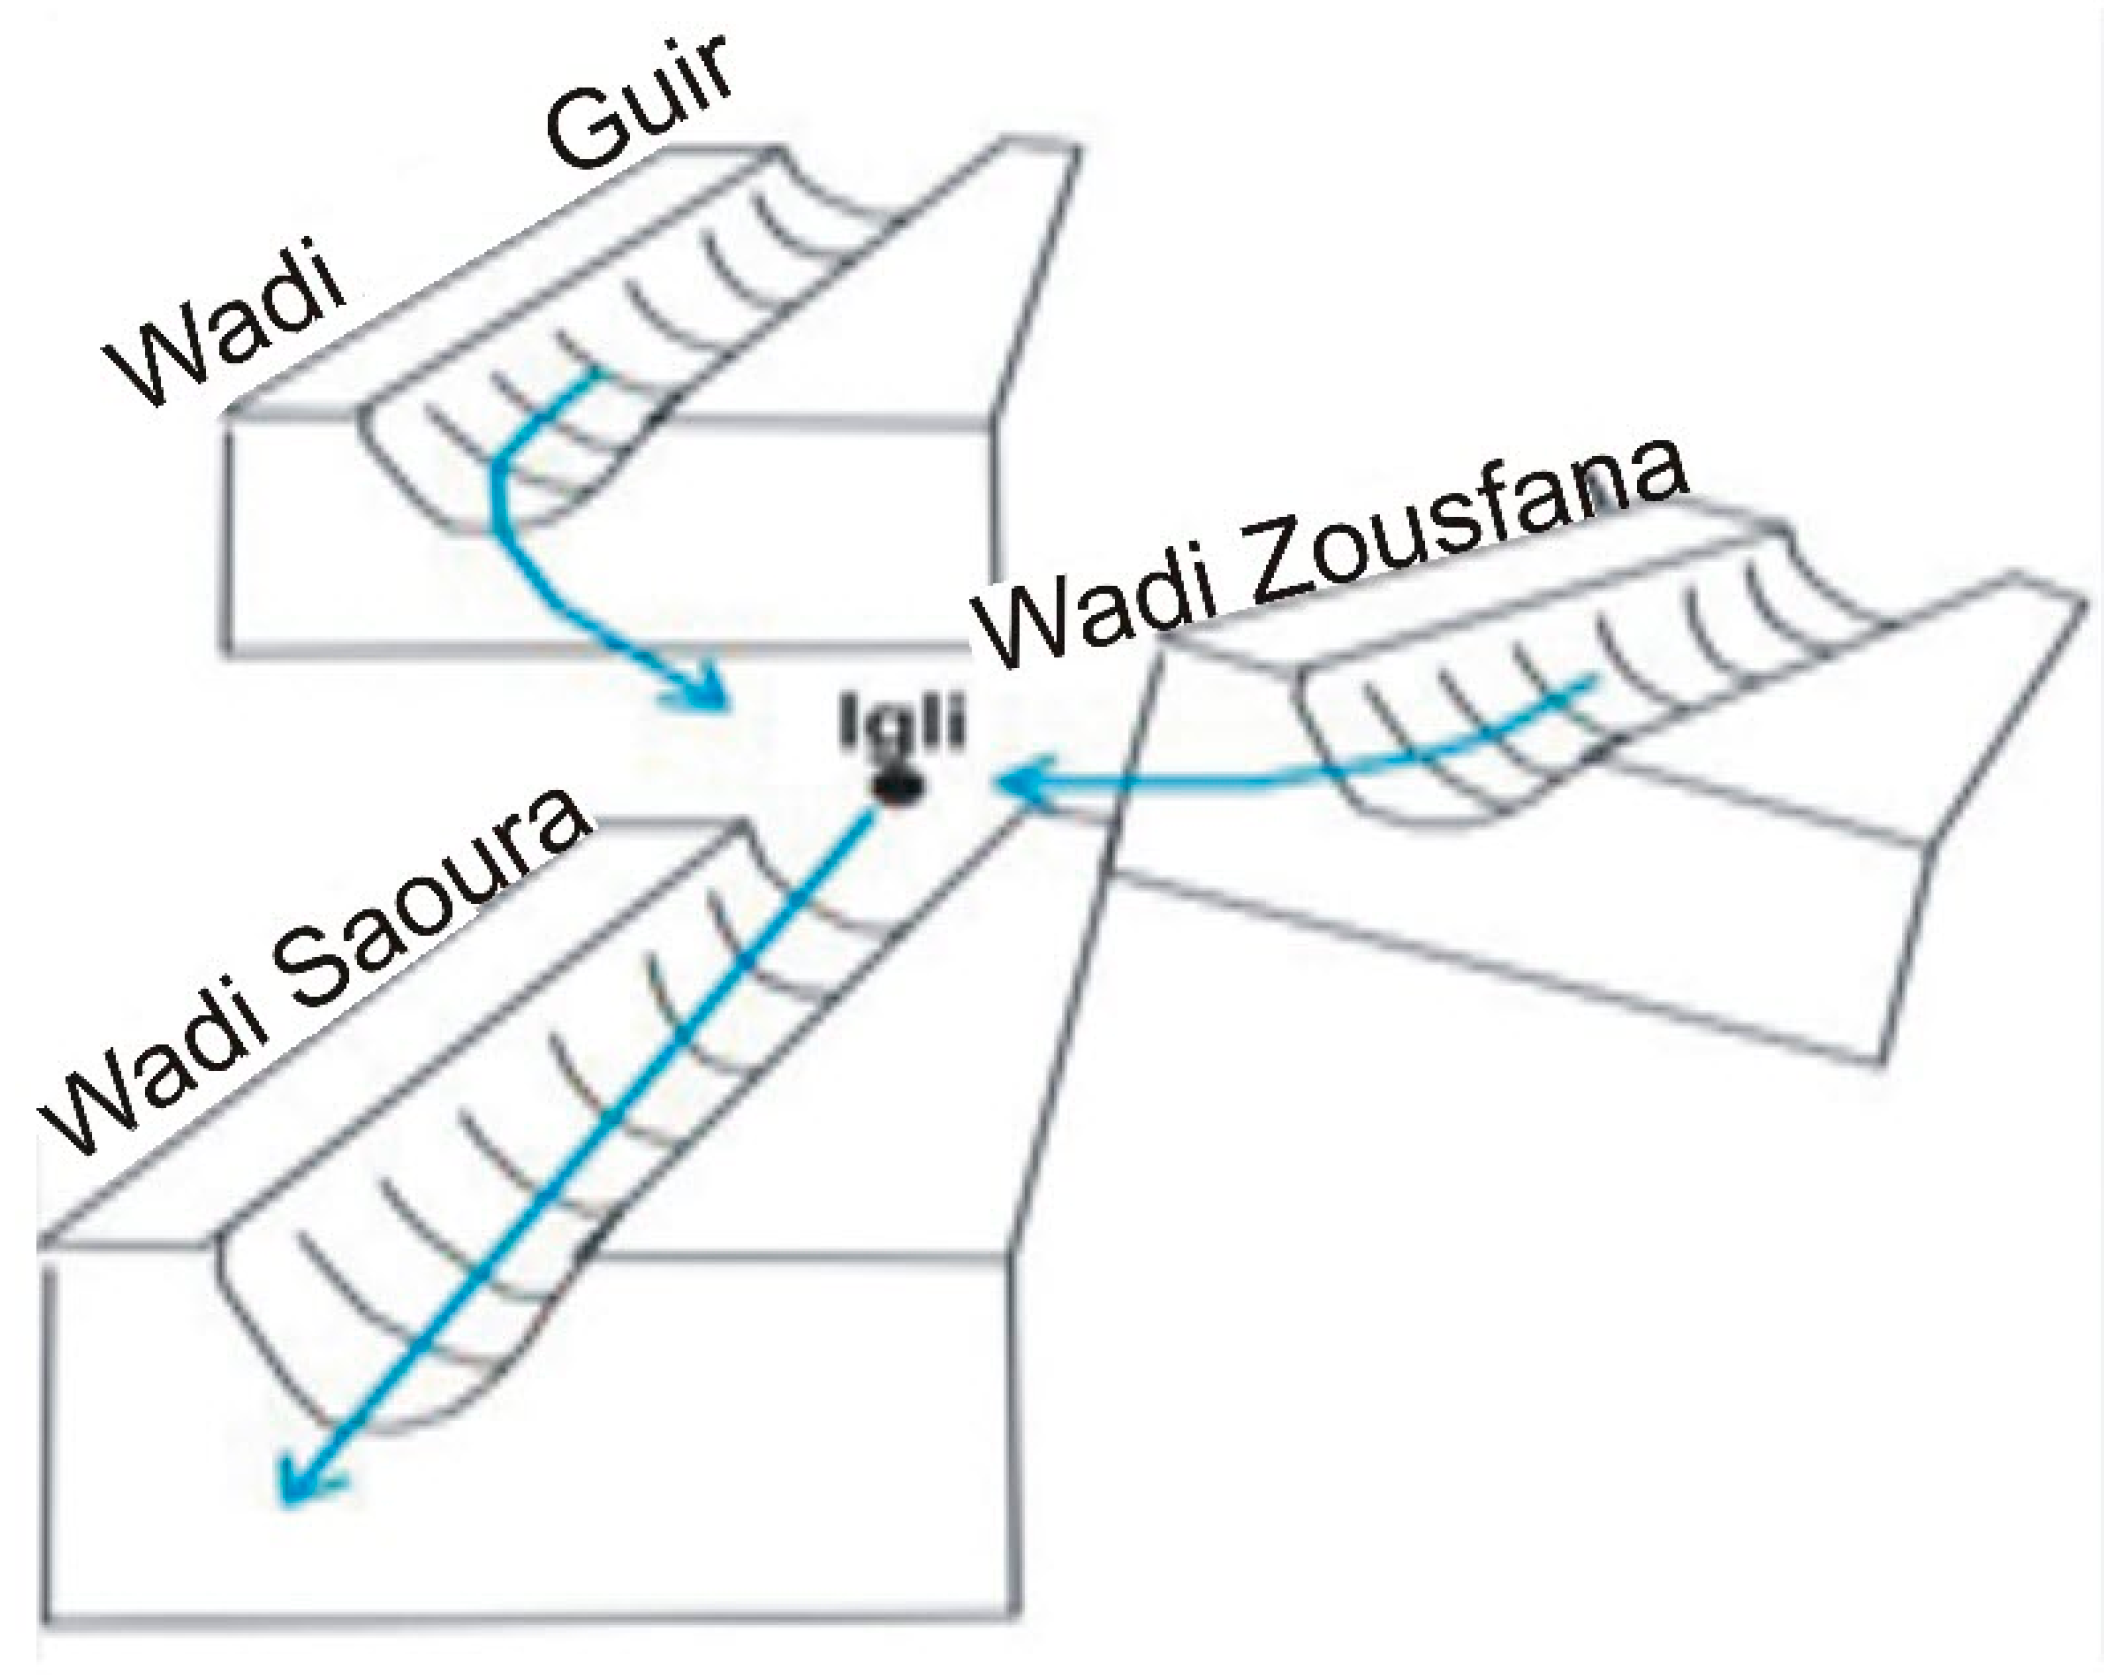
The Saoura Valley contains several oases along its 250 km course. There are 14 main oases stretching linearly from northwest to southeast: Igli, Mazzer, Béni Abbes, Tamtert, el Ouata, Agdal, Guerzim, Beni Yakhlef, Kerzaz, Timoudi, Ouled Khoudeir, Timgharine, Ksabi, and Hassi Abdellah. This ephemeral river originates at the Igli oasis, representing the confluence of the Guir and Zousfana valleys, and terminates in the Sebkhael Mellah to the south, near Kerzaz, forming an endorheic basin. It should be noted that at Foum El Kheneg, near the Hassi Abdellah oasis, the channel bifurcates into two branches: Wadi Souireg, which transports flows from the Saoura to the immense Sebkhael Melah depression, and Wadi Messaoud, which only flows toward the Touat following the overflow of the primary channel.

2.1. Geology of the Saoura Valley

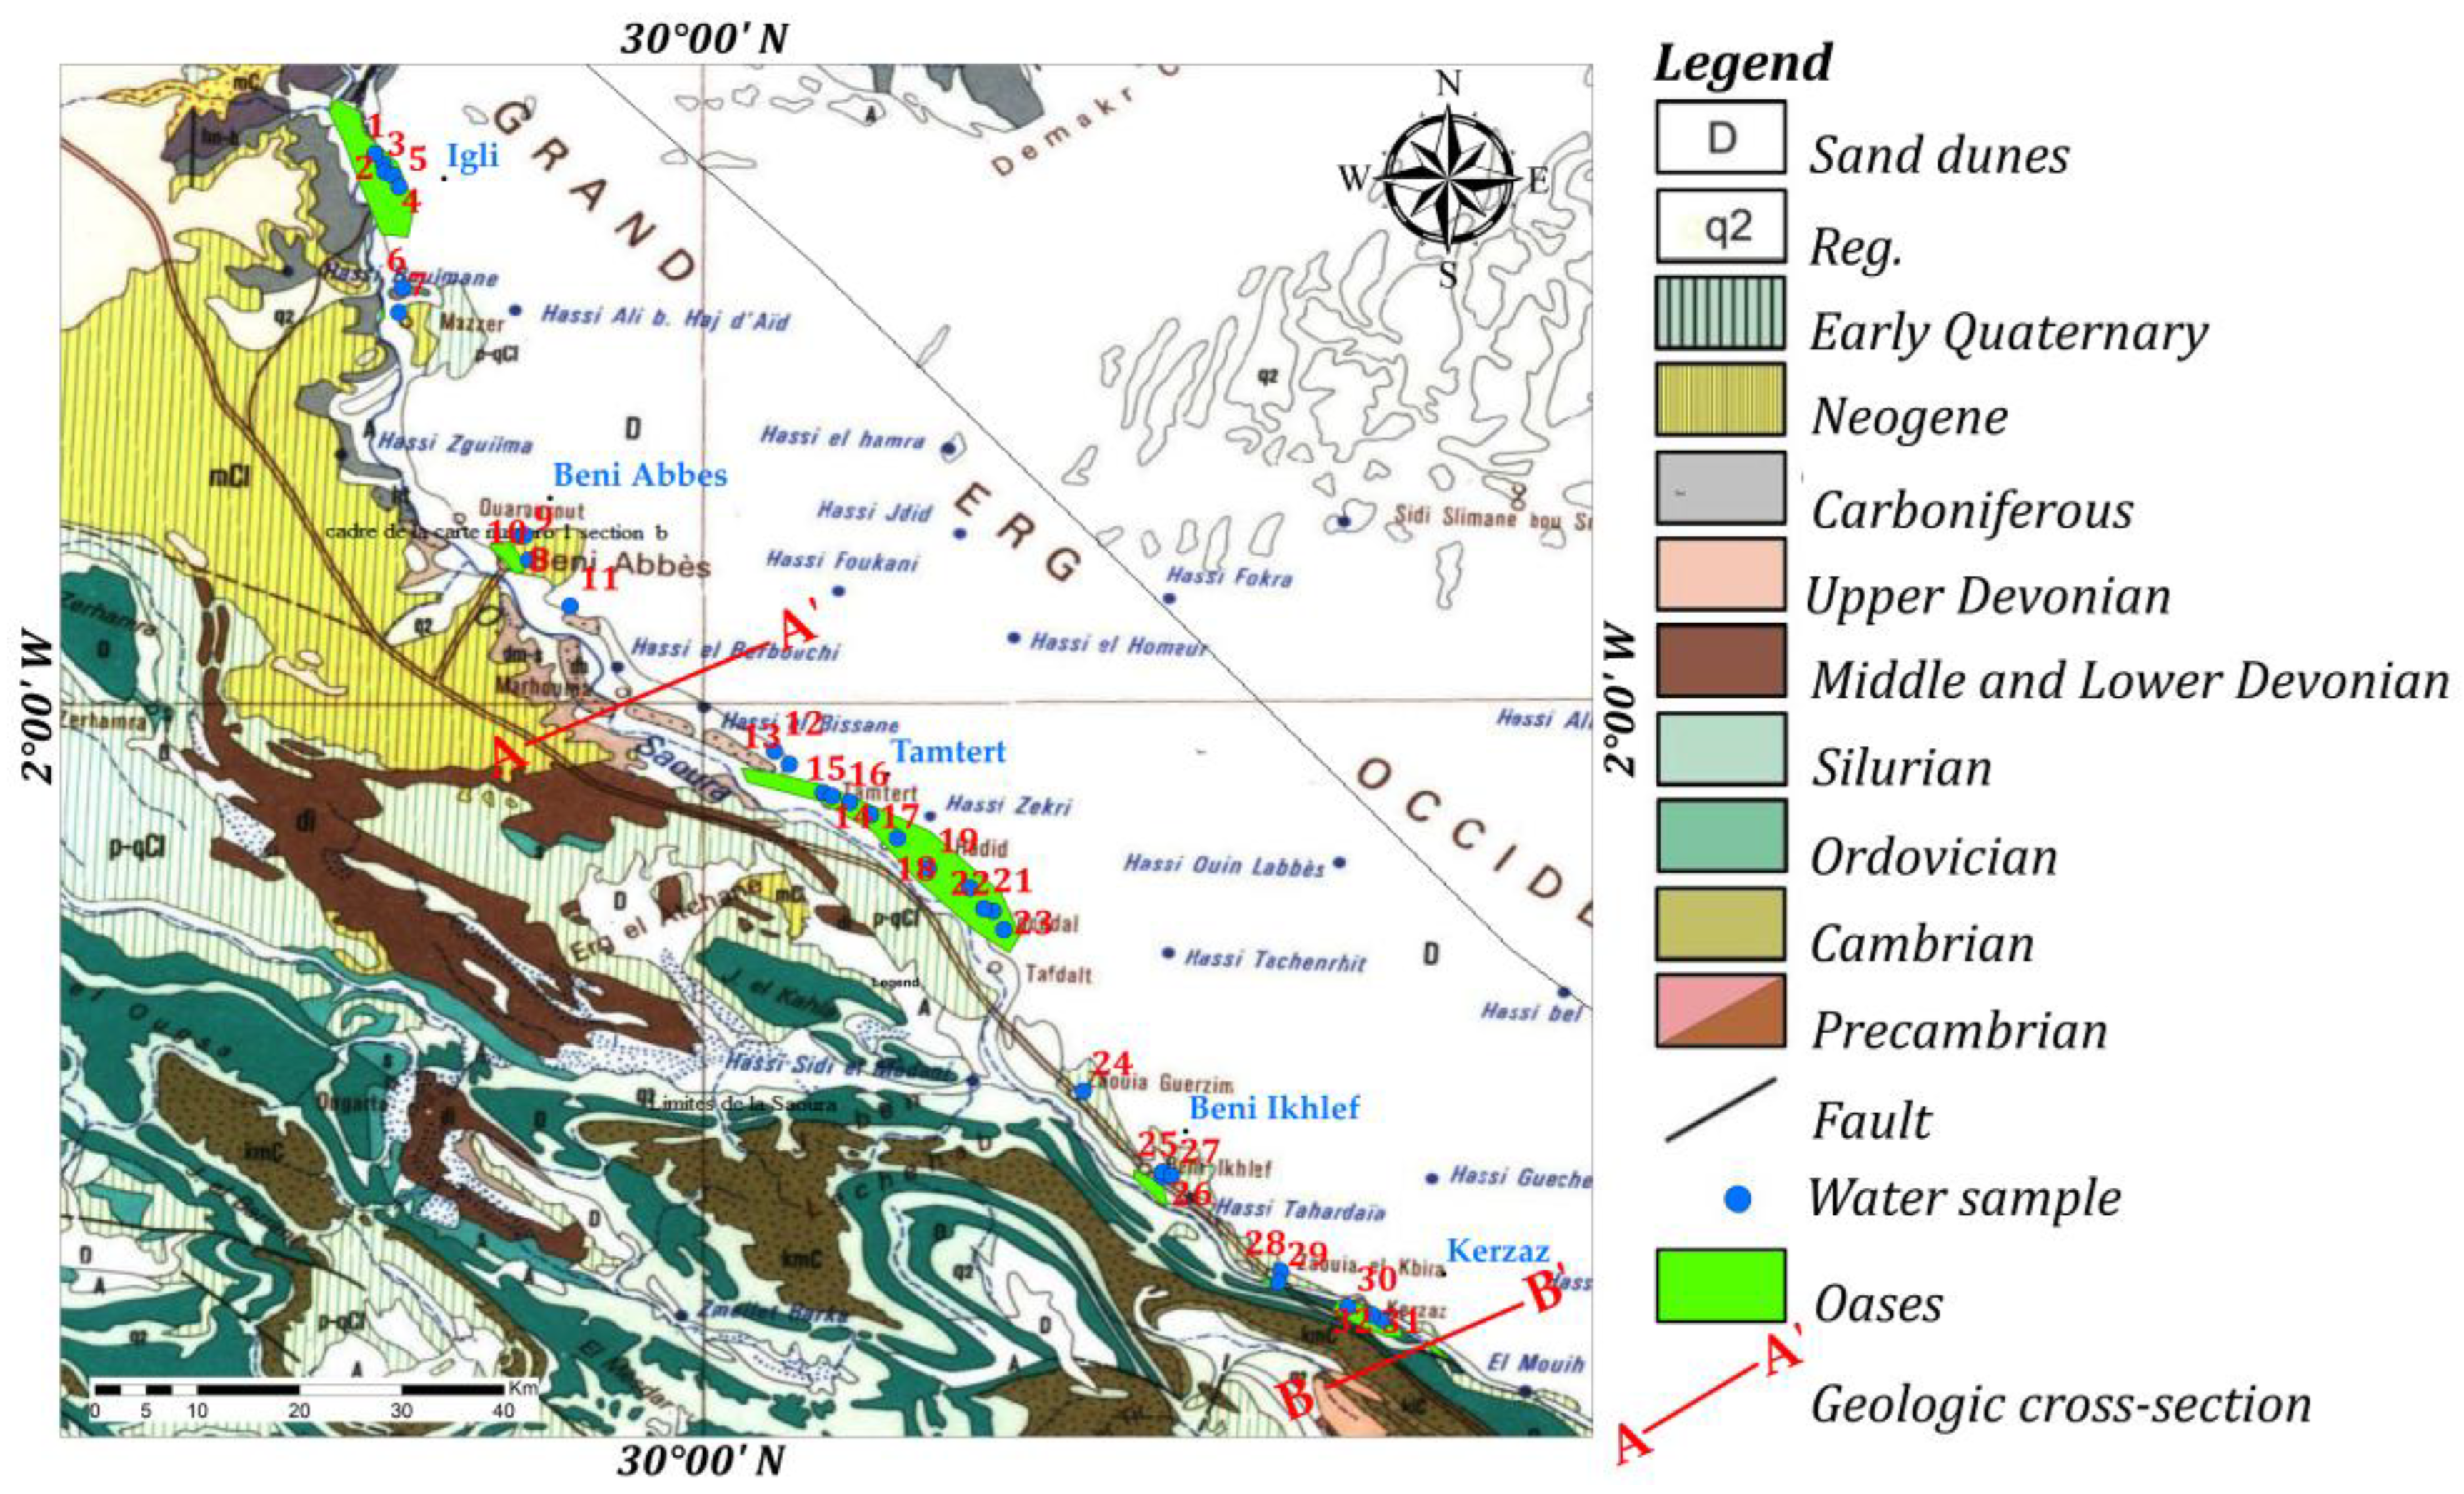
The Saoura Valley is geologically linked to the Ougarta Mountains, which form the outer zones of the Variscan (Hercynian) orogeny [27,28]. The Saoura Valley forms a depression occupied by palm groves, situated between the aeolian deposits of the Great Western Erg to the east and the Hamada of Guir to the west. This Hamada is a broad plateau with an average altitude of 600 m comprising Tertiary sediments. The map below (Figure 3) illustrates the geology of the study area.
At the edges of the Saoura Valley, three main units are distinguished:
  • A Precambrian basement formed by volcanic formations that emerged in the cores of certain anticlinal structures [30,31]. Its largest exposure is within the Sebkhael Melah structure, containing a thick series of turbidites (>3500 m), intercalated with basaltic and andesine flow sand tuffs and intruded by dolerites and monzonites [27].
  • The Paleozoic cover accumulates a thickness of +5000 m. There is evidence of folding into tight anticlines and wide synclines [31,32], with Cambro–Ordovician sandstones and quartzites acting as the primary structural framework [27].
  • The Cretaceous and Tertiary terranes comprise the Kemkem Plateau and the Hamada of Guir. These consist of sandy clays at the base and silicified lacustrine limestones.
  • Quaternary alluvial deposits.

2.2. Saoura Hydrogeological System

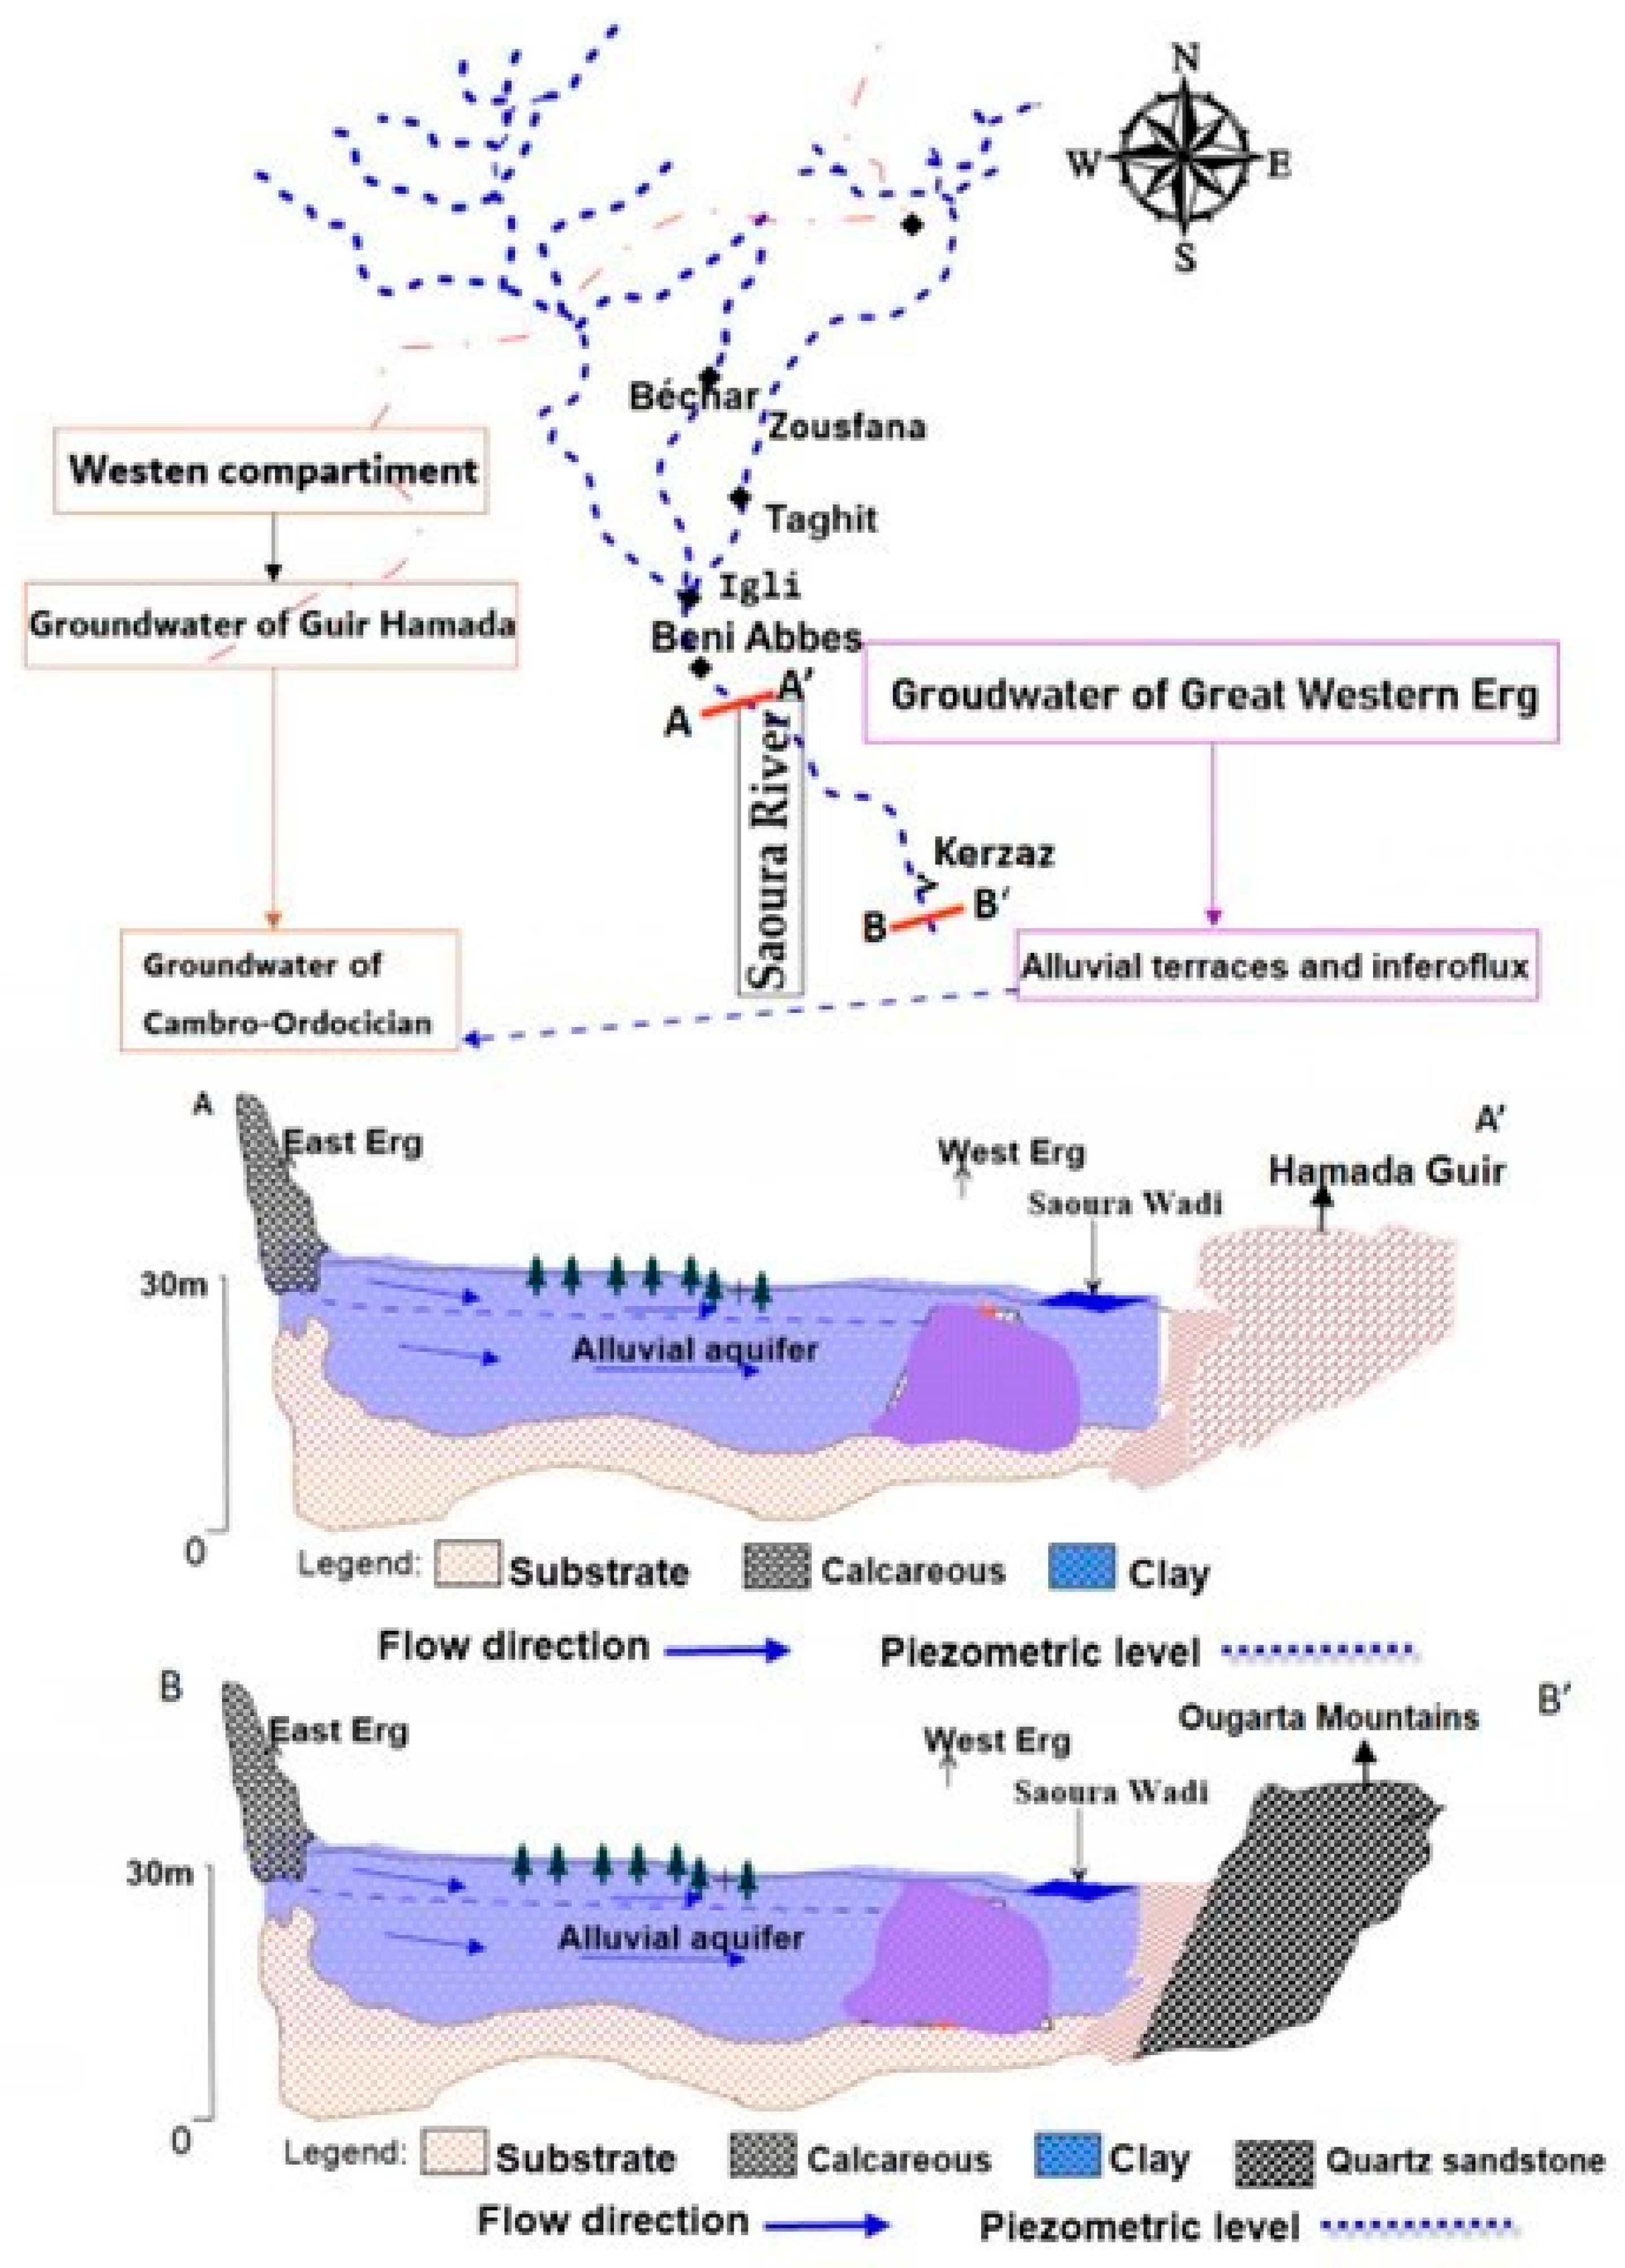
The aquifers of the Saoura comprise a complex hydrogeological system, divided by the Saoura Wadi into two hydrogeological units (Figure 3). The eastern unit compartment encompasses the Mio–Plio–Quaternary groundwater of the Great Western Erg, which constitutes the primary water resource in the upper Saoura Valley. This system consists ofa sandy–alluvial filling with a variable thickness ranging from 30 m to 100 m. This aquifer extends from the Saharan Atlas to the Tadmaït Plateau. Piezometric data indicate flow toward the Saoura Wadi and toward the south; recharge occurs mainly via the northern wadis (Namous Wadi, El Gharbi Wadi, etc.) and through the infiltration of meteoric water through the Great Western Erg sands.
The alluvial aquifer of the Great Western Erg drains naturally toward the Saoura inferoflux. The large spreads of sand and gravel deposits form the stepped alluvial terraces of the Saoura, which store water infiltrated during surface runoff. The Saoura inferoflux serves as the base level of groundwater.
The western unit, located on the right bank of the Saoura, comprises Tertiary lacustrine limestones, extending from Boudenibe (1150 m) to the Ougarta Range (650 m), with a width of 110 km and a length of 200 km, oriented NW-SE. Aquifer recharge is attributed to the humid periods of the Quaternary and is partially maintained by a system of wadis that incise the plateau (Aïcha Wadi, El Abiod Wadi, Alarfedj Wadi). Piezometric gradients suggest a flow consistent with the general inclination of the NW-SE plateau. The Tertiary aquifer communicates locally with the Paleozoic strata.
The Paleozoic formations constitute a multi-layered aquifer system. The Cambro–Ordovician aquifer represents the lower portion of this system, identified near the villages of Zeghamra and Ougarta.

3. Materials and Methods

3.1. Groundwater Sampling and Analytical Procedures

Asampling campaign was carried out in September 2024 across the Saoura region in the Becher area. Initially, 54 water samples were collected (consisting of 8 boreholes and 46 wells and springs) following standard procedures described by [33]. However, upon laboratory analysis and data validation, 3 samples were excluded from the final dataset, as their Charge Balance Error (CBE) exceeded the ±5% threshold. Consequently, the results and interpretations presented in this study are based on the remaining 51 high-quality samples. During fieldwork, a Garmin eTrex GPS (Global Positioning System) was used to record the geographical coordinates of each sampling point, a digital camera was employed to document site conditions, and a cool box was used to preserve the samples during transport to the laboratory of the National Agency for Hydraulic Resources (ANRH) in Bechar. In situ physico-chemical parameters, including temperature, pH, and electrical conductivity were measured at each site using a HACH HQ40d multi-parameter probe(Hach Company, Loveland, CO, USA), which was calibrated daily using standard buffer solutions (pH 4.0, 7.0, and 10.0) and a 1413 µS/cm conductivity standard. Topographical maps (1:200,000 scale; Béni Abbès and Kerzaz sheets) facilitated field orientation and site mapping. Laboratory chemical analyses of the major ions were performed following standard analytical procedures [34]. Calcium and magnesium concentrations were determined using EDTA complexometric titration. Chloride was measured via the Mohr method, sulfate by conductimetric titration, and sodium and potassium were measured using flame photometry. The potentiometric method (Consort 861) for HCO3 nitrates were quantified by potentiometry (HI 121) using a dedicated ion-selective electrode. To ensure analytical rigor and reproducibility, a comprehensive QA/QC protocol was implemented. All instruments were calibrated using multi-point analytical-grade standards, with correlation coefficients (R2) exceeding 0.995. For every batch of 10 samples, one procedural blank (using deionized water) and one duplicate sample were analyzed to monitor for contamination and assess analytical precision. The relative percent difference (RPD) for duplicate analyses was maintained within ±5%. While certified reference materials (CRMs) were not available, the accuracy was cross-verified using internal laboratory standards of known concentration. These internal standards were prepared at the ANRH laboratory using high-purity analytical-grade salts (Merck™, Darmstadt, Germany and Sigma-Aldrich™, St. Louis, MO, USA). Multi-ion solutions were prepared gravimetrically using a high-precision balance (±0.0001 g) and calibrated glassware. The accuracy of the analytical methods was confirmed by the recovery rates of these standards, which consistently ranged between 97.5% and 102.5% for all major ions. Furthermore, the reliability of the dataset was validated by the Ion Charge Balance Error (IBE), which remained within the acceptable limit of ±5% for all samples. The analytical results, expressed in milligrams per liter (mg/L), are summarized in Table 1 and were analyzed to evaluate the hydrochemical characteristics of the Saoura Valley groundwater and its suitability for irrigation and domestic uses.
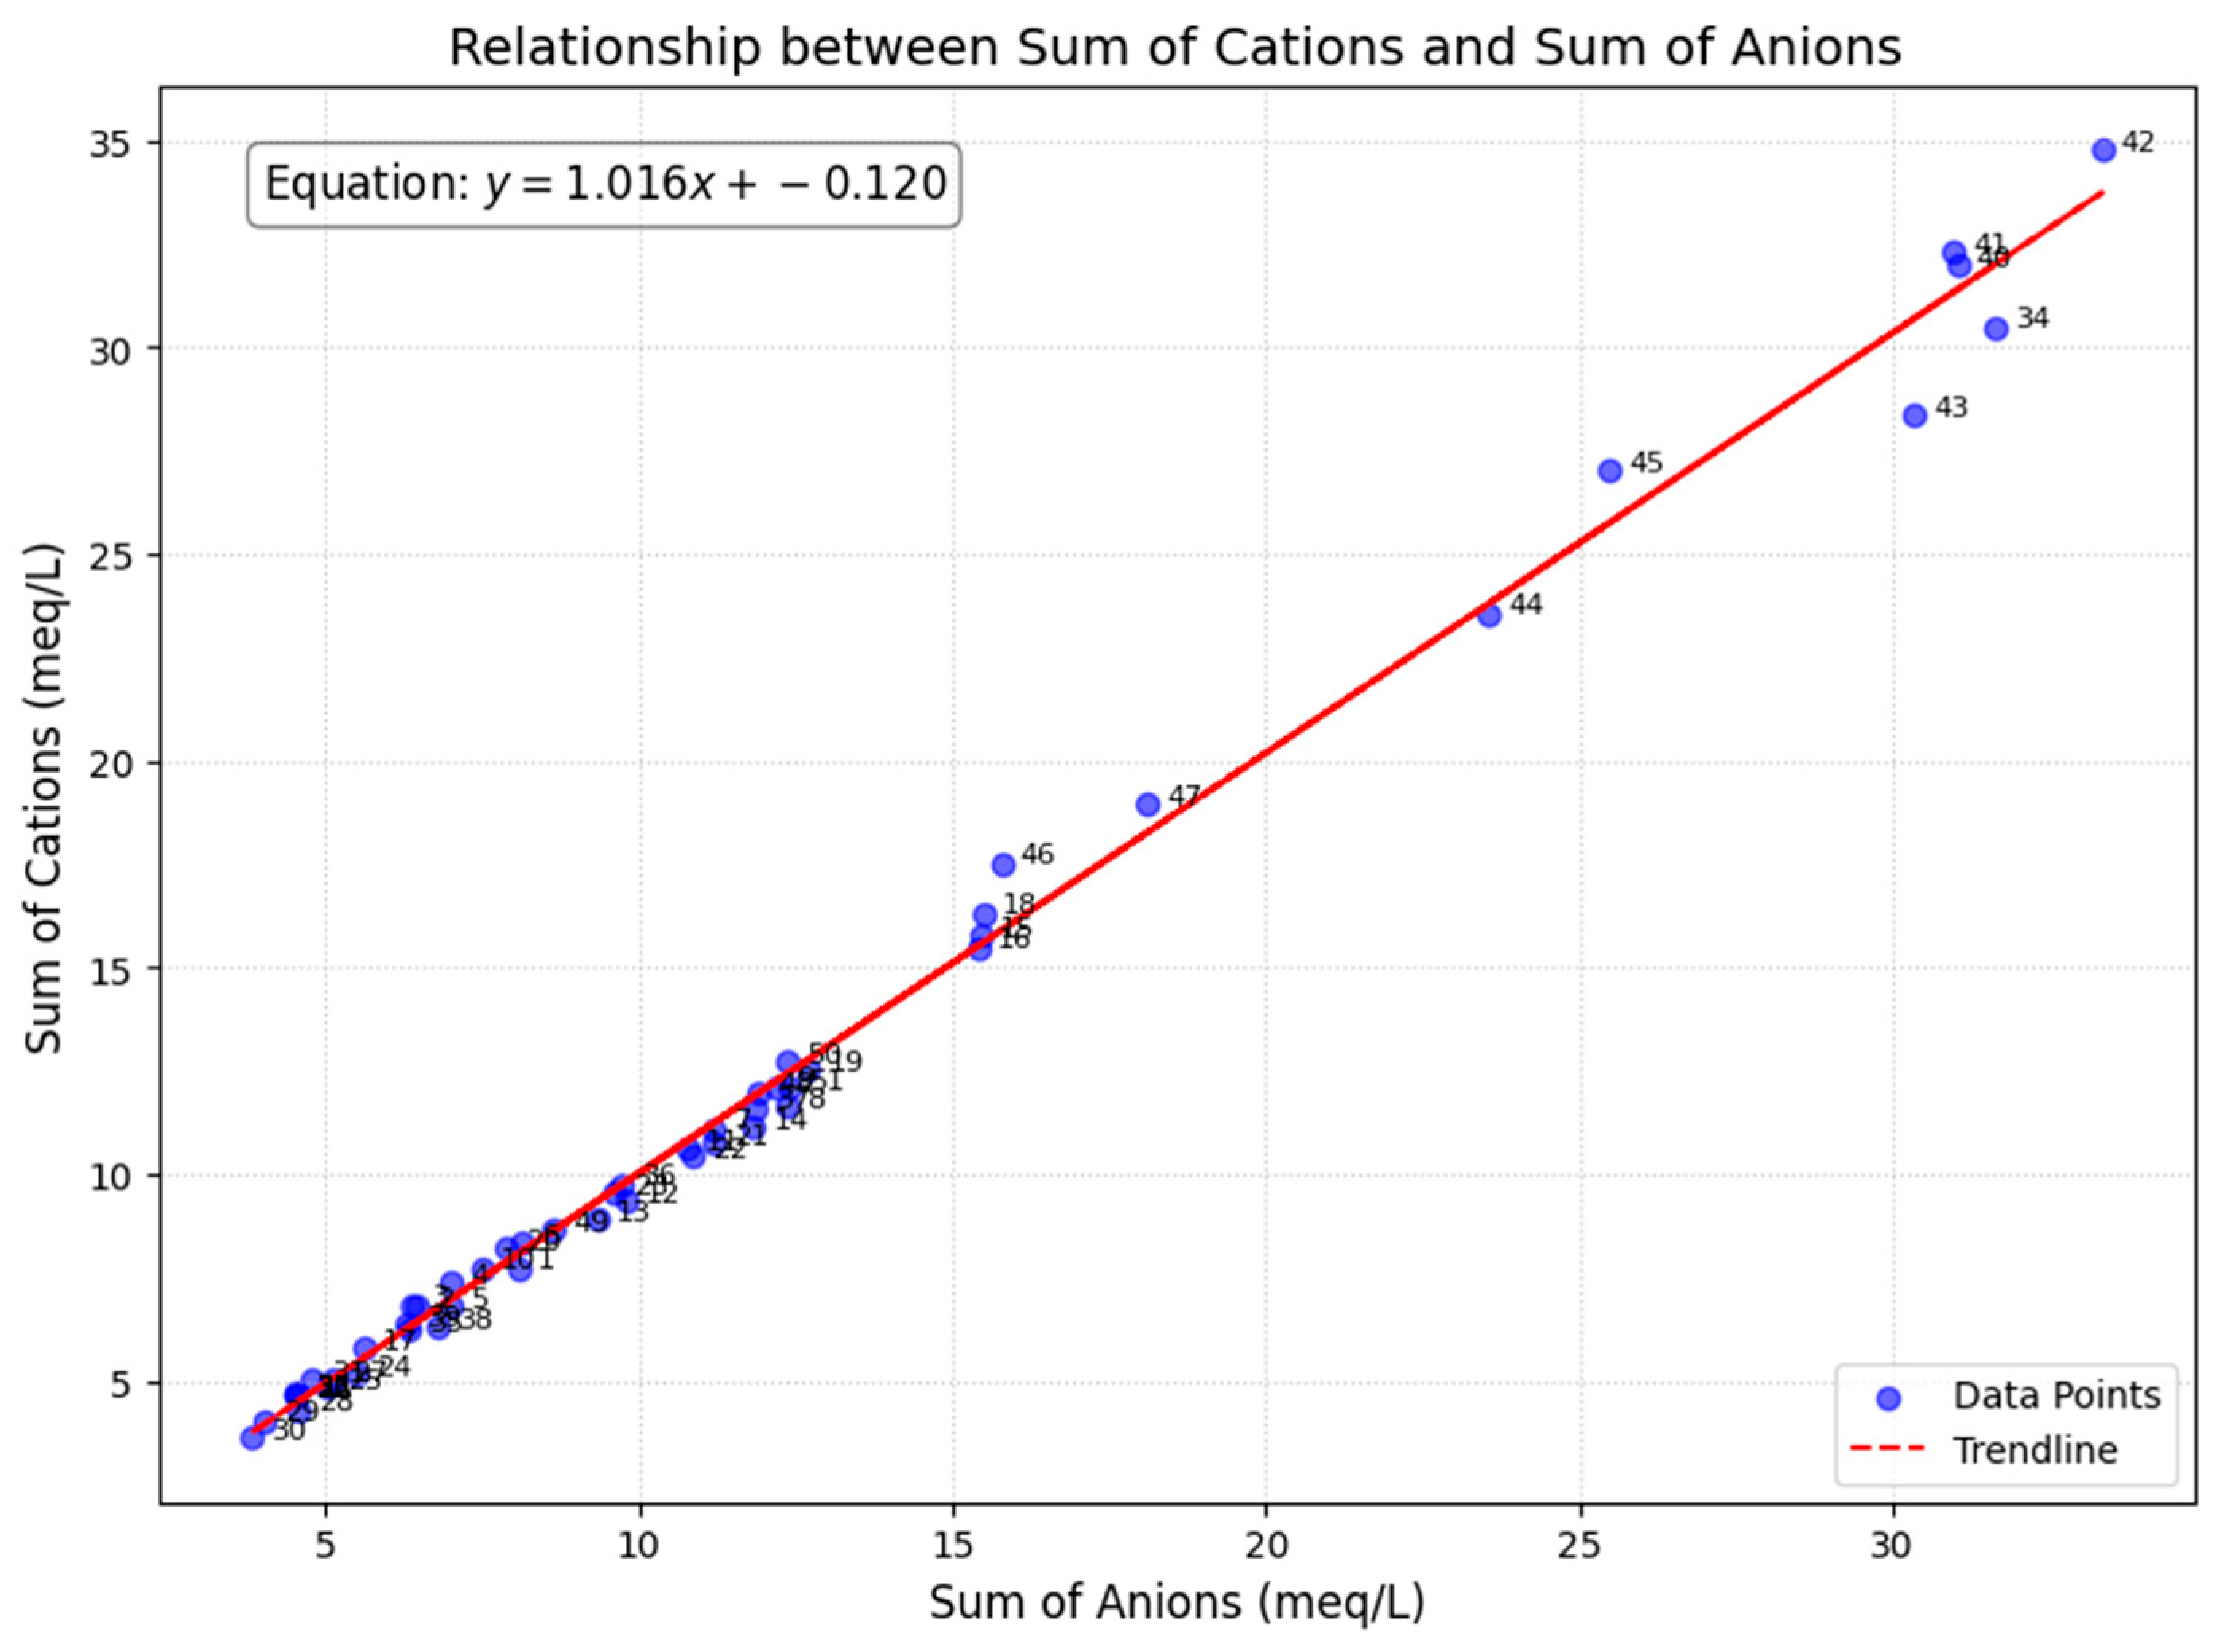
Quality, reliability, and ionic balance represent three key criteria in hydrochemical studies for the interpretation and evaluation of surface and groundwater chemistry [35]. Ionic balance testing is commonly used to assess the internal consistency of chemical analyses by comparing the sum of measured cations with the sum of measured anions expressed in milliequivalents per liter meq/L [36]. When ionic equilibrium is achieved, the analytical results are considered internally consistent; however, it is recognized that ionic balance does not, by itself, guarantee absolute analytical accuracy, as compensating errors in cation and anion measurements may occur. Therefore, ionic balance assessment constitutes a fundamental preliminary step in hydrochemical data validation. In this study, Charge Balance Error (CBE) was calculated for all water samples (Table 1). The majority of samples fall within acceptable limits (±5%), supporting the overall suitability of the data for further interpretation. Although the cation–anion correlation (Figure 4) exhibits a non-zero intercept, suggesting a minor systematic analytical bias, the acceptable CBE values indicate that this offset does not significantly preclude the identification of the hydrochemical processes [37]:
C B E   ( % ) = Σ c a t i o n s Σ a n i o n s Σ c a t i o n s + Σ a n i o n s × 100
The analytical quality of the 51 chemical analyses was verified by the ion balance. All samples fell within the internationally accepted limit of ±5% [34], with errors ranging from −4.82% to +4.91% and a mean absolute error of ±2.35% (Figure 4). This distribution confirms excellent analytical accuracy and high reliability of the hydrochemical dataset (Figure 4).
Hydrochemical facies were classified using DIAGRAMMES software, while Microsoft Excel was used for data organization and calculations. Origin for was employed for graphical plotting, and CorelDRAW for figure preparation. The obtained results are summarized in Table 1. These data facilitated evaluation of the hydrochemical characteristics and suitability of Saoura Valley groundwater for various uses.
A non-exhaustive inventory of water points within the Saoura oases was compiled (Table 1), incorporating previous hydrogeological and hydrochemical studies [38,39,40]. The survey included all existing water points (wells, springs, boreholes, and foggaras) (Table 1). It should be noted that this inventory is not exhaustive.

3.2. Multivariate Statistical Analysis

Multivariate statistical analysis provides a quantitative and independent method for classifying groundwater samples [41]. This approach identifies relationships between hydrochemical variables and groundwater samples, as previously demonstrated [42].
To interpret the factors governing to the chemical composition of the groundwater samples, principal component analysis (PCA) and hierarchical cluster analysis (HCA) were applied using the R programming language V4.5.2 [43]. IBM SPSS Statistics V26 facilitated the PCA.

4. Results and Discussion

4.1. Hydrochemical Characterization and Facies Type of Groundwater in the Saoura Valley

The hydrochemical analysis results are summarized in Table 1. A total of 51 groundwater samples were collected from nine oases (Igli, BéniAbbès, el Ouata, Tamtert, BéniYakhlef, Timoudi, Kerzaz, Ouled Khoudeir, and Ksabi), including 8 deep boreholes tapping the regional aquifer system and 46 wells and springs exploiting shallow alluvial and carbonate aquifers. This sampling strategy was designed to capture both vertical and lateral hydrochemical variability across the hydrogeological units of the study area.
The groundwater samples display a wide range of salinity and ionic composition, reflecting variable degrees of water–rock interaction, groundwater residence time, and evaporative concentration under hyper-arid climatic conditions. Groundwater temperatures range from 16.2 to 31.4 °C (mean 24.1 °C), consistent with deep circulation and shallow groundwater exposure in arid environments. The groundwater samples exhibit slightly alkaline pH values (7.4–7.8, mean 7.6). While this range is common in many sedimentary aquifers, it is consistent with the chemical signature of the study area, where the dominance of Ca2+, Mg2+, and HCO3 suggests mineralization influenced by the weathering of limestone and dolomitic formations [44].
Electrical conductivity (EC) varied from 400 to 3300 µS/cm (mean 1198 µS/cm), while total dissolved solids (TDS) ranged between 280 and 2150 mg/L (mean 775.41 mg/L). Most samples (78%) were classified as freshwater (TDS < 1000 mg/L), while 11 samples were in the brackish range, and 1 sample from Timoudi (obs30) was saline, reflecting longer flow paths and evaporite interaction.
Major cation chemistry was dominated by Na+ (28.9–391.2 mg/L, mean 124.93 mg/L) in the majority of samples, followed by Ca2+ (34–257 mg/L, mean 83.92 mg/L) and Mg2+ (5–111 mg/L, mean 29.53 mg/L). Among anions, SO42− predominates (28–925 mg/L, mean 241.14 mg/L), followed by Cl (33–620 mg/L, mean 181.41 mg/L) and HCO3 (37–214 mg/L, mean 119.80 mg/L). These results highlight the influence of gypsum, anhydrite, and halite dissolution within sulfate- and evaporite-bearing formations of the region.
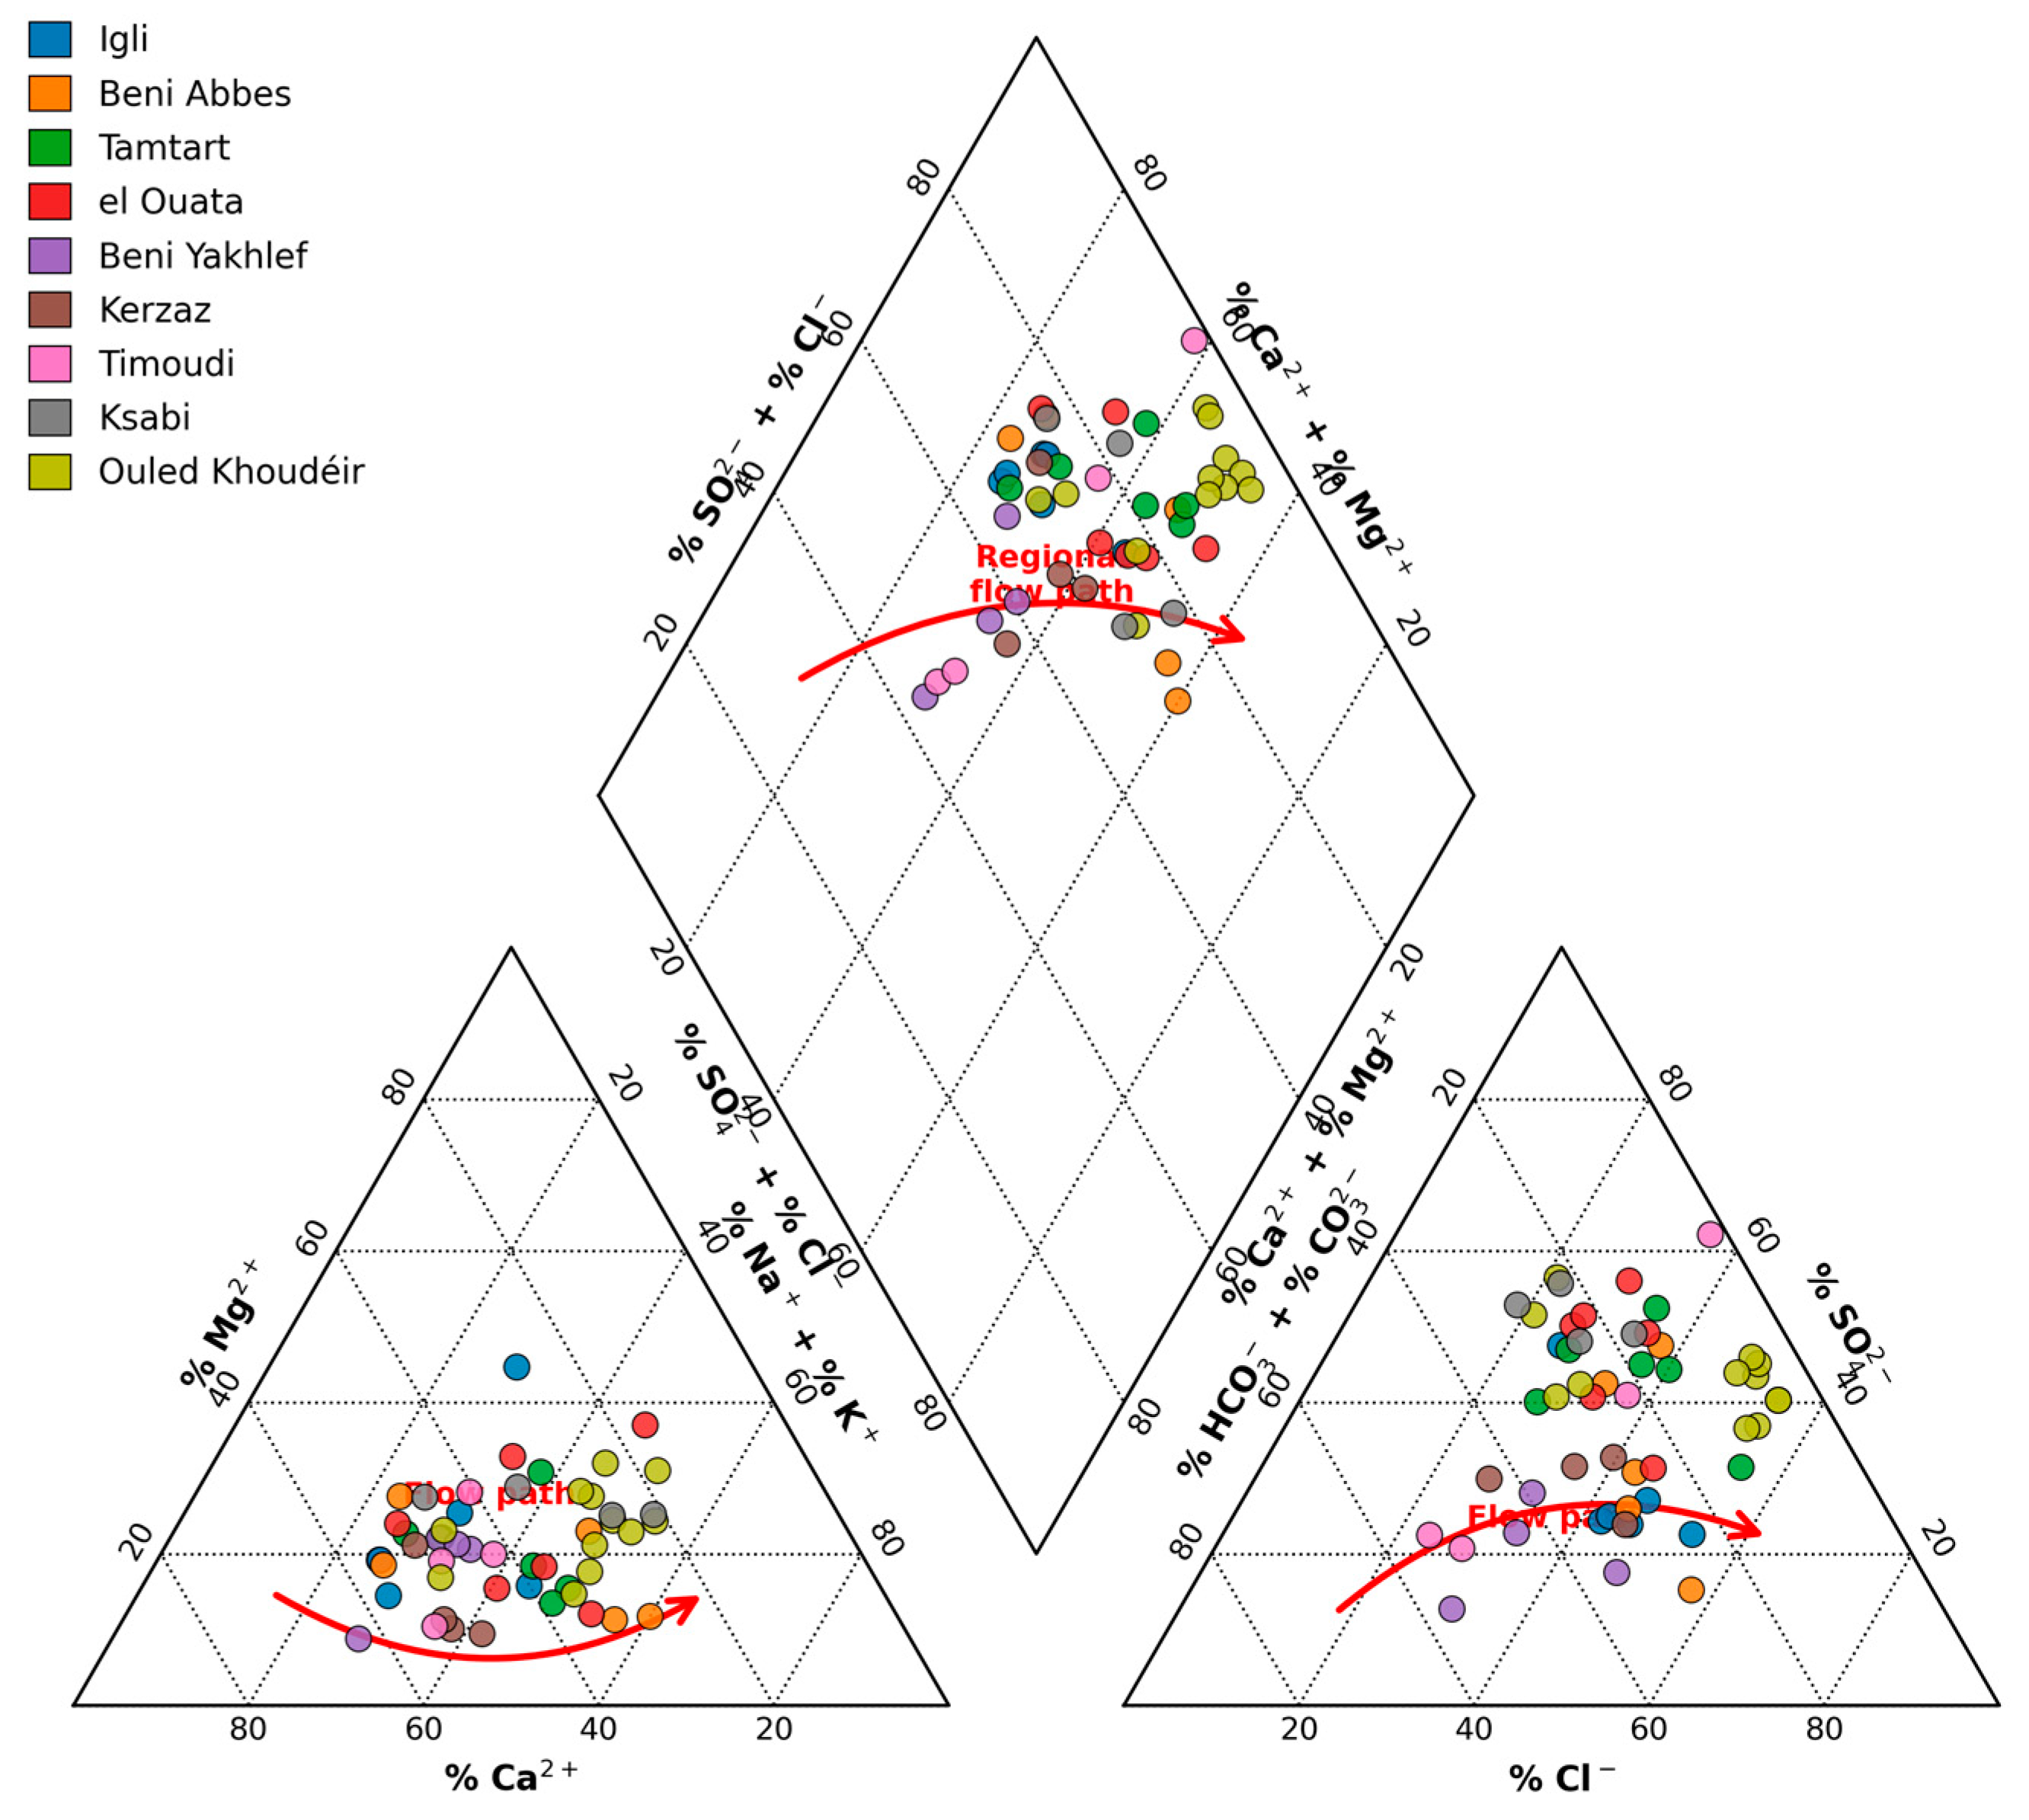
The Piper trilinear diagram (Figure 5) identifies three dominant hydrochemical facies:
  • Na-Cl-SO4 (55% of samples): This facies is in el Ouata, Tamtart, Ouled Khoudéir, and Timoudi (obs34), characterized by high concentrations of Na+, Cl, and SO42−. These samples plot near the Na+ and Cl + SO42− apices, indicating halite and gypsum dissolution accompanied by evaporative enrichment [45].
  • Ca-Mg-SO4 (30%): This type is in Beni Abbès, Ksabi, and Igli, with elevated Ca2+, Mg2+, and SO42−. These data point toward the Ca2+ + Mg2+ and SO42− vertices. The elevated sulfate levels (reaching 380 mg/L in Tamtart and 310 mg/L in Ksabi) indicate the dissolution of gypsum/anhydrite dissolution within sulfate-bearing formations [46].
  • Ca-Mg-HCO3 (15%): This facies is in Beni Yakhlef and Kerzaz, characterized by low TDS and a relative dominance of Ca2+ and HCO3. These samples are situated in the Ca2+-HCO3. Situated in the left-central field of the diamond, these waters reflect more recent recharge within carbonate aquifers [47].
Overall, the distribution of hydrochemical facies reflects a general geochemical evolution along the regional groundwater flow path, from upstream oases (Igli and Beni Abbès) toward downstream areas (Timoudi, Ouled Khoudéir, and Ksabi). Groundwater chemistry evolves from Ca–Mg–SO4 to Na–Cl–SO4 types due to increasing residence time, evaporite dissolution, evaporative concentration, and cation exchange processes. The occurrence of Ca–HCO3 waters in Beni Yakhlef and Kerzaz, despite their intermediate position, indicates localized recharge through carbonate formations or wadi infiltration, locally modifying the regional flow system [48].
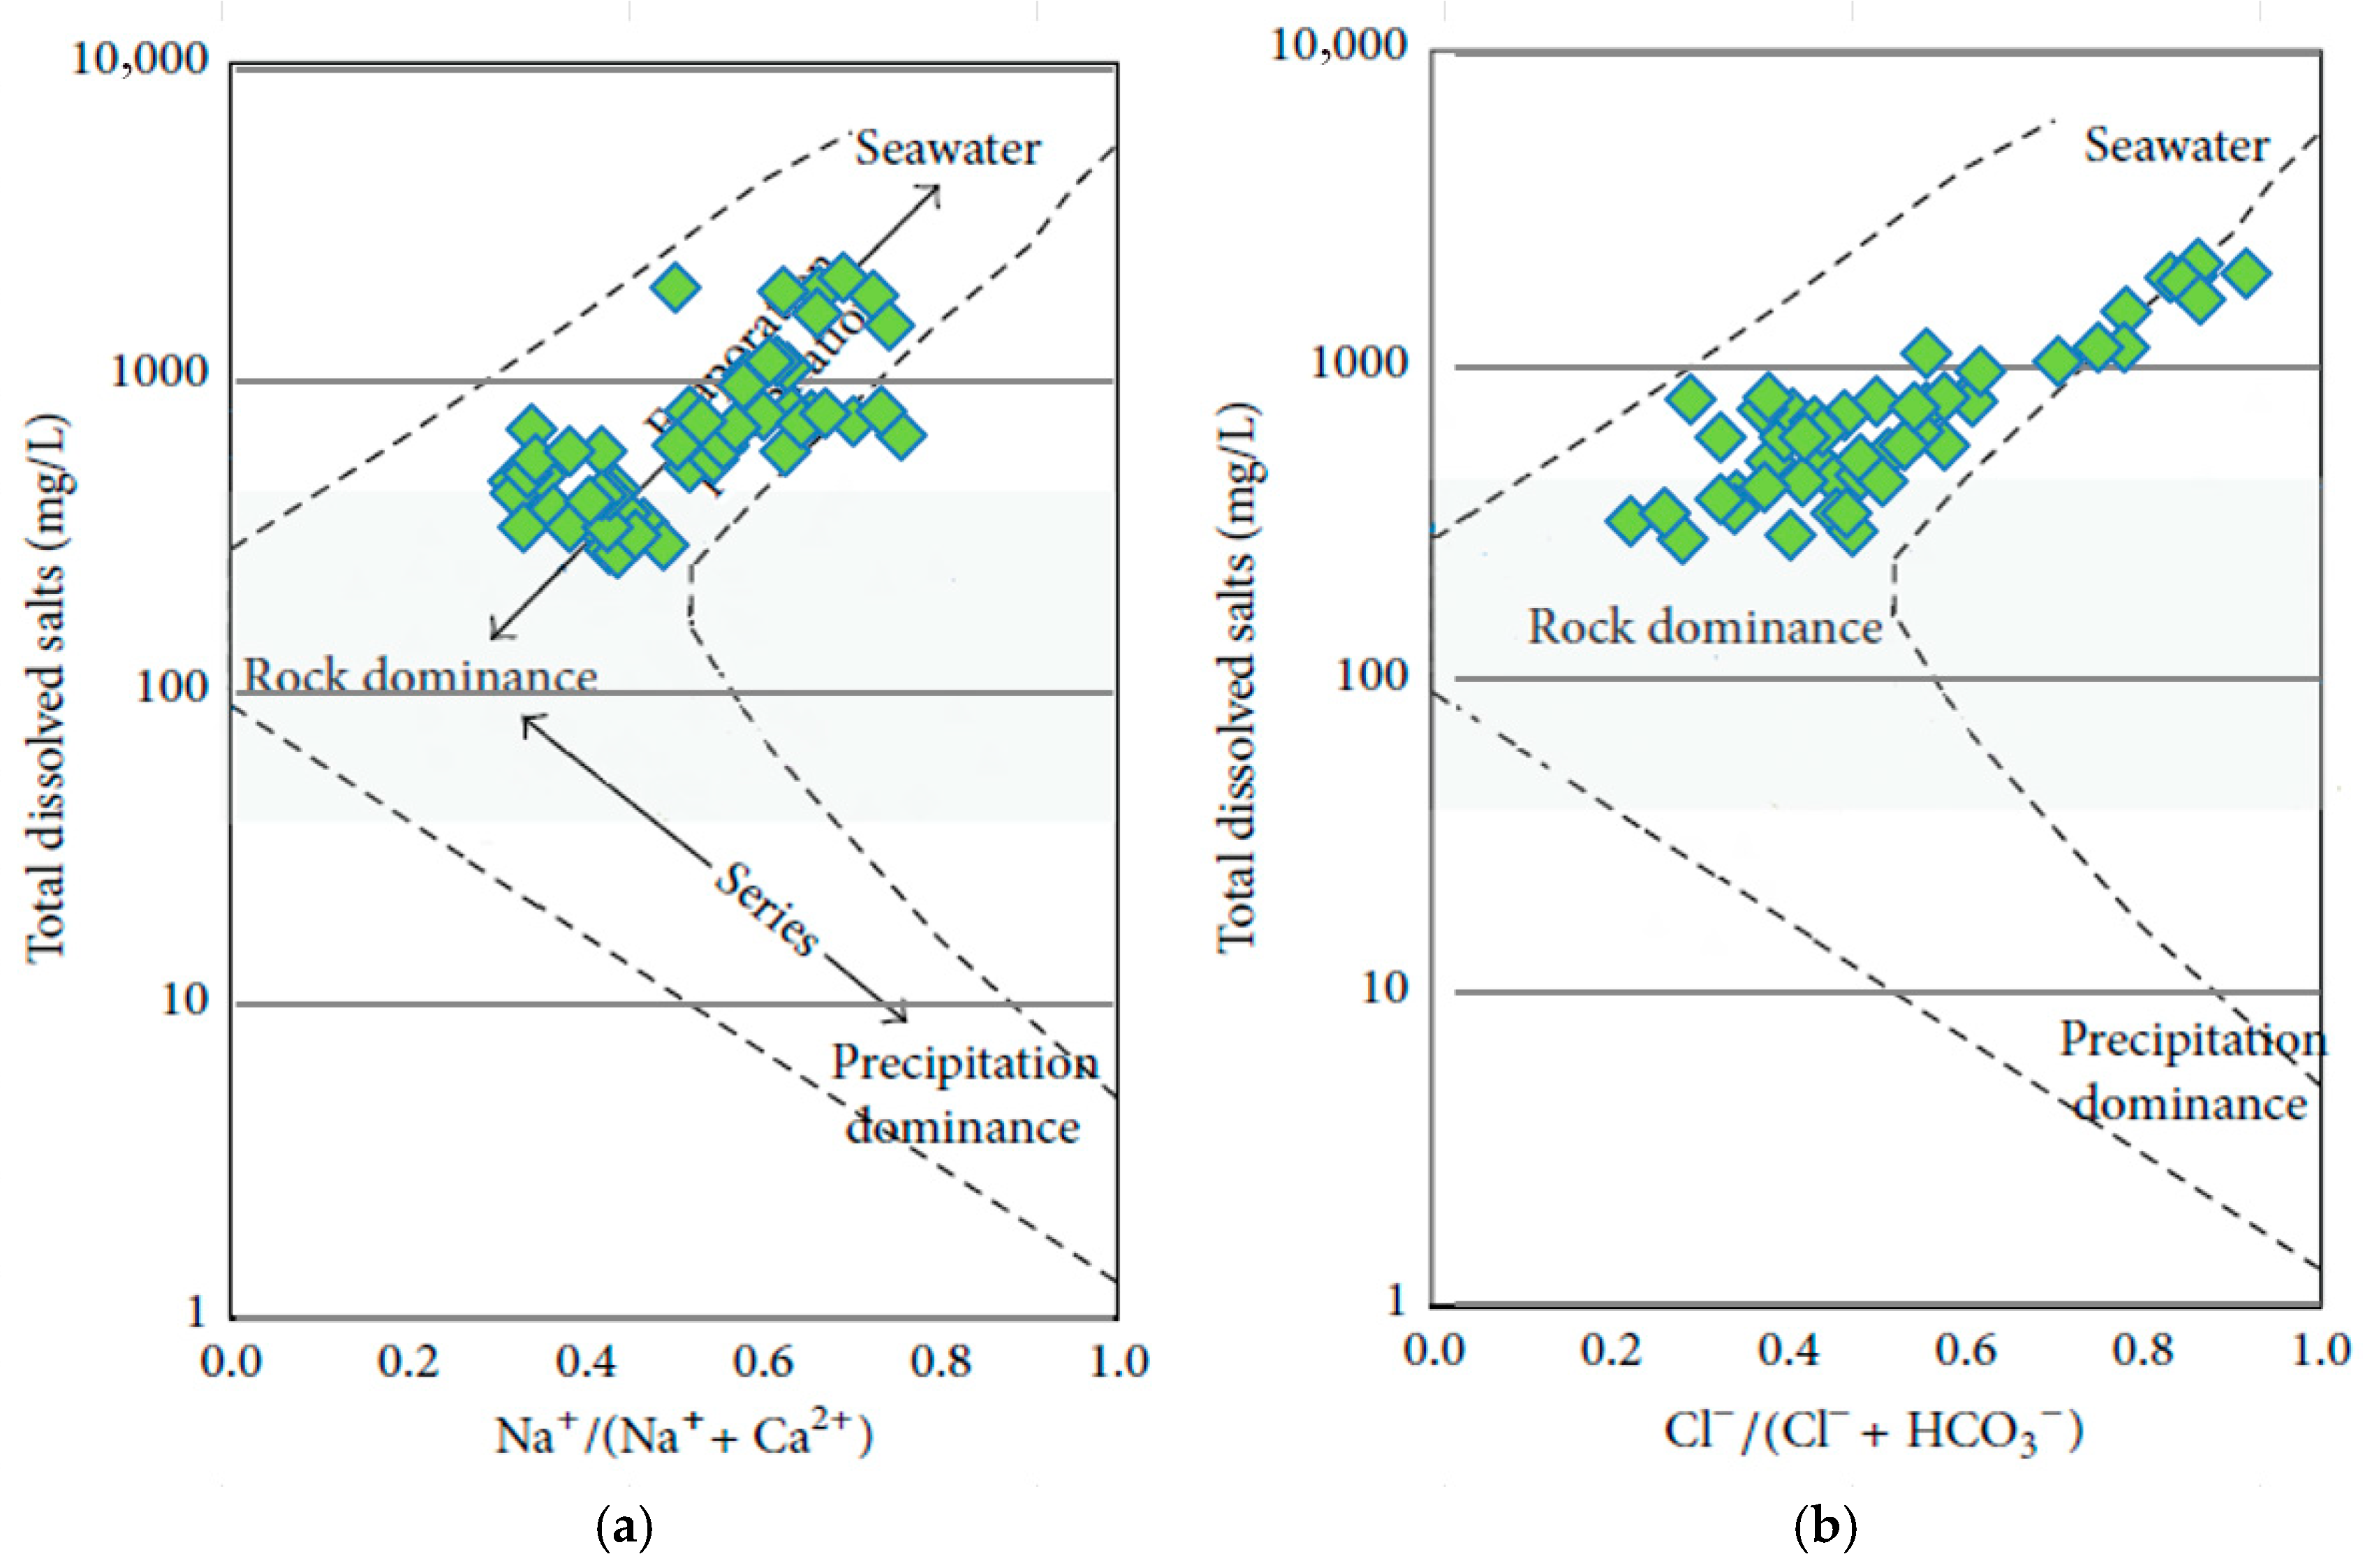
The Gibbs diagrams (Figure 6) identify the controlling mechanisms:
TDS vs. Na+/(Na+ + Ca2+): Most samples plot within the rock dominance domain, indicating water–rock interaction as the primary salinity source. However, high-salinity samples from Timoudi (obs34) and Ouled Khoudéir (obs40–45) shift toward the evaporation dominance zone, showing that evaporative concentration intensifies salinity in downstream areas [49].
TDS vs. Cl/(Cl + HCO3): Samples are distributed along the rock dominance trend, though high-salinity points exhibit higher Cl ratios (>0.8), consistent with halite dissolution and evaporation–crystallization processes in saline end-members [50].
Ion ratios support these interpretations: a Na+/Cl ratio > 1 in 55% of samples (notably in Kerzaz and Beni Yakhlef) suggests silicate weathering or cation exchange [51]; a Ca2+/SO42− ratio ≈ 1 in sulfate-rich waters is consistent with gypsum equilibrium [52]; and (Ca2+ + Mg2+)/(SO42− + HCO3) ≈ 1 indicates a charge balance dominated by carbonate and sulfate mineral dissolution [53].
In summary, the groundwater chemistry reflects a continuum from dilute recharge waters (Ca-HCO3) in upland oases (Beni Yakhlef, Kerzaz) to saline Na-Cl-SO4 waters in lowland discharge zones (Ouled Khoudéir, Timoudi), This evolution is controlled primarily by evaporite dissolution, cation exchange, and evaporative concentration, supplemented by minor anthropogenic nitrate inputs in agricultural areas [54].
The observed hydrochemical facies distribution is closely controlled by the hydrogeological compartmentalization of the Saoura Valley. In the eastern active compartment, groundwater circulating within the Mio–Plio–Quaternary sandy–alluvial aquifer of the Great Western Erg exhibits a progressive chemical evolution along the regional flow path toward the Saoura wadi and southern discharge zones. Recharge occurring through wadi infiltration and diffuse percolation of meteoric waters produces low-mineralized Ca–Mg-HCO3 facies in upstream oases, such as Beni Yakhlef and Kerzaz. As confirmed by their lower TDS and Na/Cl molar ratios near 1.0, these waters reflect relatively reflecting limited water–rock interaction within carbonate-bearing formations.
Down-gradient, increasing residence time, interactions with evaporitic sediments, and ion-exchange processes within sandy and alluvial deposits lead to the development of Ca–Mg–SO4 facies, particularly in intermediate oases such as Igli, Beni Abbès, and Ksabi. In the terminal lowland areas (Ouled Khoudeir, el Ouata, Tamtert, and Timoudi), where groundwater converges toward the lower flux of the Saoura and evaporation is enhanced under hyper-arid climatic conditions, Na–Cl–SO4 facies dominate. These saline waters reflect halite and gypsum dissolution combined with cation exchange (Ca2+ replaced by Na+) and evaporative concentration, as confirmed by Piper and Gibbs diagrams.
In contrast, the western passive compartment, developed within Tertiary lacustrine limestones, shows signatures influenced by ancient recharge and prolonged residence times. The predominance of sulfate and carbonate-rich facies here is consistent with structural control of flow and mineralized host rocks. Overall, the hydrochemical patterns across the Saoura system clearly reflect the combined effects of aquifer lithology, flow dynamics, and climatic constraints.

4.2. Correlation Matrix and Hierarchical Cluster Analysis

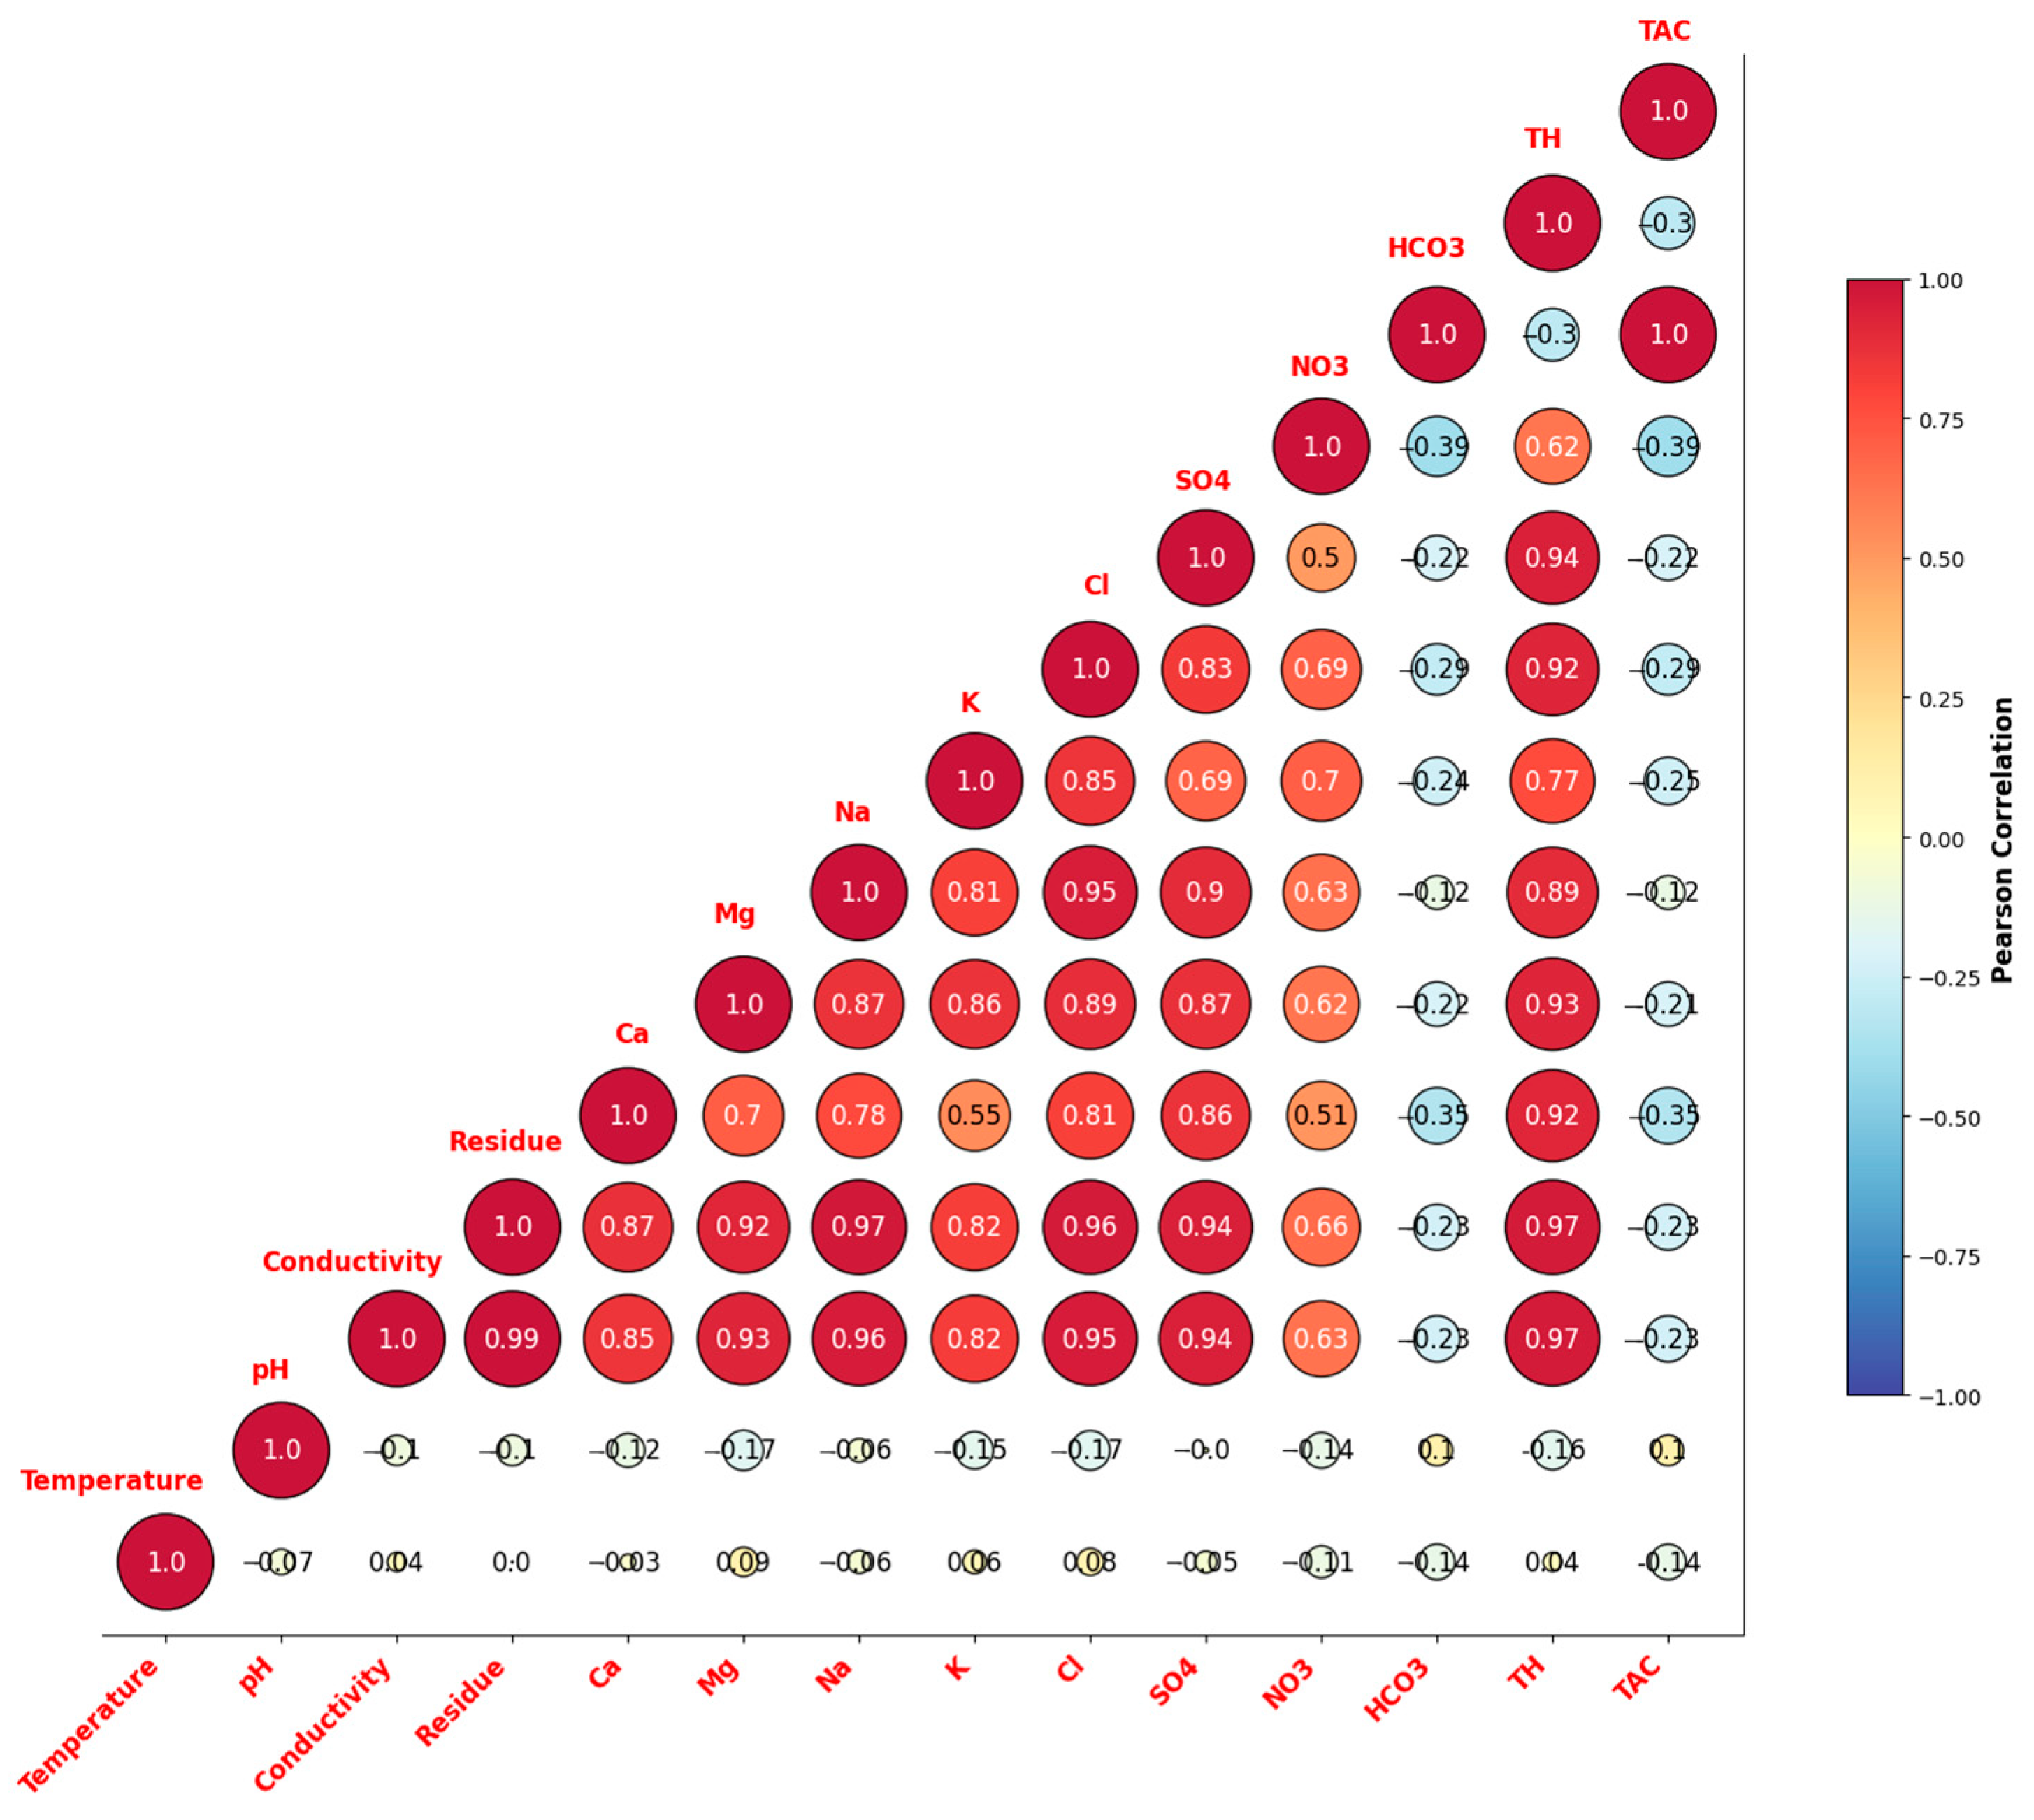
The Pearson correlation matrix (Figure 7) identifies the geochemical relationships among the major ions in the Saoura groundwater [55,56]. The results indicate trends associated with the dominant hydrogeochemical processes in the aquifer system.
Strong correlations (r > 0.90) were observed between Na+–Cl (0.95), Na+–SO42− (0.90), and Cl–SO42− (0.83), which, coupled with the TAC–HCO3 (1.0) and TH–conductivity (0.97) correlations, highlight the dominant role of evaporite dissolution (halite and gypsum) and carbonate equilibria in controlling mineralization [52,57]. The strong link between Ca2+ and SO42− (0.86) and Mg2+ (0.87) further supports the concurrent dissolution of sulfate-bearing minerals [58].
Significant to strong correlations (r = 0.70–0.90) were observed between Ca2+–Mg2+ (0.87) and K+–Cl (0.85), suggesting salinity enrichment processes and secondary cation exchange reactions occurring within clay-rich layers [59]. In contrast, the significant correlation between K+ and NO3 (r = 0.7) likely reflects common anthropogenic sources, particularly agricultural activities involving the application of potassium and nitrate-based fertilizers, as well as domestic wastewater inputs [60].
Moderate to weak correlations (r = 0.35–0.50), including NO3–SO42− (0.50) and Ca2+–residue (0.81), indicate more localized or less systematic geochemical behavior, potentially linked to variations in fertilizer application or soil–water interactions [61]. In contrast, parameters with insignificant correlations (r < 0.35), such as those between HCO3 and Cl (−0.22) or SO42− (−0.22), exhibit limited interdependence, implying distinct sources or independent geochemical controls [62].
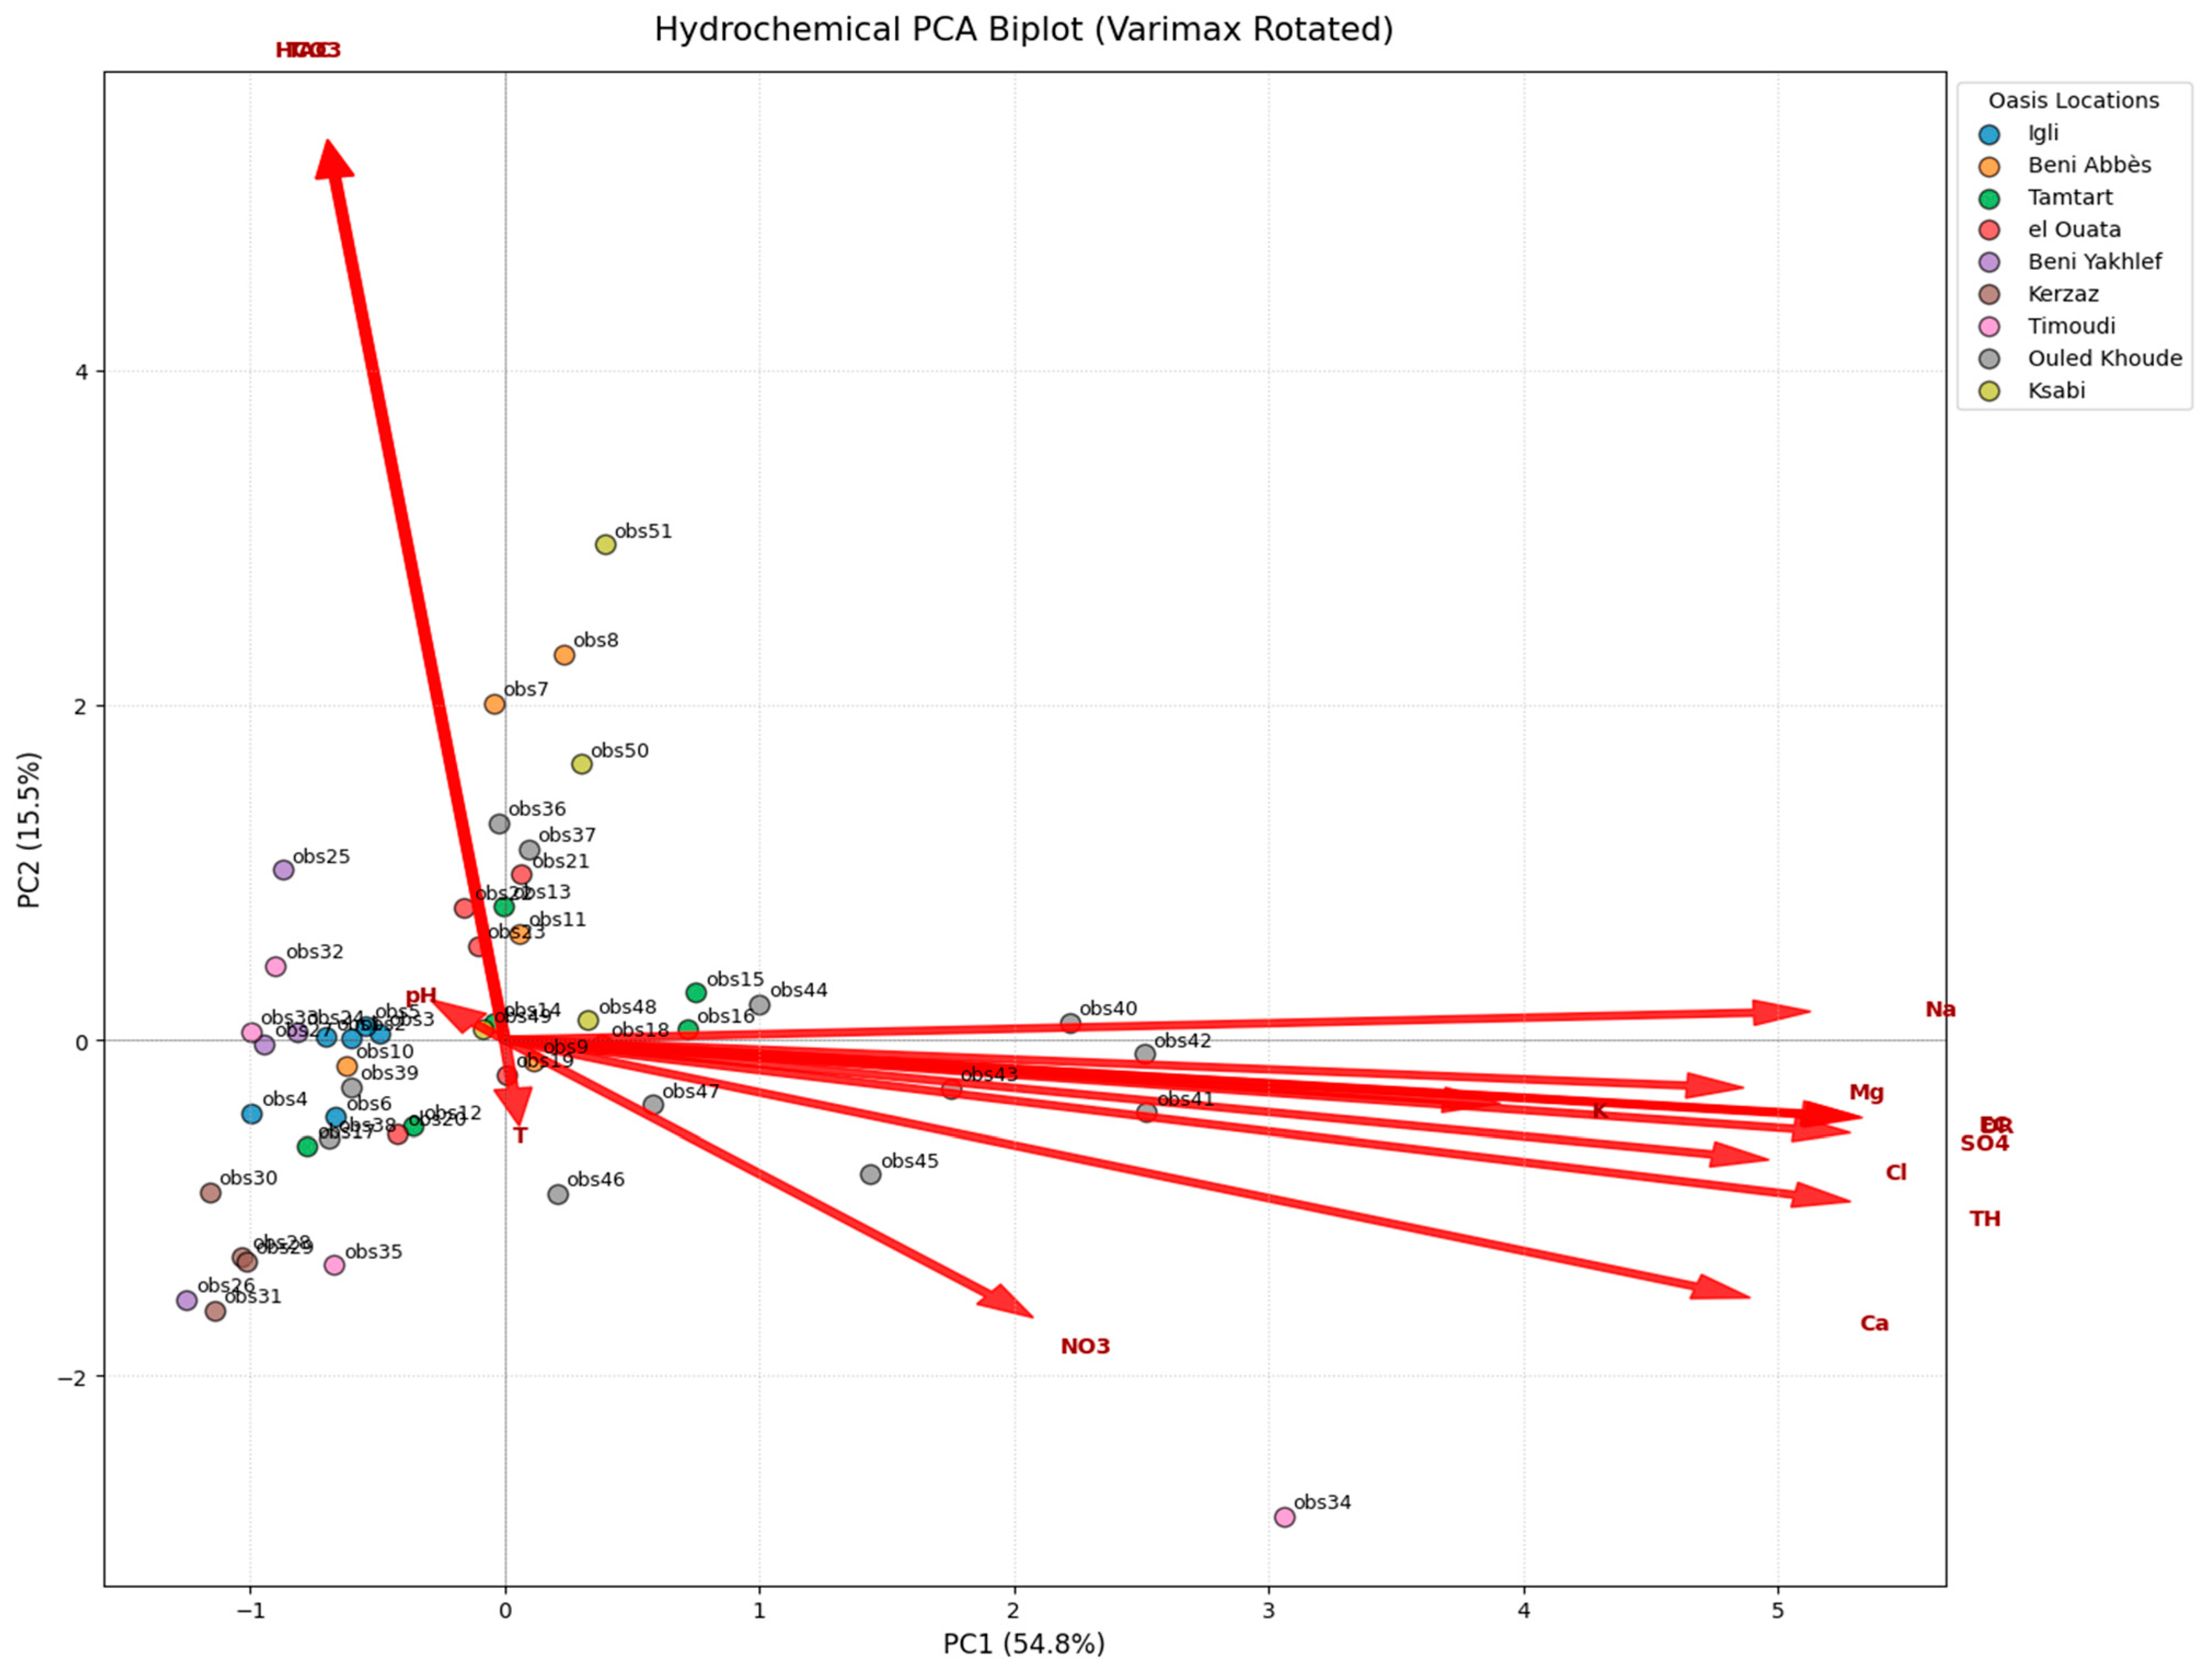
Principal component analysis (PCA) was applied to a standardized dataset of 14 physicochemical parameters from 51 groundwater samples to reduce dimensionality while preserving maximal variance (Figure 8; Table 2) [63]. Following Kaiser-normalized Varimax rotation, the first five components explained a significant portion of the total variance, with the first two principal components accounting for 65.4% (PC1: 47.9% and PC2: 17.5%).
PC1 (54.8%) represents a mineralization and salinity axis, dominated by exceptionally high positive loadings for dry residue (DR: 0.970), Electrical Conductivity (EC: 0.967), Sulfate (SO4: 0.961), Total Hardness (TH: 0.961) and Sodium (Na: 0.933). Strong loadings for Chloride (Cl: 0.903), Calcium (Ca: 0.890), and Magnesium (Mg: 0.885) further confirm that PC1 reflects primary geogenic ion enrichment driven by water–rock interactions [64]. In this rotated space, pH (−0.053) shows a weak negative loading (−0.165), confirming its relative independence from the main mineralization process [65].
PC2 (15.5%) is clearly defined by the carbonate system, exhibiting strong positive loadings for both bicarbonate (HCO3: 0.977) and total alkalinity (TAC: 0.977). The low loadings for salinity markers on this axis suggest that PC2 effectively isolates the natural buffering processes and carbonate weathering from the regional salinization trend.
The higher-order components capture specific secondary processes: PC3 (0.986) is almost exclusively defined by pH, indicating independent acidity/alkalinity controls. PC4 is dominated by Temperature ((T): 0.978), indicating independent thermal influences on the groundwater system. PC5 shows strong associations for Nitrate(0.736) and Potassium (0.610), highlighting agricultural runoff and fertilizer application as a distinct chemical signature separate from the natural mineral baseline [66]. The PCA biplot identifies clear hydrochemical groupings: (1) highly saline samples like obs34 (high positive PC1), (2) bicarbonate-rich waters (high positive PC2), and (3) a cluster of relatively fresh waters near the origin. These results confirm that the groundwater chemistry is primarily controlled by evaporite dissolution, with secondary impacts from alkalinity buffering and agricultural inputs [67].
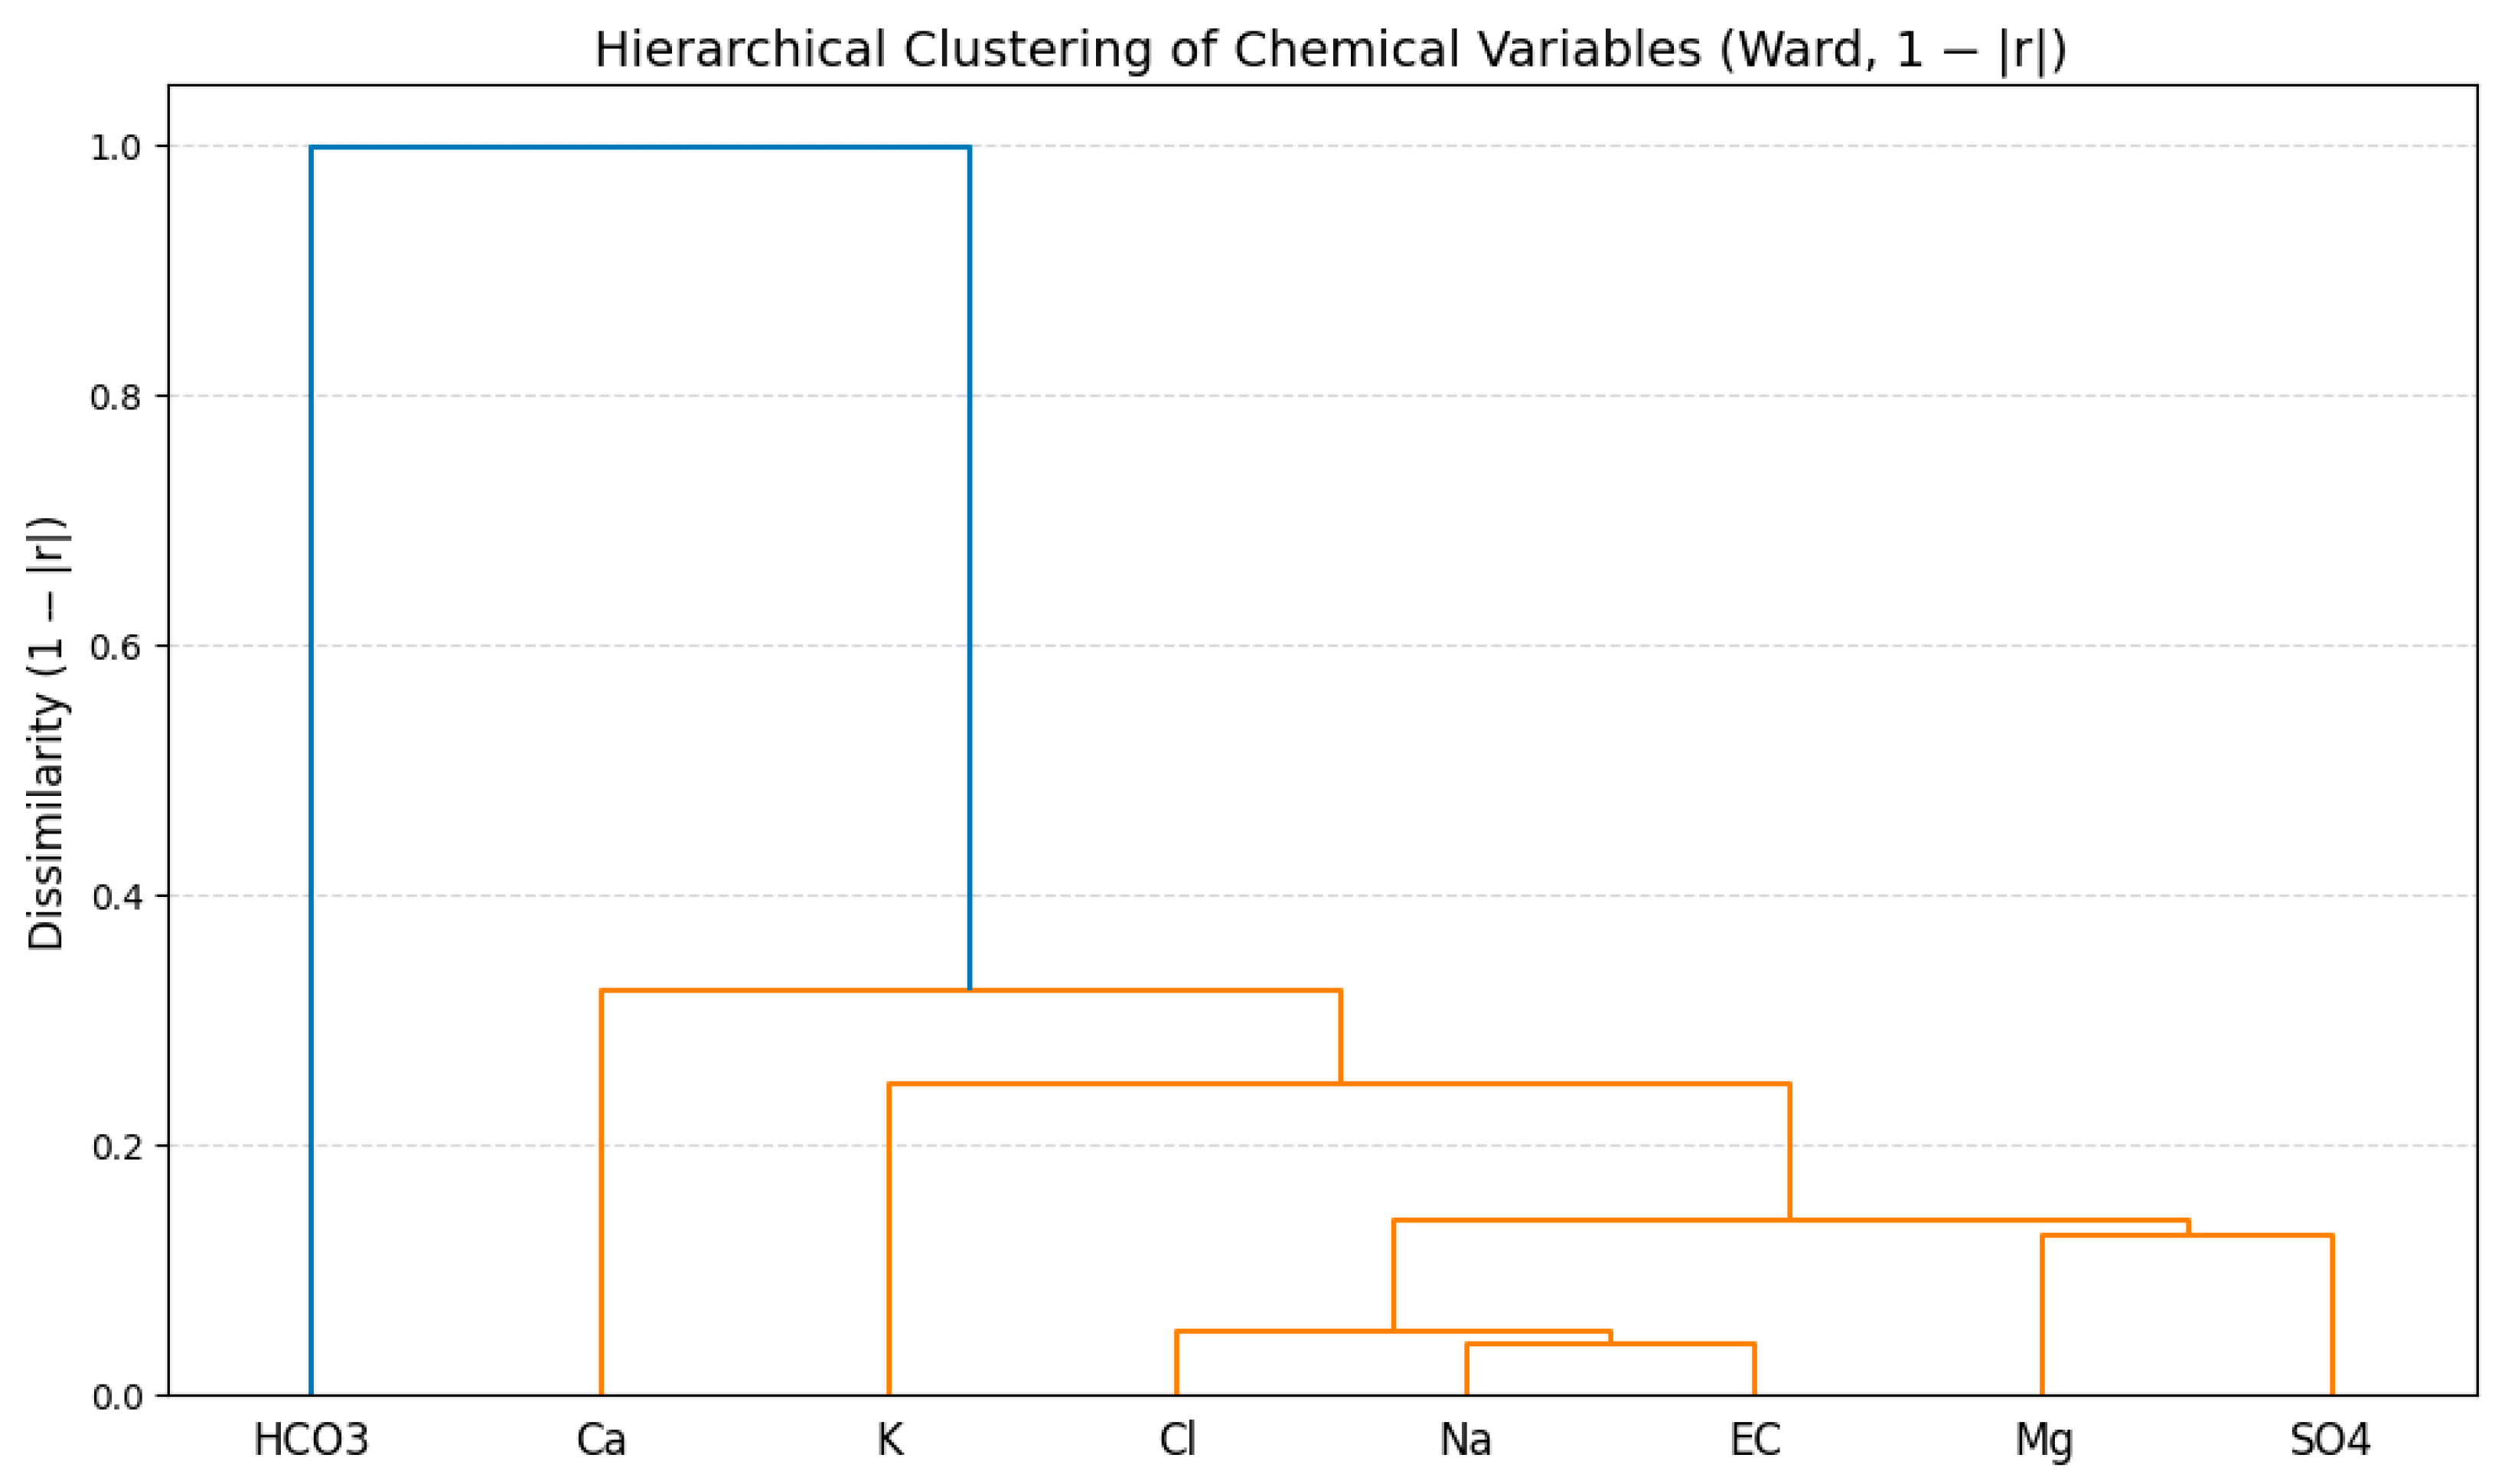
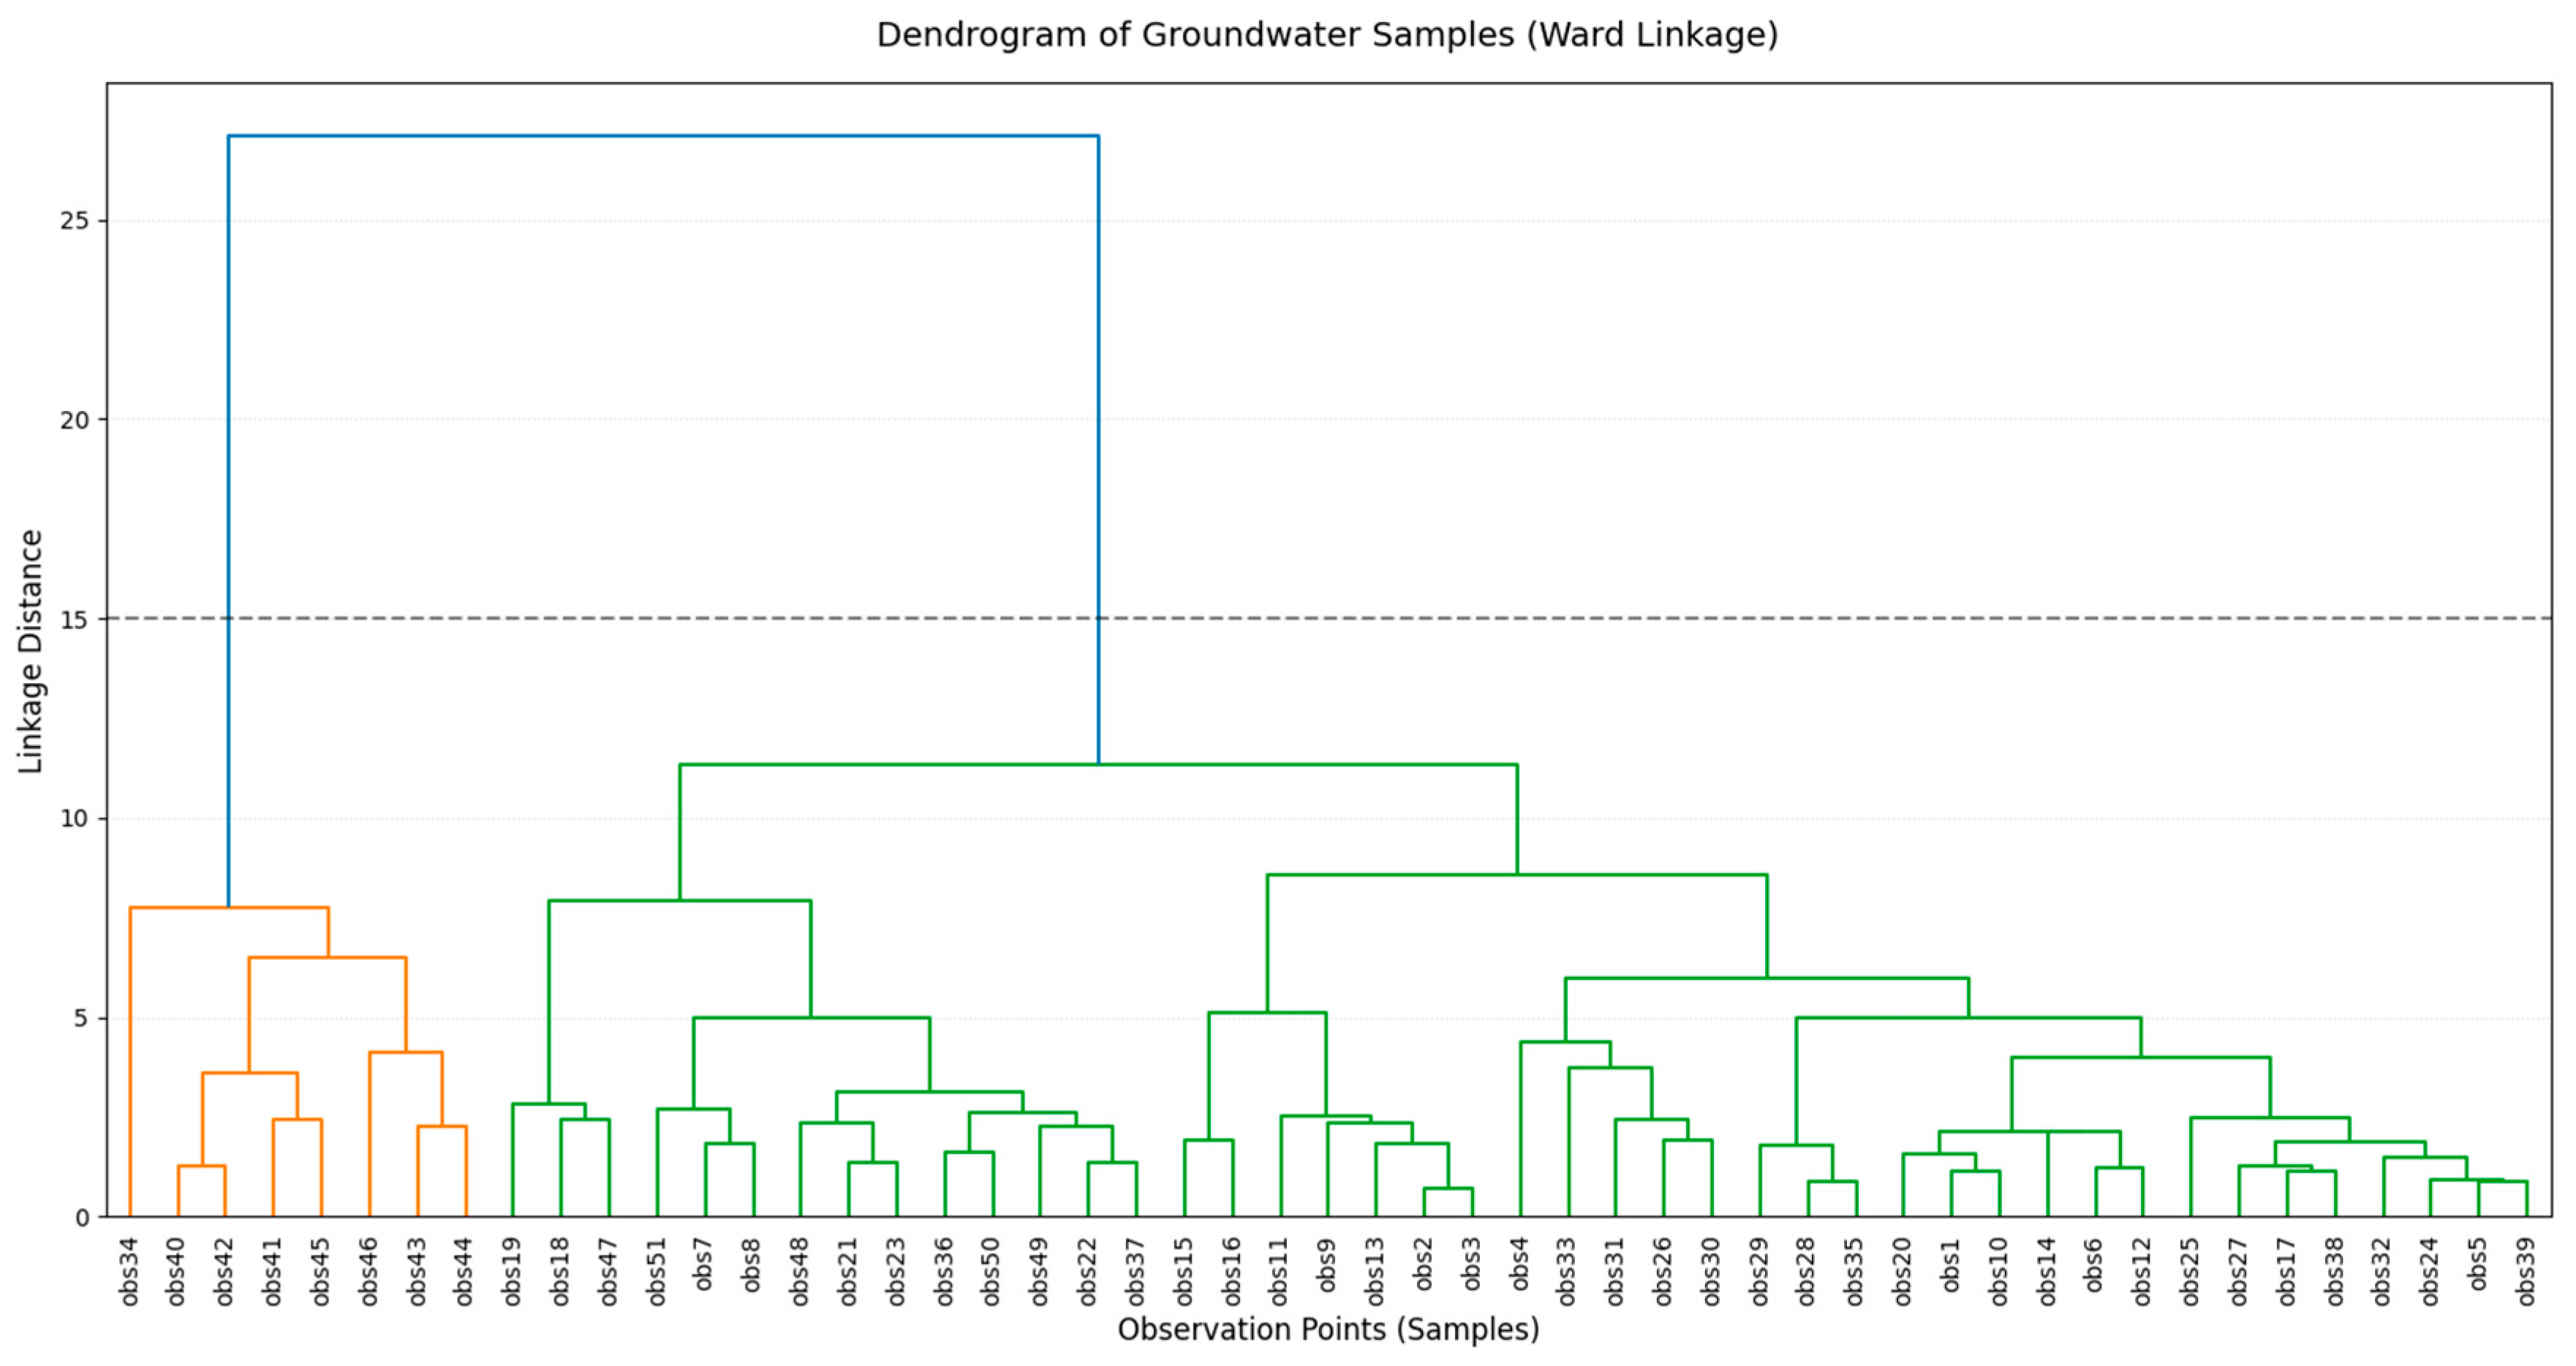
Hierarchical cluster analysis (HCA) was performed using Ward’s linkage method with Pearson correlation to identify patterns in the hydrochemical dataset comprising 5151 groundwater samples from the study area. Two dendrograms were generated: one for chemical variables and one for samples.
The variable dendrogram (Figure 9) identified two primary clusters at a high dissimilarity level of approximately 1.0. The first major cluster is subdivided into two distinct groups at a dissimilarity level of roughly 0.15:
Group A comprises Cl, Na+, EC, and K+, with very low dissimilarity (approx. 0.05 to 0.2). The extremely tight association between Cl and Na+ confirms halite dissolution as a dominant process, while their link to EC reflects their primary role in the total mineralization of the groundwater [68]. The inclusion of K+ in this group suggests a common association with saline enrichment, potentially from agricultural runoff or secondary mineral weathering [66].
Group B comprisesMg2+, SO42−, and Ca2+. The close linkage between Mg2+ and SO42− (dissimilarity < 0.15) suggests a shared origin from the dissolution of gypsum and magnesium-bearing minerals within the aquifer matrix [68].
The close association of these parameters across both groups (dissimilarity < 0.4) confirms the progressive influence of evaporite dissolution as the dominant control on the ionic strength of the evolved waters. In contrast, the second major cluster consists solely of HCO3, which remains isolated at the highest dissimilarity level (1.0). This isolation indicates that bicarbonate-driven processes, such as carbonate mineral dissolution (calcite/dolomite), represent a distinct hydrochemical signature primarily dominant in low-salinity recharge samples, completely independent of the regional salinization path [69]. Overall, the HCA confirms that while natural mineralization (evaporites and carbonates) governs the base chemistry, the grouping of K+ and Cl with the main salinity cluster highlights how agricultural inputs are integrated into the final hydrochemical signature of the terminal oases.
The sample dendrogram (Figure 10) categorized the 51 observations into two primary clusters at a significant linkage distance of approximately 27. These groupings correspond to the spatial and geochemical evolution of the groundwater: Cluster 1 (indicated in orange) comprises groundwater samples from the terminal discharge zones, specifically Timoudi (obs34) and the Ouled Khoudéir group (obs40–46). Within this branch, obs34 is identified as a distinct outlier, branching off at a linkage distance of roughly 8, which highlights its unique status as the most saline end-member in the study area. Cluster 2 (indicated in green) includes the low-to-moderate salinity samples from Igli, Beni Yakhlef, Kerzaz, Beni Abbès, and Tamtart. These samples represent the Ca–HCO3 and Ca–Mg–SO4 facies. The sub-branching within this group (at distances < 10) reflects localized variations in carbonate buffering and minor mineral dissolution along the upstream and intermediate sections of the flow path. The HCA results are consistent with the Piper diagram facies and Gibbs plots, indicating a hydrochemical gradient from carbonate-buffered recharge waters (rock dominance) to evaporite and evaporation-influenced discharge waters. The clustering quantifies the transition from freshwater, carbonate-dominated systems to saline, waters characterized by chloride- and sulfate enrichment at the terminal ends of groundwater flow paths.

4.3. Geochemical Ratios and Water Origin

The analysis of characteristic ionic ratios identifies the geochemical processes controlling groundwater chemistry in the Saoura Valley [70,71]. The ionic composition reflects a complex interplay of lithological interactions and intensive evaporation:
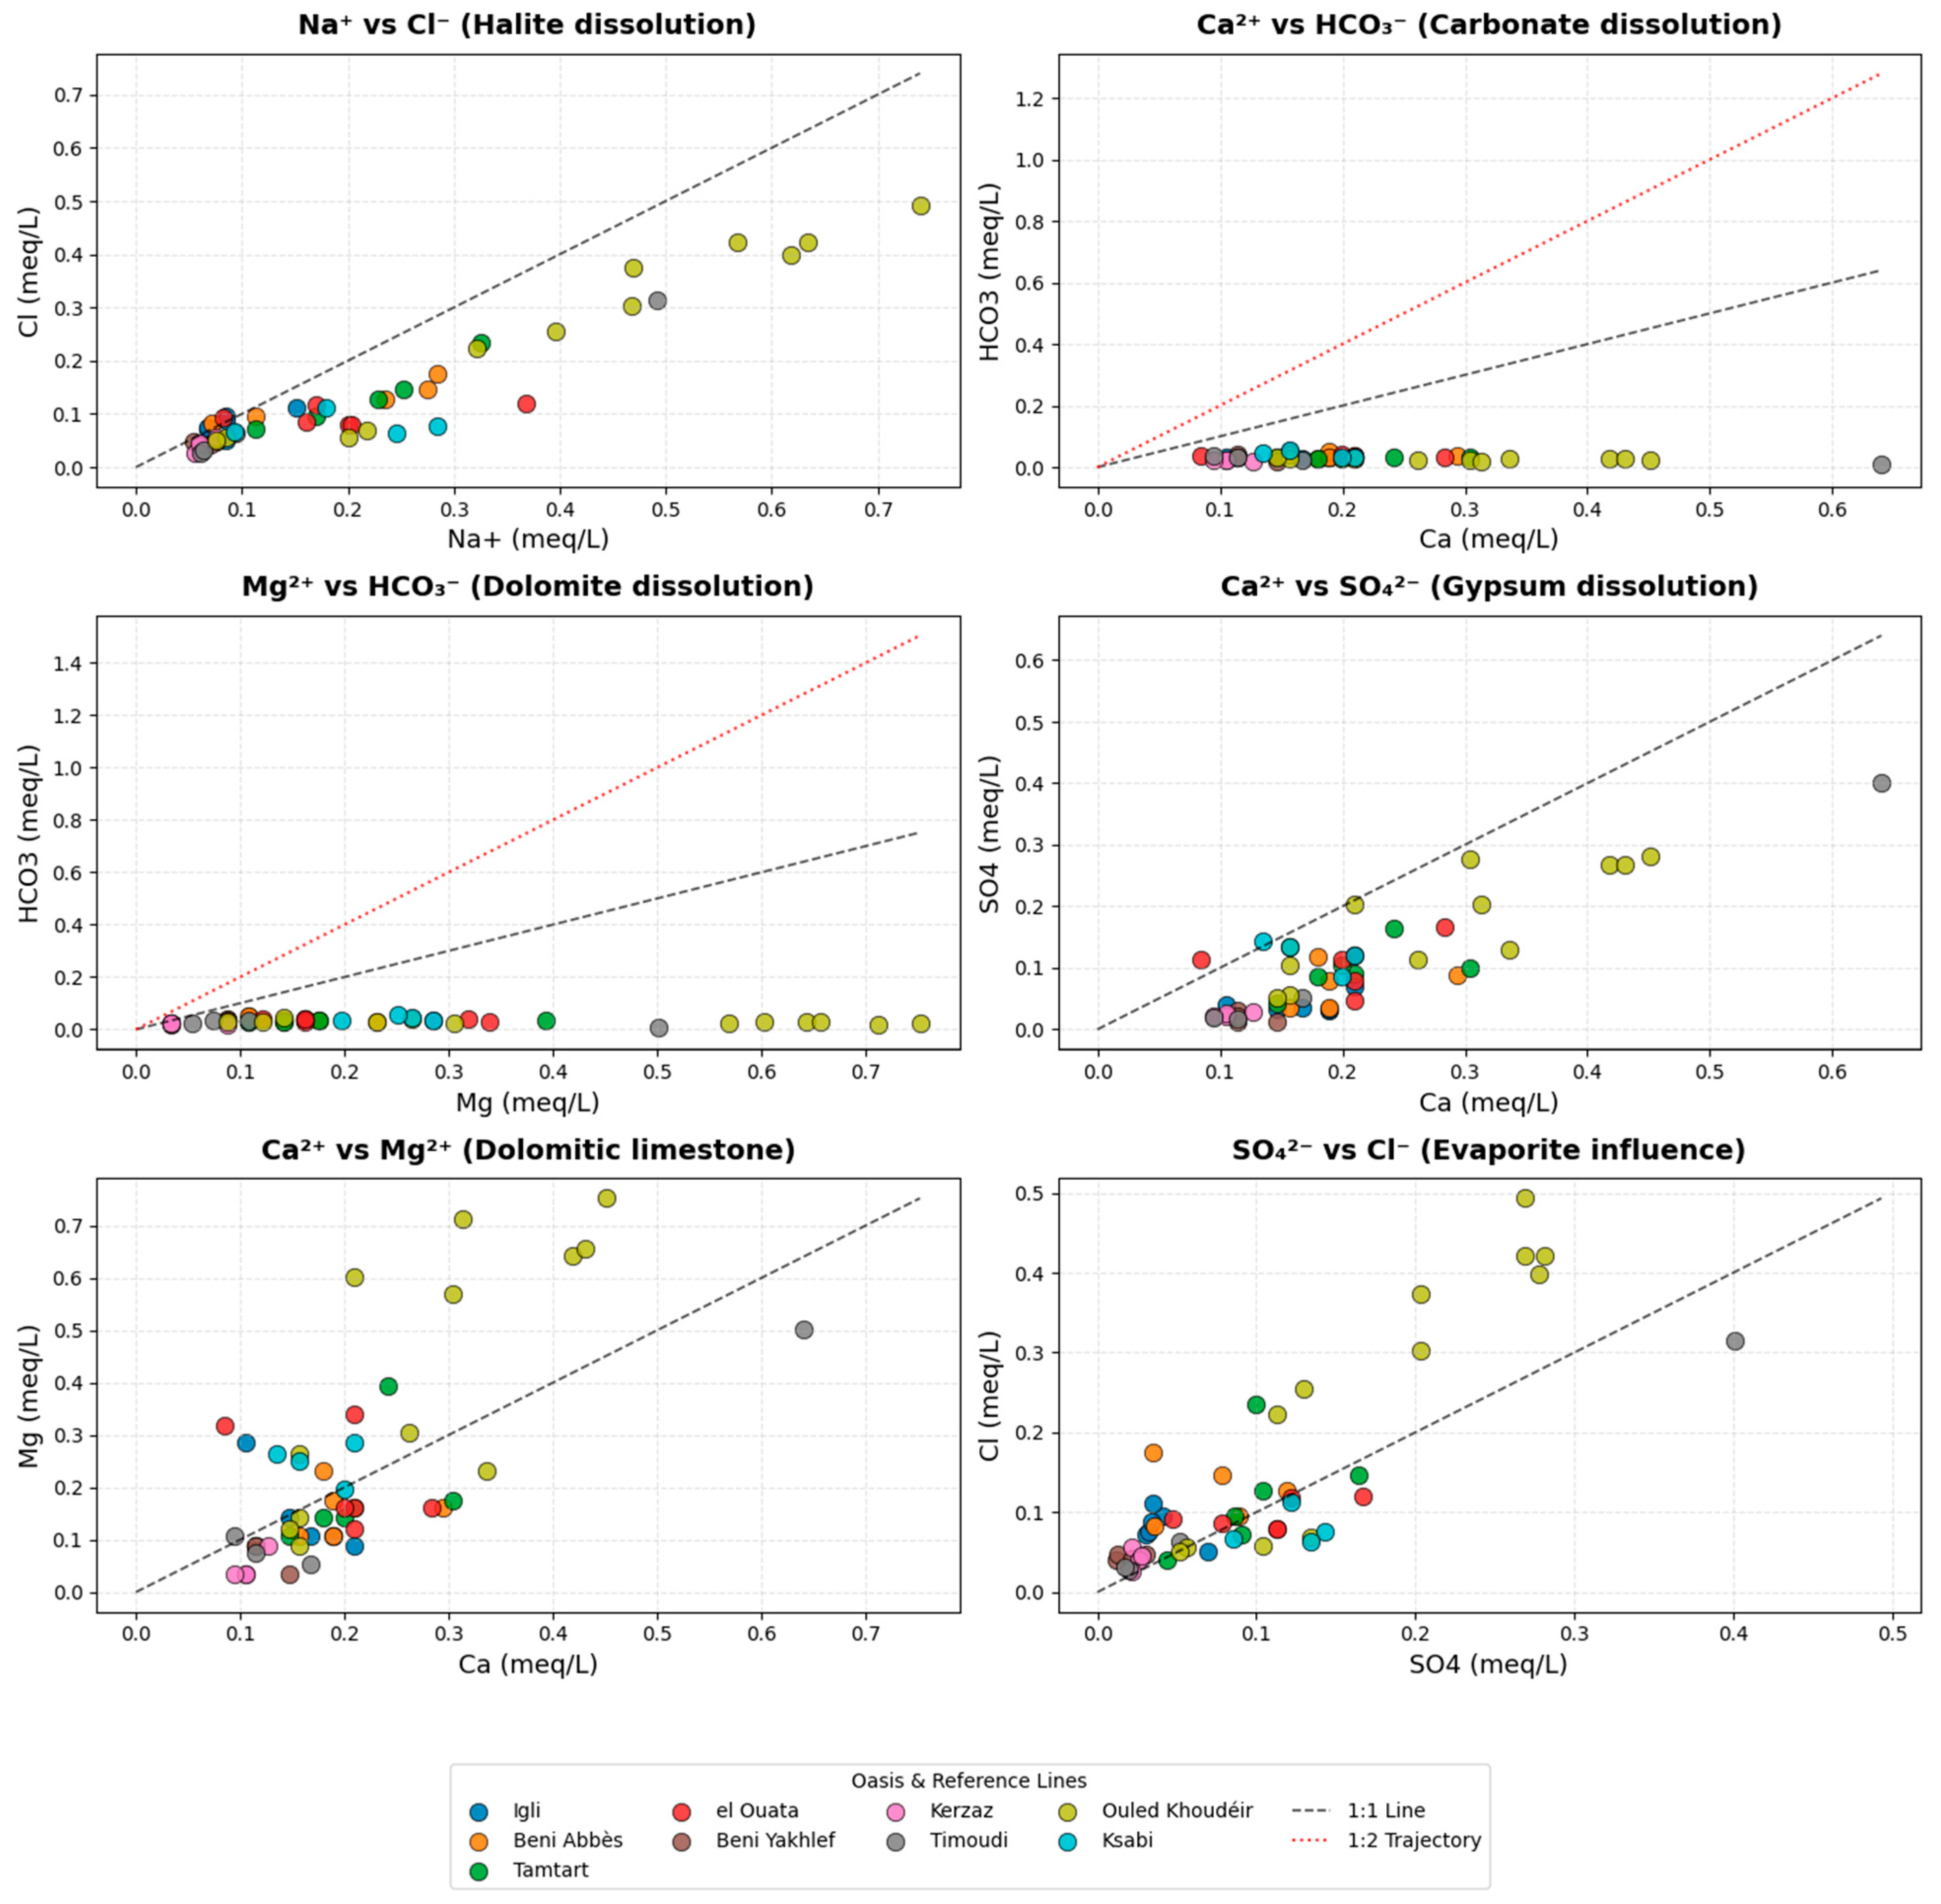
  • Mineral Weathering and Evaporitic Influence: The Na+/Cl relationship (Figure 11) indicates that the majority of samples plot along the 1:1 line, reflecting the influence of the region’s evaporitic lithology [72] rather than a single mineral source. This is complemented by gypsum/anhydrite dissolution, as evidenced by the distribution of Ca2+ and SO42− near the 1:1 line. However, several samples from Ouled Khoudéir and Timoudi deviate toward an excess of calcium, suggesting additional mineral sources or cation exchange processes [73].
  • Carbonate Weathering and Deficits: Standard carbonate weathering typically follows a 1:2 molar trajectory between calcium and bicarbonate. However, the samples exhibit a severe HCO3 deficit, deviating significantly from both the 1:1 meq/L equiline and the 1:2 trajectory in the Ca2+ vs. HCO3 and Mg2+ vs. HCO3 plots [74]. This confirms that limestone and dolomite dissolution are secondary to evaporitic inputs. While the Ca2+ vs. Mg2+ relationship shows some samples near the 1:1 line, supporting some dolomitic limestone dissolution [75], the broad scatter indicates mixed calcium sources.
  • Mixed Geochemical Controls: The SO42− vs. Cl relationship shows a clear linear trend, indicating a common evaporitic origin for these ions, with higher concentrations observed in the terminal discharge zones [76]. The significant excess of Cl relative to SO42− in high-salinity end-members like obs34 and obs40–45 highlights the impact of evaporative concentration and halite dissolution as the primary drivers of terminal salinity [77]. Finally, the SO42−/Cl ratio indicates a predominance of sulfate, consistent with the contribution of gypsum dissolution alongside halite in the terminal flow paths [78].
Overall, these ionic relationships demonstrate that groundwater salinity originates from the collective contribution of evaporitic salts and carbonate weathering, significantly intensified by hyper-arid climatic conditions in the lowland oases.

4.4. Ion Exchange Processes and Hydrochemical Evolution

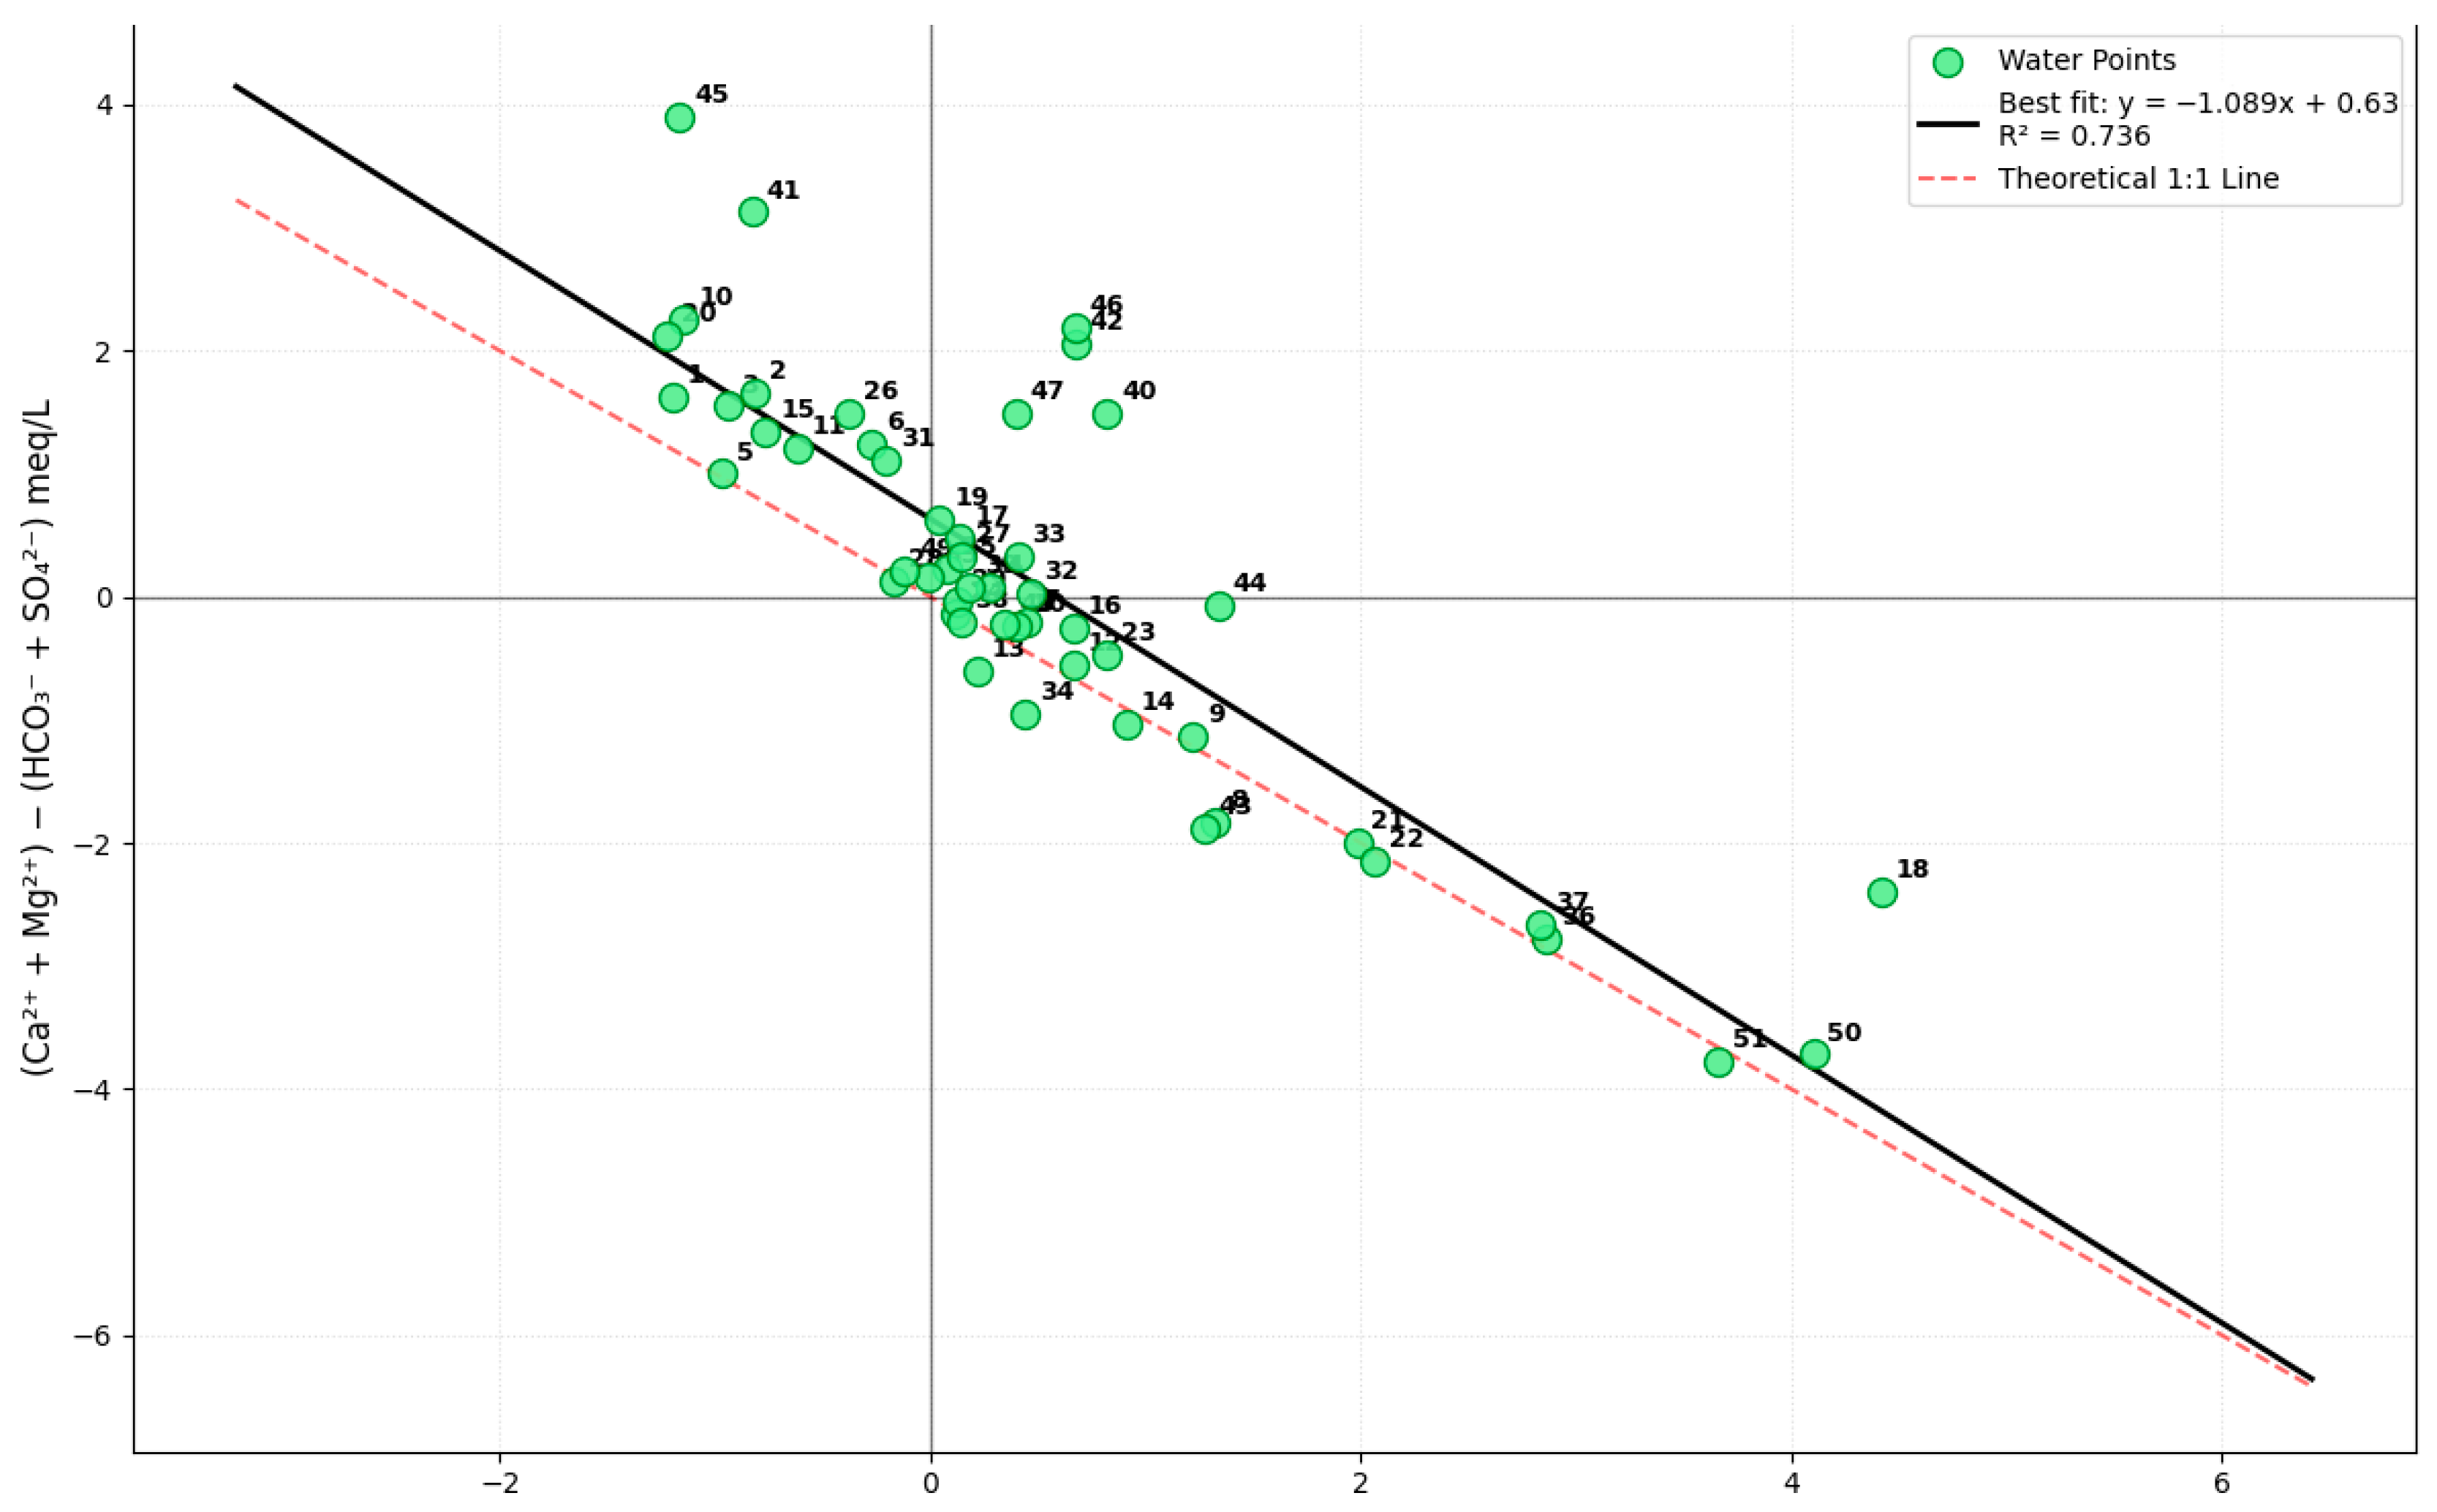
Beyond mineral dissolution, cation exchange serves as a critical secondary mechanism modifying the groundwater chemistry along the Saoura Valley flow path. The bivariate plot of (Na+ + K+ − Cl) versus (Ca2+ + Mg2+− (SO42− + HCO3) was utilized to evaluate cation exchange reactions (Figure 12) [79].
Statistical analysis of the primary sample population, the data exhibits a strong linear correlation (y = −1.089x + 0.63; R2 = 0.736). This near-unit slope (−1.089) indicates that cation exchange is a dominant process controlling the relationship between alkaline earths and alkali metals in the system. The distribution reveals a dual-mode exchange system:
  • Direct Cation Exchange (Softening): A significant portion of the samples, particularly those from the more evolved downstream zones like Ouled Khoudéir (e.g., obs40, obs41, obs42, obs45, obs46), plot in the upper-left quadrant. This indicates a direct exchange process where dissolved Ca2+ and Mg2+ are adsorbed onto clay surfaces, releasing Na+ into the groundwater [80]. This process is a key driver for the transition toward Na–Cl–SO4 facies observed in the terminal oases [81].
  • Reverse Cation Exchange (Hardening): Conversely, a subset of samples, including those from Ksabi (obs50, obs51) and el Ouata (obs18), plots in the lower-right quadrant. This indicates reverse cation exchange, where Na+ in solution is adsorbed onto clay surfaces, causing the release of Ca2+ and Mg2+ in the groundwater [82].
  • Process Dominance and Equilibrium: In zones where samples cluster near the origin, such as certain points from Kerzaz and Beni Yakhlef (e.g., obs24, obs27, obs32, obs33), the chemical signature suggests a state of relative equilibrium where cation exchange is less pronounced compared to the primary influence of mineral dissolution [83]. However, as samples move away from the origin along the regression line, the strong correlation demonstrates that cation exchange becomes the dominant modifier of the major ion chemistry [84].
  • Localized Anomalies: While most samples follow the predictable exchange trend, the wide vertical dispersion of samples like obs45 and obs41 suggests that in specific high-salinity locations, the exchange processes are intensified by high ionic strength or localized variations in the clay content of the alluvial matrix.
Ultimately, the distribution of the majority of samples along the unit slope (−1.089) confirms that cation exchange effectively regulates the cationic balance, facilitating the progressive sodium enrichment observed parallel to the hydraulic gradient in this clay-rich, evaporative system [85].

4.5. Temporal Evolution and Drivers of Groundwater Quality

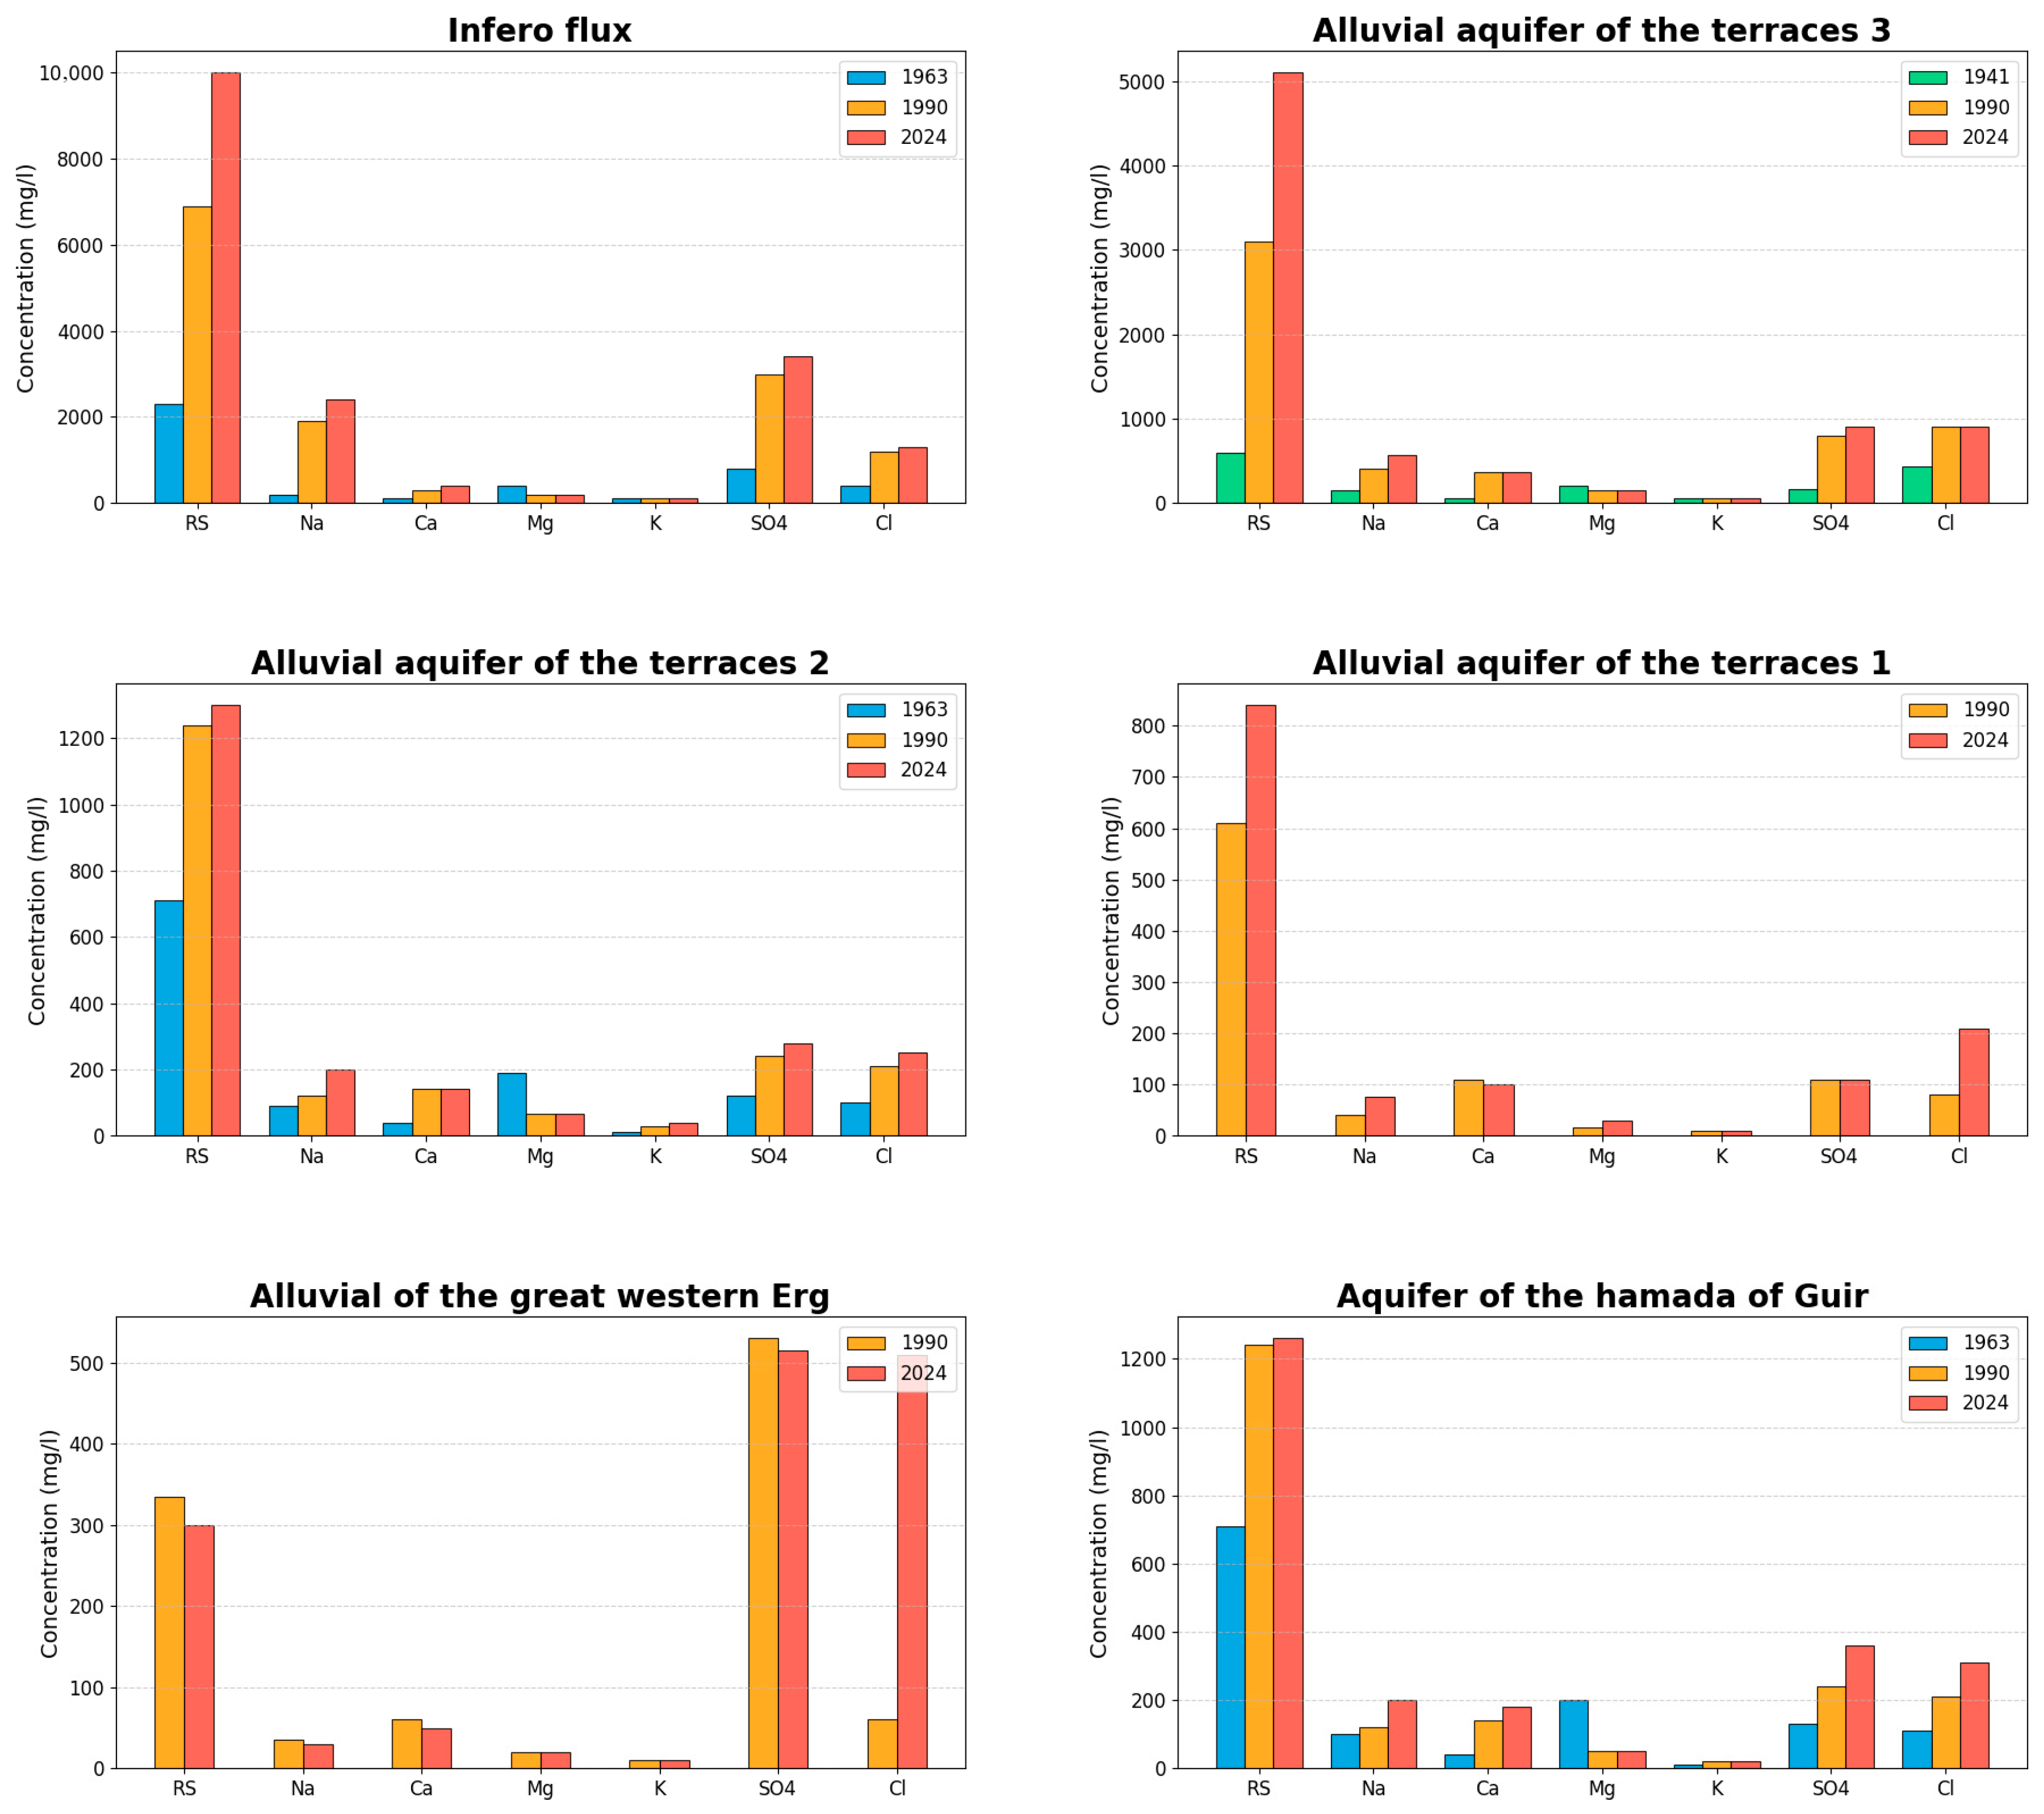
To evaluate the long-term hydrochemical evolution of Saoura groundwater, a comparative analysis was performed using historical data from 1941 and 1963, extracted from the works of Merzougui (2021) [74], alongside our 2024 results. Due to the availability of continuous historical records, the Beni Abbès oasis located centrally within the study area was selected as a representative sentinel site (Figure 1). The comparison focuses on key parameters (RS, Cl, Na+, Ca2+, Mg2+, K+, SO42−). The results demonstrate that the groundwater is in a non-stationary state, with a clear evolution of hydrochemical facies over time. This site-specific evolution serves as a proxy for the broader spatial zoning and geochemical shifts observed across the other eight oases in the 2024 sampling campaign since 1963 (Figure 1). Stacked bar charts of major ion composition across six hydrogeological units indicate a significant temporal increase in total mineralization (RS) and salinity-related ions, with notable acceleration in the rate of change observed between 1990 and 2024 (Figure 13).
In the Infero-Flux aquifer, RS increased from ~2500 mg/L in 1963 to over 9000 mg/L in 2024, driven primarily by elevated Na+ and Cl concentrations exceeding 3000 and 4000 mg/L, respectively, alongside sustained high SO42− (~2000 mg/L). The Alluvial aquifer (Terrace 3) exhibited a near-doubling of RS from ~4000 mg/L in 1941 to ~8000 mg/L in 2024, with Na+ and Cl dominating the ionic load and Ca2+/Mg2+ contributions remaining subordinate.
The Alluvial aquifer (Terrace 2) exhibited a similar trend, with RS increasing from ~700 mg/L in 1963 to ~1300 mg/L in 2024, primarily characterized by Na+–Cl enrichment. In contrast, the Alluvial aquifer (Terrace 1) showed moderate decreases in mineralization during intermediate years (1990) before a significant salinity increase in 2024 (RS ~800 mg/L), indicating episodic recharge influences [75]. The Alluvial aquifer of the Great Western Erg maintained consistently low mineralization (RS < 300 mg/L) between 1990 and 2024. This unit exhibited balanced Ca2+–HCO3 (inferred from low Cl/SO42− ratios), identifying it as a persistent freshwater lens [76]. Finally, The Hamada of Guir aquifer showed persistently high salinity, increasing from about 1200 mg/L in 1941 to nearly 1300 mg/L in 2024. The dominance of Na+, Cl, and SO42− indicates a strong long-standing influence of water–rock interaction. Although the absence of isotopic tracers and trace halides (e.g., Br) limits the precise identification of salinization processes through ionic ratios, the hydrochemical composition, geological setting, and arid climate suggest that evaporite dissolution is the primary source of salinity. Evaporation further contributes to the concentration of dissolved salts. Nitrate concentrations provide additional context: generally low NO3 values indicate a mainly natural origin of salinity, while locally higher values reflect minor anthropogenic inputs. Future studies using isotopes and halide tracers are recommended to better distinguish salinization mechanisms [77].
Historically, while the subsoil of the Saoura wadi (Figure 14) was characterized by high freshwater saturation, the system has experienced a transition from natural, slow-paced mineralization to rapid, human-induced salinization. The freshwater influx from the Great Western Erg aquifer has established a vital hydrochemical boundary (Figure 13). Ultimately, qualitative deterioration is governed by a hierarchy of factors: natural processes (evaporative concentration and geological inputs from gypsiferous formations) provide the baseline, while anthropogenic activities (overexploitation-induced drawdown post-1990, agricultural return flows, and irrigation with saline water) act as the primary accelerants. This has resulted in a hydrochemical evolution from Ca–HCO3 freshwater facies to Na–Cl (SO4) dominant types, reflecting the overprinting of primary recharge signatures by accelerated evaporite dissolution and evaporative enrichment.
Overall, the hydrochemical evidence indicates that groundwater mineralization is dominantly controlled by natural geochemical processes. Evaporite dissolution (halite, gypsum, and anhydrite), together with evaporative concentration under hyper-arid conditions, represents the fundamental mechanism governing salinity evolution, as supported by Piper facies distribution, Gibbs diagrams, ionic ratios, PCA, and HCA results. Cation exchange constitutes a secondary but significant process, responsible for progressive sodium enrichment along flow paths. In contrast, direct anthropogenic chemical influences, mainly reflected by localized nitrate enrichment, play a subordinate role in the overall salinity budget and remain spatially limited to shallow aquifers. However, the physical impact of modern overexploitation has shifted the balance, accelerated natural mineral mobilization and causing the dramatic salinity spikes observed in the recent 1990–2024 window. While these relative contributions are inferred qualitatively, their precise quantitative apportionment would require isotopic tracers and reactive transport modeling, which were beyond the scope of the present study.

4.6. Vulnerability and Pollution Index

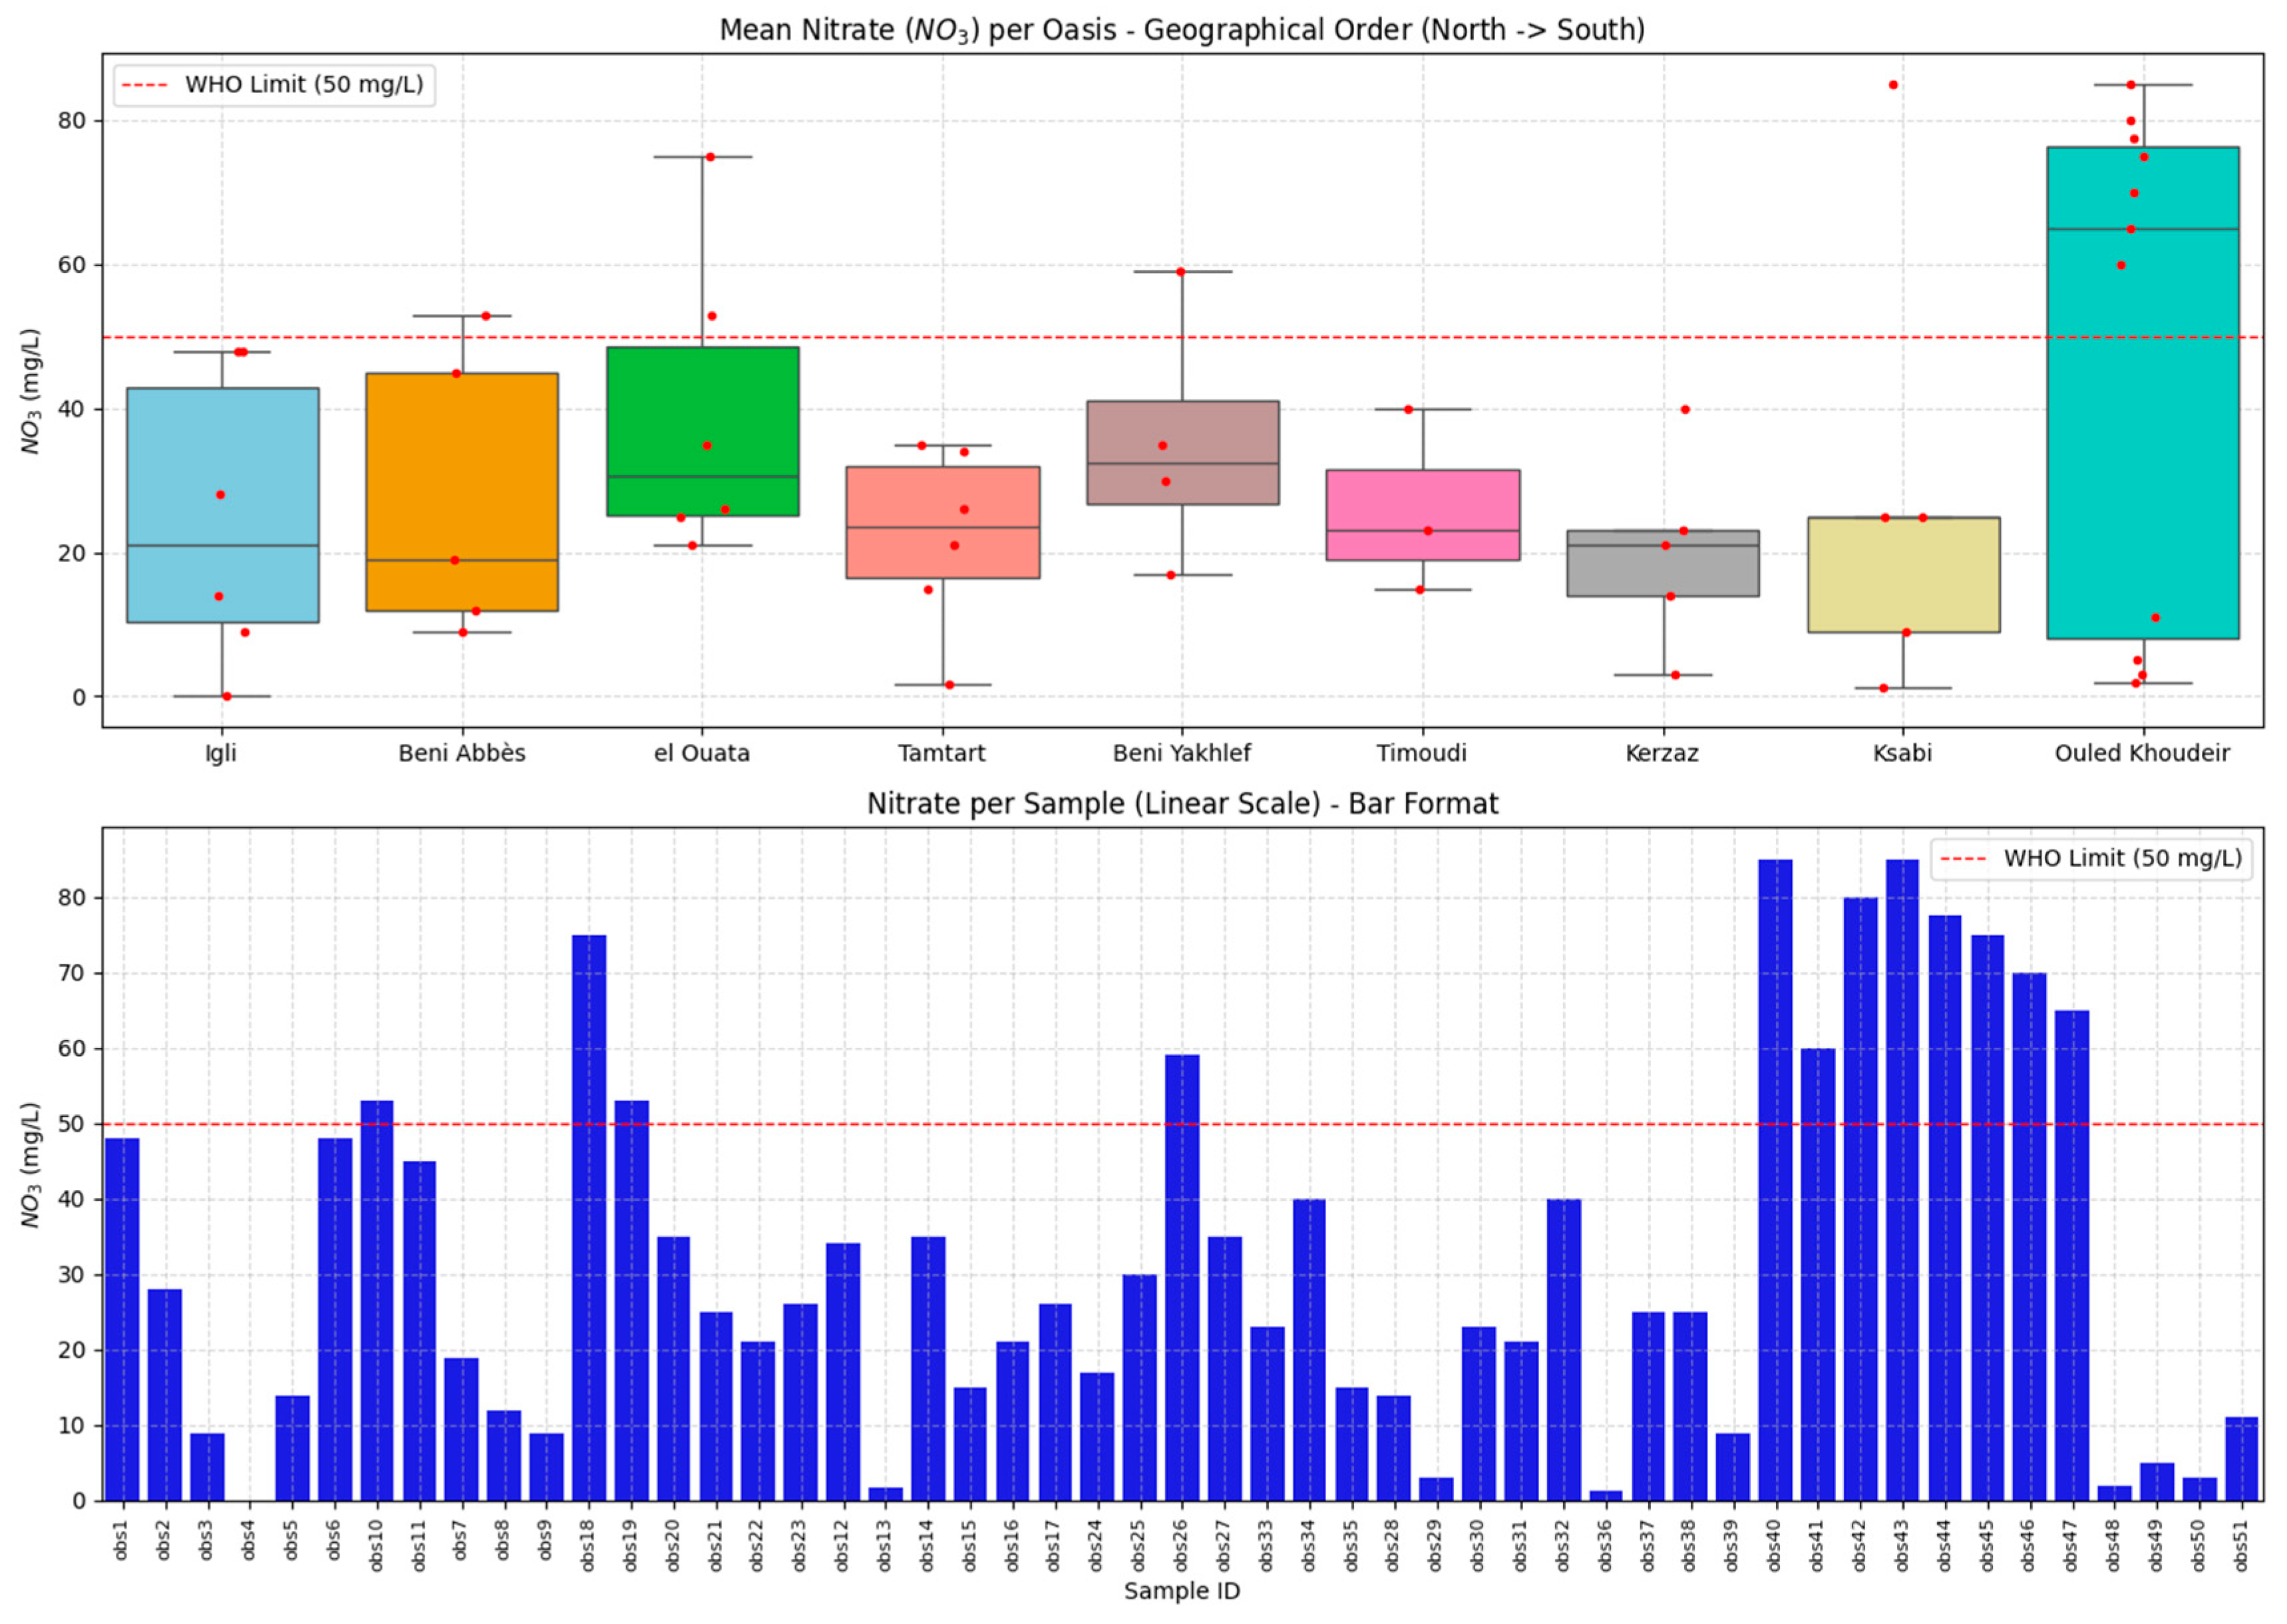
The analysis of nitrate concentrations (NO3) across the nine oases demonstrates significant spatial heterogeneity (Figure 15). The boxplot ordered in geographic order (north → south) indicates that nitrate levels vary extensively both between and within oases. Northern oases, including Igli and Beni Abbès, exhibit moderate concentrations, whereas central and southern oases, particularly el Ouata, Beni Yakhlef, and Ouled Khoudir, display higher median values and frequent outliers. Several samples in these areas surpass the WHO drinking water guideline of 50 mg/L, signaling nitrate contamination.
The individual bar plot illustrates this variability, indicating that exceedances occur intermittently across the region rather than in localized clusters. This pattern suggests mixed and localized nitrate sources, including intensive agricultural fertilizer application, infiltration of untreated domestic wastewater, and soil leaching processes. Extremely high values in specific wells are consistent with point source contamination scenarios.
However, in the absence of isotopic tracers (δ15N–NO3 and δ18O–NO3) and detailed land-use mapping at the well scale, it is not possible to quantitatively discriminate between agricultural and domestic nitrate sources. Future investigations integrating nitrate isotopic signatures, high-resolution land-use data, and well-specific vulnerability parameters would allow for more robust source apportionment and would significantly strengthen the assessment of anthropogenic impacts on groundwater quality.
In summary, the combined visualization indicates the need for groundwater protection measures in the region, especially in oases with recurrent threshold exceedances. The observed nitrate distribution demonstrates the vulnerability of shallow aquifers to anthropogenic impacts, suggesting a requirement for improved management of agricultural application and sanitation systems.

5. Conclusions

The Saoura Valley (southwestern Algeria) comprises a 250-km long sequence of 14 oases representing a significant agro ecosystems of the Sahara. These oases are supplied by a complex hydrogeological system categorized into two distinct compartments: an active eastern compartment recharged by the Mio–Plio–Quaternary aquifer of the Great Western Erg and its alluvial terraces, and a western compartment formed by the Guir Hamada and Cambro–Ordovician aquifers.
The 2024 survey of 51 groundwater samples exhibited a wide range of mineralization (TDS 260–2145 mg/L; EC 400–3300 µS/cm) and identified hydrochemical zonation along the flow path: fresh to moderately mineralized Ca–Mg–HCO3 and Ca–Mg–SO4 waters in upstream oases (Beni Yakhlef, Kerzaz) into Na–Cl–SO4 and saline Na-dominated waters in the terminal inferoflux and southern terraces (Ouled Khoudéir, Timoudi). Groundwater chemistry is primarily governed by natural geogenic processes, specifically the dissolution of halite and sulfate-bearing minerals (gypsum/anhydrite), as evidenced by strong PC1 loadings (0.90–0.97) and ionic ratios plotting near the 1:1 equiline. Cation exchange serves as a critical secondary modifier, with a near-unit regression slope of −1.089 (R2 = 0.736) confirming a dual-mode exchange system that facilitates progressive sodium enrichment. These natural drivers are increasingly overprinted by anthropogenic impacts; PCA (PC5) and HCA (Group A) both isolate a distinct K–NO3–Cl association. Nitrate concentrations exceed the WHO limit of 50 mg/L in several samples (e.g., obs40, obs44), identifying agricultural return flows as a significant subordinate driver. Comparison with historical data (1941–2024) reveals that while salinization is a long-standing natural feature of the valley’s arid cycle, the rate of salinization has increased significantly since the 1990s. This modern acceleration spatially aligns with the extensive construction of deep boreholes and the decline of traditional foggaras. The freshwater lens supplied by the Great Western Erg, which formerly formed a continuous hydrochemical boundary along the valley, is currently contracting. It is being replaced by brackish and saline water through a combination of natural diffusive salt transport and human-induced up-coning of deeper saline groundwater triggered by localized over-pumping. These trends indicate a potential decline in the long-term sustainability of the Saoura oases. In the absence of integrated management strategies, including regulated groundwater abstraction, artificial recharge assessments, enhanced irrigation efficiency, and rehabilitation of traditional water-harvesting systems, large parts of the cultivated area may become unsuitable for datepalm cultivation and associated crops within the next two decades. The Saoura aquifer system illustrates the sensitivity of Saharan oasis systems; the observed contraction of the freshwater lens and the downstream migration of saline fronts provide clear evidence of the impacts of climate variability and unregulated modernization of water use, demonstrating the requirement for adaptive, data-driven governance of groundwater resources in arid regions.
From a management perspective, priority actions in the Saoura Valley include regulating groundwater abstraction, improving irrigation efficiency, and protecting recharge zones connected to the Great Western Erg. Artificial recharge using seasonal floodwaters may help partially restore the freshwater lens, while the rehabilitation of traditional foggara systems could reduce pressure on deep aquifers. Establishing a long-term groundwater monitoring network would further support adaptive and sustainable management of the oasis system.
Further investigations are required to better constrain the origin of groundwater salinization in the Saoura Valley. The use of advanced chemical and isotopic tracers, such as stable water isotopes (δ18O, δ2H), halide ratios (Cl/Br), and sulfate and nitrate isotopes (δ34S–SO4, δ15N–NO3), would allow clearer discrimination between evaporation, evaporite dissolution, and anthropogenic inputs. Integrating these tools with long-term monitoring would provide more conclusive insight into salinity sources and their evolution.

Author Contributions

Conceptualization, A.M. and S.A.; methodology, A.M.; software, A.B.; validation, A.M., S.A., and T.M.; formal analysis, A.M., Z.M., and A.B.; investigation, A.M., S.A., and T.M.; resources, B.L.; data curation, A.B. and Z.M.; writing—original draft preparation, A.M. and S.A.; writing—review and editing, A.B., Z.M., Y.G.A.E.-R. and L.M.; visualization, A.B.; E.S.A.-F., and M.A.A. supervision, T.M.; project administration, A.M. and Y.G.A.E.-R.; funding acquisition, E.S.A.-F., M.A.A., and L.M. All authors have read and agreed to the published version of the manuscript.

Funding

This work was supported and funded by the Deanship of Scientific Research at Imam Mohammad Ibn Saud Islamic University (IMSIU), (grant number IMSIU-DDRSP2603).

Data Availability Statement

The original contributions presented in this study are included in the article. Further inquiries can be directed to the corresponding author.

Conflicts of Interest

The authors declare no conflicts of interest.

References

  1. Hernández-Agüero, J.A.; Falkenhahn, M.; Hetzer, J.; Wesche, K.; Zarfl, C.; Tockner, K. Mapping the Global Distribution and Conservation Status of Oases—Ecosystems of Pivotal Biocultural Relevance. PeerJ 2025, 13, e18884. [Google Scholar] [CrossRef]
  2. Jouve, P. Les oasis du Maghreb, des agro-écosystèmes de plus en plus menacés. Comment renforcer leur durabilité? Courr. L’environnement L’INRA 2012, 62, 113–122. [Google Scholar]
  3. Côte, M. Des oasis aux zones de mise en valeur: L’étonnant renouveau de l’agriculture saharienne. Méditerranée 2002, 99, 5–14. [Google Scholar] [CrossRef]
  4. Margat, J.; Lemarchand, L. Les Nappes Fossiles du Sahara; Sophia Publications: Paris, France, 2008; Volume 421, pp. 60–64. [Google Scholar]
  5. Bouaziz, A.; Hammani, A.; Kuper, M. Les oasis en Afrique du Nord: Dynamiques territoriales et durabilité des systèmes de production agricole. Cah. Agric. 2018, 27, 14001. [Google Scholar] [CrossRef]
  6. Kouzmine, Y. Le Sahara Algérien. Intégration Nationale et Développement Régional; Éditions L’Harmattan: Paris, France, 2012; ISBN 978-2-336-00418-1. [Google Scholar]
  7. Kouzmine, Y.; Fontaine, J.; Yousfi, B.-E.; Otmane, T. Étapes de la structuration d’un désert: L’espace saharien algérien entre convoitises économiques, projets politiques et aménagement du territoire. Ann. Géographie 2009, 670, 659–685. [Google Scholar] [CrossRef]
  8. Sghaier, M. Complémentarité Oasis-Steppe: Une Stratégie de Survie Dans Les Régions Arides; Institut de Recherche sur le Maghreb Contemporain (IRMC)/IUED: Geneva, Switzerland, 1995. [Google Scholar]
  9. Remini, B. La Foggara: Le Système Hydraulique des Oasis du Grand erg Occidental en Déclin; Paper Presented at the International Conference “Inhabiting the Desert” (Habiter le Désert); University of Ghardaïa: Ghardaia, Algeria, 2006. [Google Scholar]
  10. Remini, B.; Achour, B.; Kechad, R. The Sharing of Water in the Oases of Timimoun: Heritage Cultural Declining. Larhyss J. 2014, 18, 7–17. [Google Scholar]
  11. Remini, B.; Achour, B. Vers la disparition de l’une des plus grandes foggaras d’Algérie: La foggara d’El Meghier. Sécheresse 2008, 19, 217–221. [Google Scholar]
  12. Dubost, J.-J.; Sauvezie, B. Actualités Des Rhumatismes Inflammatoires Du Sujet Âgé. Rev. Rhum. Mal. Ostéo-Articul. 1992, 59, 37–42. [Google Scholar]
  13. Remini, B. La Problematique de l’eau En Algérie Du Nord. Larhyss J. 2010, 08, 27–46. [Google Scholar]
  14. Ameri, S.; Mekkaoui, A.; Merzougui, T. La Saoura, Espace Hydraulique En Crise: Impacts Des Facteurs Naturels et Actions Anthropiques Sur Les Ressources Hydriques (Sud-Ouest, Algérie). Int. J. Environ. Glob. Clim. Change 2014, 2, 55–65. [Google Scholar]
  15. Merzougui, T. Caracterisation Hydrogeologique et Modelisation D’un Aquifere Alluvial en Zone Hyper Aride: Cas de la Nappe de la Palmeraie de Beni Abbes; Université Abou Bekr Belkaid—Tlemcen: Tlemcen, Algérie, 2011. [Google Scholar]
  16. OSS. Gestion Concertée des Ressources en Eau Partagées D’un Aquifère Transfrontalier Sahélien: Le Système Aquifère d’Iullemeden, Synthèse No. 2; Observatoire du Sahara et du Sahel (OSS): Carthage, Tunis, 2008; p. 20. [Google Scholar]
  17. Alfarrah, N.; Walraevens, K. Groundwater Overexploitation and Seawater Intrusion in Coastal Areas of Arid and Semi-Arid Regions. Water 2018, 10, 143. [Google Scholar] [CrossRef]
  18. Edmunds, W.M. Renewable and Non-Renewable Groundwater in Semi-Arid and Arid Regions. In Water Resources Perspectives: Evaluation, Management and Policy; Elsevier: Amsterdam, The Netherlands, 2003; Volume 50, pp. 265–280. ISBN 978-0-444-51508-7. [Google Scholar]
  19. Zammouri, M.; Feki, H. Managing Releases from Small U—Pland Reservoirs for Downstream Recharge in Semi-Arid Basins (Northeast of Tunisia). J. Hydrol. 2005, 314, 125–138. [Google Scholar] [CrossRef]
  20. Chavaillon, J.; de Guy, B. Les formations quaternaires du Sahara nord-occidental. J. Soc. Afr. 1964, 34, 313–314. [Google Scholar]
  21. Combes, M. Étude Hydrogéologique de la Hamada du Guir. Commune de Béchar, Département de la Saoura; Circonscription des T.P.H. des Oasis et de la Saoura: Béchar, Algérie, 1966; p. 14. [Google Scholar]
  22. Conrad, G.; Roche, M. Etude stratigraphique et hydrogeologique de l’extremite meridionale de la Hamada du Guir. Bull. Soc. Géol. Fr. 1965, 7, 695–712. [Google Scholar] [CrossRef]
  23. Ameri, S. Hydrology and Siltation of Dams in Arid Zones: Case Study of the Djorf Torba Dam. Ph.D. Thesis, Tahri Mohammed University Béchar, Béchar, Algeria, 2018. [Google Scholar]
  24. Mebrouk, N. Étude Hydrochimique et Isotopique Des Eaux de la Vallée de la Saoura (Sahara Nord Occidental). Hydrochimie/Hydrogéologie. Ph.D. Thesis, Université d’Oran 2 Mohamed Ben Ahmed, Oran, Algérie, 2007. [Google Scholar]
  25. Bouguedoura, N.; Benkhalifa, A.; Bennaceur, M. Le palmier dattier en Algérie. In Biotechnologies du Palmier Dattier; Aberlenc-Bertossi, F., Ed.; IRD Éditions: Hong Kong, China, 2010; pp. 15–22. ISBN 978-2-7099-1691-2. [Google Scholar]
  26. Hollard, H.; Choubert, G.; Bronner, G.; Marchand, J.; SOUGY, J. Carte Géologique du Maroc, (1:1,000,000; 2 Sheets): Notes et Mémoires du Service Géologique du Maroc; Géologique du Maroc: Rabat, Maroc, 1985. [Google Scholar]
  27. Mekkaoui, A. Le Magmatisme Basique de l’axe Damrane-Kahal Tabelbala (Daoura, Monts de l’Ougarta, Sud-Ouest Algérie): Géologie, Pétrologie, Géochimie et Contexte Géodynamique. Ph.D. Thesis, Université d’Oran 2 Mohamed Ben Ahmed, Oran, Algérie, 2015. [Google Scholar]
  28. Michard, A. Eléments de Géologie Marocaine; Notes et Mémoires du Service Géologique; Service Géologique du Maroc: Rabat, Morocco, 1976. [Google Scholar]
  29. Mekkaoui, A.; Merzougui, T.; Graine, K. Hydrogéologie de Béni Abbès: Potentialités, Hydrodynamique et Conséquences sur la Palmeraie; Centre Universitaire de Béchar: Béchar, Algérie, 2005. [Google Scholar]
  30. Ait Kaci, A. Évolution Lithostratigraphique et Sédimentologique des Monts d’Ougarta Pendant le Cambrien (Sahara Algérien Nord-Occidental). Ph.D. Thesis, Université d’Alger (Today: Université des Sciences et de la Technologie Houari Boumediene—USTHB), Alger, Algérie, 1990. [Google Scholar]
  31. Alimen, H.; Le Maitre, D.; Menchikoff, N.; Petter, G.; Poueyoto, A. Les Chaînes d’Ougarta et la Saoura; Monographies Régionales—1re série; Association des Services Géologiques Africains/XIXe Congrès Géologique International: Alger, Algeria, 1952; Volume 15. [Google Scholar]
  32. Donzeau, M. Étude Structurale Dans le Paléozoïque des Monts d’Ougarta. Géologie Structurale. Ph.D. Thesis, Université d’Oran 2 Mohamed Ben Ahmed, Oran, Algérie, 1971. [Google Scholar]
  33. Rodier, J. L’analyse de L’eau: Eaux Naturelles, Eaux Résiduaires et Eaux de Mer, 7th ed.; Dunod: Malakoff, France, 1984; ISBN 978-2-04-015643-5. [Google Scholar]
  34. Bridgewater, L.L.; Baird, R.B.; Eaton, A.D.; Rice, E.W.; American Public Health Association; American Water Works Association; Water Environment Federation (Eds.) Standard Methods for the Examination of Water and Wastewater, 23rd ed.; American Public Health Association: Washington, DC, USA, 2017; ISBN 978-0-87553-287-5. [Google Scholar]
  35. Shi, G.; Dong, J.; Dong, H.; Li, Y.; Zhang, Y.; Liu, Y.; Li, Y. Identification of Driving Factors and Water Quality Evaluation of Groundwater in Quanzhou City, a Typical Coastal Area in Southeast China. Sci. Rep. 2025, 15, 39888. [Google Scholar] [CrossRef]
  36. Mageshkumar, P.; Vennila, G. Assessment of Errors in Water Quality Data Using Ion Balancing Methods—A Case Study from Cauvery River, South India. Indian J. Mar. Sci. 2020, 49, 57–62. [Google Scholar]
  37. Vasilevskyi, O. Methodology for Assessing the Accuracy of a Measuring Instrument for the Ion Concentration Using Its Measurement Model. Acta IMEKO 2025, 14, 1–10. [Google Scholar] [CrossRef]
  38. Merzougui, T.; Kabour, A.; Bouanani, A. Un Modèle de Gestion Intégrée Des Ressources En Eau Dans Une Zone Hyperaride: Cas de L’oasis de Béni Abbès (Vallée de La Saoura, Sud-Ouest Algérien); International Water Resources Association (IWRA): Montpellier, France, 2008. [Google Scholar]
  39. Roche, M.-A. Hydrogéologie de la haute Saoura (Sahara nord occidental). Bull. Serv. Géol. L’Algérie Nouv. Sér. 1973, 43, 10–71. [Google Scholar]
  40. Yousfi, M. Étude Géochimique et Isotopique de L’évaporation et de L’infiltration en Zone Non Saturée Sous Climat Aride: Béni-Abbès, Algérie. Ph.D. Thesis, Université Paris-Sud (Paris XI)—Centre d’Orsay, Orsay, France, 1984. [Google Scholar]
  41. Kim, J.; Kim, R.; Lee, J.; Cheong, T.; Yum, B.; Chang, H. Multivariate Statistical Analysis to Identify the Major Factors Governing Groundwater Quality in the Coastal Area of Kimje, South Korea. Hydrol. Process. 2005, 19, 1261–1276. [Google Scholar] [CrossRef]
  42. Cloutier, V.; Lefebvre, R.; Therrien, R.; Savard, M.M. Multivariate Statistical Analysis of Geochemical Data as Indicative of the Hydrogeochemical Evolution of Groundwater in a Sedimentary Rock Aquifer System. J. Hydrol. 2008, 353, 294–313. [Google Scholar] [CrossRef]
  43. Belkhiri, L.; Boudoukha, A.; Mouni, L.; Baouz, T. Multivariate Statistical Characterization of Groundwater Quality in Ain Azel Plain, Algeria. Afr. J. Environ. Sci. Technol. 2010, 4, 526–534. [Google Scholar]
  44. Murtazin, Y.; Kulagin, V.; Mirlas, V.; Anker, Y.; Rakhimov, T.; Onglassynov, Z.; Rakhimova, V. Integrated Assessment of Groundwater Quality for Water-Saving Irrigation Technology (Western Kazakhstan). Water 2025, 17, 1232. [Google Scholar] [CrossRef]
  45. Yang, N.; Song, X.; Hou, E.; Wang, G.; Guo, L. Unraveling Hydrochemical Formation and Evolution Mechanism of River Water and Groundwater in an Arid Inland River Basin (Northwest China): A Multi-Technique Approach. J. Hydrol. Reg. Stud. 2025, 62, 102843. [Google Scholar] [CrossRef]
  46. Cotellucci, A.; Garcia-Ruiz, J.-M.; Otálora, F.; Canals, À.; Bruno, M.; Wehrung, Q.; Pellegrino, L.; Aquilano, D.; Pastero, L. Gypsum Crystals Formed by the Anhydrite–Gypsum Transformation at Low Temperatures: Implications for the Formation of the Geode of Pulpí. Minerals 2024, 14, 1074. [Google Scholar] [CrossRef]
  47. Haj, R.A.; Merheb, M.; Halwani, J.; Ouddane, B. Baseline Hydro-Geochemical Characteristics of Groundwater in Abu Ali Watershed (Northern Lebanon). J. Hydrol. Reg. Stud. 2025, 57, 102135. [Google Scholar] [CrossRef]
  48. Apaydin, A. Effects of the Adjacent Evaporitic Formations on Groundwater Quality of Alluvial Sand–Gravel Aquifers: A Study in the Derincay Basin (North-Central Turkey). Environ. Earth Sci. 2016, 75, 573. [Google Scholar] [CrossRef]
  49. Mejri, S.; Chekirbene, A.; Tsujimura, M.; Boughdiri, M.; Mlayah, A. Tracing Groundwater Salinization Processes in an Inland Aquifer: A Hydrogeochemical and Isotopic Approach in Sminja Aquifer (Zaghouan, Northeast of Tunisia). J. Afr. Earth Sci. 2018, 147, 511–522. [Google Scholar] [CrossRef]
  50. Zhang, B.; Zhao, D.; Zhou, P.; Qu, S.; Liao, F.; Wang, G. Hydrochemical Characteristics of Groundwater and Dominant Water–Rock Interactions in the Delingha Area, Qaidam Basin, Northwest China. Water 2020, 12, 836. [Google Scholar] [CrossRef]
  51. Rajmohan, N.; Elango, L. Identification and Evolution of Hydrogeochemical Processes in the Groundwater Environment in an Area of the Palar and Cheyyar River Basins, Southern India. Environ. Geol. 2004, 46, 47–61. [Google Scholar] [CrossRef]
  52. Reiss, A.G.; Gavrieli, I.; Rosenberg, Y.O.; Reznik, I.J.; Luttge, A.; Emmanuel, S.; Ganor, J. Gypsum Precipitation Under Saline Conditions: Thermodynamics, Kinetics, Morphology, and Size Distribution. Minerals 2021, 11, 141. [Google Scholar] [CrossRef]
  53. Vinnarasi, F.; Srinivasamoorthy, K.; Saravanan, K.; Gopinath, S.; Prakash, R.; Ponnumani, G.; Babu, C. Chemical Weathering and Atmospheric Carbon Dioxide (CO2) Consumption in Shanmuganadhi, South India: Evidences from Groundwater Geochemistry. Environ. Geochem. Health 2021, 43, 771–790. [Google Scholar] [CrossRef]
  54. Malki, M.; Bouchaou, L.; Hirich, A.; Ait Brahim, Y.; Choukr-Allah, R. Impact of Agricultural Practices on Groundwater Quality in Intensive Irrigated Area of Chtouka-Massa, Morocco. Sci. Total Environ. 2017, 574, 760–770. [Google Scholar] [CrossRef]
  55. Belkendil, A.; Habi, M.; Yakhlefoune, M.; Sarra, A.; Mekkaoui, A.; Tariq, A.; Jemai, S.; Zeghmar, A.; Bougrine, H.; Zouidi, M.; et al. Integrated GIS-Based Approach for Groundwater Potential Mapping in Arid Regions: A Case Study of Kenadsa-Bechar Using AHP and Frequency Ratio Methods. Groundw. Sustain. Dev. 2025, 30, 101461. [Google Scholar] [CrossRef]
  56. Niyazi, B.A.M.; Rajmohan, N.; Masoud, M.H.Z.; Alqarawy, A.M.; Elfeki, A.; Rashed, M. Hydrochemistry and Its Relationship with Groundwater Flow and Geology in Al Madinah Al Munawarah Province, Kingdom of Saudi Arabia. J. Hydrol. Reg. Stud. 2023, 47, 101437. [Google Scholar] [CrossRef]
  57. Mansouri, Z.; Dinar, H.; Belkendil, A.; Bakelli, O.; Drias, T.; Assadi, A.A.; Khezami, L.; Mouni, L. Integrated Groundwater Quality Assessment for Irrigation in the Ras El-Aioun District: Combining IWQI, GIS, and Machine Learning Approaches. Water 2025, 17, 1698. [Google Scholar] [CrossRef]
  58. Wang, H.-Y.; Guo, H.-M.; Xiu, W.; Bauer, J.; Sun, G.-X.; Tang, X.-H.; Norra, S. Indications That Weathering of Evaporite Minerals Affects Groundwater Salinity and As Mobilization in Aquifers of the Northwestern Hetao Basin, China. Appl. Geochem. 2019, 109, 104416. [Google Scholar] [CrossRef]
  59. Kopittke, P.M.; So, H.B.; Menzies, N.W. Effect of Ionic Strength and Clay Mineralogy on Na–Ca Exchange and the SAR–ESP Relationship. Eur. J. Soil Sci. 2006, 57, 626–633. [Google Scholar] [CrossRef]
  60. Zheng, J.; Guo, X.; Cai, Y.; Liu, J.; Wang, D.; Gao, X.; Tan, B. Source Apportionment and Health Risks of Nitrate Pollution in Shallow Groundwater in the Agricultural Northern Xiaoxing’ an Mountains Region of China. J. Hydrol. Reg. Stud. 2025, 59, 102394. [Google Scholar] [CrossRef]
  61. Escolero, O.; Marín, L.E.; Steinich, B.; Pacheco, J.A.; Molina-Maldonado, A.; Anzaldo, J.M. Geochemistry of the Hydrogeological Reserve of Mérida, Yucatán, Mexico. Geofísica Int. 2005, 44, 301–314. [Google Scholar] [CrossRef]
  62. Debnath, P.; Biswas, A.; Chaudhuri, P.; Mitra, S. Assessment of Hydro-Chemical Characteristics and Pollution Status in Rudrasagar Lake Ecosystem Integrating Pollution Indices and Geospatial Techniques: A Framework for Sustainable Wetland Management. Clean. Water 2025, 4, 100142. [Google Scholar] [CrossRef]
  63. Nadjet, Z.; Abdelmonem, M.; Badra, A.; Lakhder, S.; Issam, Z.; Abderrahmane, K.; Nabil, M.; Salim, K.; Boualem, R. Multivariate Analysis of Groundwater Quality Using PCA and HAC: Geochemical Controls on Mineralization, Nitrification, and Pollutant Dynamics in Southeastern Arid Region of Algeria. Desalination Water Treat. 2025, 324, 101463. [Google Scholar] [CrossRef]
  64. El Mountassir, O.; Bahir, M. The Assessment of the Groundwater Quality in the Coastal Aquifers of the Essaouira Basin, Southwestern Morocco, Using Hydrogeochemistry and Isotopic Signatures. Water 2023, 15, 1769. [Google Scholar] [CrossRef]
  65. Sin, E.; Ahn, I.-Y.; Park, S.; Kim, T. Effects of Low pH and Low Salinity Induced by Meltwater Inflow on the Behavior and Physical Condition of the Antarctic Limpet, Nacella Concinna. J. Mar. Sci. Eng. 2020, 8, 822. [Google Scholar] [CrossRef]
  66. Guo, S.; Brück, H.; Sattelmacher, B. Effects of Supplied Nitrogen Form on Growth and Water Uptake of French Bean (Phaseolus vulgaris L.) Plants. Plant Soil 2002, 239, 267–275. [Google Scholar] [CrossRef]
  67. Masmoudi, T.; Benakcha, M.; Abdennour, M.A.; Bouzekri, A.; Amrane, A.; Alcala, F.J. Groundwater Quality Evaluation for Drinking and Agricultural Purposes. A Case Study in Semi-Arid Region (Zab El-Gharbi SE-Algeria). Desalination Water Treat. 2024, 319, 100476. [Google Scholar] [CrossRef]
  68. El Khalki, S.; Ghalit, M.; Elbarghmi, R.; Azzaoui, K.; Jodeh, S.; Hanbali, G.; Lamhamdi, A. Identification of Hydrochemical Processes of Groundwater in Nekor-Ghiss Plain (Morocco): Using the Application of Multivariate Statistics and Geographic Information Systems (GIS) to Map Groundwater. Appl. Water Sci. 2024, 14, 166. [Google Scholar] [CrossRef]
  69. Kazakis, N.; Stavropoulou, V.; Ntona, M.M.; Pouliaris, C.; Papailiopoulou, M.; Nanou, E.-A.; Tsoutanis, A.; Lambropoulou, D.; Zagana, E. Hydrochemical Variability in Karst Hypothermal Mineral Springs of Greece. Hydrology 2025, 12, 237. [Google Scholar] [CrossRef]
  70. Abdelbaki, H.; Belkendil, A.; Maazouzi, A.; Mekkaoui, A. Assessment of Hydrochemical Properties of Groundwater in the Alluvial Aquifer of the Arid Zone of the Igli Region, South-West of Algeria. Desalination Water Treat. 2022, 268, 153–169. [Google Scholar] [CrossRef]
  71. Abdellah, A.; Boualem, B.; Aziez, Z.; Mokhtar, K. Groundwater Geochemical and Quality of the Continental Intercalary Aquifer in Béni Ounif (Southwest Algeria). J. Ecol. Eng. 2022, 23, 1–12. [Google Scholar] [CrossRef]
  72. Uliana, M.M.; Sharp, J.M. Tracing Regional Flow Paths to Major Springs in Trans-Pecos Texas Using Geochemical Data and Geochemical Models. Chem. Geol. 2001, 179, 53–72. [Google Scholar] [CrossRef]
  73. Saberinasr, A.; Morsali, M.; Hashemnejad, A.; Hassanpour, J. Determining the Origin of Groundwater Elements Using Hydrochemical Data (Case Study: Kerman Water Conveyance Tunnel). Environ. Earth Sci. 2019, 78, 198. [Google Scholar] [CrossRef]
  74. Merzougui, T. Structure et Fonctionnement D’un Système Aquifère en Zone Hyperaride: Application à la Haute Vallée de la Saoura (Région de Béni-Abbès). Ph.D. Thesis, University of Abou Bekr Belkaid, Tlemcen, Algeria, 2021. [Google Scholar]
  75. Thomas, B.; Behrangi, A.; Famiglietti, J. Precipitation Intensity Effects on Groundwater Recharge in the Southwestern United States. Water 2016, 8, 90. [Google Scholar] [CrossRef]
  76. Hakimi, Y.; Orban, P.; Deschamps, P.; Brouyere, S. Hydrochemical and Isotopic Characteristics of Groundwater in the Continental Intercalaire Aquifer System: Insights from Mzab Ridge and Surrounding Regions, North of the Algerian Sahara. J. Hydrol. Reg. Stud. 2021, 34, 100791. [Google Scholar] [CrossRef]
  77. Kebbach, R.; Boulabeiz, M.; Sedrati, A.; Houha, B. The Study of Groundwater Salinization Mechanisms: A Case Study of the Remila Basin, Northeastern Algeria. J. Environ. Res. Eng. Manag. 2025, 81, 134–146. [Google Scholar] [CrossRef]
  78. Liu, J.; Han, G.; Liu, M.; Zeng, J.; Liang, B.; Qu, R. Distribution, Sources and Water Quality Evaluation of the Riverine Solutes: A Case Study in the Lancangjiang River Basin, Tibetan Plateau. Int. J. Environ. Res. Public Health 2019, 16, 4670. [Google Scholar] [CrossRef]
  79. Dhaoui, Z.; Zouari, K.; Taupin, J.-D.; Farouni, R. Hydrochemical and Isotopic Investigations as Indicators of Recharge Processes of the Continental Intercalaire Aquifer (Eastern Piedmont of Dahar, Southern Tunisia). Environ. Earth Sci. 2016, 75, 1186. [Google Scholar] [CrossRef]
  80. Saeed, O.; Székács, A.; Mörtl, M.; Jordán, G.; Lameck, A.S.; Al-Mashreki, M.H.; Abukhadra, M.R.; El-Sherbeeny, A.M.; Szűcs, P.; Eid, M.H. Hydrochemical Evaluation and Risk Assessment of the Danube River, Hungary Using Canadian Indices, Geochemical Modeling, and Simulation Techniques. Environ. Earth Sci. 2025, 84, 603. [Google Scholar] [CrossRef]
  81. Elsayed, A.; Eissa, M.A.; Mohallel, S.A.; Mohamed, E.A.; Szűcs, P.; Eid, M.H. Integrating Machine Learning, Inverse Mixing Model, and Stable Isotopes to Delineate Sea Water Intrusion and Aquifer Recharge Origin, Delta Watir, South Sinai, Egypt. J. Hydrol. Reg. Stud. 2025, 62, 102835. [Google Scholar] [CrossRef]
  82. Carol, E.S.; Kruse, E.E.; Laurencena, P.C.; Rojo, A.; Deluchi, M.H. Ionic Exchange in Groundwater Hydrochemical Evolution. Study Case: The Drainage Basin of El Pescado Creek (Buenos Aires Province, Argentina). Environ. Earth Sci. 2012, 65, 421–428. [Google Scholar] [CrossRef]
  83. Krishan, G.; Sejwal, P.; Bhagwat, A.; Prasad, G.; Yadav, B.K.; Kumar, C.P.; Kansal, M.L.; Singh, S.; Sudarsan, N.; Bradley, A.; et al. Role of Ion Chemistry and Hydro-Geochemical Processes in Aquifer Salinization—A Case Study from a Semi-Arid Region of Haryana, India. Water 2021, 13, 617. [Google Scholar] [CrossRef]
  84. Wu, J.; Hu, H.; Zhao, S.; Li, Y.; Zhao, K.; Zhang, M.; Ding, B. Comparative Study on Cation Adsorption and Thermodynamic Characteristics of Clay Minerals in Electrolyte Solutions. Surfaces 2025, 8, 90. [Google Scholar] [CrossRef]
  85. Xing, L.; Huang, L.; Yang, Y.; Xu, J.; Zhang, W.; Chi, G.; Hou, X. The Blocking Effect of Clay in Groundwater Systems: A Case Study in an Inland Plain Area. Int. J. Environ. Res. Public Health 2018, 15, 1816. [Google Scholar] [CrossRef] [PubMed]
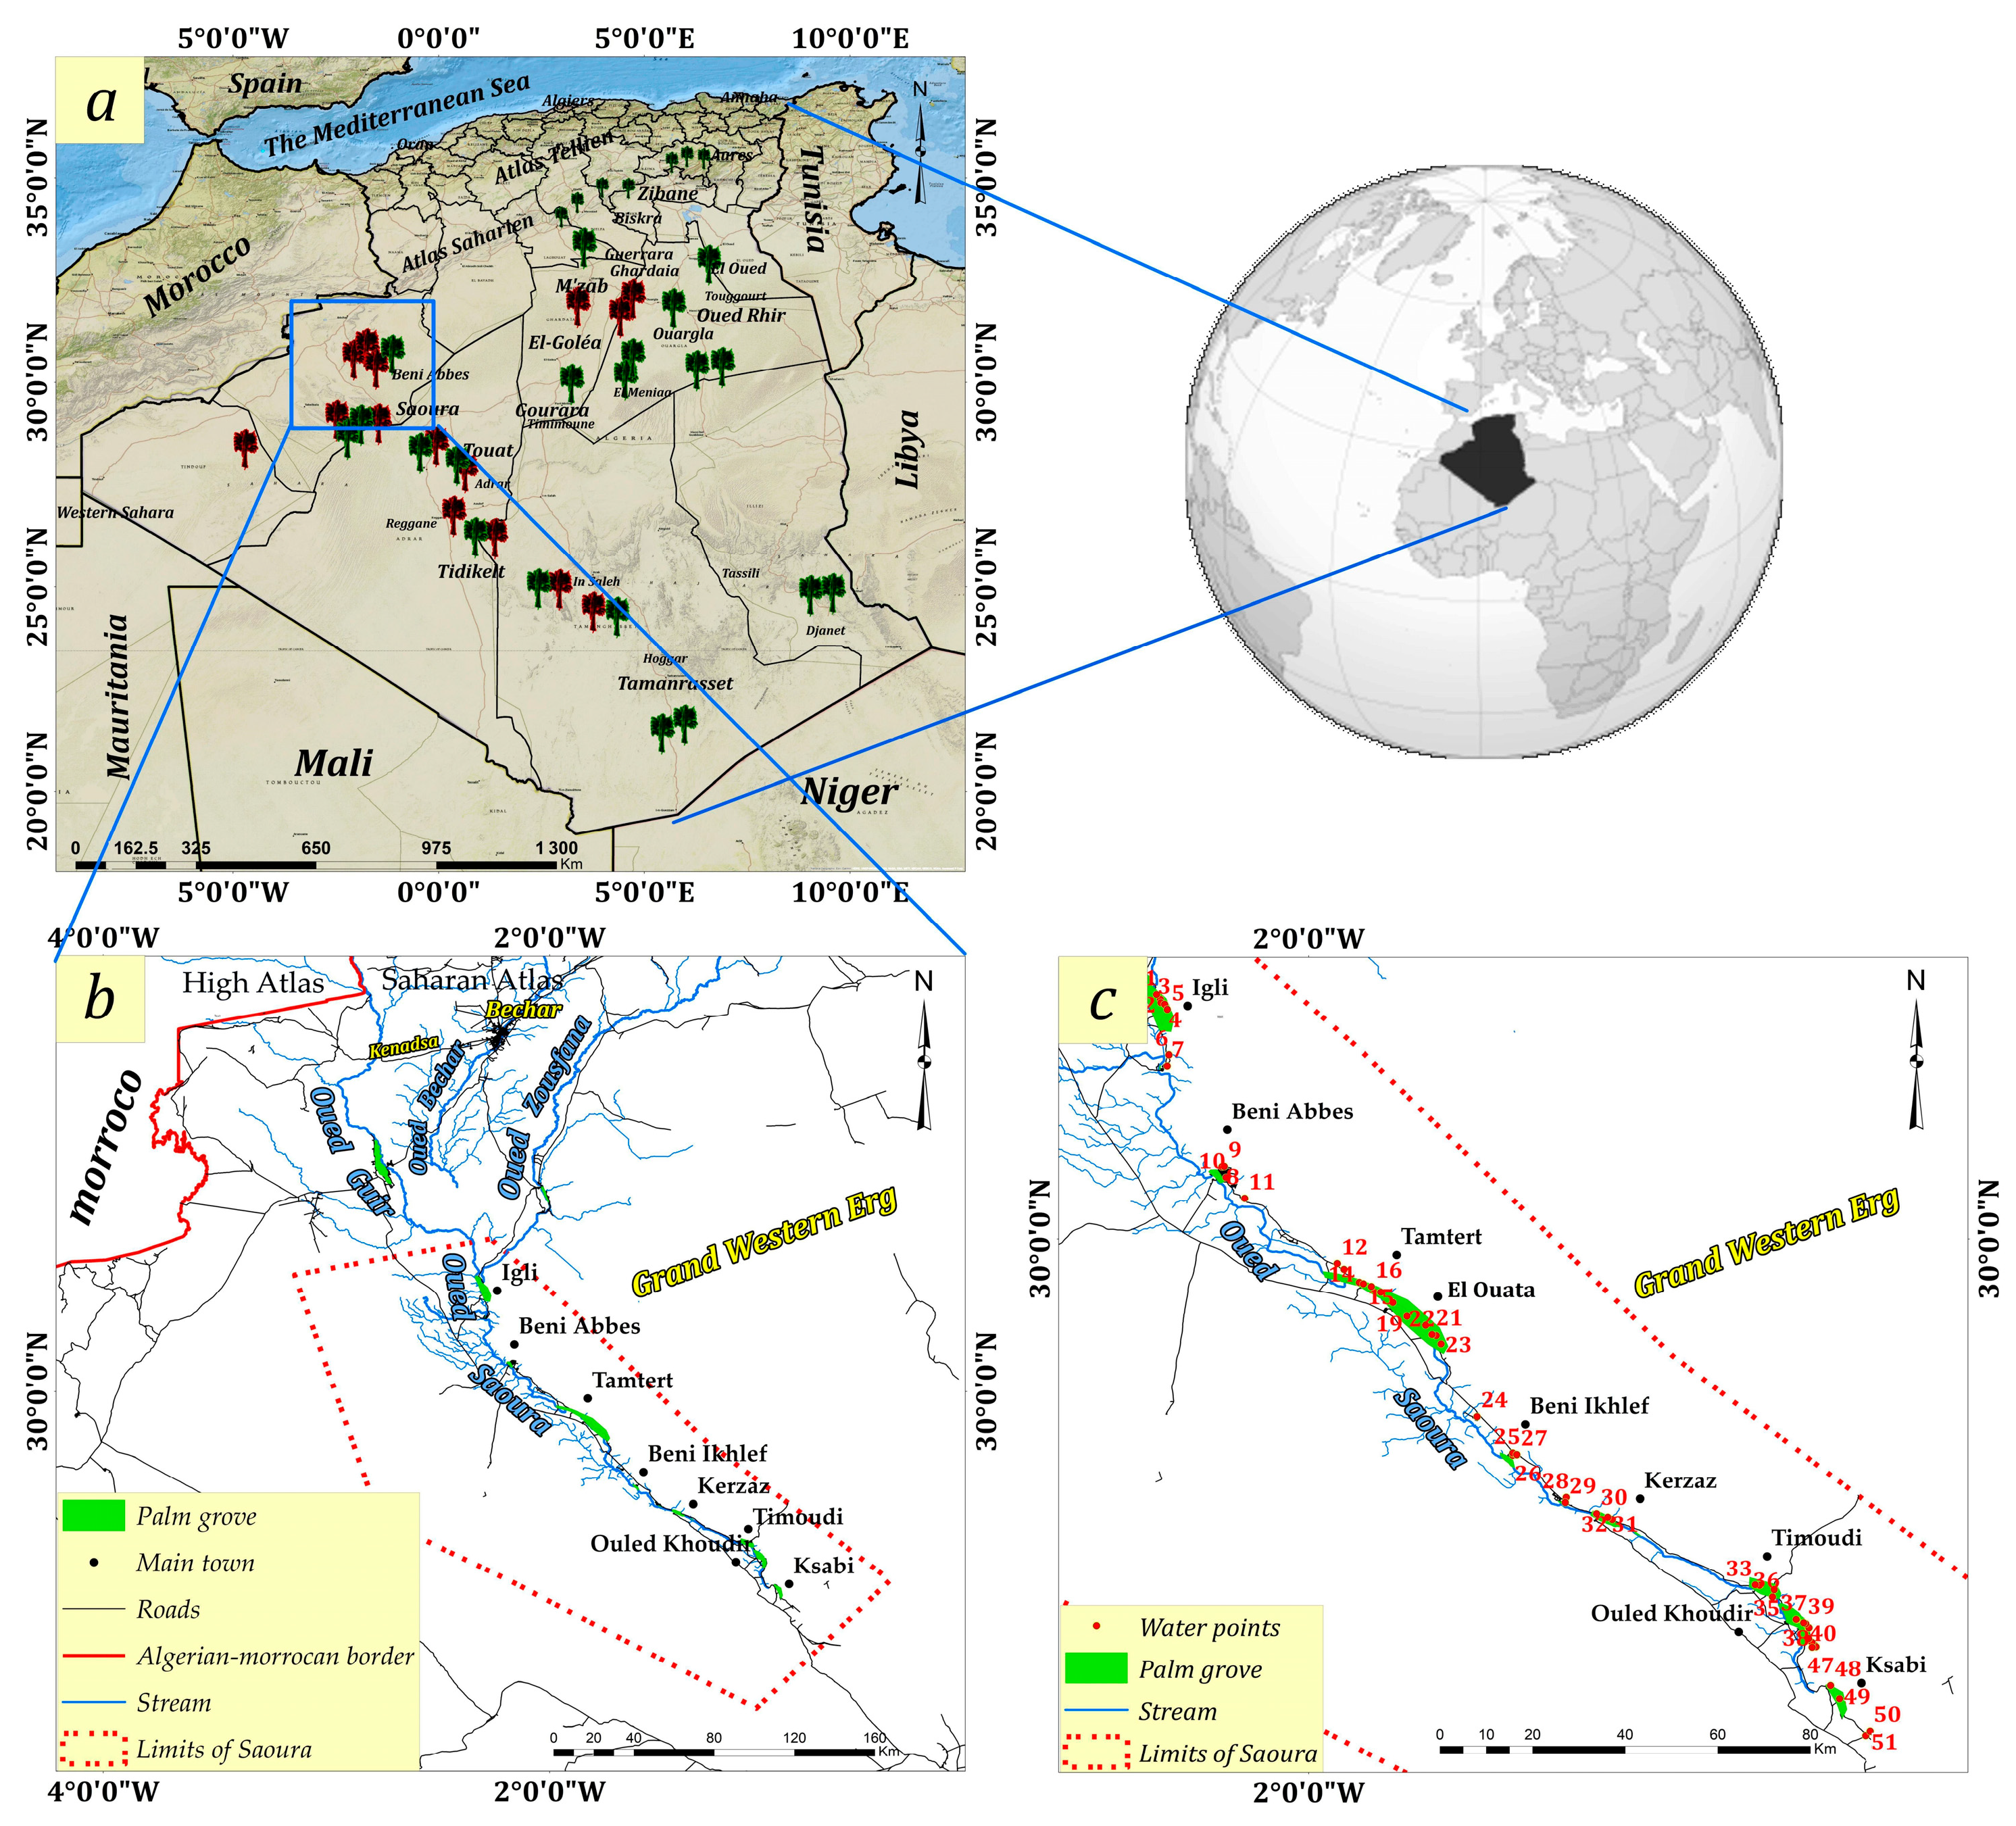
Figure 1. (a) Distribution of oases in Algeria. Those in red are bayoud-infested; those in green are not infested [25]. (b) Geographical location of the Saoura Valley. (c) Distribution of water samples.
Water 18 00831 g001
Figure 2. Geological map of the Saoura Valley taken from ageological map of Morocco at a 1/1,000,000 scale, 1985 [26].
Water 18 00831 g002
Figure 3. Design of the hydrogeological system of the Saoura Valley [29].
Water 18 00831 g003
Figure 4. Cation–anion balance of Saoura groundwater samples.
Water 18 00831 g004
Figure 5. Piper trilinear diagram of groundwater samples from Saoura oases.
Water 18 00831 g005
Figure 6. Gibbs diagrams illustrating the dominant mechanisms controlling groundwater hydrochemistry in the study area: (a) Na+/(Na+ + Ca2+) versus total dissolved solids (TDS), and (b) Cl/Cl + HCO3) versus total dissolved solids (TDS).
Water 18 00831 g006
Figure 7. Correlation matrix of groundwater chemical elements.
Water 18 00831 g007
Figure 8. Biplot of the principal component analysis displaying the loadings of the initial two components and the corresponding arrangement of the sampling locations.
Water 18 00831 g008
Figure 9. Dendrograms showing the clustering of variables.
Water 18 00831 g009
Figure 10. Dendrogram of groundwater samples.
Water 18 00831 g010
Figure 11. Bivariate plots of major ion ratios for the Saoura groundwater samples. Dashed black lines represent the 1:1 equiline, corresponding to theoretical mineral dissolution stoichiometries. In the carbonate and dolomite plots, the dotted red lines represent the 1:2 trajectory, reflecting the specific stoichiometry of bicarbonate production during dissolution.
Water 18 00831 g011
Figure 12. Ion exchange in groundwater samples.
Water 18 00831 g012
Figure 13. Hydro-chemical evolution of the Saoura system.
Water 18 00831 g013
Figure 14. Three main rivers in the Saoura region.
Water 18 00831 g014
Figure 15. Nitrates in groundwater from the Saoura.
Water 18 00831 g015
Table 1. Chemical and physical properties of water samples.
SampleOasisT °CpHElectrical Conductivity (EC)
(milliS)
Dry Residue
(DR)
(mg/L)
Ca2+
(mg/L)
Mg2+
(mg/L)
Na+
(mg/L)
K+
(mg/L)
Cl
(mg/L)
SO4
(mg/L)
NO3
(mg/L)
HCO3
(mg/L)
Total Hardness (TH)
(mg/L CaCO3)
Total Alkalinity (TAC)
(mg/L CaCO3)
Ion Balance (%)
Obs1Igli25.37.60.85304242459.11209548119277.898−2.2
Obs226.37.40.7480761635.57907028122255.71002.9
Obs326.17.40.7440761635.8795759122255.71003.5
Obs424.27.40.85008413456651600113263.3932.5
Obs525.97.70.74505921456.81107814125233.8102−1.4
Obs623.17.60.95606716807.61408048107233.2881.20
Obs7Beni Abbès24.37.61.174063161505.22208019183223.2150−0.3
Obs820.57.71.27807616145.58.318518012195255.7160−2.9
Obs925.47.41.28007234124.612.21602759110319.890−0.2
Obs1026.77.60.8510762637.96.61058353119296.8981.7
Obs1124.87.41.170011824606.212020545146393.5120−0.6
Obs12Tamtart23.97.516207221905.412020034104266.385−2.2
Obs1325.37.40.96008424605.7902101.8146308.6120−2.2
Obs1426.67.61.27808021120.96.516024035107286.288−2.9
Obs1531.47.51.7105012226171.83.329523015128411.71051.1
Obs16307.51.69709758133.62.818538021119481.1980.3
Obs1726.17.70.6391591633.53.55010026104213.2851.7
Obs18el Ouata16.27.71.6110011424194.47.615038575125383.51022.6
Obs1919.67.51.280084509011.814828053113415.793−0.7
Obs2025.57.70.9560842443.65.911611035107308.6882.1
Obs2121.37.81.17108024105.87.910026025156298.6128−1.9
Obs2224.27.61.16703447107.67.910026021140278.4115−1.9
Obs2324.37.816208418856.710818026146283.9120−0.3
Obs24Beni Yakhlef24.47.70.53504613402.7607017125168102−2.8
Obs25247.60.5340461332.53502830156168128−1.8
Obs2624.87.60.534059528.92.260305976167.9621.7
Obs2725.17.60.63804613372.2545035122168100−0.9
Obs28Kerzaz25.97.80.5300425402.470501482125.567−3.1
Obs2922.97.70.529042531.46.85060379125.5650.6
Obs3025.87.50.428038529.42.133502192115.575−2.4
Obs3120.97.40.5340511331.42.458654070180.9572.7
Obs32Timoudi26.77.70.53203816322.3354523137160.81121.3
Obs3317.47.50.53404611342.2404031125160.21022.5
Obs3423.27.83.120002577426010.73959254037946.530−1.8
Obs3526.27.80.7430678503801201582200.267−0.7
Obs36Ouled Khoudéir19.37.71600632110611.2722401.3162243.81330.4
Obs3723.87.71.1730633911510.28631025156317.9128−0.9
Obs38247.60.74306313456.27013025104210.985−3.5
Obs3924.57.70.64105918408.5631209113221.5930.9
Obs4020.87.53.11945168953354753062085110810.7901.5
Obs4125.87.43.11950181111300425306506092909752.1
Obs4222.67.53.3215017397391.244.962062080101831.4832.1
Obs4327.37.73188012284326.945.35006408595650.678−3.3
Obs4426.47.72.415008489247.151.338047077.5110576.3900.1
Obs4526.67.42.61640126105247.851.34704707576747622.9
Obs4626.47.61.711601054517046.12802607082447.5675.2
Obs4720.47.61.2115013534209.212.832030065110477.1902.3
Obs48Ksabi267.81.27408442958.51422802125382.71020.4
Obs4921.87.61600802949.15.5851985125319.21020.1
Obs5021.77.61.28005439150.410.5963303168295.41381.4
Obs5126.17.71.2790633713010.48031011214309.7175−1.1
Table 2. Principal component loadings and the proportion of variance explained by the five rotated components using Kaiser-normalized varimax rotation.
PC1PC2PC3PC4PC5
T0.010−0.094−0.0440.978−0.054
pH−0.0530.0440.986−0.045−0.107
EC0.967−0.084−0.0190.0340.209
DR0.970−0.085−0.025−0.0110.216
Ca0.890−0.279−0.108−0.116−0.097
Mg0.885−0.052−0.0770.1280.307
Na0.9330.0310.025−0.0470.271
K0.711−0.069−0.0190.1250.610
Cl0.903−0.130−0.0780.0810.312
SO40.961−0.1010.057−0.0750.026
NO30.378−0.301−0.200−0.1790.736
HCO3−0.1270.9770.027−0.052−0.106
TH0.961−0.175−0.1000.0120.122
TAC−0.1260.9770.031−0.064−0.102
Disclaimer/Publisher’s Note: The statements, opinions and data contained in all publications are solely those of the individual author(s) and contributor(s) and not of MDPI and/or the editor(s). MDPI and/or the editor(s) disclaim responsibility for any injury to people or property resulting from any ideas, methods, instructions or products referred to in the content.