Article

Nonstationary Runoff Evolution and Structural Regime Shifts in Cold-Region Plateau Rivers Under Climate Change


Key Laboratory of Integrated Regulation and Resource Development on Shallow Lakes, Ministry of Education, College of Environment, Hohai University, Nanjing 210098, China
*
Authors to whom correspondence should be addressed.
Water 2026, 18(7), 816; https://doi.org/10.3390/w18070816
Submission received: 6 February 2026 / Revised: 24 March 2026 / Accepted: 26 March 2026 / Published: 30 March 2026
(This article belongs to the Section Water and Climate Change)

Abstract

As key headwater regions of the upper Yangtze River, the Yalong and Dadu River basins are expected to experience highly uncertain hydrological responses under climate warming. However, the nonlinear and spatially heterogeneous evolution of streamflow across multiple time-frequency scales remains insufficiently understood. In this study, a SWAT model driven by CMIP6 climate projections under four shared socioeconomic pathways (SSP1-2.6 to SSP5-8.5) was coupled with multivariate wavelet coherence, spatial wavelet transform, and change-point detection methods to investigate the spatiotemporal evolution of streamflow and extreme risks during 2017–2100. Results indicate that precipitation is the primary driver of streamflow variability, with streamflow responding rapidly, while air temperature mainly regulates seasonal intensity via snowmelt. Streamflow seasonal intensity exhibits a northwest-southeast gradient, with low variability upstream and high sensitivity downstream, reflecting precipitation-concentrated, forested canyons where rapid lateral flow and dry-season evapotranspiration amplify flow contrasts. Moreover, hydrological nonstationarity and extreme risks are projected to intensify, with structural regime shifts emerging in the 2040s–2050s and extreme high-flow magnitudes doubling under SSP5-8.5, accompanied by more frequent drought-flood alternations. These findings highlight an upstream buffering-downstream sensitivity pattern, emphasizing the need for spatially differentiated water resources management under nonstationary climate conditions.

1. Introduction

Climate change is altering the global hydrological cycle at an unprecedented rate, primarily manifested by intensified precipitation variability and accelerated cryospheric degradation [1]. High-elevation mountain regions, often referred to as the “water towers of the world,” are particularly sensitive to climate perturbations due to their complex topography and cryosphere-dominated hydrological processes [2]. As headwater regions of the Yangtze River, the Yalong River and Dadu River basins play a critical role in sustaining downstream water security, hydropower production, and ecological stability in China. However, under future climate warming, hydrological responses in these basins are becoming increasingly nonstationary and extreme, posing substantial challenges to regional water resources management and infrastructure safety [3]. In recent years, extreme climate events have caused severe impacts across many regions worldwide. Persistent heat and reduced precipitation in the mid-latitudes of the Northern Hemisphere have triggered severe droughts with large spatial extent, long duration, and high intensity [4]. Notably, an extreme drought occurred in the Yangtze River Basin during the flood season, highlighting the vulnerability of basin-scale hydrological processes under strong radiative forcing [5,6].
Understanding the multiscale spatiotemporal variability of streamflow is fundamental to projecting future water availability and assessing drought and flood risks [7]. Previous studies have widely employed hydrological models driven by global climate models to investigate trends in annual or seasonal streamflow across the Tibetan Plateau [8,9,10]. While these studies have provided valuable insights into changes in the “mean state” of water resources, they often overlook the complex nonlinear and frequency-dependent characteristics embedded in hydrological signals. Streamflow variability is not merely a linear reflection of trends in precipitation or air temperature; rather, it is modulated by multiscale periodic oscillations (e.g., ENSO and monsoon cycles) and land surface processes [11,12]. Conventional time-domain statistical methods, such as the Mann–Kendall test and linear regression, are often inadequate for capturing the localized intermittency and phase relationships inherent in nonstationary hydrological time series [13]. Consequently, under future warming scenarios, the scale-dependent decoupling between streamflow and climatic drivers, as well as the potential shifts in dominant periodicities, remain poorly understood.
In addition, spatial heterogeneity in hydrological sensitivity to climate change within complex mountainous basins has not yet been adequately characterized. The Yalong River and Dadu River basins exhibit pronounced vertical gradients and distinct hydroclimatic zones, ranging from cold, glacier-fed headwaters to monsoon-dominated forested canyon regions downstream [14]. Time-frequency methods, such as wavelet analysis, have been increasingly applied to reveal nonlinear responses among hydroclimatic variables, enabling the investigation of multiscale variability between streamflow and climate drivers within complex time series [15]. However, many existing studies treat entire basins as lumped units or focus primarily on land-use types (e.g., forests versus grasslands), which may overlook how hydroclimatic gradients interact with landscape characteristics to regulate streamflow variability. For instance, the ongoing debate regarding the “sponge effect” of forests versus their enhanced evapotranspiration under climate warming highlights the necessity of spatially explicit analyses to disentangle how different landscapes modulate hydrological signals [16]. Moreover, as the climate system approaches potential tipping points, the transition from regular periodic fluctuations to abrupt shifts and extreme events has emerged as a critical concern [17]. The latest generation of climate models from CMIP6 demonstrates improved accuracy in simulating extreme climate events in regions with complex terrain, thereby providing a more reliable basis for quantifying associated nonstationary risks [18]. However, for complex mountainous basins, an integrated assessment framework that jointly accounts for time-frequency coherence, spatial sensitivity patterns, and the evolution of hydrological extremes is still lacking.
To address the above issues, this study employs a multidimensional analytical framework to systematically evaluate the hydrological responses of the Yalong River and Dadu River basins to future climate change during 2017–2100 under four Shared Socioeconomic Pathways (SSPs). High-resolution runoff series are simulated using a SWAT model driven by CMIP6 climate projections. The specific objectives of this study are to: (1) apply multivariate wavelet coherence analysis to unravel the multiscale time-frequency relationships between streamflow and climatic drivers (precipitation and air temperature), and to identify dominant driving mechanisms as well as phase-leading or lagging relationships; (2) employ spatial wavelet analysis to quantify the spatial heterogeneity of streamflow seasonality and to elucidate the regulatory effects of different underlying surfaces along hydroclimatic gradients; and (3) detect nonstationary change points and assess the evolution of extreme hydrological events (floods and droughts) under different levels of warming. This study aims to provide a process-based understanding of how complex mountainous basins amplify or buffer climatic signals across space and time, thereby offering scientific insights into water resources management and risk mitigation under climate change.

2. Study Area and Data

2.1. Study Area

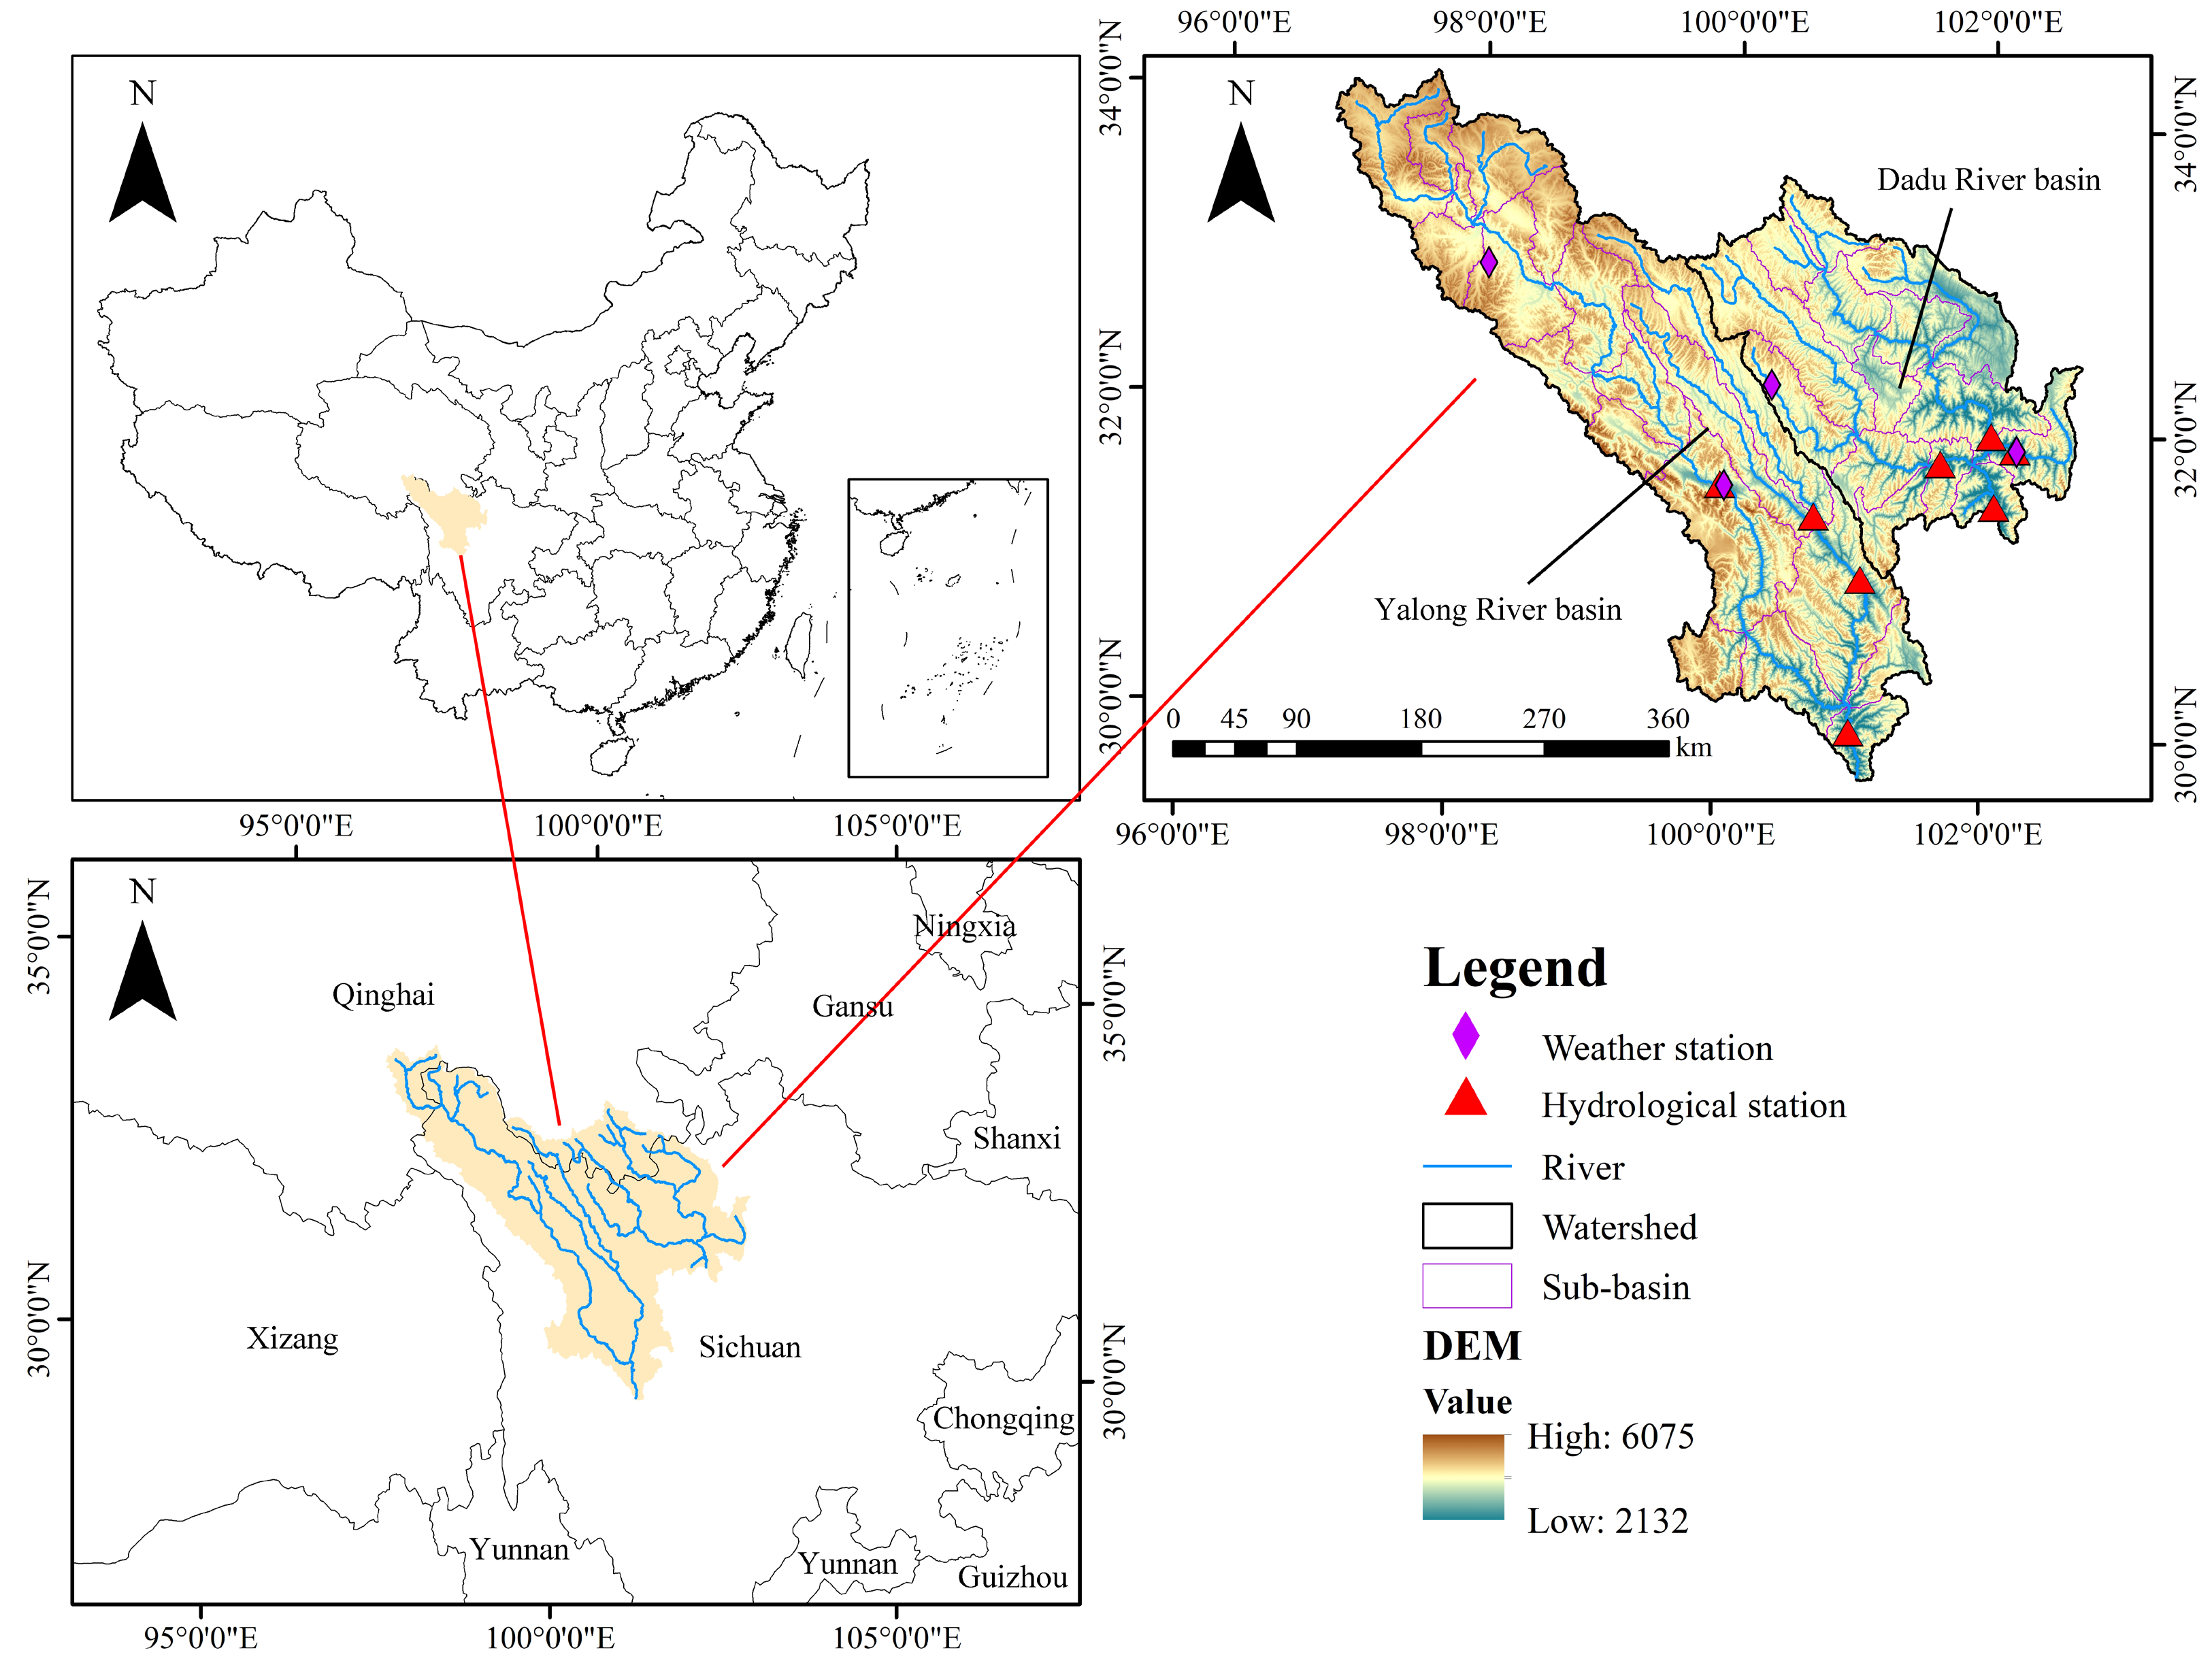
The Yalong River and Dadu River basins exhibit complex climatic conditions spanning plateau and subtropical monsoon climates [19]. The Yalong River basin is located in the southeastern Tibetan Plateau and belongs to the western Sichuan Plateau climatic zone, characterized by distinct wet and dry seasons. The main stem of the Yalong River is approximately 1300 km in length, and the basin covers an area of about 130,000 km2 (Figure 1). Precipitation exhibits pronounced seasonal and spatial heterogeneity, with the majority occurring from June to October and generally higher amounts in the eastern part of the basin than in the western part. Runoff is abundant and predominantly rainfall-driven, with precipitation contributing about 70–80% of total streamflow. The long-term mean discharge at the basin outlet is 1890 m3 s−1, corresponding to an annual streamflow volume of 5.96 × 10¹⁰ m3 [20,21,22].
The Dadu River, the largest tributary of the Min River system in the Yangtze River basin, has a mainstem length of 1062 km, a natural elevation drop of 4175 m, and an annual streamflow volume of 4.70 × 10¹⁰ m3 (Figure 1). The long-term mean air temperature in the headwater regions ranges from −4.3 to 12.6 °C, decreasing from south to north. Most areas experience mean temperatures between 0 and 10 °C, while the coldest conditions occur in the upper Yalong River basin near the Tibetan Plateau. In both basins, air temperature increases downstream, reaching 9.2–12.6 °C near the confluences of the Lianghekou and the Shuangjiangkou region, which represent the warmest zones within the headwater areas [19].

2.2. Data Sources

The multi-source datasets collected in this study and their basic information are summarized in Table 1, including topography, land use, soil properties, meteorological data, hydrological observations, and river network spatial data. These datasets were used to construct a distributed hydrological model, which was subsequently calibrated and validated, and then applied to simulate future hydrological processes in the study area.

3. Methods

This study primarily employed a calibrated Soil and Water Assessment Tool (SWAT) model to simulate runoff processes under future climate conditions. Wavelet Coherence analysis (WTC) was applied to identify the scale-dependent control of climate drivers and the influence of land use on runoff dynamics. Change-point detection and clustering analyses were subsequently used to identify hydrological regime shifts and persistence characteristics.

3.1. Hydrological Model Construction

The SWAT model is a physically based, semi-distributed watershed hydrological model designed to simulate hydrological processes, sediment transport, and nutrient cycling at the basin scale [23]. SWAT subdivides a watershed into multiple sub-basins, which are further discretized into hydrologic response units, allowing the model to explicitly account for the effects of topography, soil properties, land use, and management practices on hydrological processes [24,25]. Owing to its robustness and flexibility, SWAT has been widely applied in watershed water resources management, agricultural planning, non-point source pollution control, and assessments of climate change impacts [24,26,27,28]. Prior to runoff simulation, extensive model calibration and validation are required to ensure model reliability. Model performance is commonly evaluated using the coefficient of determination (R2) and the Nash-Sutcliffe Efficiency (NSE) [29,30]. The mathematical formulations of these two performance metrics are provided in Equations (1) and (2) [31]:
R 2 = i = 1 n Q o i Q o a v g Q s i Q s a v g 2 i = 1 n Q o i Q o a v g 2 i = 1 n Q s i Q s a v g 2
N S E = 1 i = 1 n Q o i Q s i 2 i = 1 n Q o i Q o a v g 2
where Q o i denotes the observed discharge, Q s i represents the simulated discharge, Q s a v g is the mean observed discharge, Q o a v g denotes the mean simulated discharge, and n is the number of samples.

3.2. Model Calibration and Validation

A total of eight hydrological stations is available within the study area. Observed discharge data from these stations were used to perform multi-site, simultaneous calibration and validation of the SWAT model using the SUFI-2 (Sequential Uncertainty Fitting, Version 2) algorithm implemented in the SWAT-CUP framework. The years 2004 and 2005 were designated as the model warm-up period. The calibration period for the Dadu River Basin was 2007–2014, whereas that for the Yalong River Basin was initially 2006–2014. Owing to missing observations at the Ganzi hydrological station in 2008, monthly mean discharge data from 2009–2016 were used for model calibration, and data from 2017–2019 were used for validation. The key adjusted parameters and their adopted values are summarized in the Supplementary Material Table S1 and Figure S1.
The calibration and validation results indicate good agreement between simulated and observed discharge. The calibration and validation results indicate good agreement between simulated and observed discharge, with R2 values of 0.78–0.90 and NSE values of 0.53–0.85 during calibration, and R2 values of 0.82–0.94 and NSE values of 0.72–0.93 during validation (Table 2). Overall, the SWAT model established for the study area demonstrates satisfactory performance and strong applicability.

3.3. Bias Correction of Future Climate Projections

Based on previous assessments of future climate patterns in the study region, EC-Earth3 and MRI-ESM2-0 exhibit the best simulation performance [32]. Therefore, this study adopts a multi-model ensemble mean of selected Global Climate Models (GCM), including EC-Earth3 and MRI-ESM2-0, to generate future climate inputs for the SWAT model. The climate variables considered include precipitation, daily maximum temperature, and daily minimum temperature. However, GCM generally have coarse spatial resolutions (approximately 100 km) and exhibit substantial biases relative to observed data [33]. To address the issues of coarse resolution and systematic bias in GCM outputs, the quantile delta mapping method was employed for statistical downscaling and bias correction [33,34].

3.4. Identification of Streamflow Regime Shifts and Extreme Events

In this study, a moving-window Z-test, the Pettitt test [35], and the Buishand test [36] were jointly applied to detect streamflow regime shifts, with the combination of these complementary statistical methods aimed at improving the accuracy and robustness of change-point identification. The DBSCAN (Density-Based Spatial Clustering of Applications with Noise) algorithm was employed not only to identify extreme months but also to cluster temporally adjacent extreme events into coherent extreme-event groups, corresponding to high-flow and low-flow periods [37]. Prior to the change-point analysis, the streamflow time series were preprocessed, including standardization of the time-series format and calculation of rolling statistics (12-month moving mean and standard deviation) to characterize the long-term variability of the streamflow series. Since the data used in this study were continuous streamflow sequences simulated by the SWAT model, no missing values were observed, and therefore no actual data interpolation was performed. The moving-window mean-difference Z-test was first used to preliminarily identify local abrupt changes in the statistical characteristics of streamflow. A moving-window Z-test based on mean differences was first applied to preliminarily detect local changes in the statistical characteristics of the streamflow series. The nonparametric Pettitt rank test was then used to assess the significance of single change points, followed by the Buishand test to further verify the presence of mean shifts. By integrating the detection results from these three methods, the robustness and reliability of change-point identification were substantially enhanced [38]. For the identification of extreme hydrological events, fixed thresholds at the 95% and 5% percentiles of the full-period streamflow series under each simulation scenario were used to detect high- and low-flow events, respectively. This approach ensures a consistent definition of extreme events under long-term climate change, allowing analysis of duration, intensity, and trends. The DBSCAN algorithm was subsequently applied to perform temporal clustering of these extremes, allowing the identification of consecutive extreme-event clusters (i.e., high-flow and low-flow periods) and thereby revealing the tendency of extreme events to occur in clusters. Finally, extreme hydrological events were quantitatively evaluated across multiple dimensions, including event frequency, duration, relative intensity, and clustering characteristics. A multi-scenario comparative analysis was conducted to elucidate the change-point patterns and evolutionary trajectories of extreme events in streamflow series under different climate scenarios.

3.5. Wavelet Coherence Analysis

To investigate the lagged responses of streamflow to variations in temperature and precipitation across multiple time scales, and to quantify the time-frequency characteristics of climate-runoff co-variability, WTC was employed to examine the time-frequency correlations between runoff and climatic variables. Phase angles were further calculated to determine lead-lag relationships between climate drivers and runoff.
Wavelet Transform (WT) is an effective signal-processing technique that enables joint analysis in the time and frequency domains, and it has been widely applied in hydroclimatic studies for identifying variability patterns, detecting trends, and improving time-series prediction [39,40,41]. Wavelet transform can be categorized into two main forms: Continuous Wavelet Transform (CWT) and Discrete Wavelet Transform (DWT) [42]. The core principle of WT lies in its use of a mother wavelet function to perform time-scale localized analysis of a signal. The correlation between the signal and the wavelet function is calculated as follows [43]:
ψ a , b t = a 1 / 2 ψ t b a , a = a 1 , a 2 , , a k 1
where ψ denotes a wavelet function, k is the length of the time series, and a and b are integers controlling the scaling and translation of the wavelet, referred to as the scale parameter (a) and the shift parameter (b), respectively. When these two parameters are sampled continuously, Equation (3) represents the CWT [44].
The WTC is a method for examining the local correlation strength and phase relationships between two time series in the time-frequency domain. It overcomes the limitations of traditional approaches, such as windowed Fourier transform coherence analysis, which rely on fixed window resolutions. By employing variable-length analysis windows, WTC provides high temporal resolution at high frequencies and high frequency resolution at low frequencies. This adaptive property makes WTC particularly well suited for analyzing dynamically evolving relationships in non-stationary signals.
The WTC calculations in this study are primarily based on the classical methods proposed in previous studies [45,46]:
R 2 ( τ , s ) = S ( s 1 ψ x y ( τ , s ) ) 2 S ( s 1 ψ x ( τ , s ) 2 ) S ( s 1 ψ y ( τ , s ) 2 )
where ψ x y ( τ , s ) = ψ x ( τ , s ) ψ y * ( τ , s ) denotes the cross-wavelet power spectrum, τ is the time translation (shift) parameter indicating the position of the wavelet window along the time axis, and s is the scale (dilation) parameter, which is inversely related to the signal’s period or frequency, with larger scales corresponding to lower-frequency, longer-period signals and smaller scales corresponding to higher-frequency, shorter-period signals. S is a smoothing operator applied in both time and scale domains. The smoothing operation is essential, as it prevents spurious instantaneous high coherence values and ensures that the identified coherence structures persist in the time-frequency domain. The R2 ( τ , s ) ranges from 0 to 1. Values approaching 1 indicate strong local correlation between the two series at a given time and scale (frequency), whereas values close to 0 indicate weak or no correlation.
The lead-lag relationship between two sequences is revealed by calculating the phase difference in their wavelet coefficients. The formula for calculating the phase difference is:
ϕ x y ( τ , s ) = tan 1 ( I ( S ( s 1 ψ x y ( τ , s ) ) ) R ( S ( s 1 ψ x y ( τ , s ) ) ) )
where I and R denote the imaginary and real parts of the complex number, respectively.

4. Results

4.1. Streamflow Evolution Under Future Climate

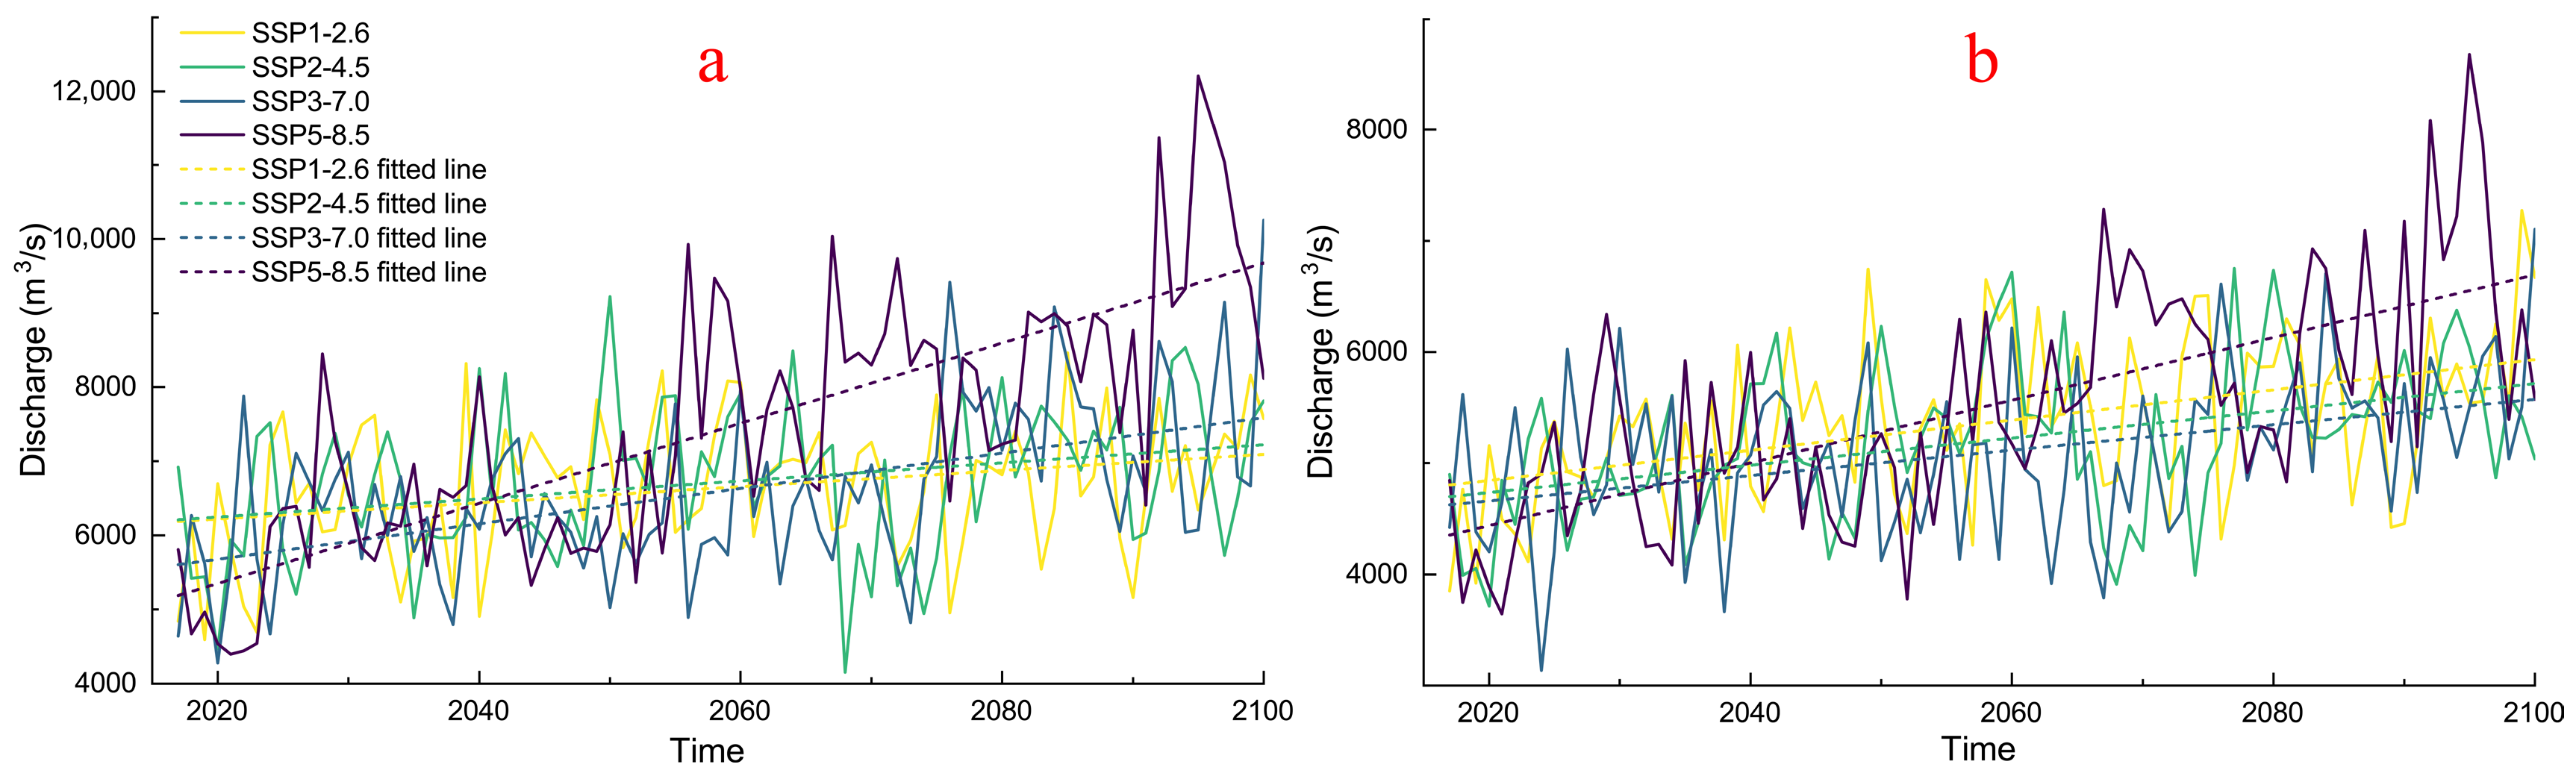
Based on the SWAT model simulations, the projected annual average streamflow in the two water source regions exhibits a generally consistent pattern under future climate scenarios. In all four SSP scenarios, streamflow shows an increasing trend over time. In the Yalong River basin, the magnitude of streamflow change increases sequentially under SSP1-2.6, SSP2-4.5, SSP3-7.0, and SSP5-8.5 scenarios (Figure 2a). In contrast, as shown in Figure 2b, in the Dadu River basin, the slope of the fitted streamflow trend line is largest under SSP5-8.5, followed by SSP1-2.6, SSP2-4.5, and SSP3-7.0, which is consistent with previous research [47]. Using the historical period 1991–2014 as the reference, the annual relative change rate for each SSP scenario was calculated, and the corresponding annual streamflow increment was estimated. The annual streamflow increment under different SSP scenarios ranges from 0.13% to 0.88% in the Yalong River source area and from 0.24% to 0.58% in the Dadu River source area. Notably, substantial interannual variability is observed in both regions across all scenarios, indicating the potential for alternating years of high and low streamflow.
Under different SSP scenarios, the relative changes in streamflow for future periods compared to the baseline period exhibit a consistently increasing trend. In the Yalong and Dadu River source regions, the projected streamflow change ranges are 0.47–3.77% for 2021–2040, 1.95–13.93% for 2041–2060, 3.81–30.91% for 2061–2080, and further increase to 13.45–50.11% in 2081–2100, with variability in the late 21st century being substantially higher than in the earlier and middle periods. Overall, the Yalong River source region exhibits the largest annual mean streamflow and the most pronounced changes across periods, whereas the Dadu River source region shows relatively smaller variations.

4.2. Time-Frequency Characteristics of Streamflow-Climate Relationships Under Future Scenarios

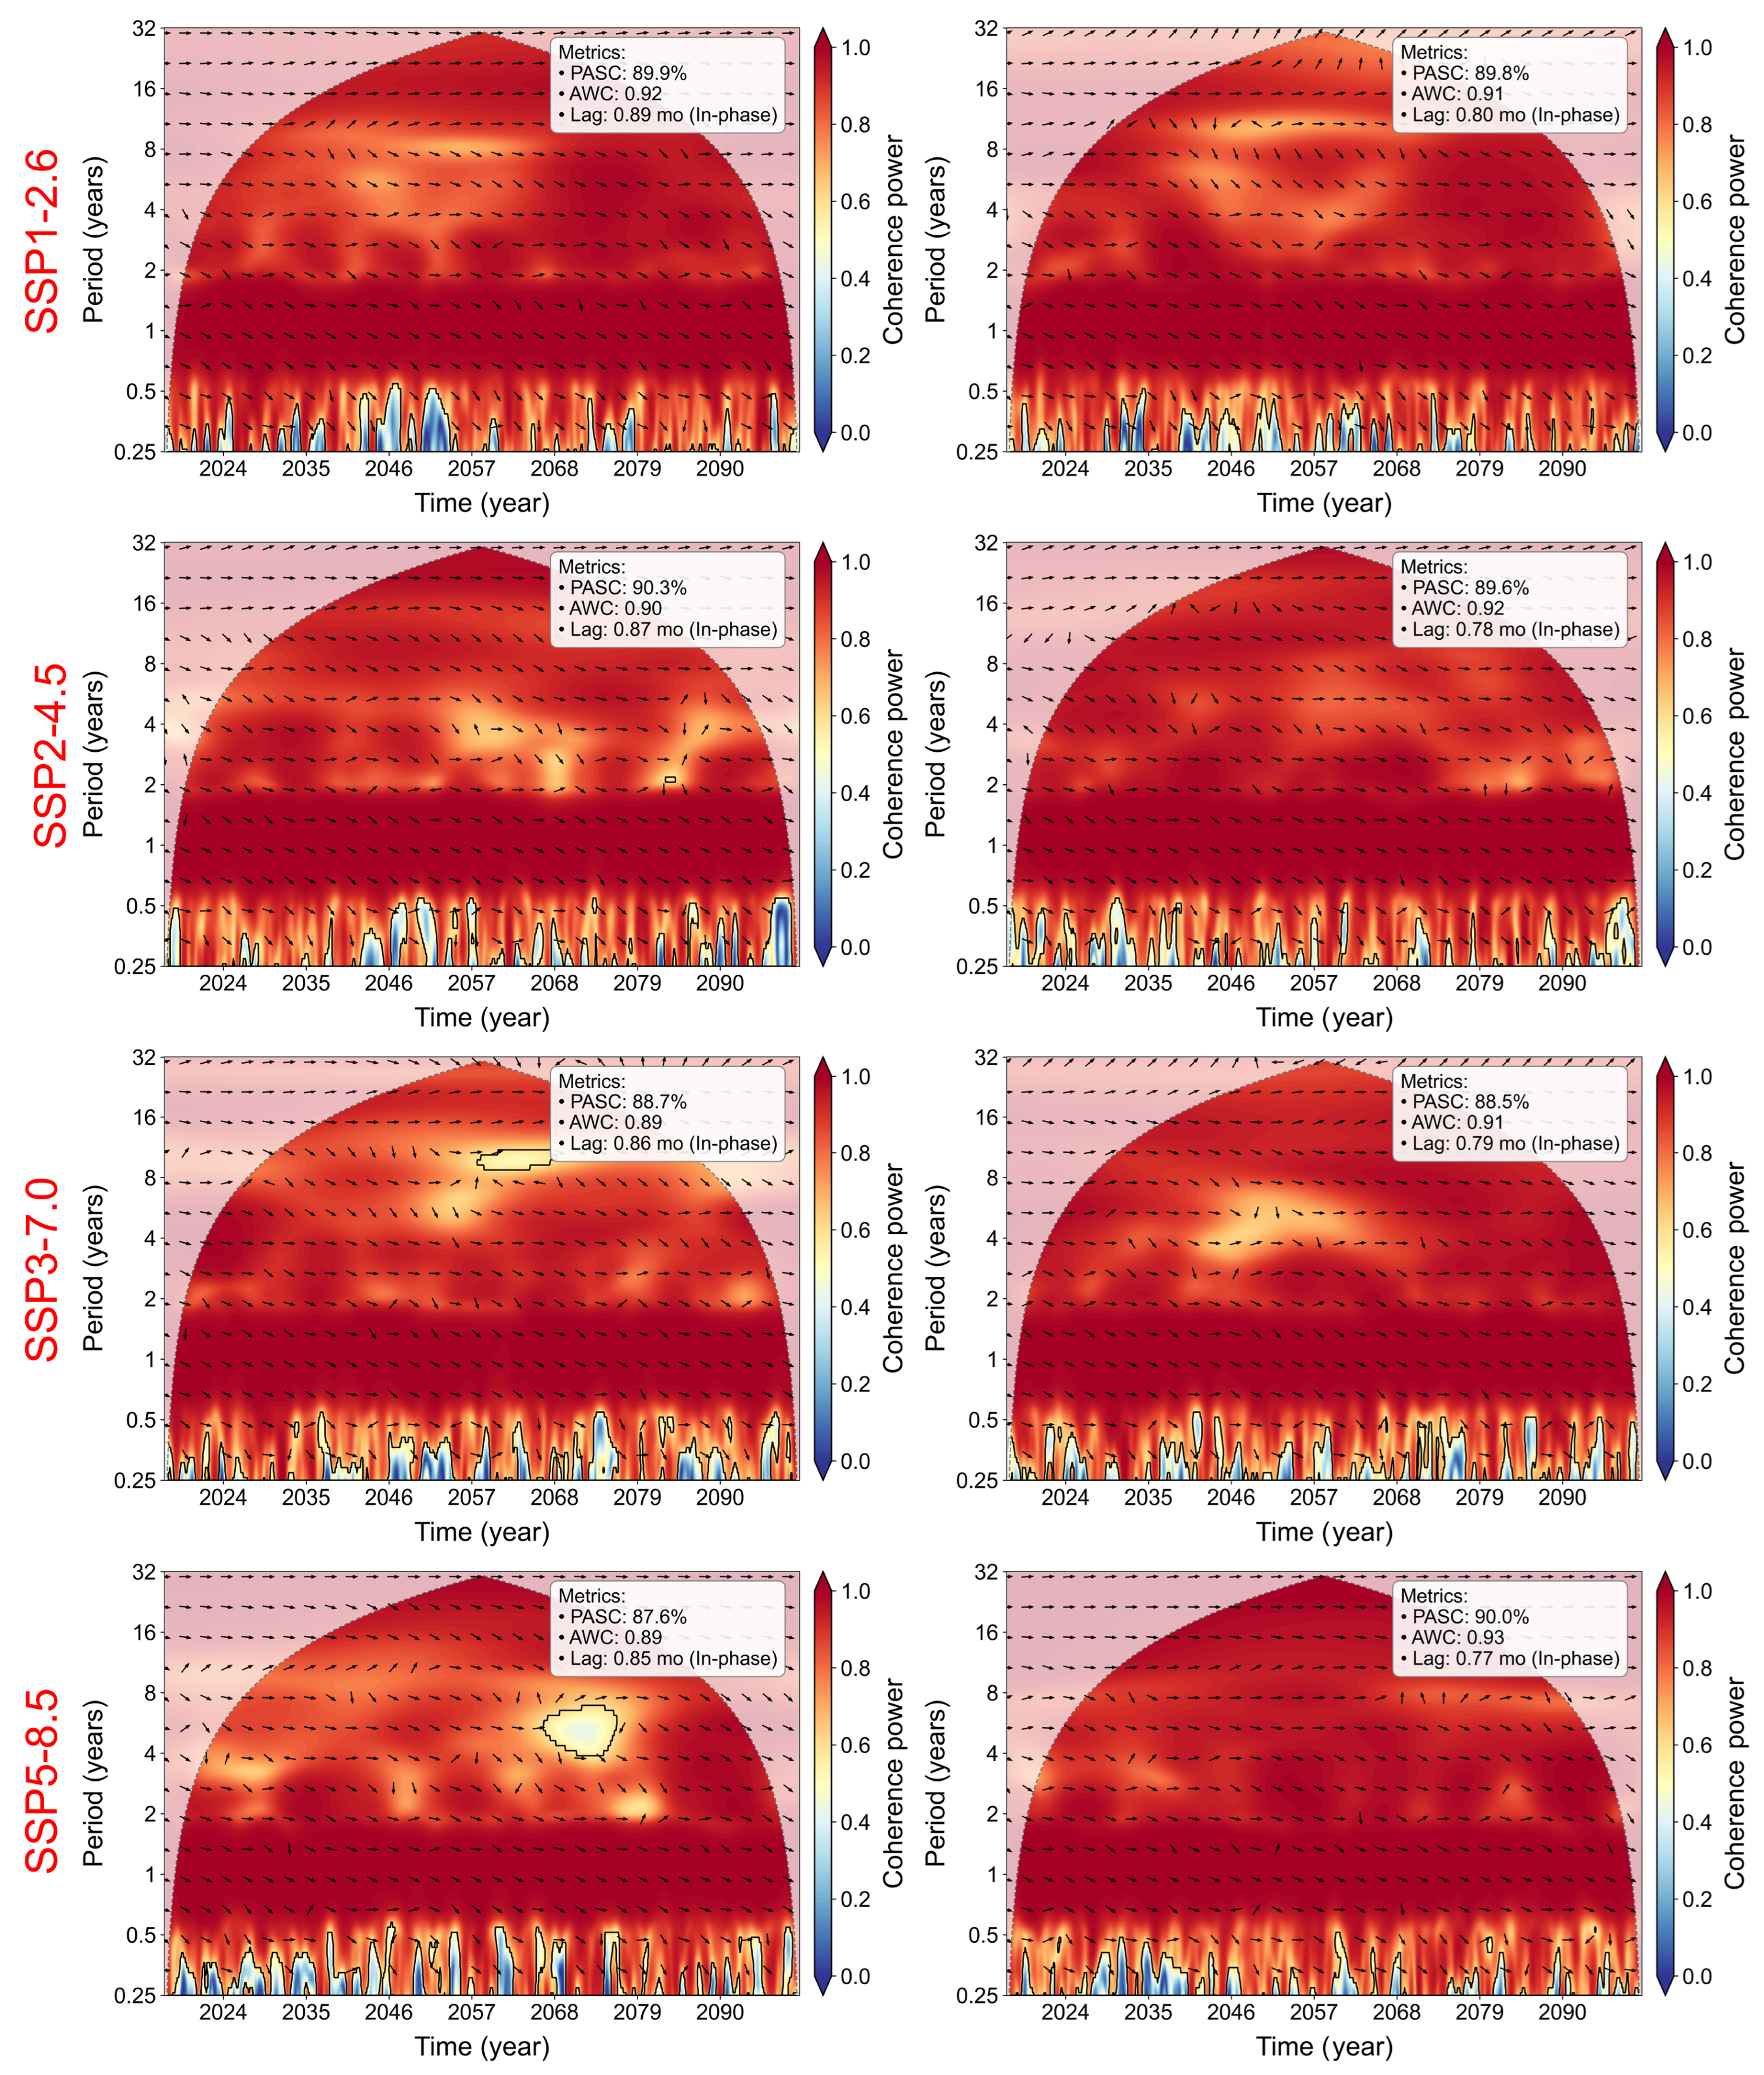
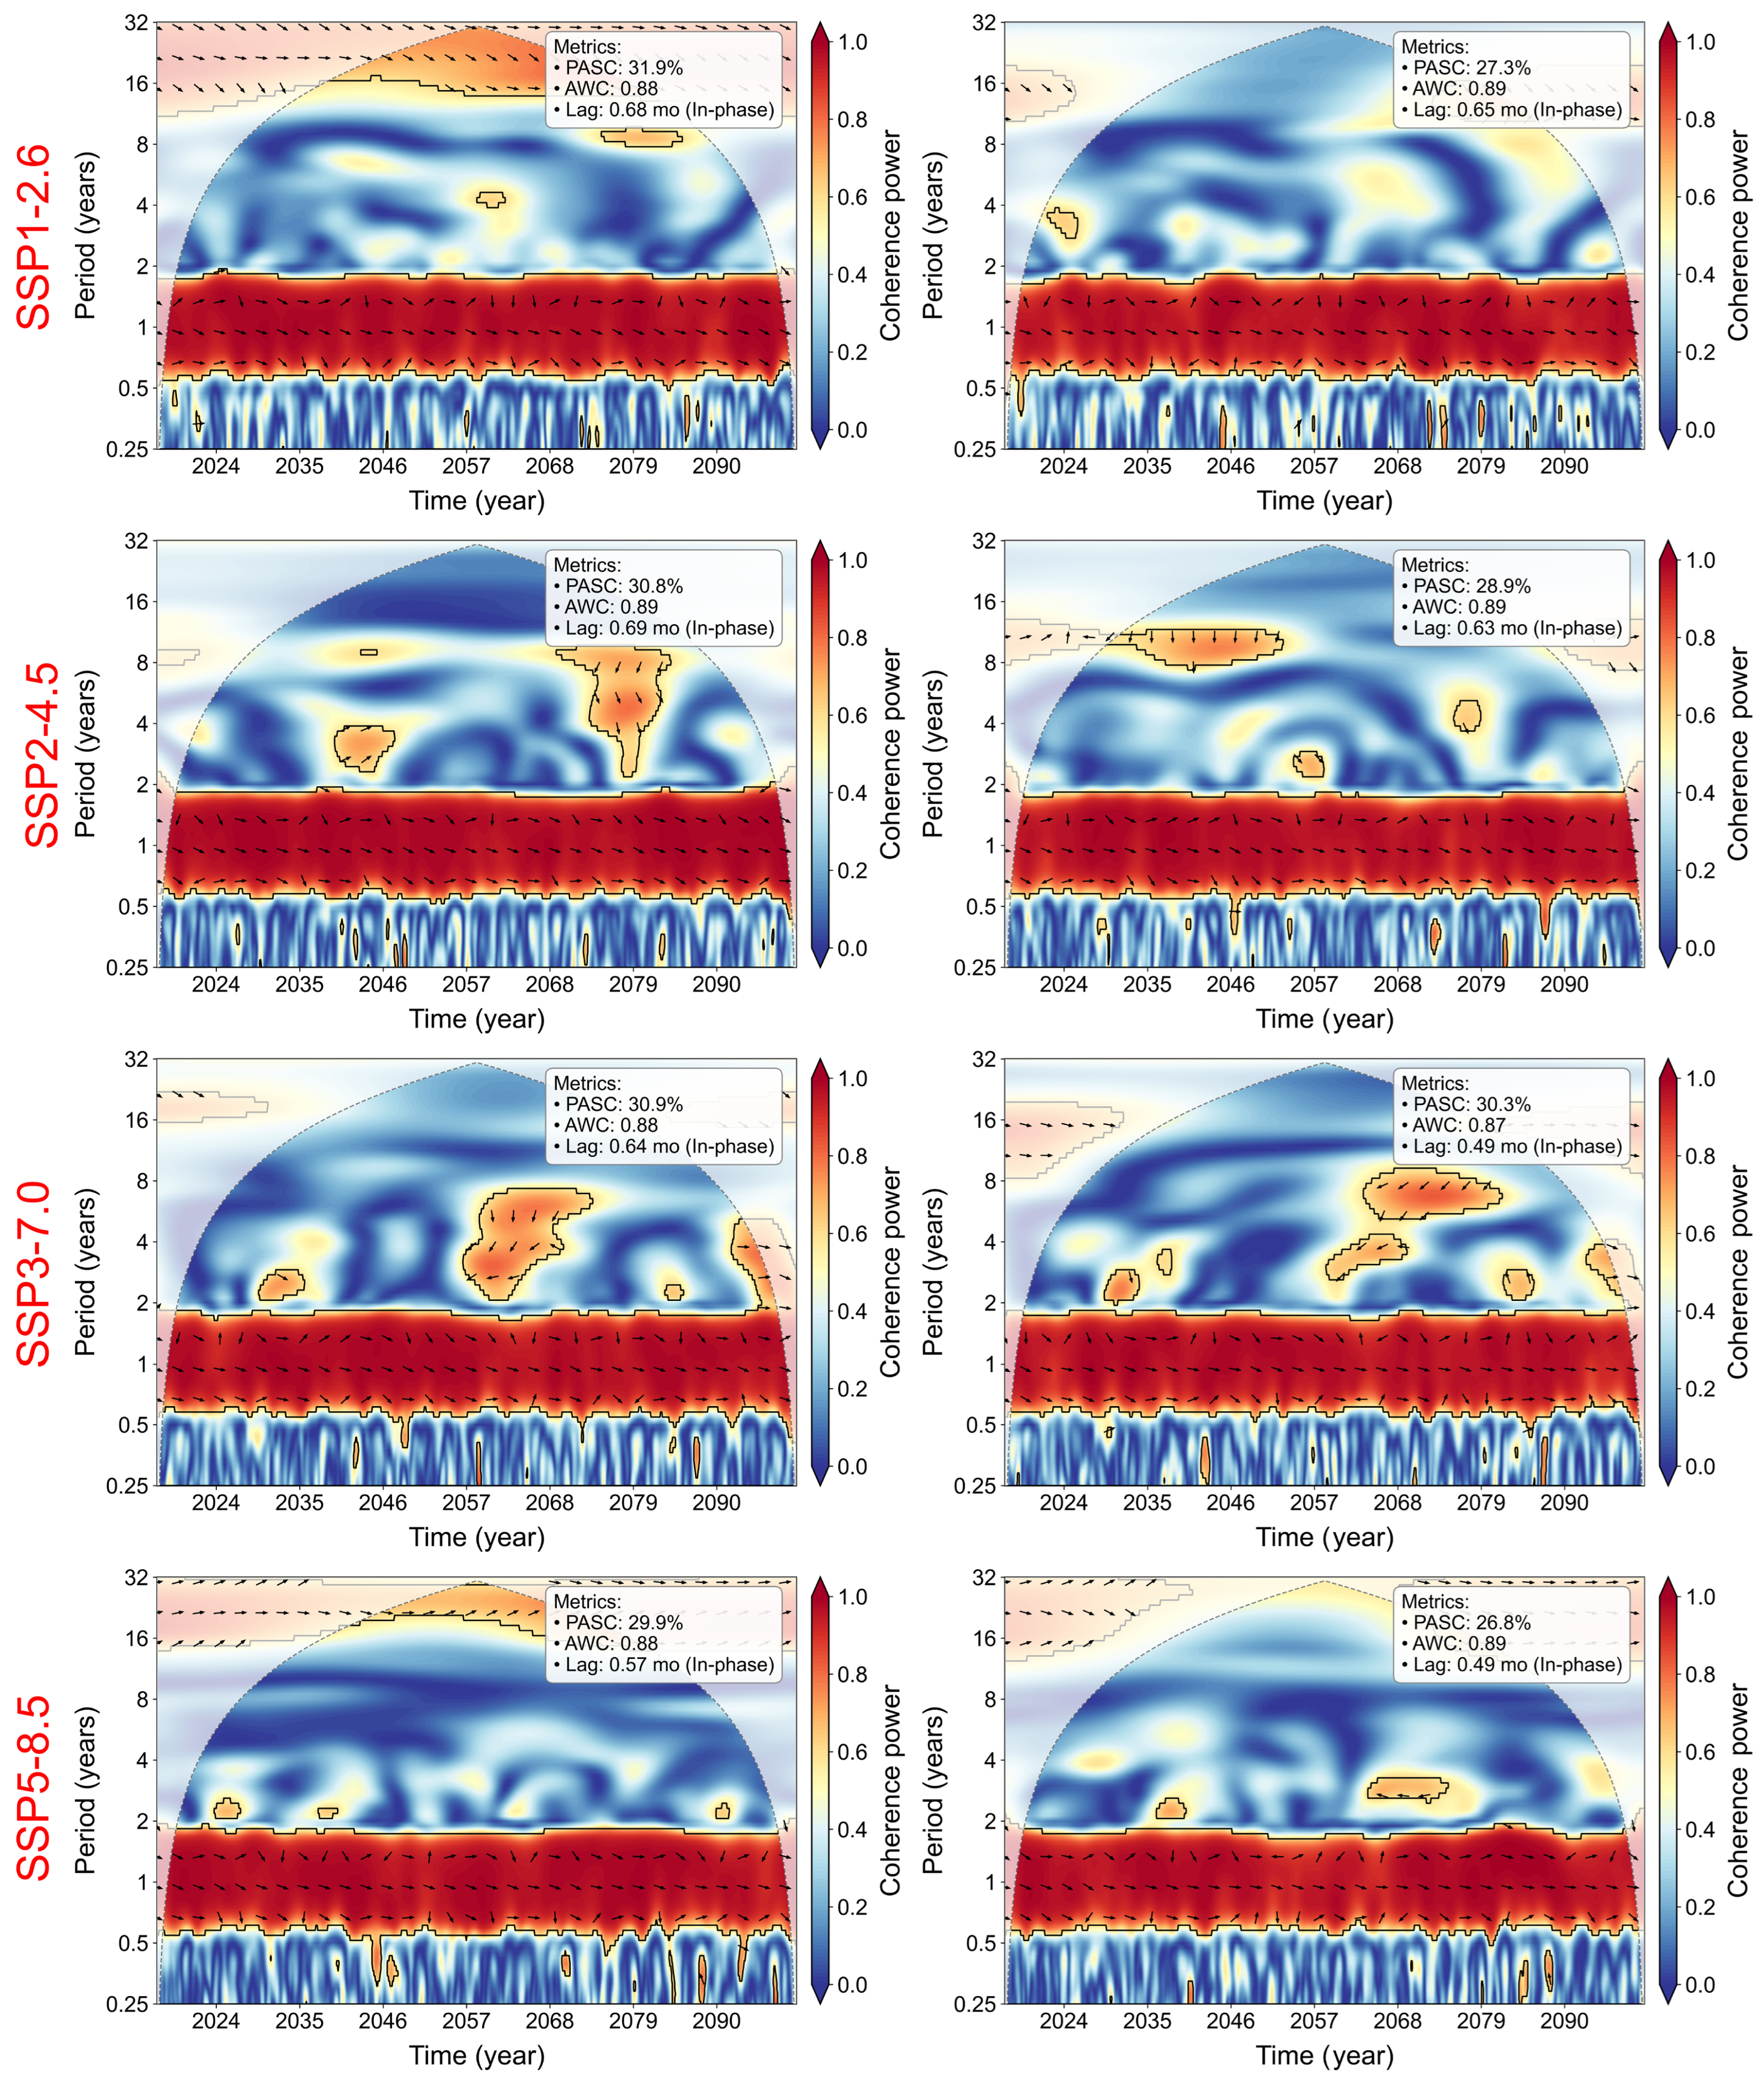
Multivariate Wavelet Coherence analysis (MWTC) was employed to identify the dominant factors controlling streamflow evolution in the Dadu and Yalong River basins during 2017–2100. In the wavelet coherence spectrum, coherence power (0–1) indicates the strength of the correlation in the time-frequency domain, with value closer to 1 indicates stronger coupling and more synchronized variation between the two variables at that time and frequency band, while arrows indicate the phase relationship between the two time series. Under SSP1-2.6 to SSP5-8.5 scenarios, streamflow-precipitation relationships exhibit continuous and high-intensity significant coherence in the 1-year primary periodic band (Figure 3).
The Average Wavelet Coherence (AWC) is defined as the mean coherence within regions that pass the 95% significance test and reflects the overall coupling strength of the system. Higher values indicate tighter co-variation between the two variables in the time-frequency domain. The Percentage of Area Significant Coherence (PASC) represents the proportion of significant coherence within the effective wavelet analysis domain, indicating the persistence and spatial extent of the correlation. Higher PASC values suggest a more stable control of the variable on streamflow over the study period. The time lag (Lag) is derived from the phase angle of the wavelet cross-spectrum and represents the response time of the hydrological system. For example, a Lag < 1 month with in-phase coherence indicates a basin with rapid streamflow generation. As shown in Figure 3, the AWC remains consistently around 0.90, indicating strong coupling between streamflow and precipitation, while the PASC generally exceeds 85%, suggesting that this relationship is both persistent and widespread. Phase analysis shows that coherence arrows are predominantly aligned to the right, indicating an in-phase relationship, with a Lag of less than one month, implying a rapid hydrological response. These results indicate that the hydrological processes in the study region are characteristic of precipitation-limited regimes, where the steep terrain promotes rapid basin-scale streamflow, leading to an almost immediate quasi-synchronous response of streamflow to precipitation pulses.
In contrast, the coherence between streamflow and temperature is considerably weaker (PASC ≈ 30%) and is primarily confined to seasonal frequency bands (Figure 4). Although rising temperatures accelerate snow and ice melt, they do not alter the fundamental “coincident rainfall-streamflow” pattern of the basins. Temperature mainly modulates the seasonal amplitude of streamflow by influencing the timing of snowmelt and evapotranspiration intensity, rather than serving as a dominant factor controlling interannual streamflow variability.

4.3. Spatial Variability of Streamflow Periodicity Intensity

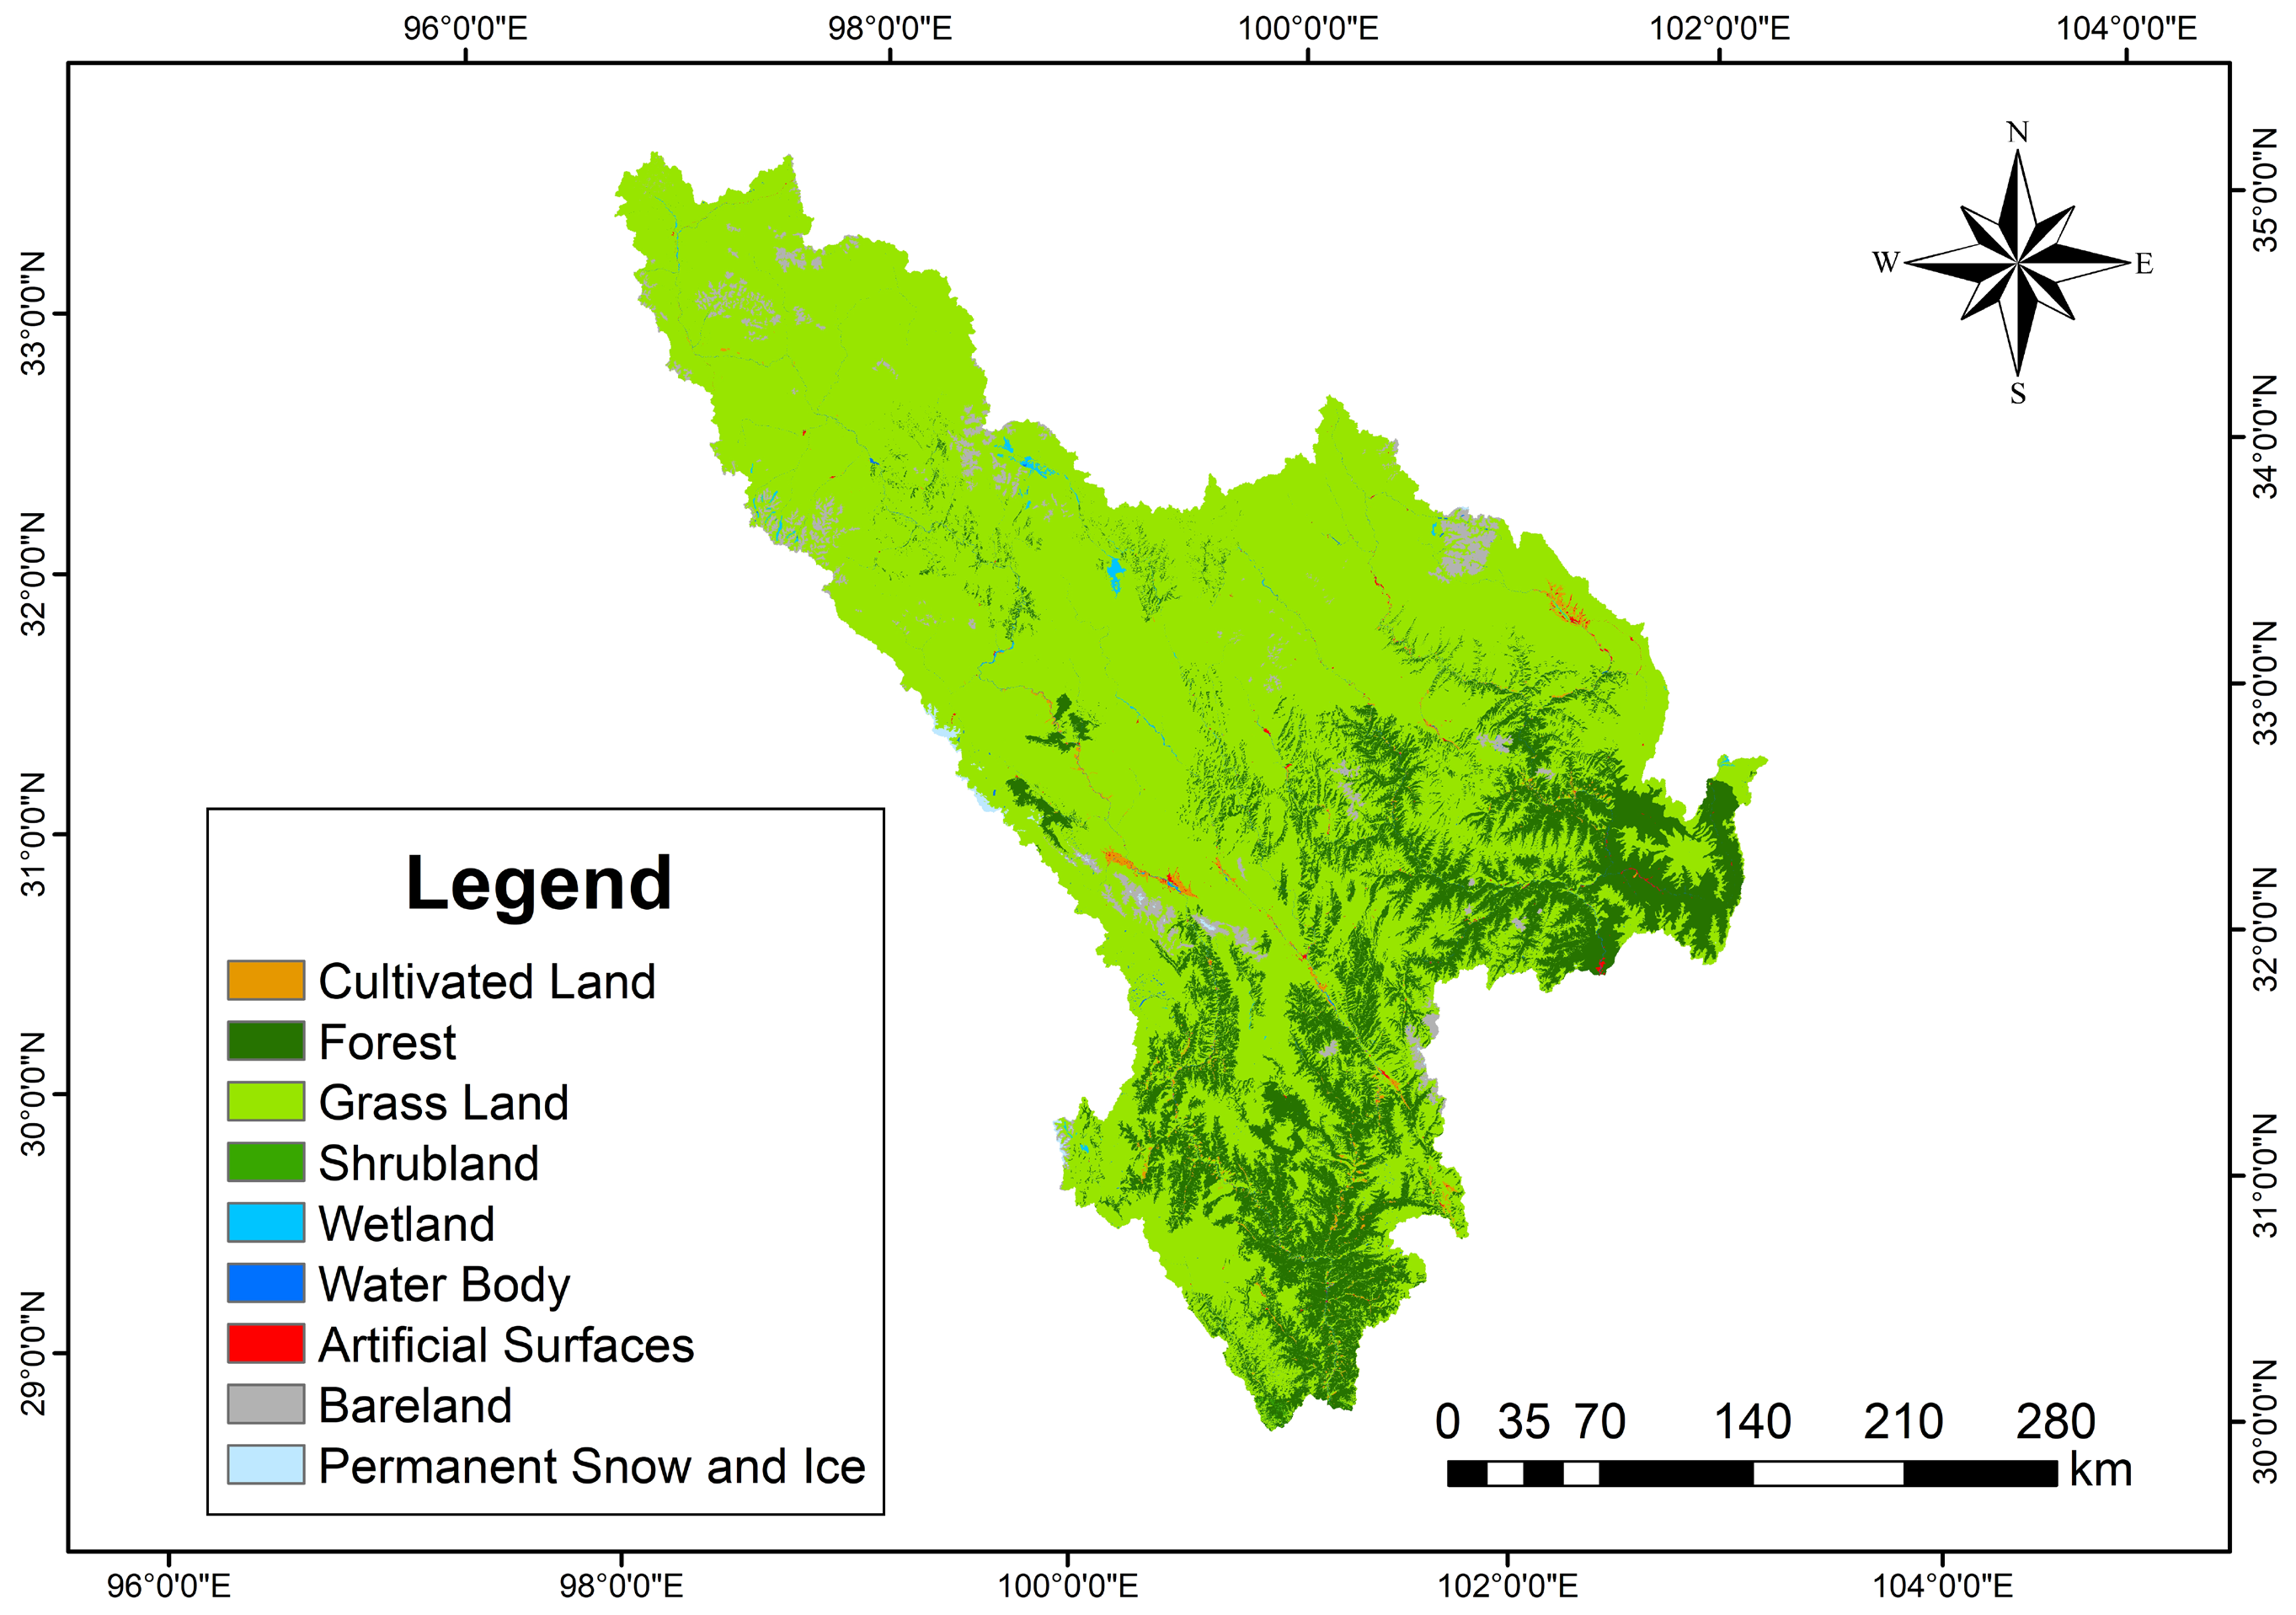
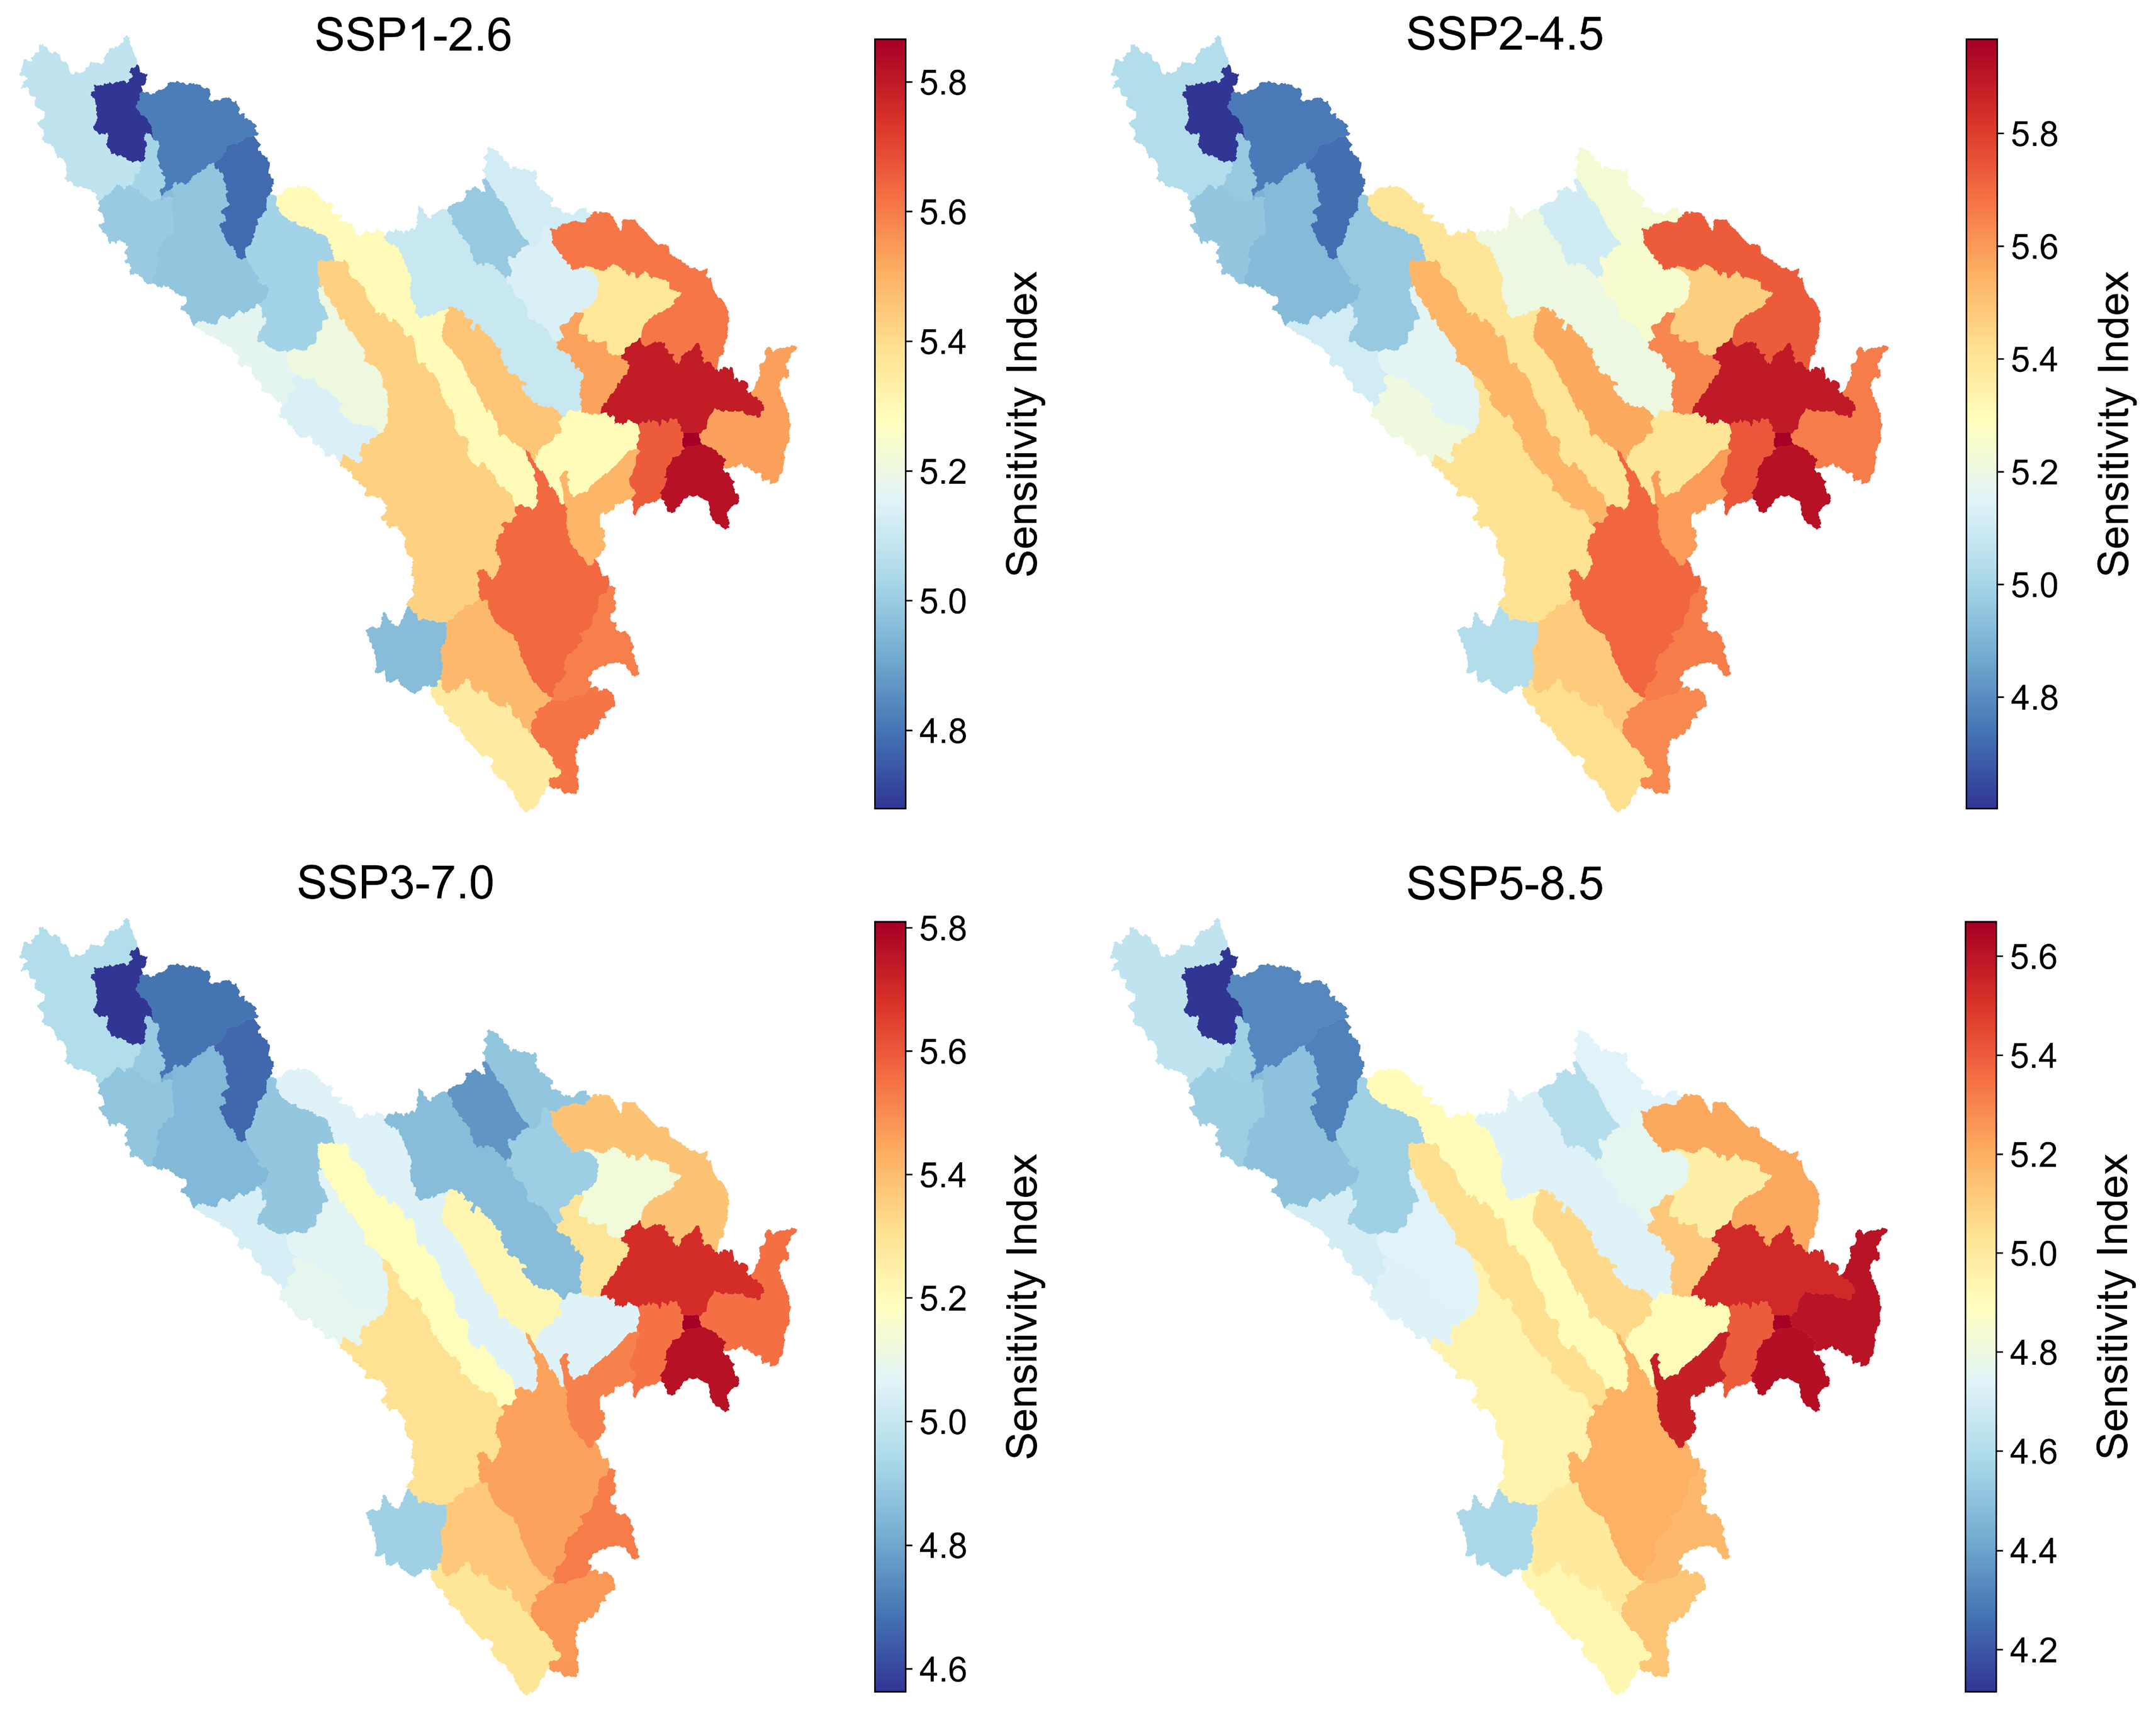
The land use in the study area is dominated by grassland and forest, with the upper reaches of the Yalong and Dadu River source regions primarily covered by grassland and the lower reaches dominated by forest. The proportions of different land use types are summarized in Table 3 and illustrated in Figure 5. In this study, a wavelet-based spatial analysis was employed, using the mean wavelet power at the 1-year scale as an indicator of the seasonal streamflow sensitivity index for each sub-basin. The Sensitivity Index is a frequency-domain metric derived from the CWT of each sub-basin’s streamflow series, specifically defined as the global averaged wavelet power within the 1-year periodic band. This index quantifies the amplitude of intra-annual streamflow variability, with higher values indicating strong sensitivity to seasonal climate inputs (e.g., monsoon precipitation) and limited buffering by the underlying surface, while lower values suggest regulation by features such as permafrost or glaciers, resulting in dampened seasonal fluctuations. This approach was further applied to assess the influence of underlying land surfaces on streamflow periodicity under future climate change scenarios.
The results of the wavelet-based spatial analysis indicate a pronounced northwest-southeast gradient in seasonal streamflow intensity across the Yalong-Dadu River source regions (Figure 6). Areas of low variability are primarily located in the upstream source regions in the northwest of the basins, where the seasonal streamflow sensitivity index is relatively low (<5.2), indicating a more uniform intra-annual distribution of streamflow and relatively stable hydrological processes. In contrast, areas of high variability are concentrated in the mid- to lower-reach canyon regions in the southeast, where the seasonal streamflow sensitivity index is higher (>5.6), exhibiting pronounced seasonal oscillations and significant differences between high- and low-flow periods. Notably, this spatial pattern remains highly consistent across all four SSP scenarios, suggesting that the spatial structure of hydrological stability in the basins is largely determined by geographical and physiographic factors, demonstrating strong robustness.
Spearman correlation analysis quantitatively revealed the differentiated relationships between various land cover types and seasonal streamflow intensity (Figures S2–S5 in the Supplementary Material). Forested areas exhibited a highly significant positive correlation (R = 0.80–0.86, p < 0.001), indicating that sub-basins with a higher proportion of forest cover experience more pronounced seasonal fluctuations in streamflow. Grasslands showed a highly significant negative correlation (R = 0.75–0.83, p < 0.001), suggesting that streamflow in grassland-dominated sub-basins is less variable and exhibits greater hydrological stability. Bare land also showed a significant negative correlation (R = 0.36–0.40, p < 0.05), similar to grassland-dominated sub-basins. Glaciers, due to their extremely small area fraction (<0.2%), were not statistically significant. However, under the high-emission SSP5-8.5 scenario, the correlation coefficient slightly increased, indicating that glacier meltwater may contribute increasingly to streamflow variability under future warming.

4.4. Future Streamflow Abrupt Changes and Extreme Events

Based on analyses of abrupt streamflow changes and extreme hydrological events in the Yalong and Dadu River basins under four SSP scenarios (2017–2100), the results indicate that statistically significant change points were detected in both basins across all scenarios (p < 0.05). The detected change points are mainly concentrated in the mid-2040s to mid-2050s (e.g., 2042, 2049, 2056), while the Dadu River basin also exhibits later change points (2058, 2063, 2074). The timing of these abrupt changes is scenario-dependent: under moderate- to high-emission scenarios (SSP2-4.5 and SSP5-8.5), changes tend to occur earlier, whereas under SSP3-7.0, the changes are relatively delayed. This highlights the influence of different emission pathways on the temporal response of the hydrological system.
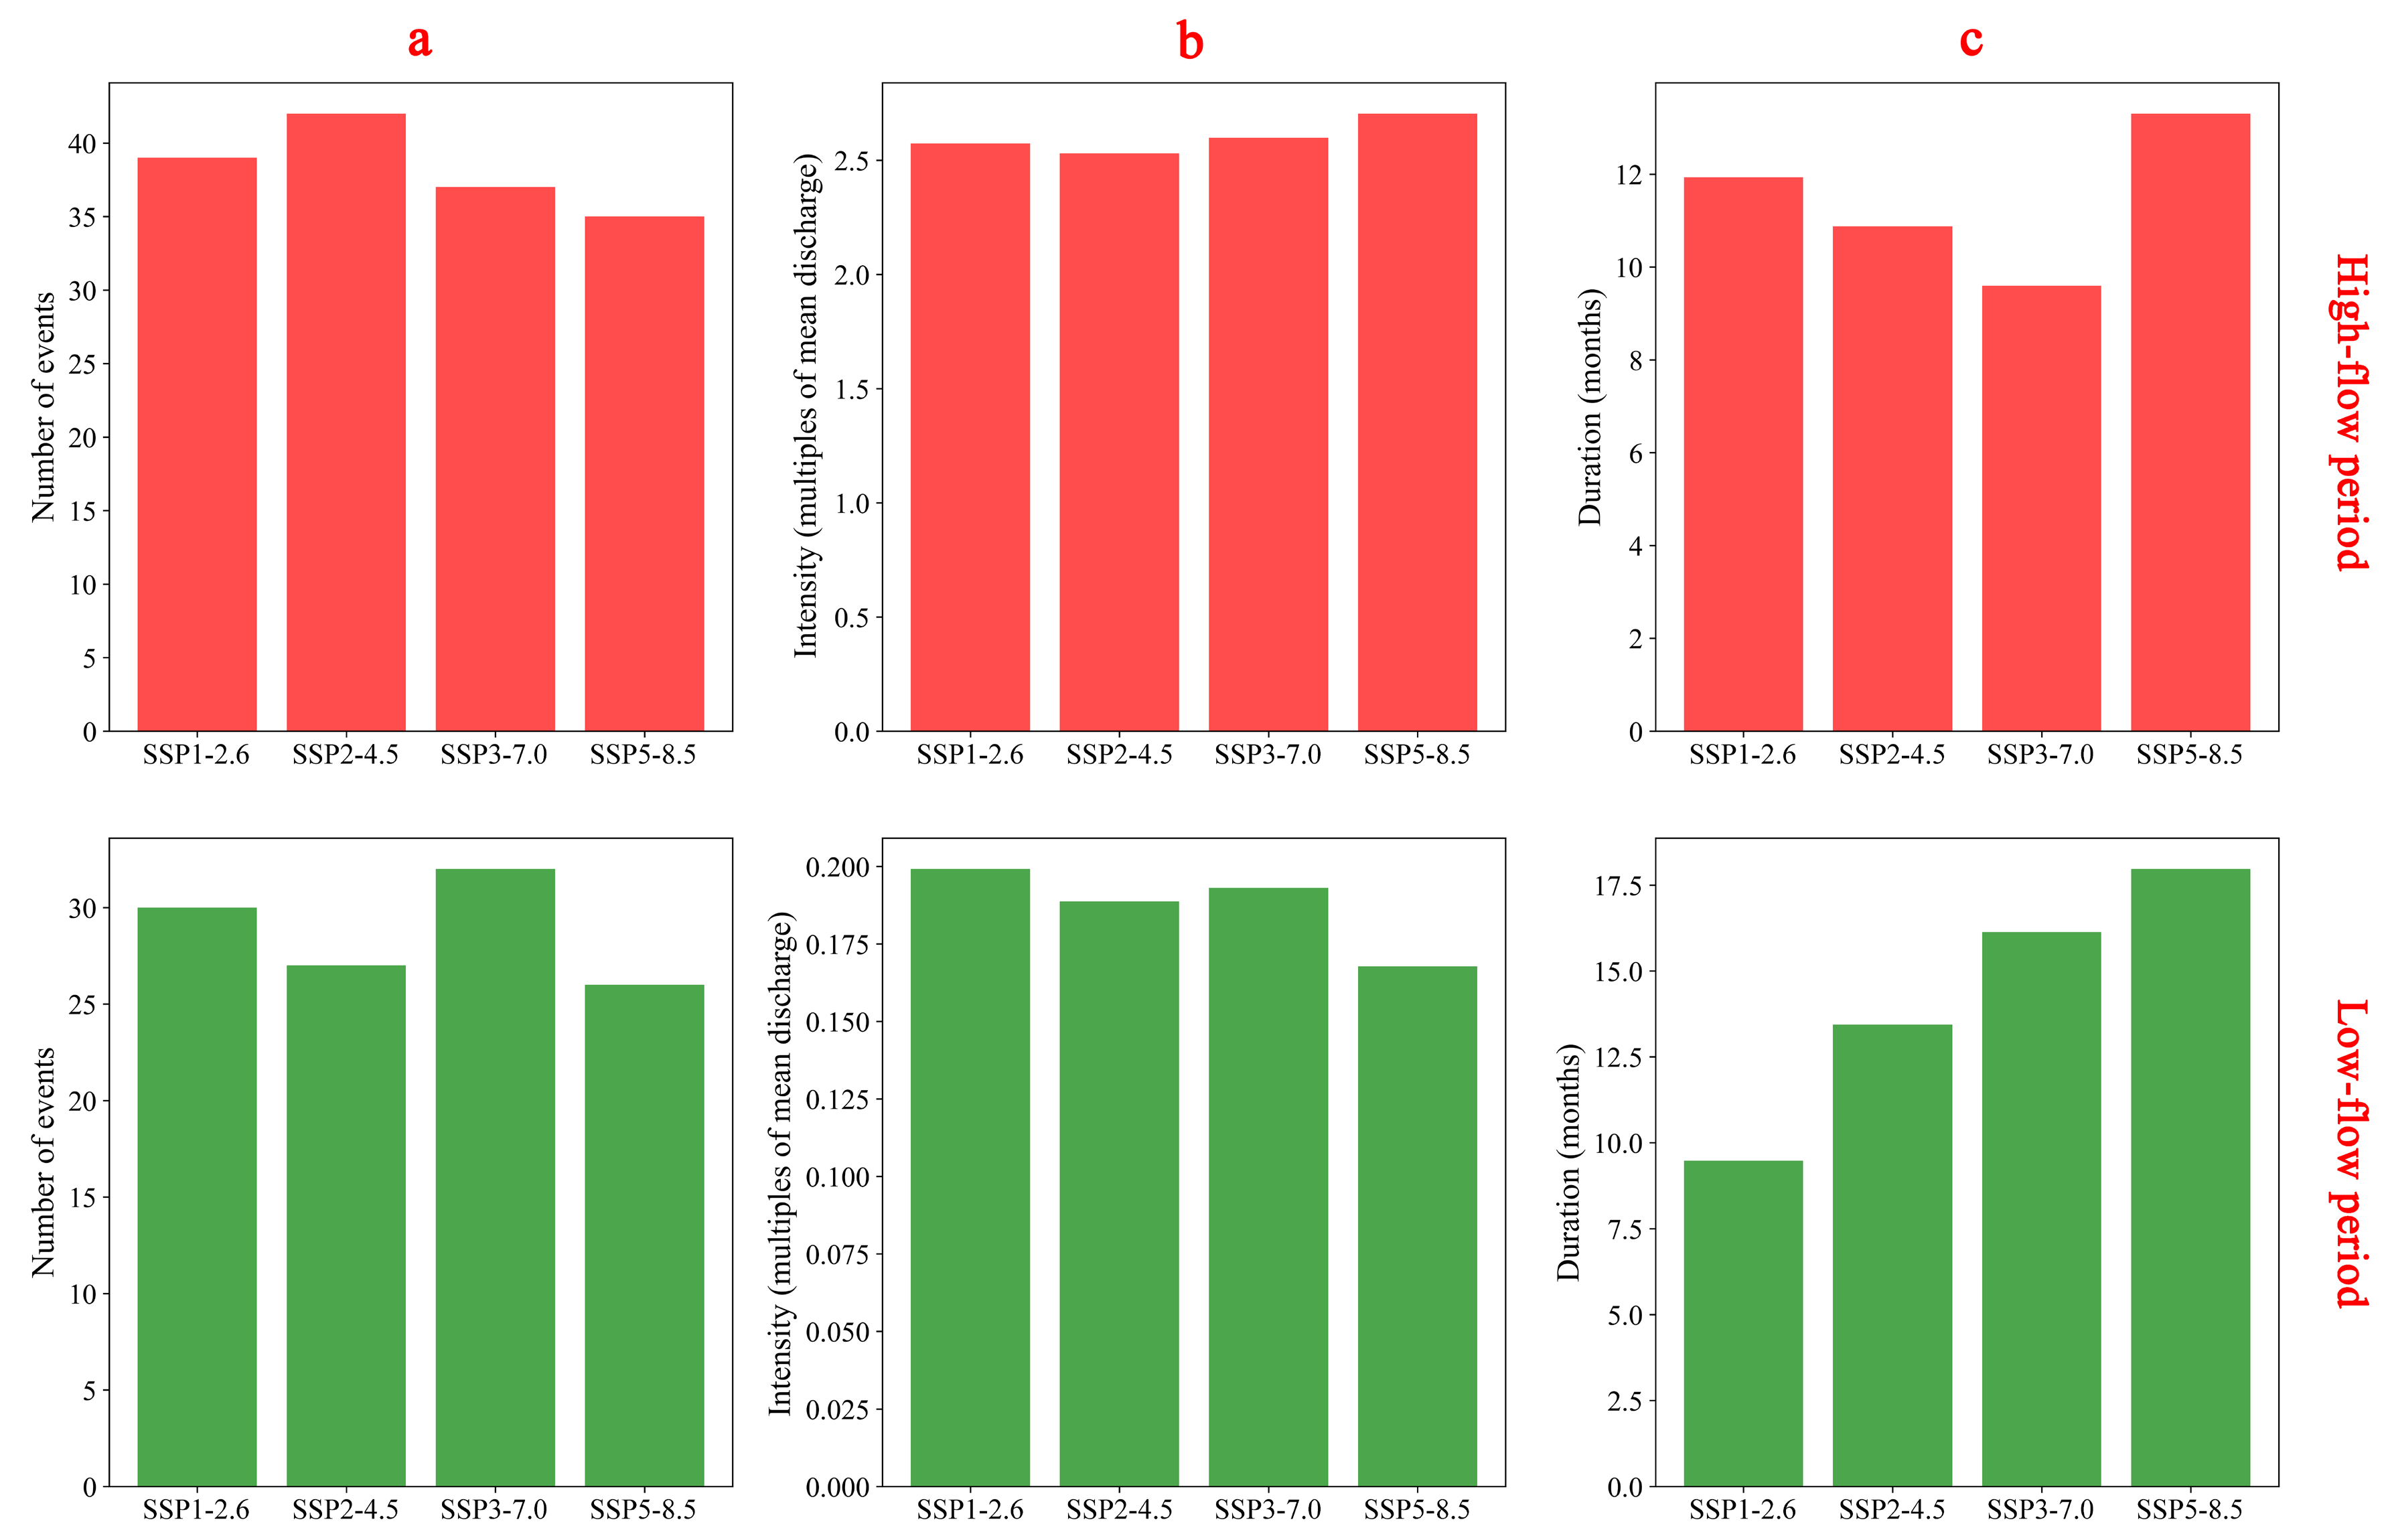
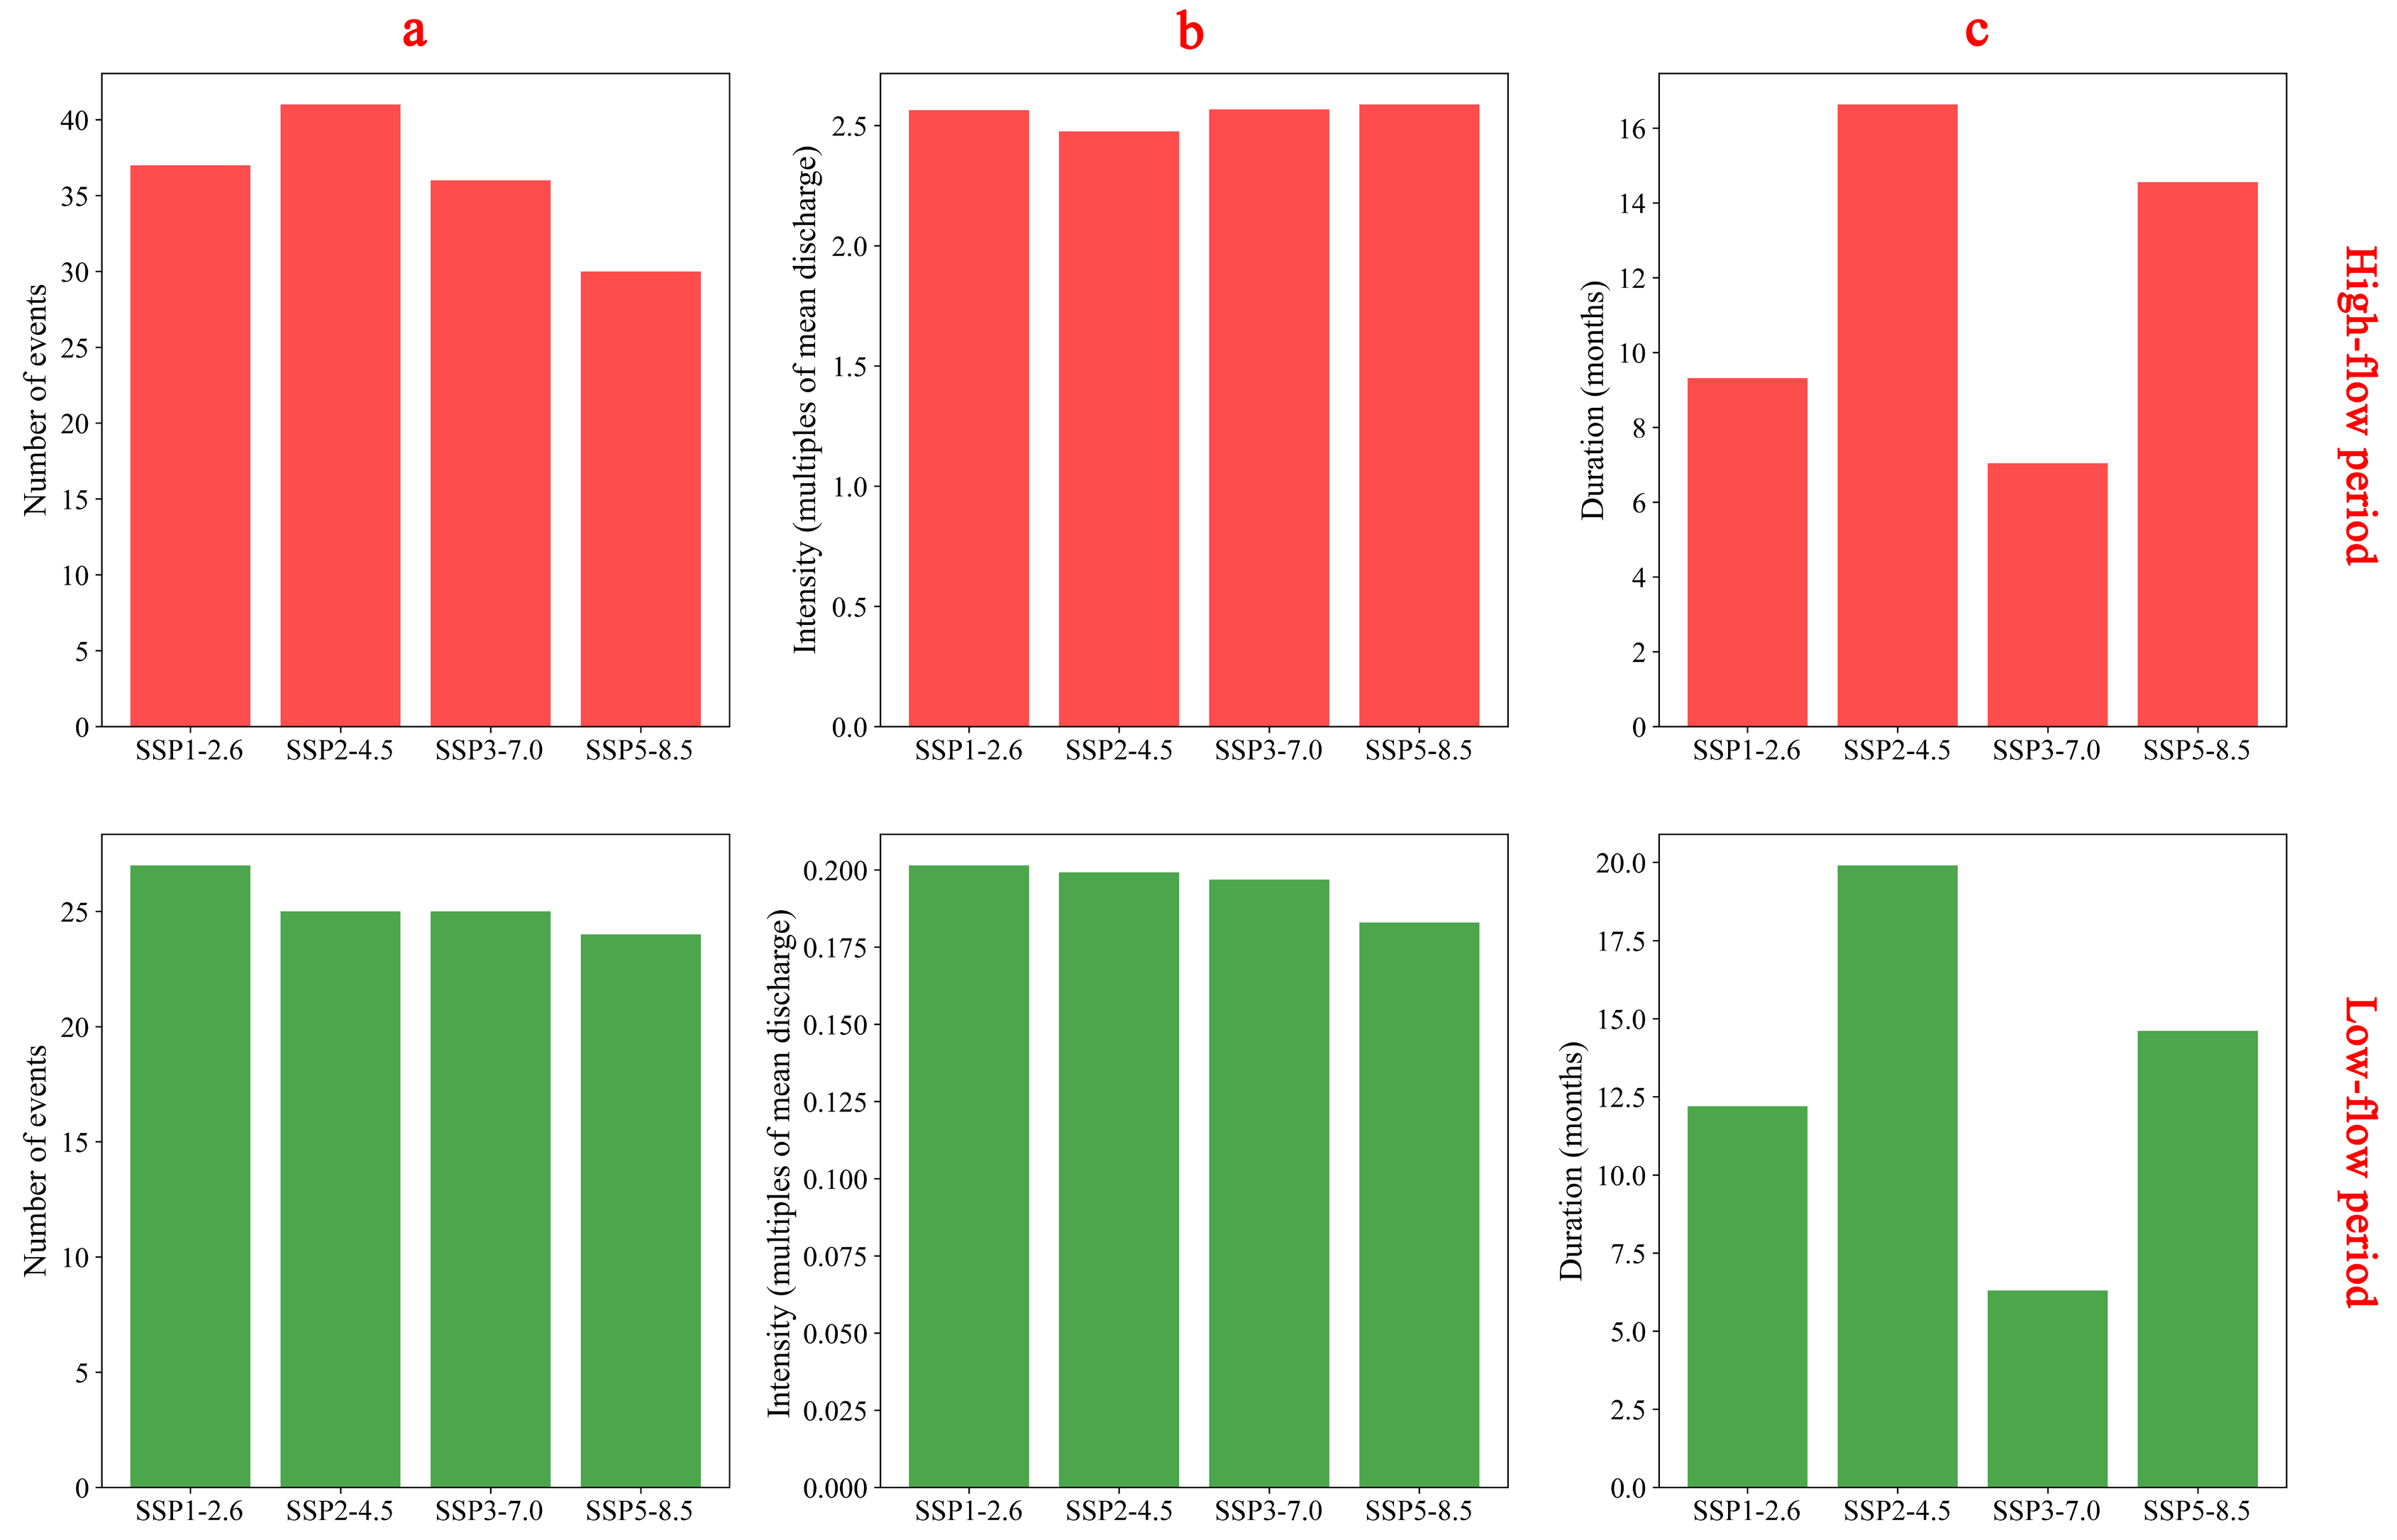
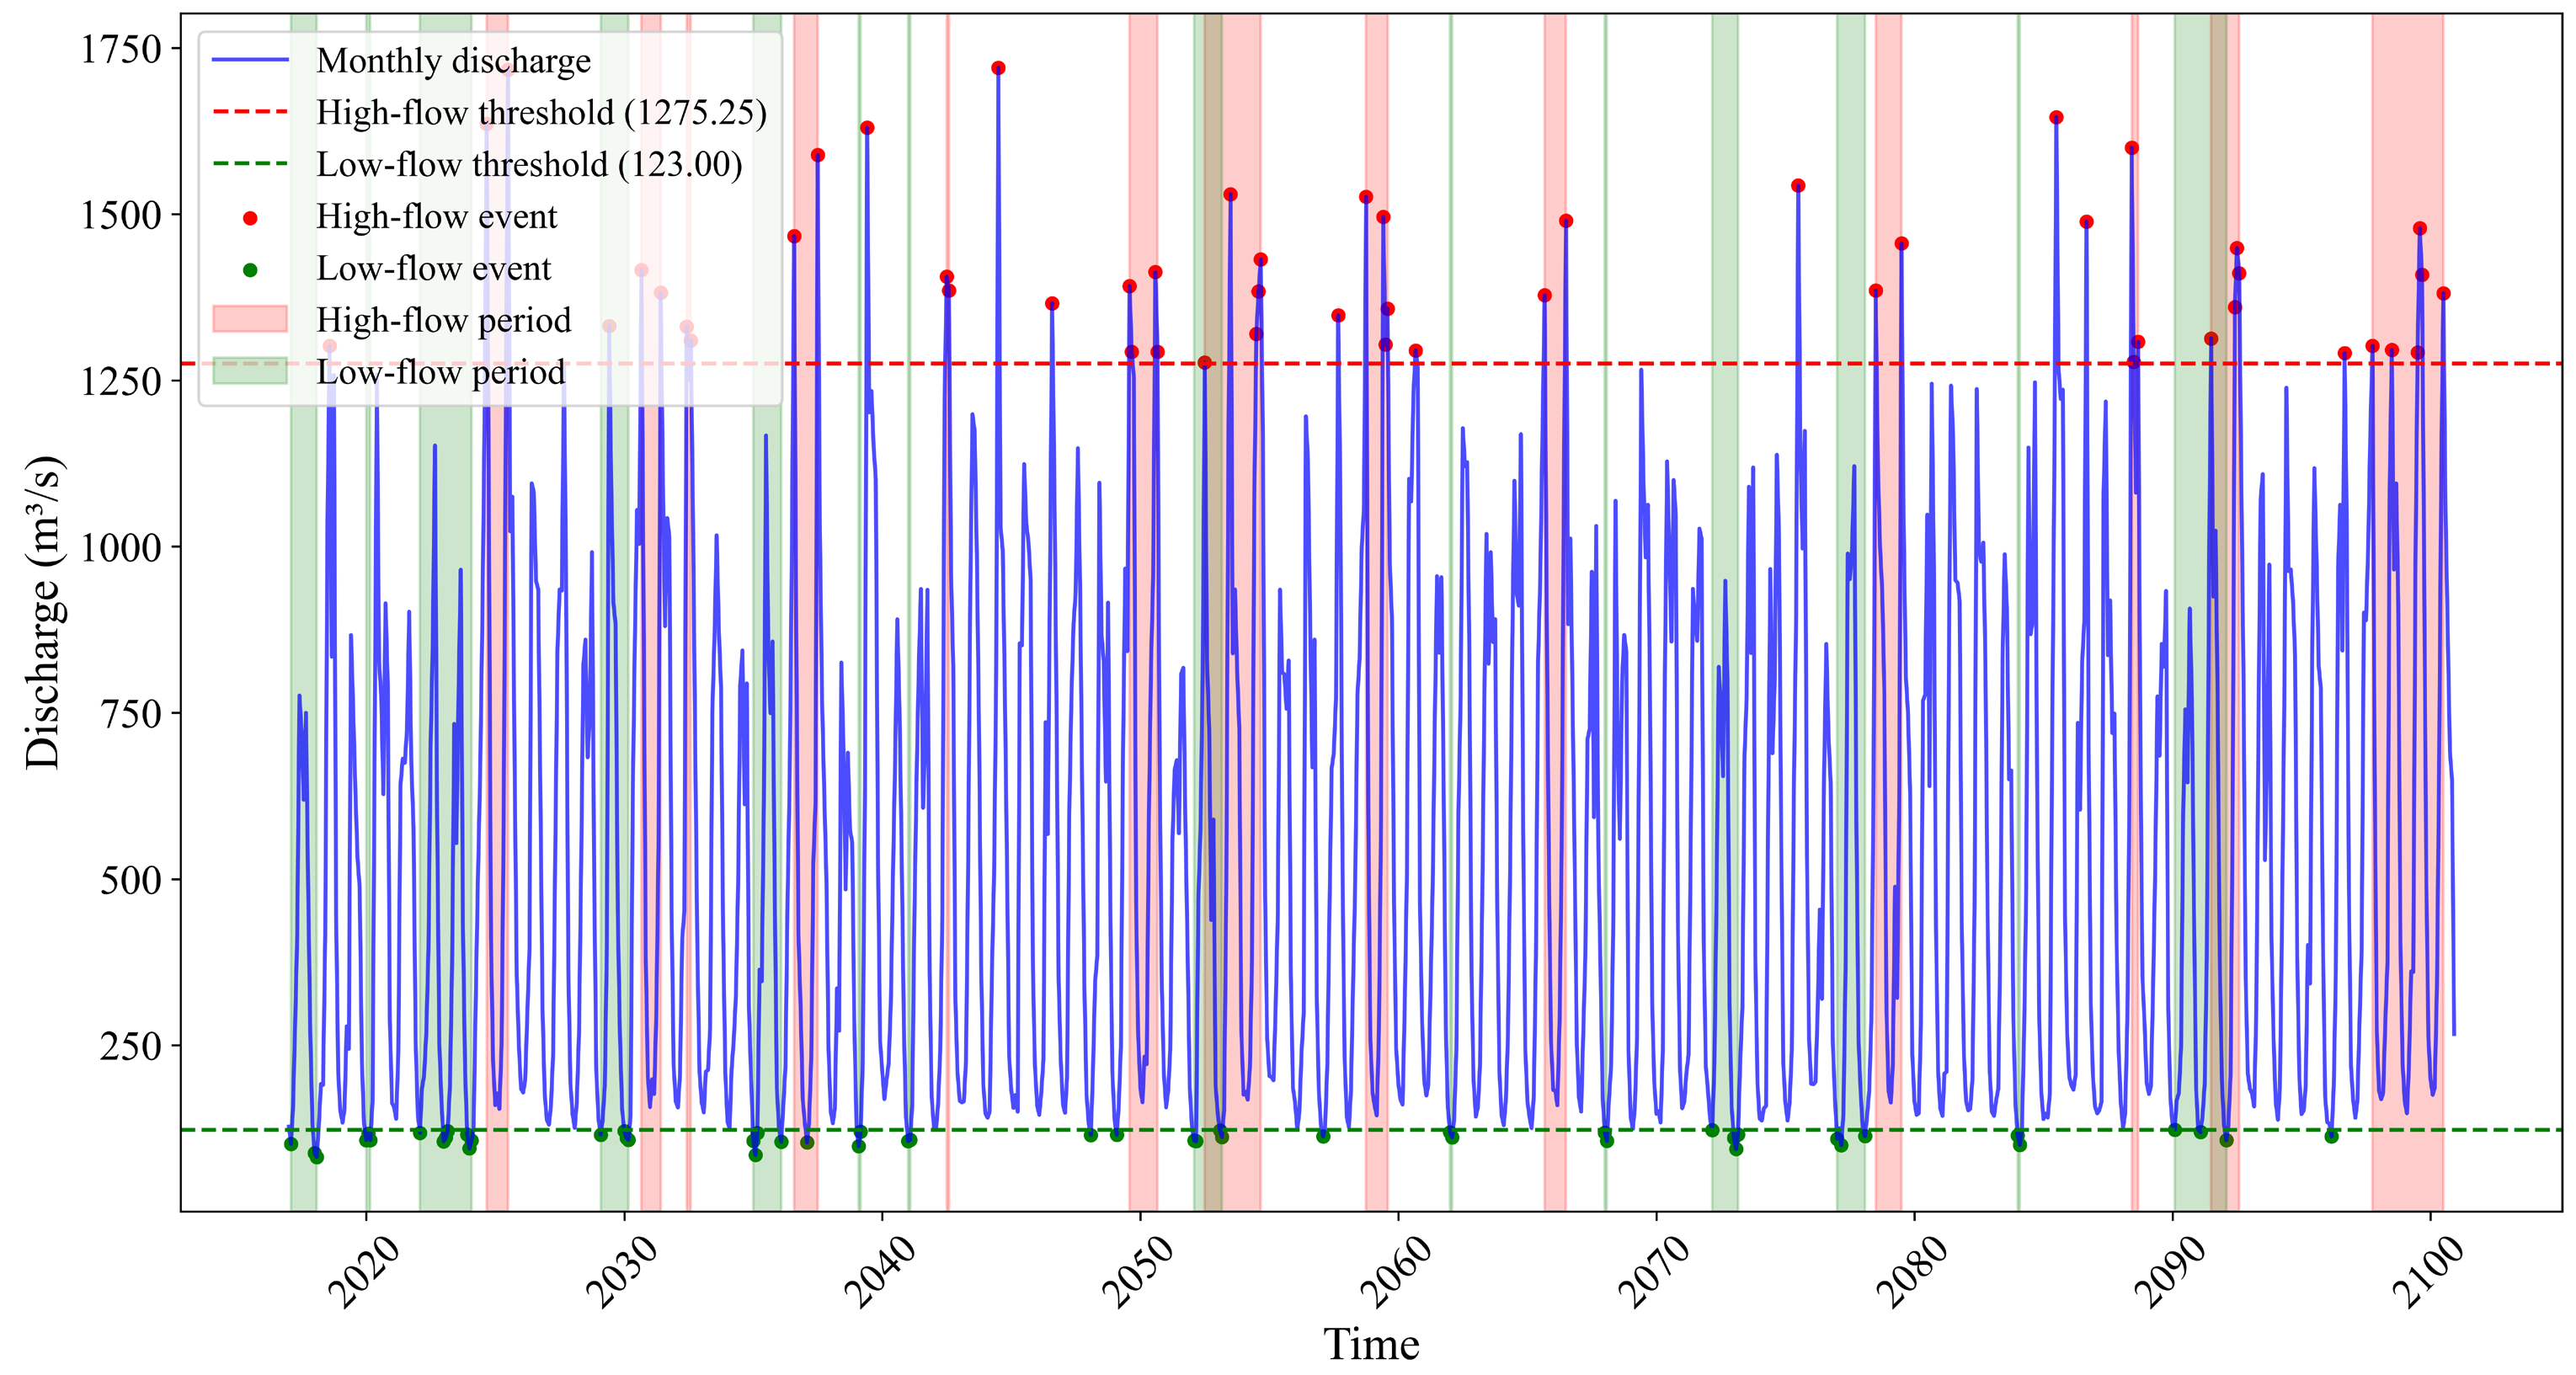
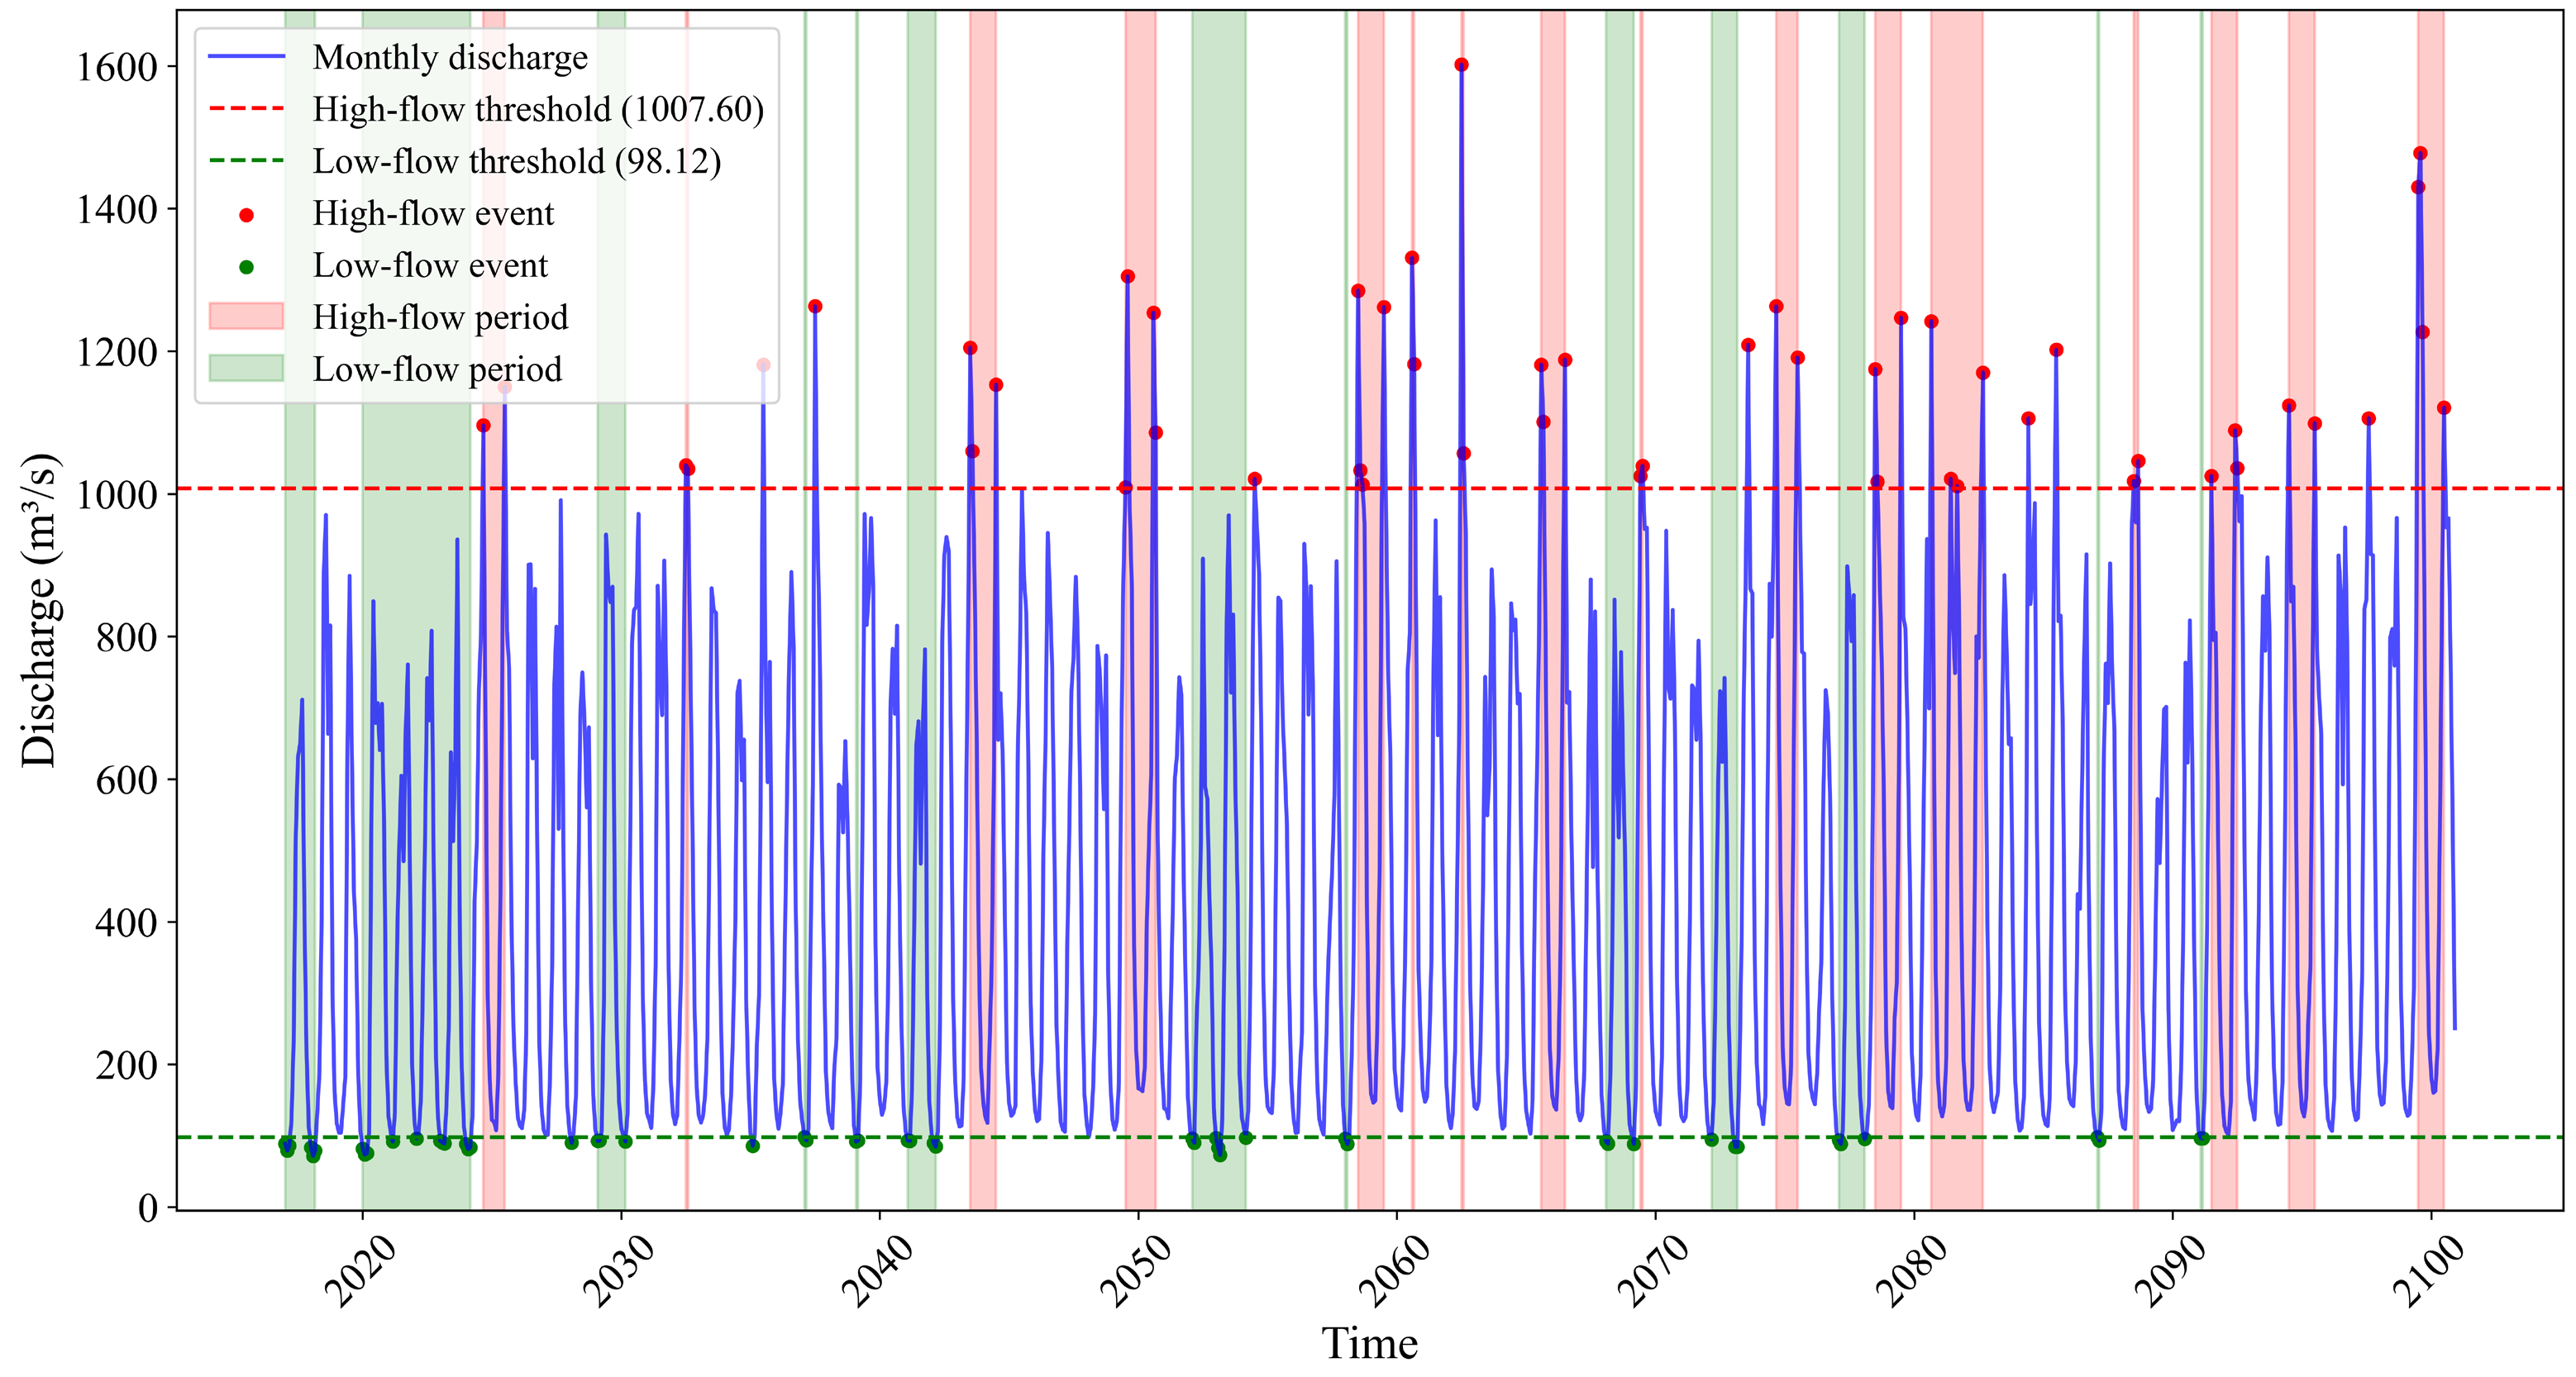
Furthermore, a considerable number of high- and low-flow events were identified under all scenarios (24–42 events per scenario), indicating that extreme hydrological events are likely to become more frequent in the future (Figure 7 and Figure 8). Among these, low-flow events may be particularly damaging, as their average duration (1.6–2.1 months) is equal to or longer than that of high-flow events (1.2–1.7 months) across all scenarios. Prolonged drought poses a greater threat to ecosystems, agricultural water supply, and hydropower generation than short-term floods. The intensity is defined as a dimensionless ratio between the average streamflow during an extreme event and the multi-year mean streamflow simulated for the corresponding scenario, representing the multiple of the mean streamflow. Based on this metric, the intensity of low-flow events can drop to as low as 0.17–0.20 times the mean discharge, implying that ecological base flows may not be maintained and water scarcity could become severe. Although the total number of extreme events is not highest under the SSP5-8.5 scenario, both the intensity of high-flow events (up to 2.70 times the mean discharge) and the duration of low-flow events (2.0 months) are greatest in the Yalong River basin, suggesting that high-emission pathways may lead to more severe extreme events.
Under future climate scenarios, extreme hydrological events exhibit a pronounced clustered pattern. Taking the SSP1-2.6 scenario as an example (Figure 9 and Figure 10), both high-flow periods and low-flow periods occur in a continuous and dense manner over specific periods. A comparative analysis across scenarios (Figures S6–S11 in the Supplementary Material) reveals that, with increasing climate forcing from SSP1-2.6 to SSP5-8.5, the duration of low-flow periods and the number of events within each period increase markedly.
For instance, in the Yalong River basin, the mean duration of low-flow periods increases from 9.5 months under SSP1-2.6 to 18.0 months under SSP5-8.5, while the number of events per low-flow period rises from 3.2 to 5.6. In the Dadu River basin, low-flow periods under the SSP2-4.5 scenario persist for up to 19.9 months. High-flow periods exhibit a similar, albeit less pronounced, tendency. Under SSP5-8.5, both the duration and the number of high-flow events are generally higher than those under SSP1-2.6, for example, in the Yalong River basin, the duration of high-flow periods increases from 11.9 to 13.3 months, and the number of events rises from 3.1 to 4.1. Although the Yalong River basin exhibits higher overall discharge than the Dadu River basin (e.g., high-flow thresholds of approximately 1275 and 1007 m3/s, respectively), both basins show a high degree of consistency in terms of abrupt change points, the frequency of extreme events, and their clustering patterns, reflecting a common regional-scale hydrological response to climate change. Overall, under future climate scenarios, significant hydrological shifts in both the Yalong and Dadu River basins are projected to occur in the mid-21st century (2040s–2060s). Extreme hydrological events are expected to become more frequent and occur in clustered sequences, resulting in prolonged periods of high and low flows. In addition, under the high-emission SSP5-8.5 scenario, the basins may experience exceptionally long-lasting and highly concentrated low-flow periods, posing severe risks to water security.

5. Discussion

5.1. Interactive Effects of Hydrological and Climatic Gradients on Streamflow Seasonal Response

This study, through MWTC and spatial statistics, reveals a significant positive correlation between forest cover and seasonal streamflow intensity [48], highlighting the dominant role of hydrological-climatic gradients in regulating land surface functions. The Yalong and Dadu River basins exhibit substantial vertical relief and climatic heterogeneity, with forests predominantly distributed in the mid- to lower-reach canyon areas in the southeast. This region coincides with the windward slope precipitation center of the East Asian summer monsoon penetrating the eastern margin of the Tibetan Plateau [20]. Due to orographic uplift, the highly concentrated monsoon rainfall promotes a mixed streamflow generation mechanism dominated by saturation excess and fill-spill processes, whereby strong external climatic forcing masks the buffering effects of local vegetation canopy interception and soil infiltration.
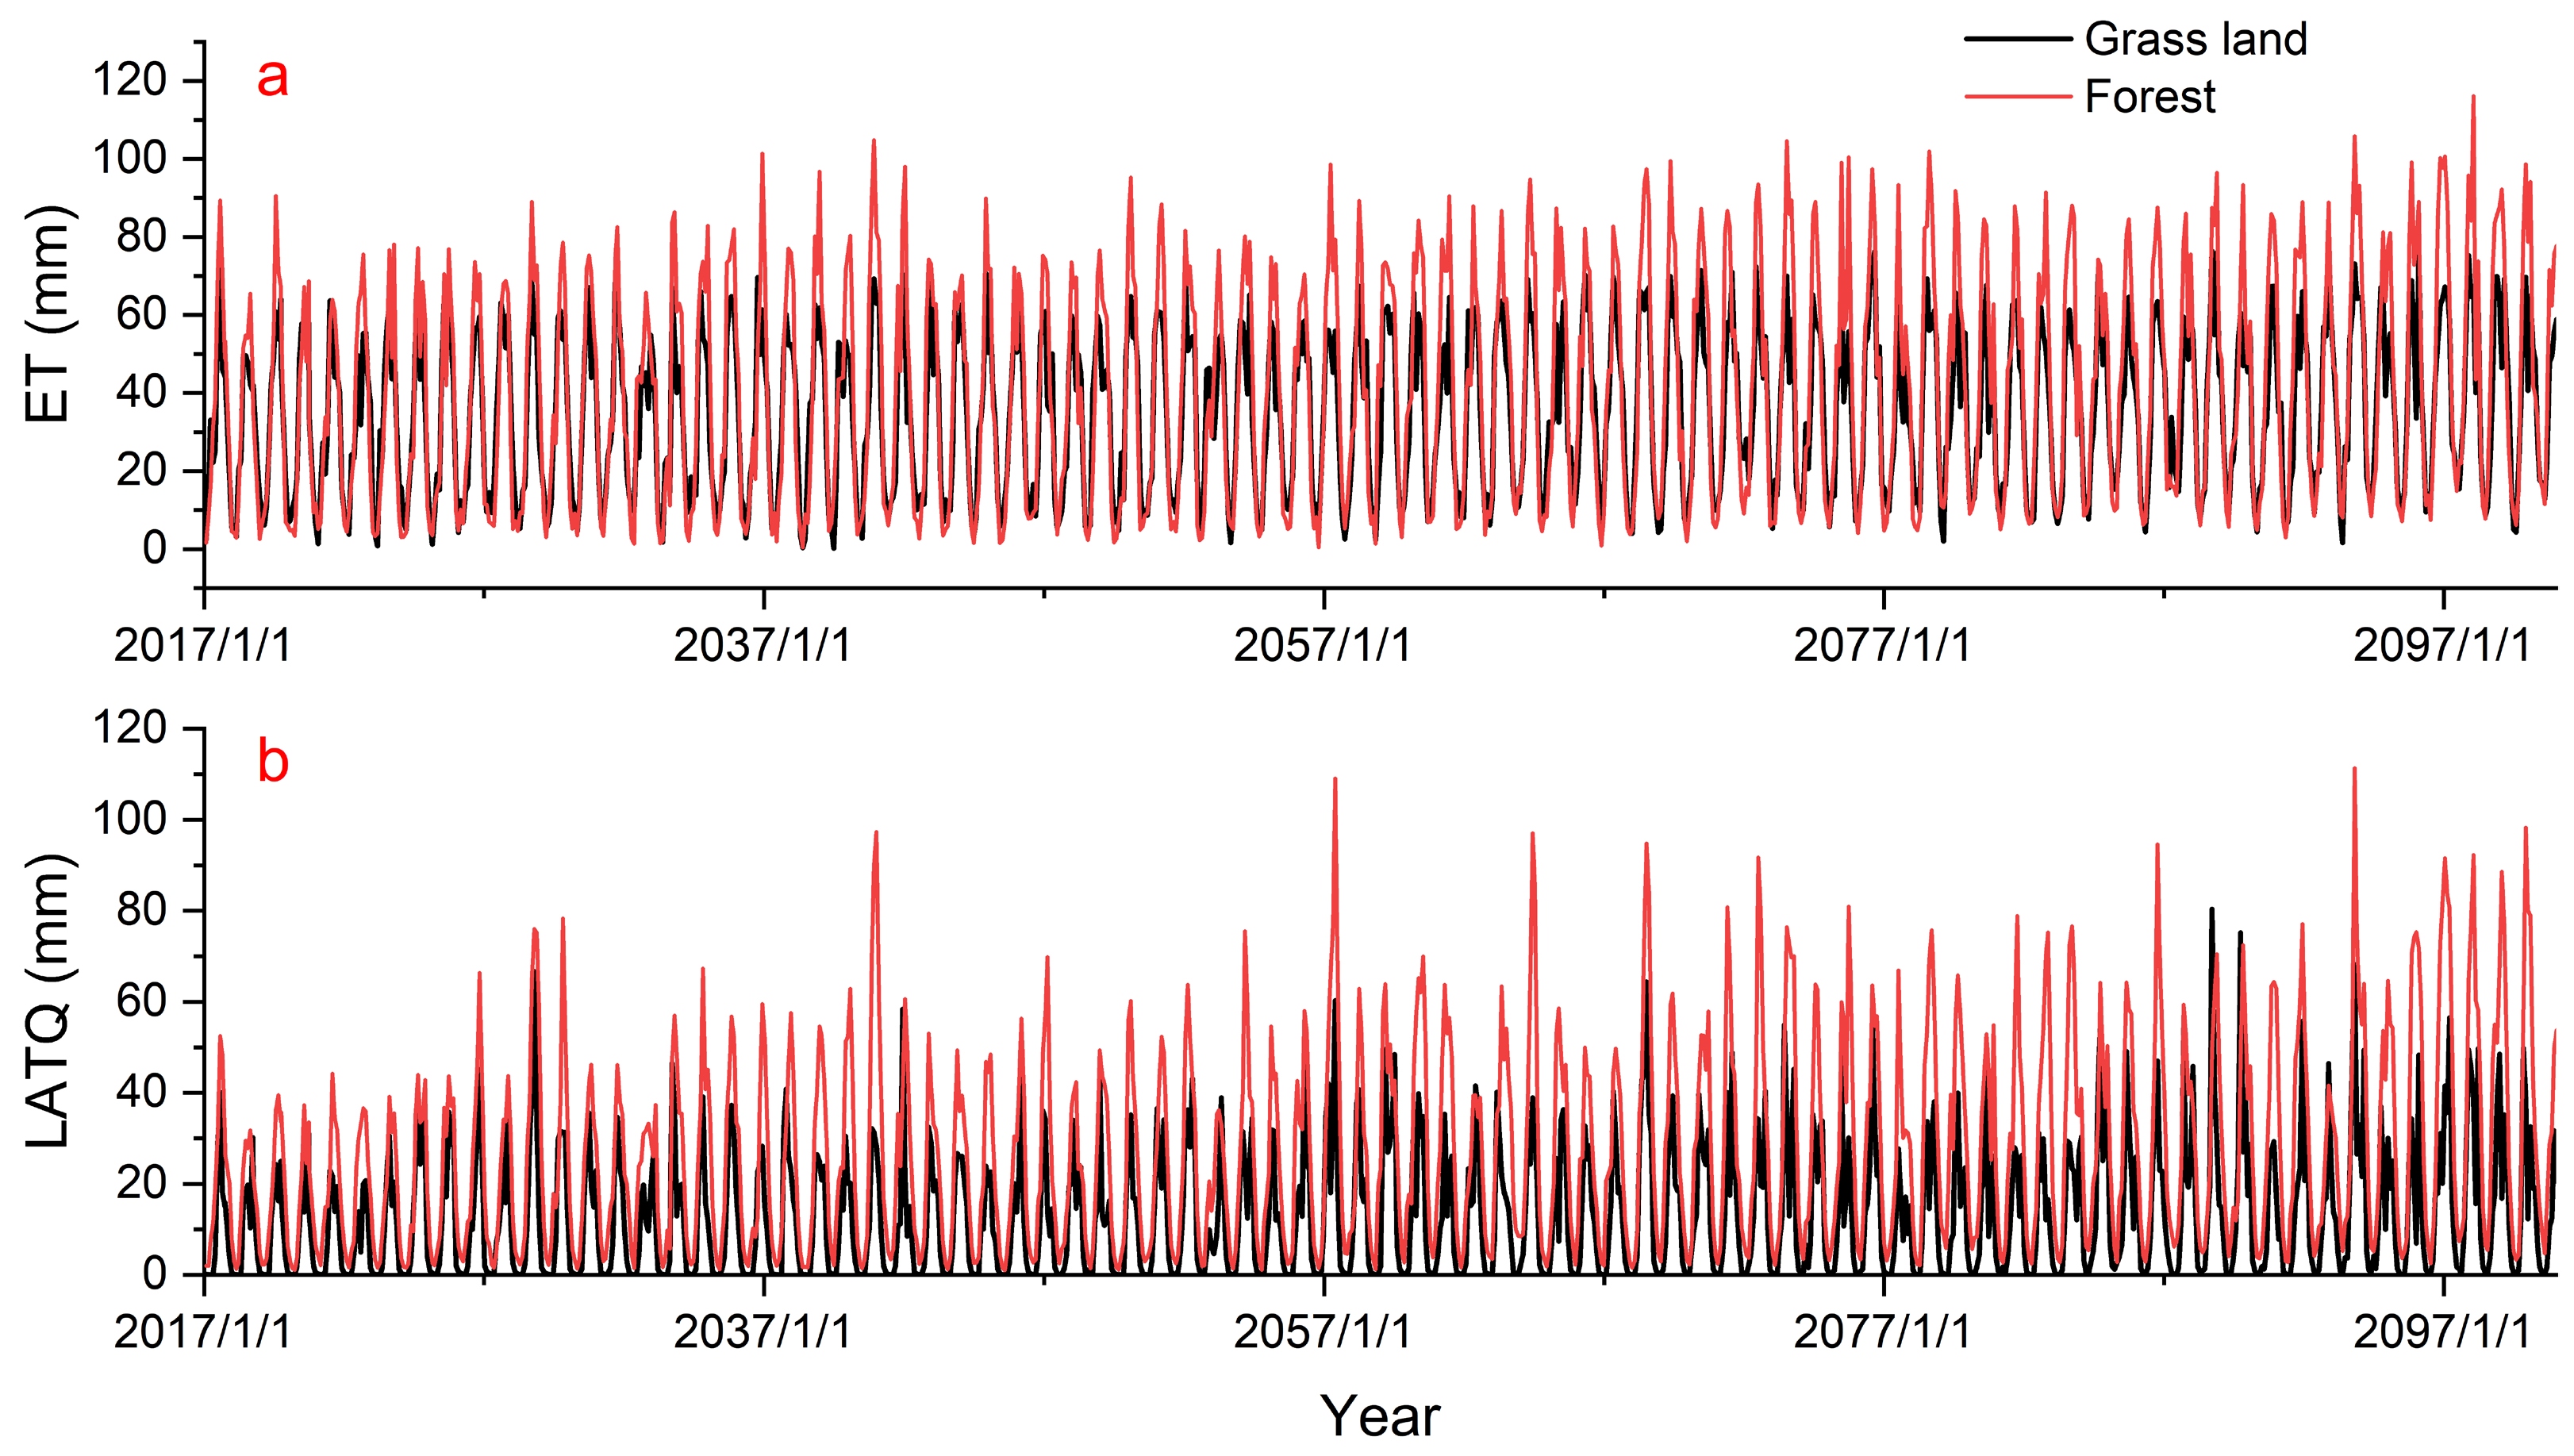
By extracting and comparing key hydrological components of representative forest- and grassland-dominated sub-basins under the SSP5-8.5 scenario (Figure 11), this study reveals that the downstream canyon regions of the Dadu and Yalong River basins are characterized by pronounced lateral drainage and elevated evapotranspiration. During the wet season, both surface runoff and deep groundwater recharge in forest-dominated sub-basins remain negligible, indicating that forest cover substantially enhances rainfall infiltration. However, due to steep slopes and shallow soil profiles, infiltrated water is unable to be retained as long-term deep baseflow, instead, it is rapidly exported as subsurface lateral flow (LATQ). As shown in Figure 11b, lateral flow in forested sub-basins increases sharply during the rainy season, with peak values markedly higher than those in grassland sub-basins. This finding indicates that under steep terrain, strong external climatic forcing overwhelms the buffering effects of forest canopy interception and soil infiltration, converting intense rainfall into rapid lateral flow pulses and thereby amplifying flood peaks. During the growing season and dry season, monthly mean evapotranspiration (ET) in forest-dominated sub-basins is significantly higher than that in grassland-dominated sub-basins (Figure 11a). Under high radiative forcing scenarios such as SSP5-8.5, pronounced warming substantially enhances evapotranspiration from forest ecosystems during non-rainy periods, further reducing dry-season baseflow [49].
Overall, the high hydrological variability of downstream forest-dominated sub-basins is not solely controlled by monsoon precipitation, but results from the combined effects of rapid lateral drainage induced by intense rainfall and enhanced evapotranspiration during non-rainy periods. This coupled feedback mechanism, characterized by increased runoff generation in the wet season and intensified water loss in the dry season, amplifies the seasonal amplitude of streamflow and explains the higher hydrological sensitivity observed in forested areas. Under specific topographic and climatic conditions, the water-regulating function of vegetation is strongly constrained, leading to hydrological responses that differ markedly from those of low-relief catchments. This result does not negate the generally recognized buffering role of forests, but rather emphasizes that in steep mountainous catchments, hydrological-climatic gradients outweigh local land-cover effects and exert dominant control.

5.2. Synergistic Flow-Stabilizing Effects of Source Areas and Alpine Vegetation

In contrast to downstream areas, the low seasonal streamflow intensity observed in the upstream source regions confirms the unique flow-stabilizing mechanisms of the “water tower” core areas, arising from the synergistic interaction between the highland permafrost and alpine meadow ecosystems. Although future climate scenarios project increased precipitation variability, the widespread seasonal permafrost and active layer of the permafrost in the source regions act as extensive groundwater reservoirs [50]. During the melt season, phase change processes within the permafrost delay water release, converting pulsed precipitation and snowmelt into relatively stable baseflow contributions [51]. In alpine meadow-covered areas, dense root networks and soil properties further enhance water retention capacity, suppressing rapid streamflow generation.
Hydrological processes in the source regions are strongly regulated by thermal factors, with glaciers and snowmelt exhibiting pronounced lagged and smoothed responses to temperature changes. This thermal buffering mechanism counteracts stochastic fluctuations in precipitation at the temporal scale [49]. Even under extreme warming scenarios, this composite “permafrost-snow-vegetation” buffer layer maintains strong robustness, effectively dampening high-frequency climatic noise and preserving the relative uniformity of streamflow output from the source regions.

5.3. Nonstationary Runoff Shifts and Nonlinear Amplification of Extreme Hydrological Risks

Wavelet-based time-frequency coherence analysis and abrupt change detection indicate structural shifts in basin hydrological processes around the mid-21st century. The clustered runoff change points during the 2040s–2050s may reflect a nonlinear response of the regional water cycle to global warming thresholds. As accumulated thermal forcing increases, the basin may cross critical thresholds, triggering a regime shift in the baseline precipitation-runoff relationship. This nonstationary evolution is particularly pronounced in extreme event characteristics [1]. Under the high-emission SSP5-8.5 scenario, the doubling of extreme high-flow event intensity and the substantial elevation of thresholds suggest that future flood risks may deviate from historical statistical patterns, exhibiting an increased likelihood of exceptionally severe floods [52]. Considering the high runoff sensitivity of downstream forested areas, extreme monsoon precipitation combined with topographically accelerated flow can readily generate catastrophic basin-scale floods. Furthermore, although the frequency of extreme low-flow events may decline due to increased total precipitation, their clustered occurrence indicates that the duration of prolonged droughts is not reduced, implying that rapid transitions between drought and flood conditions will become a norm for future water resource management. Existing reservoir operation rules and flood control designs based on stationarity assumptions may therefore face substantial risks of failure under future hydrological scenarios. Accordingly, future adaptive management strategies must fully account for the spatially structured and temporally nonlinear shift characteristics, reinforcing infrastructure resilience downstream while strictly maintaining ecological buffering functions in the upstream source areas [53].

6. Conclusions

This study employs a multidimensional approach integrating time-frequency analysis, spatial assessment, and extreme value evaluation to investigate the hydrological response mechanisms and evolving risk characteristics of the Yalong and Dadu River basins under future climate scenarios. The main conclusions are as follows:
Streamflow exhibits strong dependence on precipitation forcing and rapid response characteristics. Under future climate change, streamflow and precipitation maintain high interannual coherence (AWC = 0.90) and in-phase variation, with a lag time of less than one month. This indicates that the steep basin topography and monsoon-dominated climate drive rapid streamflow generation, leaving little long-term hydrological memory, and that rising temperatures do not alter the fundamental coincident rainfall-streamflow regime.
Seasonal streamflow variability is constrained by the combined effects of topography, climate, and land surface patterns, resulting in structurally stable spatial differentiation. Upstream source regions maintain relatively strong hydrological stability (low sensitivity) under different emission scenarios due to the buffering effects of permafrost and snow. In contrast, downstream forested sub-basins, located within monsoon precipitation centers and subject to enhanced future evapotranspiration, exhibit high streamflow sensitivity. The observed positive correlation between forest cover and streamflow variability confirms the dominant role of macro-scale hydrological–climatic gradients in regulating local vegetation effects.
Significant abrupt changes in basin hydrological processes are detected in the mid-21st century (2040s–2050s), indicating a shift from historical baseline streamflow to a higher-variability regime. With increasing radiative forcing (SSP5-8.5), the thresholds and intensity of extreme high-flow events are nonlinearly elevated, while long-duration drought risks persist, highlighting the dual challenges of intensified flood and drought hazards under future climates.

Supplementary Materials

The following supporting information can be downloaded at: https://www.mdpi.com/article/10.3390/w18070816/s1, Figure S1: Model calibration and validation results; Figure S2: Spearman correlation analysis between seasonal runoff intensity and different land-use types under the SSP1-2.6 scenario; Figure S3: Spearman correlation analysis between different land use types and seasonal runoff intensity under the SSP2-4.5 scenario; Figure S4: Spearman correlation analysis between different land use types and seasonal runoff intensity under the SSP3-7.0 scenario; Figure S5: Spearman correlation analysis between different land use types and seasonal runoff intensity under the SSP5-8.5 scenario; Figure S6: Identification of extreme hydrological events in the Yalong River source area under the SSP2-4.5 scenario; Figure S7: Identification of extreme hydrological events in the Yalong River source area under the SSP3-7.0 scenario; Figure S8: Identification of extreme hydrological events in the Yalong River source area under the SSP5-8.5 scenario; Figure S9: Identification of extreme hydrological events in the Dadu River source area under the SSP2-4.5 scenario; Figure S10: Identification of extreme hydrological events in the Dadu River source area under the SSP3-7.0 scenario; Figure S11: Identification of extreme hydrological events in the Dadu River source area under the SSP5-8.5 scenario; Table S1: SWAT model calibration parameters and final values.

Author Contributions

Conceptualization, K.G. and Y.A.; methodology, K.G.; software, K.G.; validation, K.G., Y.A. and Y.L.; formal analysis, K.G.; investigation, K.G.; resources, K.G.; data curation, K.G.; writing—original draft preparation, K.G.; writing—review and editing, K.G., Y.A. and Y.L.; visualization, K.G.; supervision Y.A. and Y.L.; project administration, Y.A.; funding acquisition, Y.A. All authors have read and agreed to the published version of the manuscript.

Funding

This research was funded by the National Key Research and Development Program of China, grant number 2022YFC3202402.

Data Availability Statement

The data presented in this study are contained within the article. The data presented in this study are also available on request from the corresponding author.

Conflicts of Interest

The authors declare no conflicts of interest.

References

  1. Arias, P.; Bellouin, N.; Coppola, E.; Jones, C.; Krinner, G.; Marotzke, J.; Naik, V.; Plattner, G.-K.; Rojas, M.; Sillmann, J.; et al. Climate Change 2021: The Physical Science Basis; Contribution of Working Group I to the Sixth Assessment Report of the Intergovernmental Panel on Climate Change; Technical Summary; Intergovernmental Panel on Climate Change: Geneva, Switzerland, 2021. [Google Scholar]
  2. Immerzeel, W.W.; Lutz, A.F.; Andrade, M.; Bahl, A.; Biemans, H.; Bolch, T.; Hyde, S.; Brumby, S.; Davies, B.J.; Elmore, A.C.; et al. Importance and vulnerability of the world’s water towers. Nature 2020, 577, 364–369. [Google Scholar] [CrossRef]
  3. Yao, T.; Xue, Y.; Chen, D.; Chen, F.; Thompson, L.; Cui, P.; Koike, T.; Lau, W.K.M.; Lettenmaier, D.; Mosbrugger, V.; et al. Recent Third Pole’s Rapid Warming Accompanies Cryospheric Melt and Water Cycle Intensification and Interactions between Monsoon and Environment: Multidisciplinary Approach with Observations, Modeling, and Analysis. Bull. Am. Meteorol. Soc. 2019, 100, 423–444. [Google Scholar] [CrossRef]
  4. Lai, Y.; Zhang, B.; Yao, Y. Investigating the historic drought in the Yangtze River Basin in 2022–2023 by jointly using GRACE, land surface models, and drought index. J. Hydrol. Reg. Stud. 2025, 58, 102286. [Google Scholar] [CrossRef]
  5. Ma, M.; Qu, Y.; Lyu, J.; Zhang, X.; Su, Z.; Gao, H.; Yang, X.; Chen, X.; Jiang, T.; Zhang, J.; et al. The 2022 extreme drought in the Yangtze River Basin: Characteristics, causes and response strategies. River 2022, 1, 162–171. [Google Scholar] [CrossRef]
  6. Yang, S.; Sun, H.; Zhao, R.; Xing, L.; Tan, Z.; Ning, Y.; Li, M. Was the 2022 drought in the Yangtze River Basin, China more severe than other typical drought events by considering the natural characteristics and the actual impacts? Theor. Appl. Climatol. 2024, 155, 5543–5556. [Google Scholar] [CrossRef]
  7. Han, Q.; Qi, T.; Khanaum, M.M. Evaluation of the offsets of artificial recharge on the extra run-off induced by urbanization and extreme storms based on an enhanced semi-distributed hydrologic model with an infiltration basin module. Water 2024, 16, 1032. [Google Scholar] [CrossRef]
  8. Lutz, A.F.; Immerzeel, W.W.; Shrestha, A.B.; Bierkens, M.F.P. Consistent increase in High Asia’s runoff due to increasing glacier melt and precipitation. Nat. Clim. Change 2014, 4, 587–592. [Google Scholar] [CrossRef]
  9. Xu, H.; Zhou, B.; Song, Y. Impacts of climate change on headstream runoff in the Tarim River Basin. Hydrol. Res. 2011, 42, 20–29. [Google Scholar] [CrossRef]
  10. Wang, F.; Ma, Y.; Darvishzadeh, R.; Han, C. Annual and seasonal trends of vegetation responses and feedback to temperature on the Tibetan Plateau since the 1980s. Remote Sens. 2023, 15, 2475. [Google Scholar] [CrossRef]
  11. Labat, D. Recent advances in wavelet analyses: Part 1. A review of concepts. J. Hydrol. 2005, 314, 275–288. [Google Scholar] [CrossRef]
  12. Avesani, D.; Nan, Y.; Tian, F. Reducing hydrological uncertainty in large mountainous basins: The role of isotope, snow cover, and glacier dynamics in capturing streamflow seasonality. Hydrol. Earth Syst. Sci. 2025, 29, 5755–5775. [Google Scholar] [CrossRef]
  13. Sang, Y.; Wang, Z.; Liu, C. Applications of wavelet analysis to hydrology: Status and prospects. Prog. Geogr. 2013, 32, 1413–1422. [Google Scholar] [CrossRef]
  14. Wu, N.; Zhang, K.; Naghibi, A.; Hashemi, H.; Ning, Z.; Jarsjö, J. Altitudinal variation in impacts of snow cover, reservoirs and precipitation seasonality on monthly runoff in Tibetan Plateau catchments. Hydrol. Earth Syst. Sci. Discuss. 2025, 29, 5913–5930. [Google Scholar] [CrossRef]
  15. Abebe, S.A.; Qin, T.; Zhang, X.; Yan, D. Wavelet transform-based trend analysis of streamflow and precipitation in Upper Blue Nile River basin. J. Hydrol. Reg. Stud. 2022, 44, 101251. [Google Scholar] [CrossRef]
  16. Ellison, D.; Morris, C.E.; Locatelli, B.; Sheil, D.; Cohen, J.; Murdiyarso, D.; Gutierrez, V.; Noordwijk, M.v.; Creed, I.F.; Pokorny, J.; et al. Trees, forests and water: Cool insights for a hot world. Glob. Environ. Change 2017, 43, 51–61. [Google Scholar] [CrossRef]
  17. Lenton, T.M.; Rockström, J.; Gaffney, O.; Rahmstorf, S.; Richardson, K.; Steffen, W.; Schellnhuber, H.J. Climate tipping points—Too risky to bet against. Nature 2019, 575, 592–595. [Google Scholar] [CrossRef]
  18. Zhu, H.; Jiang, Z.; Li, L. Projection of climate extremes in China, an incremental exercise from CMIP5 to CMIP6. Sci. Bull. 2021, 66, 2528–2537. [Google Scholar] [CrossRef]
  19. Wang, C.; Chen, M.; Zhang, L.-L.; Li, J.; An, R.-D.; Li, Y. Analysis of Meteorological Conditions at the Water Source Area of the South-to-North Water Diversion West Route Project. Yellow River 2025, 47, 42–45+73. (In Chinese) [Google Scholar] [CrossRef]
  20. Wen, Y.; Kang, L.; Zhou, L.; Liao, W.; Guo, X. Comprehensive evaluation of the response relationship between meteorological drought and hydrological drought in the Yalong River Basin, China. Geomat. Nat. Hazards Risk 2024, 15, 2373114. [Google Scholar] [CrossRef]
  21. Yuan, R.; Fan, Z.; Cai, Y.; Shen, J.; Lan, Y. Study on the Impact of Human Activities on Water Resources Assessment Process in the Yalong River Basin. In Proceedings of the 3rd International Conference on Green Building, Civil Engineering and Smart City (GBCESC 2024); Atlantis Press: Dordrecht, The Netherlands, 2025; pp. 707–718. [Google Scholar]
  22. Yu, L.; Zhang, L.; Luo, S.; Wu, X.; Wu, S. Optimizing the operation of interconnected cascade hydropower plants along themiddle and lower stretches of the Yalong River to meet varying ecological flow demands. Hydro-Sci. Eng. 2024, 68–76. (In Chinese) [Google Scholar] [CrossRef]
  23. Arnold, J.G.; Allen, P.M. Estimating hydrologic budgets for three Illinois watersheds. J. Hydrol. 1996, 176, 57–77. [Google Scholar] [CrossRef]
  24. Tan, M.L.; Gassman, P.W.; Yang, X.; Haywood, J. A review of SWAT applications, performance and future needs for simulation of hydro-climatic extremes. Adv. Water Resour. 2020, 143, 103662. [Google Scholar] [CrossRef]
  25. Neitsch, S.L.; Arnold, J.G.; Kiniry, J.R.; Williams, J.R. Soil and Water Assessment Tool Theoretical Documentation Version 2009; Texas Water Resources Institute: College Station, TX, USA, 2011. [Google Scholar]
  26. Santhi, C.; Arnold, J.G.; Williams, J.R.; Dugas, W.A.; Srinivasan, R.; Hauck, L.M. Validation of the SWAT model on a large rwer basin with point and nonpoint sources. JAWRA J. Am. Water Resour. Assoc. 2001, 37, 1169–1188. [Google Scholar] [CrossRef]
  27. El Harraki, W.; Zemzami, M. Assessing climate change’s impacts on hydrology using the SWAT model: A literature review. J. Water Clim. Change 2025, 16, 1979–2005. [Google Scholar] [CrossRef]
  28. Zhao, J.; Zhang, N.; Liu, Z.; Zhang, Q.; Shang, C. SWAT model applications: From hydrological processes to ecosystem services. Sci. Total Environ. 2024, 931, 172605. [Google Scholar] [CrossRef]
  29. Abbaspour, K.C.; Johnson, C.; Van Genuchten, M.T. Estimating uncertain flow and transport parameters using a sequential uncertainty fitting procedure. Vadose Zone J. 2004, 3, 1340–1352. [Google Scholar] [CrossRef]
  30. Tuo, Y.; Duan, Z.; Disse, M.; Chiogna, G. Evaluation of precipitation input for SWAT modeling in Alpine catchment: A case study in the Adige river basin (Italy). Sci. Total Environ. 2016, 573, 66–82. [Google Scholar] [CrossRef]
  31. Chen, S.; Huang, J.; Huang, J.-C. Improving daily streamflow simulations for data-scarce watersheds using the coupled SWAT-LSTM approach. J. Hydrol. 2023, 622, 129734. [Google Scholar] [CrossRef]
  32. Wang, C.; Li, J.; Chen, M.; Zhang, L.-l.; Ma, X.; Li, Y.; An, R.-d. Simulation and Assessment of Future Meteorological Conditions in the Water Source Area of the WestSouth-North Water Diversion Project under the CMIP6 Model. Adv. Eng. Sci. 2025, 1–13. Available online: https://link.cnki.net/urlid/51.1773.tb.20250616.1404.002 (accessed on 25 March 2026). (In Chinese)
  33. Mahdian, M.; Hosseinzadeh, M.; Siadatmousavi, S.M.; Chalipa, Z.; Delavar, M.; Guo, M.; Abolfathi, S.; Noori, R. Modelling impacts of climate change and anthropogenic activities on inflows and sediment loads of wetlands: Case study of the Anzali wetland. Sci. Rep. 2023, 13, 5399. [Google Scholar] [CrossRef] [PubMed]
  34. Cannon, A.J.; Sobie, S.R.; Murdock, T.Q. Bias Correction of GCM Precipitation by Quantile Mapping: How Well Do Methods Preserve Changes in Quantiles and Extremes? J. Clim. 2015, 28, 6938–6959. [Google Scholar] [CrossRef]
  35. Pettitt, A.N. A non-parametric approach to the change-point problem. J. R. Stat. Soc. Ser. C (Appl. Stat.) 1979, 28, 126–135. [Google Scholar] [CrossRef]
  36. Buishand, T.A. Tests for detecting a shift in the mean of hydrological time series. J. Hydrol. 1984, 73, 51–69. [Google Scholar] [CrossRef]
  37. Cammalleri, C.; Toreti, A. A Generalized Density-Based Algorithm for the Spatiotemporal Tracking of Drought Events. J. Hydrometeorol. 2023, 24, 537–548. [Google Scholar] [CrossRef]
  38. Jaiswal, R.K.; Lohani, A.K.; Tiwari, H.L. Statistical Analysis for Change Detection and Trend Assessment in Climatological Parameters. Environ. Process. 2015, 2, 729–749. [Google Scholar] [CrossRef]
  39. Adamowski, K.; Prokoph, A.; Adamowski, J. Development of a new method of wavelet aided trend detection and estimation. Hydrol. Process. 2009, 23, 2686–2696. [Google Scholar] [CrossRef]
  40. Partal, T.; Kişi, Ö. Wavelet and neuro-fuzzy conjunction model for precipitation forecasting. J. Hydrol. 2007, 342, 199–212. [Google Scholar] [CrossRef]
  41. Sharma, A.; Goyal, M.K. Assessment of drought trend and variability in India using wavelet transform. Hydrol. Sci. J. 2020, 65, 1539–1554. [Google Scholar] [CrossRef]
  42. Yaşa, İ.; Partal, T. Drought trend and variability based wavelet transform in Euphrates-Tigris Basin, Türkiye. Atmos. Res. 2024, 302, 107291. [Google Scholar] [CrossRef]
  43. Mallat, S. A Wavelet Tour of Signal Processing; Academic Press: Cambridge, MA, USA, 1999. [Google Scholar]
  44. Oh, Y.-Y.; Yun, S.-T.; Yu, S.; Hamm, S.-Y. The combined use of dynamic factor analysis and wavelet analysis to evaluate latent factors controlling complex groundwater level fluctuations in a riverside alluvial aquifer. J. Hydrol. 2017, 555, 938–955. [Google Scholar] [CrossRef]
  45. Torrence, C.; Compo, G.P. A Practical Guide to Wavelet Analysis. Bull. Am. Meteorol. Soc. 1998, 79, 61–78. [Google Scholar] [CrossRef]
  46. Grinsted, A.; Moore, J.C.; Jevrejeva, S. Application of the cross wavelet transform and wavelet coherence to geophysical time series. Nonlin. Process. Geophys. 2004, 11, 561–566. [Google Scholar] [CrossRef]
  47. Fan, D.; Zeng, S.-d.; Liu, X.; Yang, L.-h.; Xia, J. Impacts of climate change on hydrological processes in water source areas of the planning western route of South-to-North Water Diversion Project based on CMIP6. J. Chang. River Sci. Res. Inst. 2024, 41, 194. (In Chinese) [Google Scholar] [CrossRef]
  48. François, M.; de Aguiar, T.R.; Mielke, M.S.; Rousseau, A.N.; Faria, D.; Mariano-Neto, E. Interactions Between Forest Cover and Watershed Hydrology: A Conceptual Meta-Analysis. Water 2024, 16, 3350. [Google Scholar] [CrossRef]
  49. Guo, L.; Wang, G.; Song, C.; Sun, S.; Li, J.; Li, K.; Huang, P.; Ma, J. Hydrological Changes Caused by Integrated Warming, Wetting, and Greening in Permafrost Regions of the Qinghai-Tibetan Plateau. Water Resour. Res. 2025, 61, e2024WR038465. [Google Scholar] [CrossRef]
  50. Gao, H.; Wang, J.; Yang, Y.; Pan, X.; Ding, Y.; Duan, Z. Permafrost Hydrology of the Qinghai-Tibet Plateau: A Review of Processes and Modeling. Front. Earth Sci. 2021, 8, 576838. [Google Scholar] [CrossRef]
  51. Ding, G.; Qin, J.; Zhang, S.; Yang, B.; Cui, J.; Wang, F.; Yang, J. Integrating surface-active layer-permafrost hydrological processes: A systematic review and research framework. EGUsphere 2025, 2025, 1–43. [Google Scholar] [CrossRef]
  52. Pal, L.; Saksena, S.; Dey, S.; Merwade, V.; Ojha, C.S.P. An Integrative Framework for Assessment of Urban Flood Response to Changing Climate. Water Resour. Res. 2023, 59, e2023WR034466. [Google Scholar] [CrossRef]
  53. Soltaninia, S.; Eskandaripour, M. Trivariate flood frequency analysis using copula functions: Assessing non-stationary hydrological risks under climate change. J. Water Clim. Change 2025, 16, 3130–3156. [Google Scholar] [CrossRef]
Figure 1. Geographic location and topography of the Yalong River and Dadu River basins in the upper Yangtze River, with elevation represented by a Digital Elevation Model (DEM), and showing river networks, elevation differences, and the distribution of meteorological and river stage gauging stations.
Water 18 00816 g001
Figure 2. Simulated streamflow in the Yalong and Dadu River source regions, where (a) represents the Yalong River and (b) represents the Dadu River.
Water 18 00816 g002
Figure 3. Wavelet coherence between precipitation and streamflow. The first column represents the Dadu River Basin and the second column represents the Yalong River Basin.
Water 18 00816 g003
Figure 4. Wavelet coherence between temperature and streamflow. The first column represents the Dadu River Basin and the second column represents the Yalong River Basin.
Water 18 00816 g004
Figure 5. Land use types in the study area.
Water 18 00816 g005
Figure 6. Wavelet spatial analysis for sub-basins in the Dadu and Yalong River basins.
Water 18 00816 g006
Figure 7. Comparison of extreme hydrological event characteristics in the Yalong River basin: (a) number, (b) mean intensity, and (c) mean duration of high- and low-flow events under different scenarios. Red and green denote high- and low-flow periods, respectively.
Water 18 00816 g007
Figure 8. Comparison of extreme hydrological event characteristics in the Dadu River basin: (a) number, (b) mean intensity, and (c) mean duration of high- and low-flow events under different scenarios. Red and green denote high- and low-flow periods, respectively.
Water 18 00816 g008
Figure 9. Identification of extreme hydrological events in the Yalong River source area under the SSP1-2.6 scenario.
Water 18 00816 g009
Figure 10. Identification of extreme hydrological events in the Dadu River source area under the SSP1-2.6 scenario.
Water 18 00816 g010
Figure 11. Comparison of hydrological components between grassland- and forest-dominated sub-basins under the SSP5-8.5 scenario: (a) evapotranspiration, (b) lateral flow.
Water 18 00816 g011
Table 1. Data sources, temporal coverage, and spatial resolution.
Date TypeTime PeriodSpatial/Temporal ResolutionData Source
Digital elevation model200930 m × 30 mGeospatial Data Cloud
Land use/land cover date202030 m × 30 mGlobeLand30
Soil data-1 km × 1 kmWorld Soil Database
Meteorological data1999–2021DailyHydrological Yearbook, China Meteorological Administration (https://data.cma.cn/)
River network vector data-0.1 m91 Weitu (https://www.91weitu.com/)
Discharge data2006–2019DailyHydrological Yearbook
Table 2. Results of SWAT model calibration and validation.
Hydrological StationCalibration PeriodValidation Period
R2NSER2NSE
Zumuzu0.820.810.840.84
Maerkang0.780.530.830.73
Chuosijia0.900.850.940.93
Dajin0.880.820.910.89
Zhuba0.870.850.820.79
Ganzi0.850.830.880.78
Daofu0.890.790.890.72
Yajiang0.900.760.920.85
Table 3. Proportion of Land Use Types in the Study Area.
Land Use TypeArea Proportion (%)
Cropland0.6
Forest19.8
Grassland76.4
Wetland0.2
Water Bodies0.3
Artificial Surfaces0.1
Bare Land2.4
Glacier0.2
Disclaimer/Publisher’s Note: The statements, opinions and data contained in all publications are solely those of the individual author(s) and contributor(s) and not of MDPI and/or the editor(s). MDPI and/or the editor(s) disclaim responsibility for any injury to people or property resulting from any ideas, methods, instructions or products referred to in the content.